 Tim Lübeck
 Sebastià V. Amengual Garí1
 Paul Calamia
 Jeffery Crukley
 Zamir Ben-Hur
- 1Reality Labs Research, Meta, Redmond, WA, United States
- 2Data Science and Statistics, Toronto, ON, Canada
- 3Faculty of Medicine, Department of Speech-Language Pathology, University of Toronto, Toronto, ON, Canada
Microphone arrays consisting of sensors mounted on the surface of a rigid, spherical scatterer are popular tools for the capture and binaural reproduction of spatial sound scenes. However, microphone arrays with a perfectly spherical body and uniformly distributed microphones are often impractical for the consumer sector, in which microphone arrays are generally mounted on mobile and wearable devices of arbitrary geometries. Therefore, the binaural reproduction of sound fields captured with arbitrarily shaped microphone arrays has become an important field of research. In this work, we present a comparison of methods for the binaural reproduction of sound fields captured with non-spherical microphone arrays. First, we evaluated equatorial microphone arrays (EMAs), where the microphones are distributed on an equatorial contour of a rigid, spherical 1. Second, we evaluated a microphone array with six microphones mounted on a pair of glasses. Using these two arrays, we conducted two listening experiments comparing four rendering methods based on acoustic scenes captured in different rooms2. The evaluation includes a microphone-based stereo approach (sAB stereo), a beamforming-based stereo approach (sXY stereo), beamforming-based binaural reproduction (BFBR), and BFBR with binaural signal matching (BSM). Additionally, the perceptual evaluation included binaural Ambisonics renderings, which were based on measurements with spherical microphone arrays. In the EMA experiment we included a fourth-order Ambisonics rendering, while in the glasses array experiment we included a second-order Ambisonics rendering. In both listening experiments in which participants compared all approaches with a dummy head recording we applied non-head-tracked binaural synthesis, with sound sources only in the horizontal plane. The perceived differences were rated separately for the attributes timbre and spaciousness. Results suggest that most approaches perform similarly to the Ambisonics rendering. Overall, BSM, and microphone-based stereo were rated the best for EMAs, and BFBR and microphone-based stereo for the glasses array.
1 Introduction
With the growing number of virtual and augmented reality (AR/VR) applications, capture and immersive reproduction of sound scenes has become increasingly popular. Microphone arrays facilitate the spatial capture of a sound field and its subsequent reproduction, either over loudspeakers or binaurally for a single listener over headphones. In binaural reproduction, which is the focus of this work, the use of microphone arrays offers multiple advantages over dummy head recordings. For instance, arbitrary head orientation can be synthesised and individual head-related transfer functions (HRTFs) can easily be integrated, while performing the signal processing in real-time (Helmholz et al., 2019; McCormack and Politis, 2019), making microphone arrays flexible tools. In particular, spherical microphone arrays (SMAs) are favorable array configurations for sound field capture and spatial reproduction. The symmetric spherical body and the uniformly distributed microphones enable encoding the sound field into Ambisonics signals using the spherical harmonics (SH) transform and radial filtering. This process is denoted as SH beamforming. Thereby, the number of microphones determines the highest SH order, and hence, the highest spatial resolution of the encoded sound field. Together with a set of HRTFs, the Ambisonics signals can then be decoded into binaural signals. Ambisonics encoding and (binaural) decoding have been extensively researched in recent years (Avni et al., 2013; Bernschütz, 2016; Zotter and Frank, 2019) and together form a well established spatial-audio format.
So far, microphone arrays with a perfectly spherical body and with a large number of microphones are only available on dedicated hardware, such as the Eigenmike (Meyer and Elko, 2002), Zylia array (Zylia Sp. z o.o., 2022), or several first-order Ambisonics microphones, such as the Ambeo Sennheiser electronic GmbH & Co. KG (2022), or TetraMic Core Sound (2022a). The integration of microphone arrays into existing consumer electronic devices, such as AR glasses, smartphones, or any other wearable devices, could open up an interesting field of AR and VR applications. For example, by mounting several microphones on a pair of glasses, the wearer could capture the sound field from their perspective and then reproduce it spatially. However, implementing microphone arrays with perfectly spherical configurations and with many microphones on consumer devices can be challenging. When using such non-spherical microphone arrays without uniform sampling, encoding the captured sound field into Ambisonics signals using the discrete SH transform may suffer from ill-conditioning problems Rafaely (2008, 2015); Reddy and Hegde (2017). Alternative approaches for the binaural reproduction of non-spherical array configurations are therefore required. Several approaches have been proposed in the literature and are reviewed below.
One approach that is not limited to spherical arrays is beamforming-based binaural reproduction (BFBR) (Duraiswami et al., 2005; O’Donovan et al., 2008), which applies a similar concept to Ambisonics decoding of SMAs. The sound field is decomposed into components impinging from different directions with a set of beamformers. Each component is then convolved with an HRTF from the corresponding direction. The summation of all convolved sound field components yields the binaural signals to which the listener would be exposed at the place of the microphone array. Depending on the array configuration, the beamforming filters can be calculated based on analytically derived or measured array steering vectors, which describe the anechoic array transfer functions from surrounding far-field sound sources to the microphone array. For SMAs, BFBR and Ambisonics can lead to identical results. Ifergan (2020) showed under which conditions BFBR and Ambisonics converge to the same solution and presented a theoretical framework for the design of beamformers for spherical and circular arrays.
Recently, Madmoni et al. (2020) introduced a BFBR method with binaural signal matching (BSM). It extends the BFBR method and directly incorporates the HRTFs into the beamformer coefficients. Applying filter and sum beamforming for each ear, it separately estimates the binaural signals from the array signals directly with a minimum mean square error metric. Rasumow et al. (2011, 2017) introduced a similar approach denoted as the virtual artificial head. Although they developed it for a planar array without a rigid scatterer, it follows the same filter and sum beamformer principle. A comprehensive comparison of different regularization methods for design of these filters is presented by Rasumow et al. (2016). Calamia et al. (2017) also proposed both BFBR and BSM approaches for use with a microphone array distributed over the surface of a helmet.
Ahrens et al. (2021c) introduced a method to analytically derive Ambisonics signals from capture with equatorial microphone arrays (EMAs), which are spherical-rigid bodies with microphones only along the equator. In Ahrens et al. (2021a,b), the authors extended the method for arrays with nearly, rather than perfectly, circular geometries (eXMAs). The basic idea is to bypass the SH transform with a linear combination of the microphone signals, and to pre-calculate frequency-dependent weights. These weights can also be calculated with a set of steering vectors. Hence, this approach can be regarded as a beamformer whose outputs are SH signals. A similar idea was presented in Tourbabin and Rafaely (2015), who introduced a beamformer whose output is first-order Ambisonics signals (SH signals after radial filtering). Although the eXMA approach is a promising method, at the time of this work, eXMA was still in the optimization phase and is thus not further evaluated in this study.
A less complex approach is motion-tracked-binaural reproduction (MTB) (Algazi et al., 2004; Ackermann et al., 2020). The signals of a pair of opposite (antipodal) microphones of an EMA are directly used as so-called pseudobinaural signals. Different head orientations can be synthesized by interpolation between neighbouring microphone signals. Time differences and scattering effects due to the spherical body between the microphones ensure good restoration of interaural level and time differences (ILDs and ITDs) without HRTF processing. However, no pinnae cues can be synthesized, leading to a loss of high frequency spatial details. Moreover, the absence of pinnae cues complicates the localization of elevated sources, and can lead to front-back confusions Algazi et al. (2004). In static (non-head-tracked) binaural synthesis, this approach can be regarded as microphone-based stereo. Another stereo approach is XY stereo. Two microphones with cardioid directivity patterns are placed nearly collocated at 90° to each other. ILDs caused by the directivities create a spatial image on the reproduction side. Since the microphones are collocated, XY stereo does not produce any time differences between both channels, and thus can hardly synthesise ITDs. Employing two beamformers and steering to (ϕ = 45°, θ = 90°) and (ϕ = 315°, θ = 90°) can emulate XY microphony with microphone arrays.1.
All of these approaches have the potential to recreate a spatial image of the captured sound field. This work presents a perceptual comparison of BFBR, BSM, AB stereo, and XY stereo. We conducted two comparative listening experiments with static non-head-tracked binaural synthesis based on the Multiple Stimulus with Hidden Reference and Anchor (MUSHRA) paradigm. BFBR and BSM have mainly been investigated for spherical or circular array configurations (Duraiswami et al., 2005; O’Donovan et al., 2008; Ifergan, 2020; Madmoni et al., 2021). In this work, we are interested in evaluating arbitrary array configurations. Thus, in a first experiment, we evaluated the approaches with capture from EMAs with six and eight microphones. In a second experiment, we evaluated a microphone array with six microphones mounted on a pair of glasses, as an example of a compact consumer array. To compare the performance of the approaches to the established Ambisonics decoding approach, in both experiments, we also included renderings from capture with consumer SMAs: in Experiment 1, fourth-order Ambisonics renderings based on Eigenmike capture (Meyer and Elko, 2002); in Experiment 2, second-order renderings based on OctoMic capture (Core Sound, 2022b).
2 Materials and methods
This section introduces the microphone arrays and the data used for quantitative and perceptual evaluation. Furthermore, it presents an overview of the fundamental theory of the binaural rendering approaches.
2.1 Employed microphone array data
We chose to evaluate the approaches based on two different array configurations, which are introduced in the following sections.
2.1.1 Equatorial microphone array data
In the first step, we examine EMAs. EMAs are the first degradation step from perfectly spherical arrays to arbitrarily shaped arrays. They are easily reproducible array configurations that were evaluated in comparable studies such as Madmoni et al. (2021) or Ahrens et al. (2021c) and therefore well suited for a comparison of the approaches. We decide to use EMAs with six and eight microphones to be comparable to the glasses array. The EMA data are based on the spatial impulse response database of Stade et al. (2012), which contains impulse responses for SMAs with 29th-order Lebedev grids in four different rooms with varying reverberation times. SH interpolation at N = 29 affords nearly artifact-free spatial resampling of the data to EMA grids with six and eight microphones, denoted as EMA6 and EMA8 in the following. The exact sampling is depicted in Figure 1. The array steering vectors V(ω) used for calculating the beamforming filters were analytically simulated with the SOFiA toolbox (Bernschütz et al., 2012) for 1730 surrounding source positions on a N = 35 Lebedev grid. For the BFBR, BSM, and Ambisonics rendering we employed Neumann KU100 HRTFs (Bernschütz, 2013).
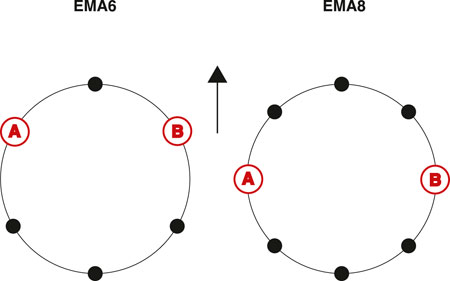
FIGURE 1. Microphone distribution of the EMA with six microphones (left) and eight microphones (right); Both have a center microphone exactly in the front (the direction of the arrow). The microphones used for AB stereo are indicated with “A” and “B”. Only the EMA with eight microphones has microphones at ϕ =90° and ϕ =270°.
2.1.2 Glasses microphone array data
In the second experiment, we evaluated the performance of the approaches with capture from a wearable microphone array. For this we used impulse response measurements from a 6-microphone array mounted on a pair of glasses. During the measurements, the glasses array was mounted on a KEMAR dummy head. Like the EMAs, the array has a center microphone exactly in the front. Two microphones are at the back of the temple arms, one at the right temple arm, and two more on the front frame of the glasses. A rough diagram of the microphone positions on the glasses array is depicted in Figure 2. The steering vectors were measured in anechoic conditions for 1,020 uniformly distributed surrounding sound sources in the same fashion as presented in Donley et al. (2021). Since we only had a binaural reference measured with a KEMAR dummy head for the glasses array data, for the BFBR, BSM, and Ambisonics rendering we employed KEMAR HRTFs (Cuevas-Rodriguez et al., 2019).
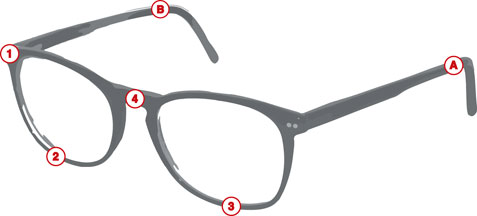
FIGURE 2. A diagram of the glasses array and its approximate microphone positions. The array has one microphone exactly at the front (4), two at the back of the temple arms used for AB stereo, one additional microphone at the right temple arm (1), and two at the front of the glasses frame. This figure and the microphone positions are not a depiction of any current or future product.
2.1.3 Spherical microphone array data
For the comparative Ambisonics renderings in the quantitative and perceptual evaluation, we employed SMA impulse responses measured under the exact same conditions as for the EMAs and glasses array. For comparison with the EMA renderings, we decided to render capture from an Eigenmike at the fourth order. Since the employed database only includes 29th order SMA measurements, we again applied resampling in the SH domain at N = 29 to the 32-microphone Eigenmike sampling scheme. It should be mentioned that the resampled signals have the same sampling grid as the original Eigenmike measurements. However, the radius of the original SMA (0.0875 m) cannot be adjusted to that of the Eigenmike (0.042 m), leading to slightly different aliasing effects. For comparison to the glasses array, we rendered 8-channel OctoMic data of the second order.
2.2 Rendering approaches
2.2.1 Beamforming-based binaural reproduction
The general idea of the BFBR approach is to filter and sum each microphone signal
where ω is the angular frequency, M is the number of microphones on the array surface, and z(ω) is the frequency dependent beamformer output for a specific direction. The beamforming filters can be calculated analytically as is typically done for spherical beamforming (Duraiswami et al., 2005; O’Donovan et al., 2008; Song et al., 2011), or calculated with measured steering vectors V(ω). In this work, we employed Maximum Directivity (MD) beamformers calculated according to (Donley et al., 2021, eq. (1)–(4). MD beamformers maximize the directivity index for the respective direction. Steering multiple beams to uniformly distributed directions into the sound field, convolving each with an HRTF for the corresponding direction, and summing up, yields the binaural signals b(ω)l,r. Several design parameters influence the performance of BFBR. For spherical and cylindrical arrays, Ifergan (2020) presented a framework for BFBR design. A crucial design parameter is the number of beams, which was further investigated in Ifergan and Rafaely (2022). A large number of beams leads to an overlap and thus to a spatial low-pass characteristic. Too few beams leads to poor spatial resolution and loudness instabilities. This is illustrated in Figure 3, which shows binaural signals calculated with the BFBR method from simulated array signals of a single plane wave impinging on an EMA6 from the frontal direction. The BFBR method was performed with different numbers of beams, which are indicated with different colors. Additionally, the frontal HRTF is depicted as the dashed black line. The figure shows that with increasing the number of beams, the spectral roll-off compared to the frontal HRTF increases. In this work, we used 32 uniformly distributed MD beams for binaural reproduction, as preliminary listening tests demonstrated the best results for our array geometries. The spectral roll-off was equalized with a minimum phase filter, which compensates for the deviation of the transfer function of a reference microphone from the transfer function of the BFBR output from a single plane wave impinging on the array from the frontal direction.
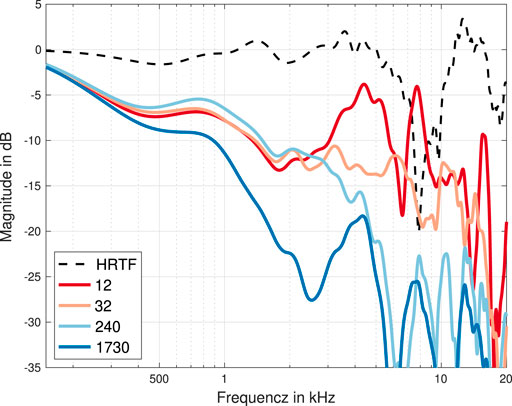
FIGURE 3. Magnitude spectra of frontal binaural signals rendered with BFBR with different numbers of beams, based on a single plane wave impinging on an EMA6 from the frontal direction. Additionally, a frontal HRTF of a KU100 dummy head for the frontal direction is depicted. The BFBR signals were calculated with 12, 32, 240, and 1730 uniformly distributed beams.
2.2.2 Beamforming-based binaural reproduction with matching of binaural signals
Similar to regular BFBR, for BSM the array signals x(ω) are filtered and summed with pre-calculated filters c(ω)l,r
leading to the binaural signals b(ω)l,r. Here, one set of filter coefficients is required for each ear separately. To calculate the BSM filters it is assumed that the sound field consists of L acoustic events (sound sources)
with
The mathematical derivation of this optimization problem is presented in Madmoni et al. (2020, 2021). For higher reproduction accuracy towards higher frequencies, we applied the optimization only with respect to the magnitude, starting at a transition frequency of 1.5 kHz. This already showed significant improvements for Ambisonics decoding (Schörkhuber et al., 2018; Lübeck et al., 2020; Ben-hur et al., 2021). One design parameter for BSM filters is the number of sound sources L (steering vectors) used for the calculation of the filters. Madmoni et al. (2020) showed that a number of L = 240 leads to perceptually good results, which is why we also decided to use a subset of 240 steering vectors. Moreover, the exact positions of the microphones on the array surface are distinctive parameters for BSM. As shown in Madmoni et al. (2021) for static reproduction, it is favourable to use microphone locations close to the positions of the listener’s ears, while for dynamic binaural synthesis, uniform distribution of the microphones along the equator has advantages. In our study, both EMAs have uniformly distributed microphones. However, only the EMA8 has microphones exactly at ϕ = 90° and ϕ = 270°. On the glasses array, the microphones closest to the ears are on the back of the glasses’ temple arms.
2.2.3 Stereo approaches
For the AB stereo approach, we directly used the impulse responses of the AB microphones without any processing or equalization. The AB microphones on the EMAs are depicted in Figure 1. Again, it is worth mentioning that the EMA8 has microphones at ϕ = 90° and ϕ = 270°, while the EMA6 does not. For the glasses array case, we used the microphones on the temple arms of the glasses (labeled A and B in Figure 2).
For XY stereo, we employed two MD beamformers, as used for the BFBR renderings, steering to (ϕ = 45°, θ = 90°) and (ϕ = 315°, θ = 90°). Since the beams originate from the center of the array, the beamforming-based XY stereo also can hardly produce any ITD cues. Similar to AB stereo, we did not apply any post-processing or equalization. We adapted both methods from the stereo recording with microphones. To emphasize that we simulated these techniques with microphone arrays, we refer to them as sAB (simulated AB) and sXY (simulated XY) in the following.
2.2.4 Ambisonics
The comparative Ambisonics renderings were calculated with
where Anm are the Ambisonics signals of the SMA, Hnm are the SH coefficients of the employed HRTF set, and N is the SH rendering order. The Ambisonics signals from the resampled Eigenmike data were calculated by transforming to the SH domain and radial filtering with 30 dB soft-limited radial filters from the SOFiA toolbox (Bernschütz et al., 2011b,a). The Ambisonics signals of the OctoMic data were directly obtained from the VST plugin VVOctoEncode1. For the Ambisonics renderings in the perceptual evaluation, we applied Magnitude Least-Squares (MagLS) optimization to the HRTFs, as proposed by Schörkhuber et al. (2018) and Zotter and Frank (2019).
3 Quantitative evaluation
For quantitative evaluation, we considered single plane waves impinging on the microphone arrays. First, we analyzed the restoration of the interaural cues. Since we applied static binaural synthesis in the perceptual evaluation for ITD and ILD analysis, we did not synthesize binaural signals for different head orientations. The ITD and ILD analysis is based on the single plane wave, impinging on the microphone array from 360 directions in the horizontal plane in steps of 1° (0° < = ϕ < 360°, θ = 90°). For the EMAs and the comparative Eigenmike renderings, we simulated the impinging plane waves, just as with the ATF set. For the glasses and the OctoMic array, we used array impulse responses measured with loudspeakers with a distance of 1.53 m in anechoic conditions with exponential sine sweeps, which fairly approximates plane waves. As the reference, for both array types, we directly used HRTFs for the corresponding directions from the respective database - for the EMAs the KU100 HRTFs (Bernschütz, 2013), for the glasses array, the KEMAR HRTFs (Cuevas-Rodriguez et al., 2019). For each impinging plane wave we applied the BFBR, BSM, sAB, and sXY renderings. Additionally, we synthesized Ambisonics renderings according to Eq. (5). The ITDs were calculated according to Kulkarni et al. (1999) and the ILDs as the ratio between the energies of the left and right ear signals. ILDs are generally highly frequency dependent, and hence, the interpretation of the ILDs must be done with reservation. Figure 4 depicts the ITDs in ms and the ILDs in dB of the EMA6 as functions of the sound incidence directions (x-axis). Additionally, the ILDs and ITDs of the KU100 HRTFs are depicted by the black dashed line as a reference. The ITD curve of the Ambisonics rendering matches the reference curve quite well, followed by the curves for BSM and sAB stereo. sXY stereo produces some notable excursions and seems to perform the worst. This supports the assumption that beamforming-based XY stereo can hardly synthesize ITDs. For the ILDs, sAB stereo matches the reference curve the best, whereas BSM and Ambisonics perform similarily to each other, but with larger underestimates. The ILD curve of sXY stereo exhibits some outliers, specifically near 45° and 315°. Both BFBR and sXY ILD curves are very jagged. This might be due to the beams calculated with few microphones which exhibit side-lobes. In contrast the BSM or Ambisonics ILD curves are quite smooth.
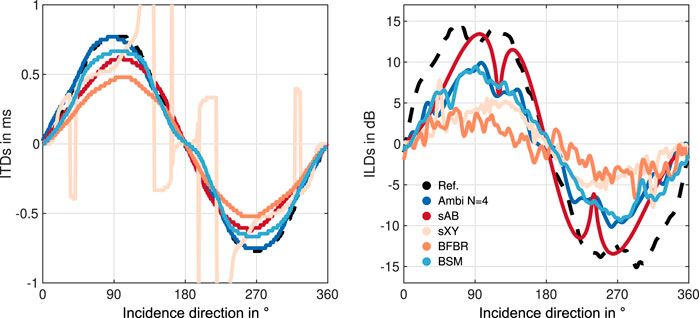
FIGURE 4. ITDs and ILDs of the EMA6 array using different binaural reproduction approaches. The reference values (black dashed lines) were calculated from the KU100 HRTFs.
Figure 5 depicts the ITD and ILD errors with respect to the dummy-head reference. Additionally, it shows the corresponding just notable differences (JNDs) of ITDs and ILDs, which are indicated as the gray shaded area. The JNDs of the ITDs are a function of the reference ITD and were shown to be about 20 μs in the front (Mossop and Culling, 1997), and 100 μs for lateral sound incidence (Mossop and Culling, 1997; Andreopoulou and Katz, 2017). For the ILDs the figure shows a broadband JND of 1 dB according to (Yost and Dye, 1988; Mills, 1960; Blauert, 1996, ch. 2). The figures indicate that BSM and Ambisonics ITDs are mostly below the JND. BFBR and sAB stereo notably exceed the JND at 90° and 270°. The ILD errors of all approaches are clearly above the JND for most directions. Comparing with the ILDs and ITDs of the EMA8 (Figure 6) shows that Ambisonics, BSM, and BFBR perform comparably to the EMA6, for both metrics. The sAB stereo ILD curves of the EMA8 are notably shifted compared to the curve of the EMA6, and match the reference curve quite well. This is due to the different positions of the sAB microphones, and is also supported by Figure 7 depicting the ITD and ILD errors of the EMA8. sXY stereo still performs the worst. sAB and BSM both exhibit a dip at the top of the ILD curve at around 90° and 270°, which can also slightly be seen in the reference curve. Interestingly, for the EMA6 this dip can only be seen in the sAB curve.
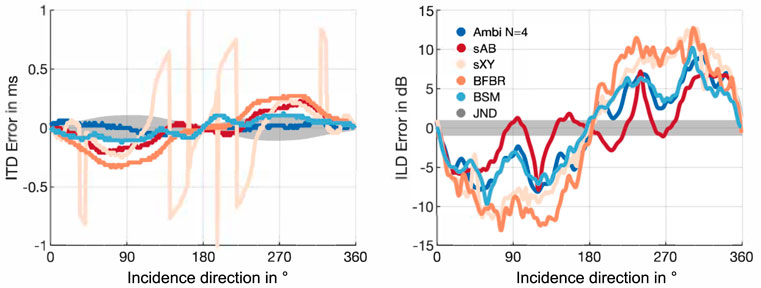
FIGURE 5. ITD and ILD errors of the EMA6 array using different binaural reproduction approaches. The shaded gray areas represent JNDs.
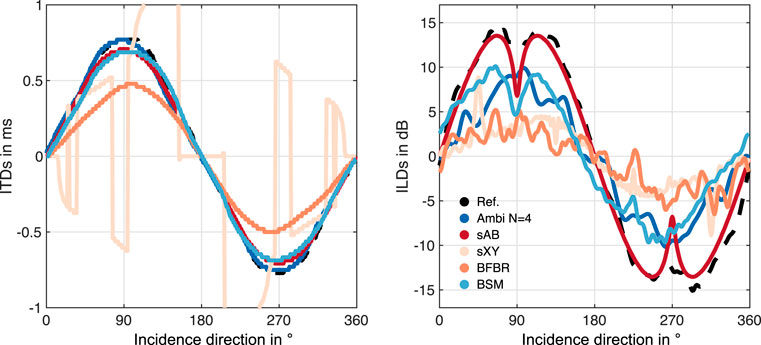
FIGURE 6. ITDs and ILDs of the EMA8 array using different binaural reproduction approaches. The reference values (black dashed lines) were calculated from the KU100 HRTFs.
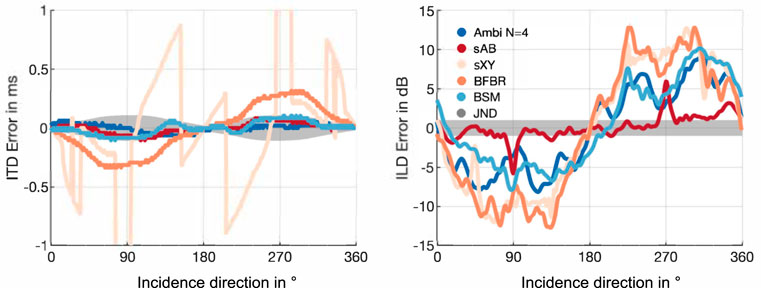
FIGURE 7. ITD and ILD errors for the EMA8 array using different binaural reproduction approaches. The shaded gray areas represent JNDs.
The ILDs and ITDs of the glasses array are depicted in Figure 8. Since the array transfer functions from the glasses array were only available for 60 directions in the horizontal plane, we linearly interpolated the ITDs and ILDs to the same 360 directions used for the EMA analyses for Figures 8, 9. Figure 8 shows that the ITD and ILD curves are not exactly symmetric, unlike the curves for the EMAs. This is due to the non-symmetric distribution of the microphones on the glasses array. This is most clearly visible in the sXY stereo curve, which again, has a notable excursion near 270°. For the glasses array, BSM performs better than the N = 2 Ambisonics rendering and matches the reference curve quite well. Whereas for the EMA6 BSM produces slightly underestimates in the ITD curve, for the glasses array it produces slightly larger ITDs compared to the reference. sAB stereo lead to similar ITD curve as BSM. BFBR and Ambisonics perform comparably but notably worse than sAB and BSM. For the ILDs, BSM also performs better than Ambisonics; however, sAB stereo seems to match the reference curve the best. The ITD errors in Figure 9 show that BSM is still below the JND for most of the incidence directions. Interestingly, both stereo approaches have smaller ITD errors for the glasses array compared to the EMAs. BFBR produces errors above the ITD JND for 90° and 270°. In the ILD error curve no systematic difference compared to the EMAs can be observed.
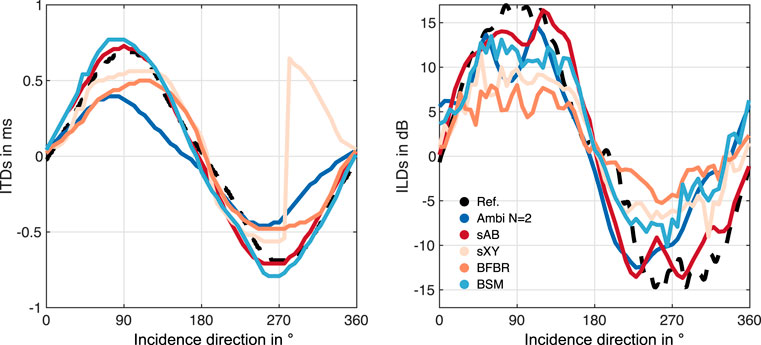
FIGURE 8. ILDs and ITDs of the glasses array using different binaural reproduction approaches. The reference values (black dashed lines) were calculated from the KEMAR HRTFs.
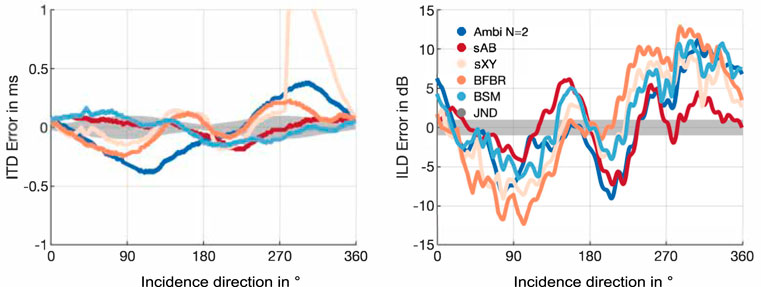
FIGURE 9. ITD and ILD errors for the glasses array using different binaural reproduction approaches. The shaded gray areas represent JNDs.
Next, we analyzed the spectral differences in the form of the averaged differences of the magnitude spectra, calculated with
where bref are the reference binaural signals, and Ωd is the set of Nd directions of the binaural signals (where Ωd is a set of 360 directions in the horizontal plane in steps of 1°). Figure 10 depicts the spectral differences of the EMA6 and shows that Ambisonics and BSM lead to similar differences. While Ambisonics performs better near 1 kHz, BSM performs better at higher frequencies. BFBR leads to slightly larger errors than BSM at 1 kHz, but performs equivalently at higher frequencies. sXY stereo leads to notable differences even at frequencies up to 1.1 kHz, which matches the findings from the ILD/ITD figures. The largest magnitude errors are at frequencies above 10 kHz for both stereo approaches, most probably due to the lack of pinnae cues.
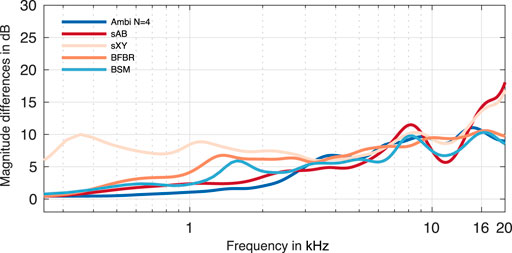
FIGURE 10. Magnitude differences for the EMA6.
Figure 11 depicts the average magnitude differences of the binaural signals calculated from the glasses array capture. The figure clearly shows that the magnitude differences are higher than for the EMAs. Again, the highest errors can be observed for the sXY stereo renderings. The magnitude differences of the BSM and the Ambisonics renderings are the lowest. The differences of BSM are below 10 dB for almost all frequencies. The differences for Ambisonics clearly increase above approximately 16 kHz. The figure shows a similar trend as with the EMAs, that is, that BSM has larger magnitude differences at lower frequencies compared to Ambisonics, but similar or even lower errors at higher frequencies. Different from the EMAs, for the glasses array, BFBR has larger magnitude errors for nearly all frequencies compared to BSM and Ambisonics. Again, the errors of both stereo curves increase at very high frequencies.

FIGURE 11. Magnitude differences for the glasses array.
4 EXPERIMENT 1: Equatorial microphone array
The quantitative evaluation suggests that BSM and sAB stereo can lead to similar perceptual results to the Ambisonics renderings. To evaluate this hypothesis, we conducted two comparative listening experiments. In Experiment 1, we evaluated the EMAs. The second experiment, with the glasses microphone array, is described below in Section 5.
4.1 Methods
4.1.1 Stimuli
We used the SMA data measured in the dry studio room control room 1 (CR1) with a reverberation time of RT60 = 0.25 s (at 1 kHz) and a source distance of 2.4 m, and the SMA data measured in a concert hall small broadcast studio (SBS) with RT60 = 1 s (at 1 kHz) and a source distance of 6 m, from the database compiled by Stade et al. (2012). We resampled the SMA signals as described in Section 2 for the EMA6, the EMA8, and the Eigenmike sampling scheme. From the EMA6 and EMA8 arrays we then synthesized binaural room impulse responses (BRIRs) with the BFBR, BSM, sAB stereo, and sXY stereo methods and, additionally, fourth-order Ambisonics decodings with MagLS optimization from the Eigenmike array signals. As anechoic test signals, we used a basic acoustic drum kit (basedrum, snare, hi-hat) and a speech sample. The employed database also includes BRIRs measured with a Neumann KU100 dummy head used as the binaural reference in the experiment. All stimuli were matched in loudness according to ITU-R BS.1770-4 (2015).
4.1.2 Paradigm
We used a test design based on the Multiple Stimulus with Hidden Reference and Anchor (MUSHRA) paradigm proposed by ITU-R BS.1534-3 (2015), which enables comparing multiple stimuli directly. In our case, the participants’ task was to rate the differences of the renderings compared to a binaural reference. The paradigm consisted of several blocks of comparisons presented as screens/pages within the software. For each MUSHRA screen/page, the five renderings BFBR, BSM, sAB, sXY, and Ambisonics, as well as the hidden reference and the reference indicated as such, were presented. Contrary to the recommendation of the ITU, we did not include an anchor. The participants were provided with a graphical user interface (GUI) which displayed sliders for each stimulus ranging from 0 to 100. Further, we did not ask for the overall quality compared to the reference, but for the perceived differences in terms of timbre or spaciousness. Accordingly, the sliders were labeled with “Huge”, “Significant”, “Moderate”, “Small”, and “No”, adapted from the MUSHRA experiment in Lübeck et al. (2020). Differences in the timbre are related to any differences in coloration. Differences in the spaciousness are related to any spatial differences, like perceived source position, source distance, externalization, or the source width. In the experiment, participants rated eight MUSHRA pages in total: EMA6 in the CR1 with the speech signal, EMA6 in the CR1 with the drums test signal, EMA8 in CR1 with the drums signal, and EMA6 in the SBS with the drums signal. These factor combinations were repeated for the two metrics, timbre and spatial differences. We did not set up a complete factorial design with all factor combinations to avoid the experiment being too long. At the beginning of the experiment, participants conducted training consisting of user interface familiarization and signal familiarization.
4.1.3 Participants
19 participants took part in the experiment. Most of whom were staff of the audio group at Reality Labs Research at Meta; none reported any hearing issues.
4.1.4 Setup
The experiment was conducted in remote settings. It was implemented in Matlab and shared with each participant, who conducted the test with their own equipment, i.e., their PC or Mac, audio device, and headphones. We recommended the use of Beyerdynamic DT990 Pro headphones, which where used by 15 participants. According to the choice of headphones, the binaural chain was equalized with appropriate headphone compensation filters provided by Bernschütz et al. (2012). If no headphone filters were available in the database, no equalization was applied, which was the case for two participants. During the training phase, participants were instructed to adjust the volume to a comfortable level that should not change during the experiment. All participants were asked to perform the test in a room which was as quiet as possible.
4.2 Data analysis
To evaluate participants’ rating differences between renderings, we ranked each rendering within each comparison of stimulus and attribute (by each MUSHRA screen). We then analyzed the ranks for each rendering using a hierarchical multivariate ordinal regression under a Bayesian framework.
We combined the data from Experiment 1 and Experiment 2, in order to pool variance estimates across the two experiments. The multivariate ordinal regression model regressed rendering rank for both spaciousness and timbre attributes as a function of included raw rating (MUSHRA points), rendering approach (BFBR, BSM, sXY, sAB, Ambisonics (N = 2 and N = 4)), room, array configuration, test signal and all interaction terms as population-level effects, and subject, trial, room, and subject group as a varying (group-level) effects, with correlation estimates for rendering approach and array configuration. The multilevel nature of our model facilitated partial pooling of group-level data, and thus parameter estimates. With partial pooling, the probability of each response choice is modeled for each participant and the data for all participants also informs the estimates for each participant (Gelman and Hill, 2006).
In the Bayesian framework, regression models calculate the distribution of parameter estimates as the posterior distribution. In this case, our model estimated the posterior distribution of each rank for each combination of participant, attribute, rendering approach, test signal, room, and array configuration, for each Markov-chain Monte Carlo (MCMC) iteration. To derive a single estimate of ranking in each independent variable combination, we calculated the weighted sum of rankings for each MCMC iteration as follows
where p is the expected probability of rank k at each iteration i.
In order to evaluate ranking differences between renderings, we calculated the posterior distribution of differences between rankings for each MCMC iteration for each independent variable combination. Ranking difference estimates for which the highest density credible interval does not include zero are considered statistically significant differences.
All models were constructed using the Stan programming language (Carpenter et al., 2017) through the cmdstan (Gabry and Češnovar, 2021) and brms (Bürkner, 2017, 2018) packages in R statistical computing software (R Core Team, 2021).
4.3 Results
A graphical overview of the results is presented in Figure 12 in the form of boxplots of the inter-subject variance in the MUSHRA points for each MUSHRA screen and rated attribute separately. The plots show that for the timbre attribute (top) most of the ratings are within the range of the Ambisonics rendering. An exception is the box for the BFBR results from the EMA6 in reverberant conditions. Overall, sAB stereo and BSM achieved the highest median ratings. They are consequently higher than the median ratings of the Ambisonics renderings. The results of the spaciousness attribute (bottom) show that only sAB stereo and BSM were rated similar to or higher than the Ambisonics rendering. An interesting observation is that in the reverberant condition, BSM was rated significantly better then all other renderings. A similar trend is shown in the boxplots for the timbre results in the reverberant condition. Comparing the results of the spaciousness attribute for the EMA6 and EMA8 with drums shows that the EMA8 might be favourable for the sAB stereo approach. This might be due to the microphone distribution.
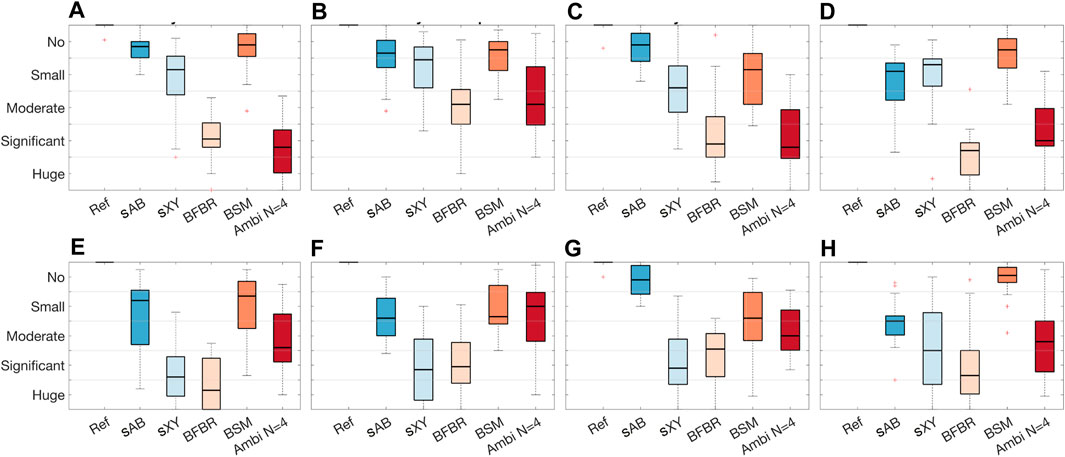
FIGURE 12. EXPERIMENT 1: Boxplots of the inter-individual variation in the MUSHRA points for each MUSHRA page separately. (A) Timbre: dry EMA6 drums, (B) Timbre: dry EMA6 speech, (C) Timbre: dry EMA8 drums, (D) Timbre: reverberation EMA6 drums, (E) Spaciousness: dry EMA6 drums, (F) Spaciousness: dry EMA6 speech, (G) Spaciousness: dry EMA8 drums, (H) Spaciousness: reverberation EMA6 drums.
Median ranks for each rendering and signal, together with 89% credible intervals, are shown in Figure 13. The median ranks support the findings from the boxplots that sAB and BSM were rated the best for the timbre attribute. To investigate how the approaches performed compared to Ambisonics, the median rank differences between each rendering and Ambisonics N = 4, together with 89% credible intervals and asterisks indicating statistically significant differences, are shown in Figure 14. Visual inspection reveals that for the spaciousness attribute, Ambisonics N = 4 was ranked higher than BFBR for speech with the EMA6 in dry conditions, sAB was ranked higher with the EMA8 in dry conditions, and BSM was ranked higher with the EMA6 in reverberant conditions. For the attribute timbre, sAB was ranked higher for drums and BSM was ranked higher for both drums and speech. Both sAB and BSM were also ranked higher with EMA8 in dry conditions. BSM and sXY were ranked higher with EMA6 in the reverberant room. BFBR was always ranked in the range of Ambisonics for the timbre attribute.
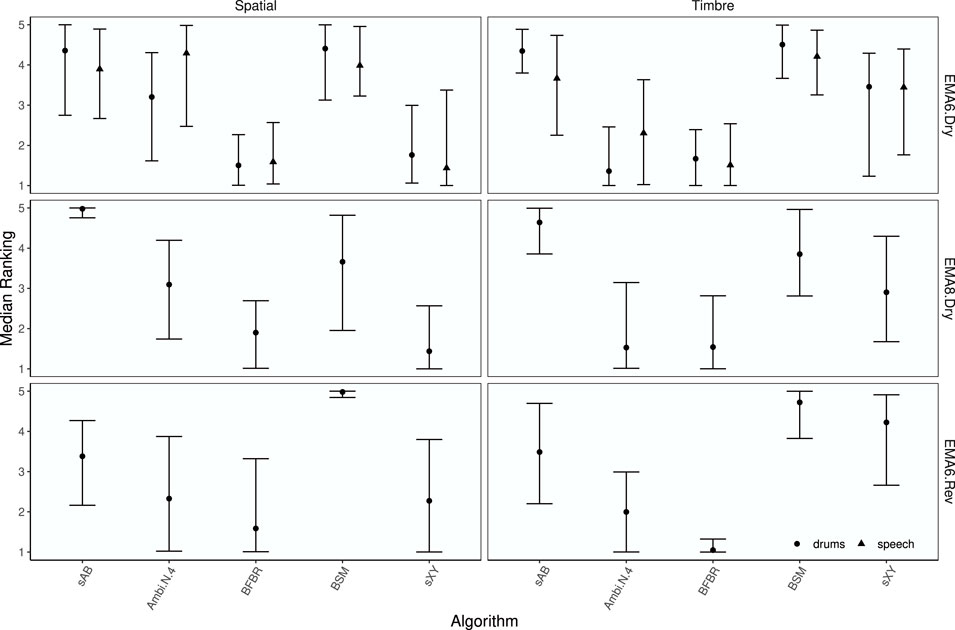
FIGURE 13. EXPERIMENT 1: Median ranks for each rendering by attribute, array configuration, test signal, and rendering approach. Points represent median rank and error bars depict the 89% highest density credible interval.
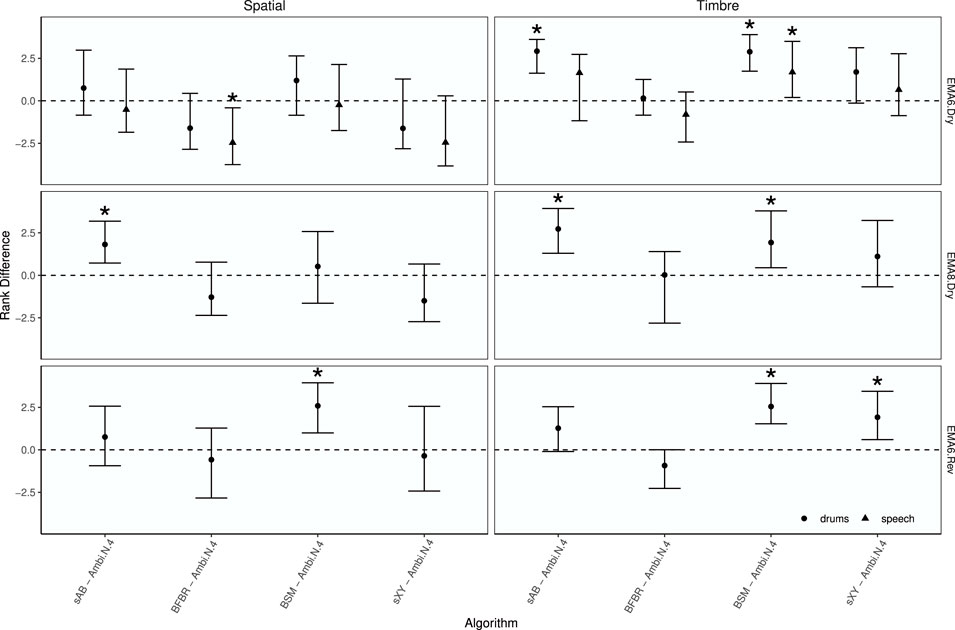
FIGURE 14. EXPERIMENT 1: Median rank differences between renderings and Ambisonics N =4 by attribute, room, array configuration, and test signal. Points represent median rank difference and error bars depict the 89% highest density credible interval. Asterisks indicate statistically significant differences.
The median rank differences (Figure 14) suggests that sAB and BSM perform the best for the EMAs. Mostly, all rendering approaches were rated in a similar range as the N = 4 Ambisonics rendering.
5 EXPERIMENT 2: Glasses microphone array
5.1 Methods
For the second experiment, we employed array impulse responses measured in a room with variable acoustics for two different source positions (loudspeaker one at 23° with a distance of 2 m, loudspeaker 2 at 325° with a distance of 1.5 m). We used measurements in dry conditions (RT60 = 0.447 s, at 1 kHz), and in more reverberant conditions (RT60 = 0.564 s, at 1 kHz). The measurements were done with the 6-microphone glasses array described in Section 2.1.2, and for the comparative Ambisonics renderings with an 8-microphone OctoMic array. The binaural reference in Experiment 2 was measured with a KEMAR dummy head. The test signals were the same as for Experiment 1 such that in total participants again rated eight MUSHRA pages: dry conditions with loudspeaker 1 (spk 1) and the drums signal, dry conditions with spk one and speech signal, dry conditions with spk 2 and drums signal, and the reverberant condition with spk one and the drums signal. Again, to avoid the experiment being to long, we only tested a subset of all factor combinations.
Since, no headphone compensation filters were available for the KEMAR dummy head, the second experiment was conducted without any headphone equalization.
In all other aspects, setup, procedure, and data analysis were identical to Experiment 1. All 19 subjects, participated in both experiments.
5.2 Results
A graphical overview of the results is presented in Figure 15 in the form of boxplots of the inter-subject variance in the MUSHRA points for each MUSHRA page and the timbre and spaciousness attributes, separately. As the quantitative evaluation suggests, the glasses array is the more challenging condition. However, except for the results of the BSM renderings for spk 2, all timbre ratings are within the range of the Ambisonics results. For the glasses array, BFBR and sAB seem to perform the best regarding the timbre. For the spaciousness results, the boxplots do not indicate any approach as being the best. Only the results for sXY stereo for spk 2 are notably worse compared to the other conditions.
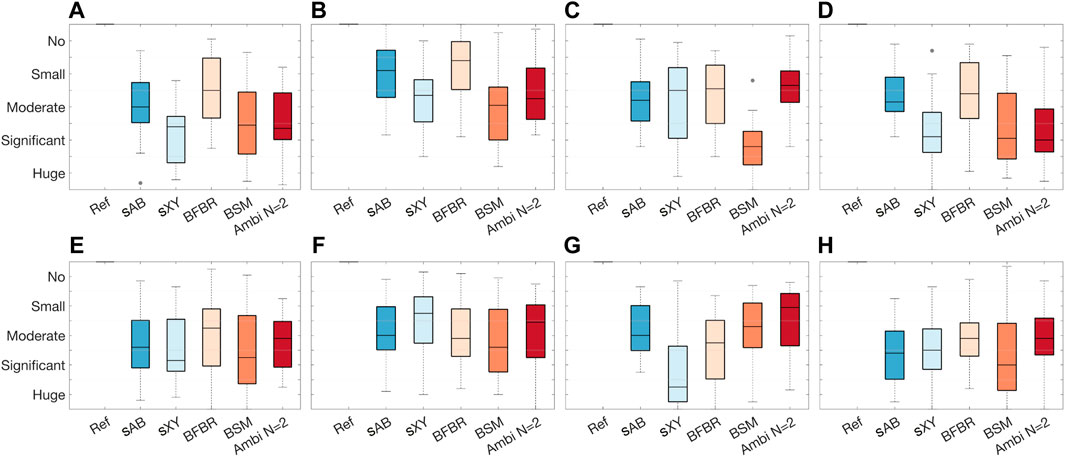
FIGURE 15. EXPERIMENT 2: Boxplots of the inter-individual variation in the MUSHRA points for each MUSHRA page separately. (A) Timbre: dry spk1 drums, (B) Timbre: dry spk1 speech, (C) Timbre: dry spk2 drums, (D) Timbre: reverberation spk1 drums, (E) Spaciousness: dry spk1 drums, (F) Spaciousness: dry spk1 speech, (G) Spaciousness: dry spk2 drums, (H) Spaciousness: reverberation spk1 drums.
Median ranks for each rendering and test signal, together with 89% credible intervals, are shown in Figure 16.
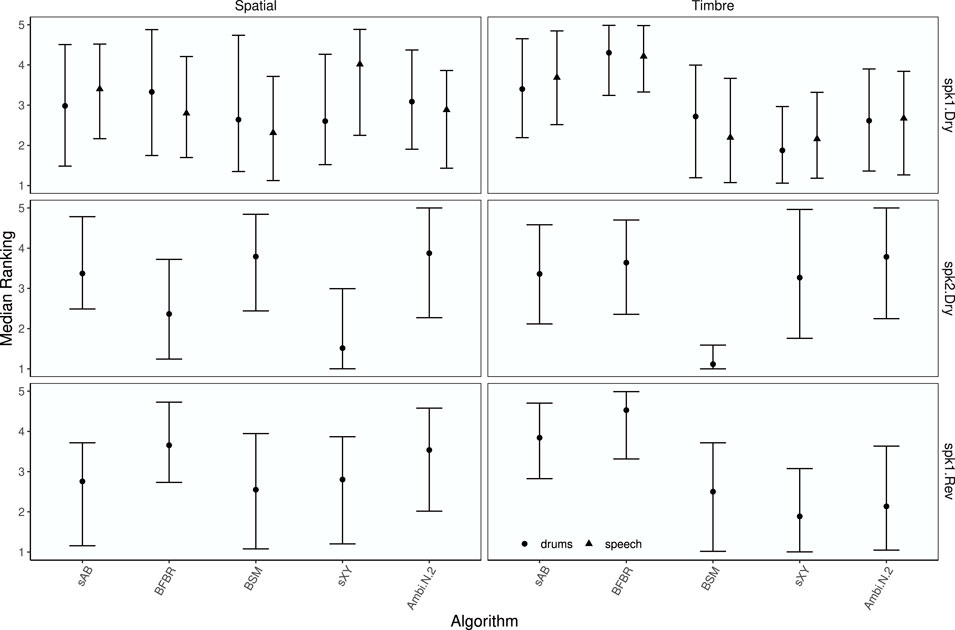
FIGURE 16. EXPERIMENT 2: Median ranks for each rendering by attribute, array configuration, room, test signal, and rendering. Points represent median rank and error bars depict the 89% highest density credible interval.
To investigate how the approaches performed compared to the Ambisonics renderings Figure 17 shows the median rank differences between each rendering approach and Ambisonics N = 2, together with 89% credible intervals and asterisks indicating statistically significant differences. Visual inspection reveals that for the spaciousness attribute, Ambisonics N = 2 was ranked higher than sXY for spk 2 in dry conditions. For the timbre attribute, BFBR was ranked higher for speech with spk one in dry conditions and for drums with spk one in reverberant conditions. Ambisonics N = 2 was ranked higher than BSM with spk 2 in dry conditions. Median rank differences suggest that in most cases all renderings were rated similar to the Ambisonics rendering.
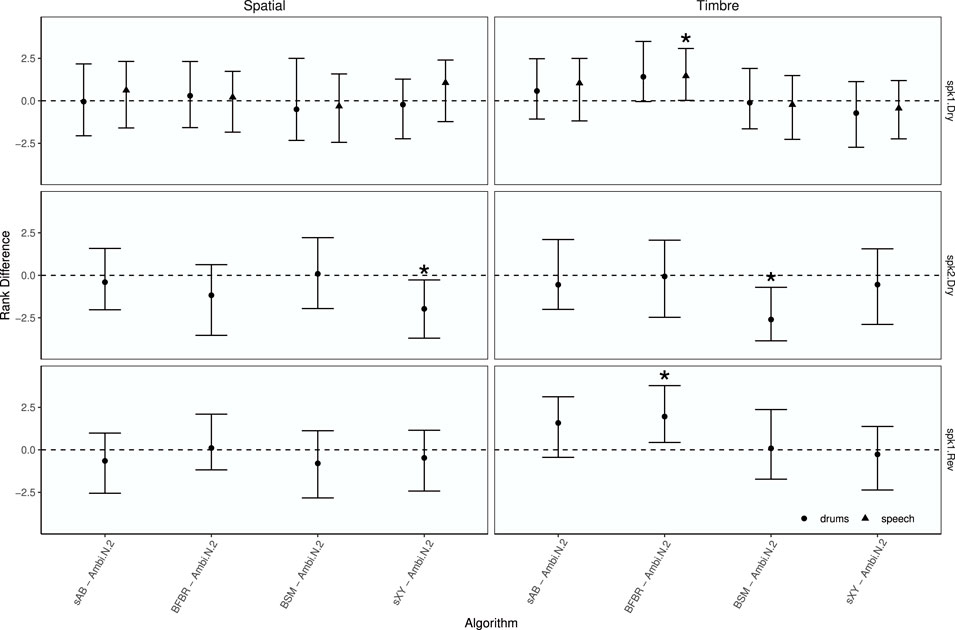
FIGURE 17. EXPERIMENT 2: Median rank differences between renderings and Ambisonics N =2 by attribute, array configuration, room, and test signal. Points represent median rank differences and error bars depict the 89% highest density credible interval. Asterisks indicate statistically significant differences.
6 General discussion
A primary motivation of the study was to investigate if capture from non-spherical arrays, together with the approaches sAB stereo, sXY stereo, BFBR, or BSM, can lead to auralization that is comparable to the established Ambisonics chain. Both quantitative and perceptual evaluation suggest that for EMAs with six and eight microphones, sAB stereo and BSM performed comparably to, and mostly better than, the fourth-order Ambisonics reproduction of SMA capture with an Eigenmike sampling scheme. This is surprising, considering the increased microphone count 32) of the Eigenmike compared to the EMA6 and EMA8. For the glasses array with six microphones, BFBR and sAB stereo performed comparably only to a second-order Ambisonics reproduction of SMA capture with an OctoMic. Hence, the glasses array is certainly the more challenging array configuration; that is also supported by the quantitative evaluation.
It can be assumed that sAB stereo highly depends on the location of the microphones; this is supported by the ITD and ILD analyses. The results of the EMA experiment show that regarding the spaciousness, microphones at ϕ = 90° and ϕ = 270° might be advantageous. However, the timbre is not affected by the microphone position. Furthermore, we could not find any significant difference in the performance of sAB stereo between the EMAs and the glasses array.
The listening experiment results show that sXY reproduces the sound scene with a relatively accurate timbre. However, sXY stereo does not lead to good spatial reproduction. This strongly matches the findings from the quantitative evaluation. sXY cannot restore the correct ITDs and ILDs. This is, for one thing due to collocation of the beams and for another due to non-optimal beamforming. MD beamforming with a small number of microphones introduces side lobes, which might cause the ITD and ILD distortions. Moreover, the original XY stereophony employs microphones with cardioid directivity instead of maximum directivity.
BFBR was rated better for the glasses array than for the EMAs; the quantitative evaluation does not clearly supported this. For example, BFBR has larger magnitude differences for the glasses array than for the EMAs compared to BSM or Ambisonics. It might be due to the inconsistent use of the rating scale. Another explanation could be that for the EMAs all microphones are in the horizontal plane, leading to a lack of height information. This does not affect the ITD and ILD analysis since we only considered horizontal sound incidences but may affect complex sound scenes, with reflection from all directions. Furthermore, BFBR assumes far-field sound sources. For the EMAs, the source distance was 2.4 and 6 m; for the glasses array 1.5 and 2 m. This might further influence the performance of BFBR. Moreover, it is interesting to mention that BSM behaves in the opposite way; it was rated better for the EMAs.
Madmoni et al. (2021) investigated the influence of the microphone distribution on the performance of BSM. However, they only investigated semi-circular array configurations. They concluded that for static reproduction, microphones placed close to the ears are favourable. For dynamic binaural synthesis, uniformly sampling on a full-circular array has advantages. Our study did not find any significant difference between the EMA6 and EMA8. Future work is suggested to develop design criteria for optimal array configurations for the BSM method.
sAB has the clear advantage of not being affected by any undersampling artifacts, such as spatial aliasing. However, it is the only approach that cannot synthesize binaural signals for different head orientations in the form evaluated in this paper. One possible method to adapt the binaural signals is presented in Nagel et al. (2020) and Nagel and Jax (2021). The authors proposed a binaural cue adaptation of static binaural recordings. For this, the recorded signals are divided into coherent and incoherent components. The coherent components, which mainly generate the ITDs and ILDs and are important for spatial perception (Jeffress and Robinson, 1962; Trahiotis et al., 2001), are then adapted to the listeners’ head orientation based on a spherical head model. Another approach would be the MTB method (Algazi et al., 2004), which interpolates between neighboured microphone signals according to the listeners’ head orientation.
The significant advantage of sXY stereo is its simplicity; it does not require HRTF processing, similarly to sAB stereo. However, sXY stereo does not necessarily require microphones at the position of the listener’s ears. Binaural signals for different head orientations could be synthesized by varying the directions of the XY beams.
The clear benefit of BFBR is that it is the most flexible approach. Since the sound field is decomposed into different directional components, it can easily be manipulated. This could be used to either synthesize different head orientations or amplify specific directions of the sound field. Moreover, different HRTFs can easily be integrated since they are not incorporated in the beamforming coefficients, as with BSM, for example. Moreover, beamforming plays an important role in consumer devices, for example, for applications that enhance speech intelligibility.
Overall, BSM seems to reproduce the most accurate binaural signals. However, the BSM filters already incorporate the HRTFs, which is why a complete set of BSM filters is required for each head orientation. Hence, applying dynamic binaural synthesis would require a large set of beamforming coefficients.
This study only focuses on scene-based approaches, i.e., re-synthesis of the entire captured scene. In future work, it would also be conceivable to apply parametric approaches, like DiraC (Pulkki, 2007) or SIRR (Merimaa and Pulkki, 2004). With beamforming, objects or specific dominant sound sources of the sound field could be extracted and spatially rendered.
7 Conclusion
We presented a comparison of approaches for the binaural rendering of capture from equatorial microphone arrays and capture from a glasses microphone array. A MUSHRA-like listening experiment applying non-head-tracked binaural synthesis showed that the approaches have potential to synthesize spatial sound scenes with similar quality as Ambisonics renderings from spherical microphone array capture with a similar number of microphones. Beamforming-based binaural reproduction with binaural signal matching and a microphone-based stereo approach performed the best for equatorial arrays. For the glasses array, beamforming-based binaural reproduction and microphone-based stereo performed the best. The results further suggest that for non-head-tracked binaural reproduction, the more sophisticated beamforming approaches (BSM or BFBR) do not outperform the simple microphone-based stereo approach. Future work is suggested to investigate how the approaches perform with head-tracked dynamic binaural reproduction. Moreover, in the current study, we only focused on sound sources in the horizontal plane. The performance of the approaches with elevated sound sources or vertical head movements needs to be investigated in future work.
Data availability statement
The raw data supporting the conclusions of this article will be made available by the authors, without undue reservation.
Ethics statement
The studies involving human participants were reviewed and approved by an internal research review committee and an external institutional review board (IRB). Written informed consent for participation was not required for this study in accordance with the national legislation and the institutional requirements.
Author contributions
As part of the internship, TL designed the project, implemented or maintained the tested algorithms, and conducted the listening experiment. He also wrote the first draft of manuscript. ZH and DA supervised the project. ZH, DA, SA, and PC assisted in refining the research question and experimental design. JC designed and performed the statistical analysis. All authors contributed to manuscript revision, and read and approved the submitted version.
Funding
This work was done during an internship with Reality Labs Research at Meta.
Acknowledgments
The authors would like to thank Lior Madmoni and Boaz Rafaely for providing us with the code of BSM, as well as our collegues from Reality Labs - Research, Vladimir Tourbabin, Jacob Donley, Sam Clap, and Andrew Luck who greatly assisted in this internship project. Many thanks also to all voluntary participants.
Conflict of interest
The authors declare that the research was conducted in the absence of any commercial or financial relationships that could be construed as a potential conflict of interest.
Publisher’s note
All claims expressed in this article are solely those of the authors and do not necessarily represent those of their affiliated organizations, or those of the publisher, the editors and the reviewers. Any product that may be evaluated in this article, or claim that may be made by its manufacturer, is not guaranteed or endorsed by the publisher.
Footnotes
*also at Institute of Communications Engineering, TH Köln - University of Applied Sciences, Cologne, D-50679, Germany.
1Throughout this article, ϕ ∈ [0°, 360°) denotes the azimuth angle, and θ ∈ [0°, 180°] the colatitude angle.
2https://www.vvaudio.com/landing/VVOctoEncode_OctoMic.
References
Ackermann, D., Fiedler, F., Brinkmann, F., Schneider, M., and Weinzierl, S. (2020). On the acoustic qualities of dynamic pseudobinaural recordings. J. Audio Eng. Soc. 68, 418–427. doi:10.17743/jaes.2020.0036
Ahrens, J., Helmholz, H., Alon, D. L., and Garí, S. V. A. (2021a). “A head-mounted microphone array for binaural rendering,” in International Conference on Immersive and 3D Audio, 1–7.
Ahrens, J., Helmholz, H., Alon, D. L., and Garí, S. V. A. (2021b). “Spherical harmonic decomposition of a sound field based on microphones around the circumference of a human head,” in Workshop on Applications of Signal Processing to Audio and Acoustics, 1–5.
Ahrens, J., Helmholz, H., Alon, D. L., and Garí, S. V. A. (2021c). Spherical harmonic decomposition of a sound field based on observations along the equator of a rigid spherical scatterer. J. Acoust. Soc. Am. 805, 805–815. doi:10.1121/10.0005754
Algazi, V. R., Duda, R. O., and Thompson, D. M. (2004). Motion-tracked binaural sound. AES J. Audio Eng. Soc. 52, 1142–1156.
Andreopoulou, A., and Katz, B. F. G. (2017). Identification of perceptually relevant methods of inter-aural time difference estimation. J. Acoust. Soc. Am. 142, 588–598. doi:10.1121/1.4996457
Avni, A., Ahrens, J., Geier, M., Spors, S., Wierstorf, H., and Rafaely, B. (2013). Spatial perception of sound fields recorded by spherical microphone arrays with varying spatial resolution. J. Acoust. Soc. Am. 133, 2711–2721. doi:10.1121/1.4795780
Ben-hur, Z., Alon, D. L., Mehra, R., and Rafaely, B. (2021). “Binaural reproduction based on bilateral Ambisonics and ear-aligned HRTFs,” in IEEE/ACM Transaction on Audio, Speech, and Language Processing, 1–13. doi:10.1109/TASLP.2021.3055038
Bernschütz, B. (2013). “A spherical far field HRIR/HRTF compilation of the Neumann KU 100,” in Proceedings of the 39th DAGA (Meran), 592–595.
Bernschütz, B. (2016). Microphone arrays and sound field decomposition for dynamic binaural recording. Berlin: Technische Universität Berlin, 264. doi:10.14279/depositonce-5082
Bernschütz, B., Pörschmann, C., Spors, S., and Weinzierl, S. (2011a). “SOFiA sound field analysis toolbox,” in Proceedings of the International Conference on Spatial Audio (ICSA), 8–16.
Bernschütz, B., Pörschmann, C., Spors, S., and Weinzierl, S. (2011b). Soft-Limiting der modalen Amplitudenverst ̈ arkung bei sph ̈ arischen Mikrofonarrays im Plane Wave Decomposition Verfahren Einleitung Begrenzung der Verst ̈ arkung Kompensation des Frequenzgangs Verifikation Zusammenfassung. Proc. 37th DAGA (Düsseldorf) 2, 661–662.
Bernschütz, B., Stade, P., and Rühl, M. (2012). “Sound field analysis in room Acoustics,” in 27th Tonmeistertagung - VDT International Convention.
Bürkner, P.-C. (2018). Advanced Bayesian multilevel modeling with the R package brms. R J. 10, 395–411. doi:10.32614/RJ-2018-017
Bürkner, P.-C. (2017). brms: An R package for Bayesian multilevel models using Stan. J. Stat. Softw. 80, 1–28. doi:10.18637/jss.v080.i01
Calamia, P., Davis, S., Smalt, C., and Weston, C. (2017). “A conformal, helmet-mounted microphone array for auditory situational awareness and hearing protection,” in 2017 IEEE Workshop on Applications of Signal Processing to Audio and Acoustics (WASPAA), 96–100.
Carpenter, B., Gelman, A., Hoffman, M. D., Lee, D., Goodrich, B., Betancourt, M., et al. (2017). Stan: A probabilistic programming language. J. Stat. Softw. 76. doi:10.18637/jss.v076.i01
[Dataset] Core Sound (2022a). Core sound Octomic™. Available at: https://www.core-sound.com/products/octomic.
[Dataset] Core Sound (2022b). Core sound Octomic™. Available at: https://www.core-sound.com/products/octomic.
Cuevas-Rodriguez, M., Alon, D. L., Clapp, S. W., Robinson, P. W., and Mehra, R. (2019). “Evaluation of the effect of head-mounted display on individualized head-related transfer functions,” in Proceedings of the International Congress on Acoustics, 2019-September, 2635–2642. doi:10.18154/RWTH-CONV-239516
Donley, J., Tourbabin, V., Lee, J.-S., Broyles, M., Jiang, H., Shen, J., et al. (2021). Easycom: An augmented reality dataset to support algorithms for easy communication in noisy environments. arXiv:2107.04174.
Duraiswami, R., Zotkin, D. N., Li, Z., Grassi, E., Gumerov, N. A., and Davis, L. S. (2005). High order spatial audio capture and its binaural head-tracked playback over headphones with HRTF cues. New York: HRTF.
Gabry, J., and Češnovar, R. (2021). Cmdstanr: R interface to ’CmdStan’. Available at: https://discourse.mc-stan.org.
Gelman, A., and Hill, J. (2006). Data analysis using regression and multilevel/hierarchical models. Cambridge: Cambridge University Press.
Helmholz, H., Andersson, C., and Ahrens, J. (2019). “Real-time implementation of binaural rendering of high-order spherical microphone array signals,” in Proceedings of the 45th DAGA (Rostock, GE: DAGA), 2–5.
Ifergan, I., and Rafaely, B. (2022). On the selection of the number of beamformers in beamforming-based binaural reproduction. EURASIP J. Audio Speech Music Process. 6. doi:10.1186/s13636-022-00238-7
Ifergan, I. (2020). “Theoretical framework for beamformer distribution in Beamforming based Binaural Reproduction thesis submitted in partial fulfillment of the Theoretical framework for beamformer distribution in Beamforming based Binaural Reproduction,”. Ph.D. thesis.
[Dataset] ITU-R BS.1534-3 (2015). Method for the subjective assessment of intermediate quality level of audio systems.
ITU-R BS.1770-4 (2015). Algorithms to measure audio programme loudness and true-peak audio level BS Series Broadcasting service (sound). Radiocommunication Sect. ITU 4.
Jeffress, L. A., and Robinson, D. E. (1962). Formulas for the coefficient of interaural correlation for noise. J. Acoust. Soc. Am. 34, 1658–1659. doi:10.1121/1.1909077
Kulkarni, A., Isabelle, S. K., and Colburn, H. S. (1999). Sensitivity of human subjects to head-related transfer-function phase spectra. J. Acoust. Soc. Am. 105, 2821–2840. doi:10.1121/1.426898
Lübeck, T., Helmholz, H., Arend, J. M., Pörschmann, C., and Ahrens, J. (2020). Perceptual evaluation of mitigation approaches of impairments due to spatial undersampling in binaural rendering of spherical microphone array data. J. Audio Eng. Soc. 68, 428–440. doi:10.17743/jaes.2020.0038
Madmoni, L., Donley, J., Tourbabin, V., and Rafaely, B. (2021). “Binaural reproduction from microphone array signals incorporating head-tracking,” in Immersive and 3D audio: From architecture to automotive, 1–5. doi:10.1109/i3da48870.2021.9610940
Madmoni, L., Donley, J., Tourbabin, V., and Rafaely, B. (2020). “Beamforming-based binaural reproduction by matching of binaural signals,” in Proceedings of the AES International Conference on Audio for Virtual and Augmented Reality, 318–322. vol. 8. doi:10.1016/s0967-2109(00)00016-8
McCormack, L., and Politis, A. (2019). “Sparta & compass: Real-time implementations of linear and parametric spatial audio reproduction and processing methods,” in Proceedings of the AES Conference on Immersive and Interaktive Audio, York, UK, E-brief 111.
Merimaa, J., and Pulkki, V. (2004). “Spatial impulse response rendering,” in Proceedings of the 7th International Conference on Digital Audio Effects (Naples), 139–144.
Meyer, J., and Elko, G. (2002). “A highly scalable spherical microphone array based on an orthonormal decomposition of the soundfield,” in Proceedings of the IEEE International Conference on Acoustics, Speech and Signal Processing (ICASSP) (Orlando, FL, USA: IEEE), 1781–1784. vol. 2. doi:10.1109/ICASSP.2002.5744968
Mills, A. W. (1960). Lateralization of high-frequency tones. J. Acoust. Soc. Am. 32, 132–134. doi:10.1121/1.1907864
Mossop, J. E., and Culling, J. F. (1997). Lateralization for large interaural delays. Br. J. Audiology 31, 99. doi:10.1121/1.424369
Nagel, S., Haupt, D., and Jax, P. (2020). “Coherence-adaptive binaural cue adaptation,” in AES International Conference on Audio for Virtual and Augmented Reality (AVAR) (Audio Engineering Society (AES)), 1–3.
Nagel, S., and Jax, P. (2021). “On the use of additional microphones in binaural cue adaptation 2 signal model 1 introduction speech communication,” in 14th ITG Conference, 54–58.
O’Donovan, A. M., Zotkin, D. N., and Duraiswami, R. (2008). “Spherical microphone array based immersive audio scene rendering,” in Proceedings of the 14th Interantional Conference on Auditory Display, Paris, France, 1–8.
Pulkki, V. (2007). Spatial sound reproduction with directional audio coding. J. Audio Eng. Soc. 55, 503–516.
R Core Team (2021). R: A language and environment for statistical computing. Vienna, Austria: R Foundation for Statistical Computing.
Rafaely, B. (2008). IEEE Trans. Audio Speech Lang. Process. 16, 740–747. doi:10.1109/tasl.2008.920059
Rafaely, B. (2015). Fundamentals of spherical array processing. Berlin Heidelberg: Springer-Verlag. doi:10.1007/978-3-642-11130-3
Rasumow, E., Blau, M., Doclo, S., Van De Par, S., Hansen, M., Puschel, D., et al. (2017). Perceptual Evaluation of individualized binaural reproduction using a virtual artificial head. J. Audio Eng. Soc. 65, 448–459. doi:10.17743/jaes.2017.0012
Rasumow, E., Blau, M., Hansen, M., Doclo, S., Van De Par, S., Mellert, V., et al. (2011). Robustness of virtual artifcial head topologies with respect to microphone positioning. Proc. Forum Acusticum 2011, 2251–2256.
Rasumow, E., Hansen, M., Van De Par, S., Püschel, D., Mellert, V., Doclo, S., et al. (2016). Regularization approaches for synthesizing HRTF directivity patterns. IEEE/ACM Trans. Audio Speech Lang. Process. 24, 215–225. doi:10.1109/TASLP.2015.2504874
Reddy, C. S., and Hegde, R. M. (2017). On the conditioning of the spherical harmonic matrix for spatial audio applications, 1–12.
Schörkhuber, C., Zaunschirm, M., and Holdrich, R. (2018). Binaural rendering of Ambisonic signals via magnitude least squares. Proc. 44th DAGA (München) 4, 339–342.
[Dataset] Sennheiser electronic GmbH & Co. KG (2022). Sennheiser Ambeo VR mic. Available at: https://en-de.sennheiser.com/microphone-3d-audio-ambeo-vr-mic.
Song, W., Ellermeier, W., and Hald, J. (2011). Psychoacoustic evaluation of multichannel reproduced sounds using binaural synthesis and spherical beamforming. J. Acoust. Soc. Am. 130, 2063–2075. doi:10.1121/1.3628323
Stade, P., Bernschütz, B., and Rühl, M. (2012). “A spatial audio impulse response compilation captured at the WDR broadcast studios,” in Proceedings of the 27th Tonmeistertagung - VDT International Convention, 551–567.
Tourbabin, V., and Rafaely, B. (2015). Direction of arrival estimation using microphone array processing for moving humanoid robots. IEEE/ACM Trans. Audio Speech Lang. Process. 23, 2046–2058. doi:10.1109/TASLP.2015.2464671
Trahiotis, C., Bernstein, L. R., and Akeroyd, M. A. (2001). Manipulating the “straightness” and “curvature” of patterns of interaural cross correlation affects listeners’ sensitivity to changes in interaural delay. J. Acoust. Soc. Am. 109, 321–330. doi:10.1121/1.1327579
Yost, W. A., and Dye, R. H. (1988). Discrimination of interaural differences of level as a function of frequency. J. Acoust. Soc. Am. 83, 1846–1851. doi:10.1121/1.396520
Zotter, F., and Frank, M. (2019). Ambisonics A practical 3D audio theory for recording, studio production, sound reinforcement, and virtual reality. Berlin Heidelberg: Springer-Verlag. doi:10.1007/978-3-030-17207-7
[Dataset] Zylia Sp. z o.o. (2022). Zylia Sp. z o.o. ZYLIA ZM-1 Microphone. Available at: https://www.zylia.co/zylia-zm-1-microphone.html.
Keywords: binaural reproduction, microphone arrays, beamforming, ambisonics, perceptual evaluation
Citation: Lübeck T, Amengual Garí SV, Calamia P, Alon DL, Crukley J and Ben-Hur Z (2022) Perceptual evaluation of approaches for binaural reproduction of non-spherical microphone array signals. Front. Sig. Proc. 2:883696. doi: 10.3389/frsip.2022.883696
Received: 25 February 2022; Accepted: 19 July 2022;
Published: 15 August 2022.
Edited by:
Augusto Sarti, Politecnico di Milano, ItalyReviewed by:
Tim Ziemer, University of Bremen, GermanyJaume Segura-Garcia, University of Valencia, Spain
Copyright © 2022 Lübeck, Amengual Garí, Calamia, Alon, Crukley and Ben-Hur. This is an open-access article distributed under the terms of the Creative Commons Attribution License (CC BY). The use, distribution or reproduction in other forums is permitted, provided the original author(s) and the copyright owner(s) are credited and that the original publication in this journal is cited, in accordance with accepted academic practice. No use, distribution or reproduction is permitted which does not comply with these terms.
*Correspondence: Tim Lübeck, dGltLmx1ZWJlY2tAdGgta29lbG4uZGU=