 Ali K. Ibrahim
 Hanqi Zhuang
 Emmanuelle Tognoli2
 Ali Muhamed Ali
 Nurgun Erdol
- 1Department of Computer Electrical Engineering and Computer Science, Florida Atlantic University, Boca Raton, FL, United States
- 2Center for Complex Systems and Brain Sciences, Florida Atlantic University, Boca Raton, FL, United States
Epilepsy withholds patients’ control of their body or consciousness and puts them at risk in the course of their daily life. This article pursues the development of a smart neurocomputational technology to alert epileptic patients wearing EEG sensors of an impending seizure. An innovative approach for epileptic seizure prediction has been proposed to improve prediction accuracy and reduce the false alarm rate in comparison with state-of-the-art benchmarks. Maximal overlap discrete wavelet transform was used to decompose EEG signals into different frequency resolutions, and a multiresolution convolutional neural network is designed to extract discriminative features from each frequency band. The algorithm automatically generates patient-specific features to best classify preictal and interictal segments of the subject. The method can be applied to any patient case from any dataset without the need for a handcrafted feature extraction procedure. The proposed approach was tested with two popular epilepsy patient datasets. It achieved a sensitivity of 82% and a false prediction rate of 0.058 with the Children’s Hospital Boston-MIT scalp EEG dataset and a sensitivity of 85% and a false prediction rate of 0.19 with the American Epilepsy Society Seizure Prediction Challenge dataset. This technology provides a personalized solution for the patient that has improved sensitivity and specificity, yet because of the algorithm’s intrinsic ability for generalization, it emancipates from the reliance on epileptologists’ expertise to tune a wearable technological aid, which will ultimately help to deploy it broadly, including in medically underserved locations across the globe.
1 Introduction
Epilepsy is a severe neurological disorder that is characterized by recurrent seizures. Seizure triggering can be attributed to either physiological or environmental causes, and their recurrence intervals can be as long as several years or as short as several minutes (Fisher et al., 2005; Duncan et al., 2006). Loss of consciousness and fall during a seizure episode can lead to serious injuries, body and head trauma, or even death. Health costs linked to these incidences are often very high (Mormann et al., 2006; Gadhoumi et al., 2016). EEG signals are typically used by doctors to diagnose epilepsy, and wearable EEG devices have long been explored for seizure prediction (Vossler, 2021; Brinkmann et al., 2021; Janse et al., 2019; Zambrana-Vinaroz et al., 2022). EEG signals can be categorized into two types: scalp EEG (sEEG) and intracranial EEG (iEEG). sEEGs are captured by placing electrodes on the surface of the scalp, typically under the international standard system (da Silva, 2008). iEEG signals are captured by placing electrodes directly inside the cranium, and they include ECoG and deep-probe electrodes. An EEG signal carrying seizure episodes (ictus) can be divided into four states, namely, interictal, preictal, ictal, and postictal. The portions of the signal just before and after a seizure episode are called preictal and postictal, respectively. Ictal denotes a seizure period, and interictal denotes the period between two seizure episodes. It is believed that the preictal period, which carries electrophysiological anomalies but no clinical onset of the seizure and is considered prodromal (or causal) of an impending seizure, can be used to predict the onset of seizures. These four states are illustrated in Figure 1.
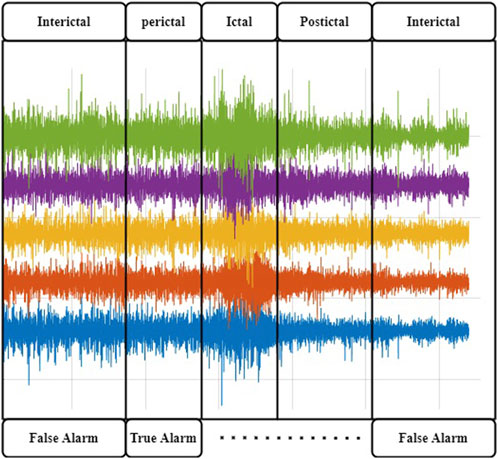
FIGURE 1. Brain states in a typical epileptic EEG recording. The Ictal activity is manifested by high-amplitude activityJiruska et al. (2013); Dominguez et al. (2005). It is preceded by abnormal EEG manifestations that can trigger an alert to help the patient put themself out of harm’s way.
Prediction of seizure episodes should be accurate and within a reasonable time interval to allow time for intervention. This is a challenging task because of the variability of signals among patients and across episodes within the same patient, as well as the noise and interference added to the electrophysiological signals by other electro-active sources in the body and environment. In general, it is agreed that pathologically rhythmic activity is due to the hypersynchrony of local neural populations (Margineanu, 2010; Jiruska et al., 2013; Dominguez et al., 2005) and translate into telltale signs over a set of EEG channels. Besides this core definition, tremendous variability is observed in the electrophysiological manifestations of the disease, with different networks and frequencies involved, widely distinct spatial extents, and idiosyncratic time courses of their propagation. Because of this complexity, early research in seizure prediction heavily relied on the selection of meaningful features by human analysts, which precludes the development of affordable and autonomous algorithms to alert patients. For instance, using the Freiburg Hospital dataset (provided by University of Freiburg in 2003), the authors of Winterhalder et al. (2006) used the dynamical similarity index for feature extraction, which achieved a sensitivity of 42% and a false positive rate (FPR/h) of less than 0.15. In Park et al. (2011), frequency domain features for each channel were extracted first, and a support vector machine (SVM) classifier was then applied to classify EEG signals into preictal and interictal periods. This method, which was also tested with the Freiburg Hospital dataset, achieved a sensitivity of 98.3% but with a FPR/h rising to 0.29. In Zhang and Parhi (2015), more features were added, including spectral power ratios between different frequency bands. This method achieved a sensitivity exceeding 98% and a FPR/h of less than 0.05. In Aarabi and He (2014), Bayesian inversion of power spectral density was used as a feature, and then a rule-based decision strategy was applied for seizure prediction. The authors, who also tested their approach with the Freiburg Hospital dataset, obtained a sensitivity of 87.07% and a FPR/h of 0.2. In Aarabi and He (2017), the authors reported a method that improved FPR/h to 0.126 by using six new features, which included correlation entropy, noise level, correlation dimension, Lempel–Ziv complexity, largest Lyapunov exponent, and non-linear interdependence.
In the past decade, a number researchers have worked on the European EPILEPSIAE project (http://www.epilepsiae.eu/); for instance, refer to Ihle et al. (2012); Fiest et al. (2017); Klatt et al. (2012). Many studies (Li et al., 2016; Teixeira et al., 2014; Bandarabadi et al., 2015; Stojanović et al., 2020) have considered an approach with the steps of preprocessing, feature extraction, classification, and performance evaluation. Some methods determined a preictal period based on critical feature extraction. Often, the determination of a fixed preictal period follows a grid search of time periods with different lengths, e.g., 2, 20, 30, 60, or even 240 min (Moghim and Corne, 2014; Park et al., 2011). In Stojanović et al. (2020), the authors used non-negative matrix factorization (NMF) with smooth basis functions combined with regression on the power spectral of iEEG to extract features for seizure prediction. They applied the support vector machine algorithm for classification. The authors in Viana et al. (2022) assessed whether patient-specific seizure forecasting is possible using remote, minimally invasive ultralong-term subcutaneous EEG. In Mahmoodian et al. (2019), the authors described the use of a cross-bispectrum method to extract features from multichannel intracranial EEG (i-EEG) data in order to expose epileptic seizure activity. The study used recordings from the Freiburg dataset, which includes data from 21 patients with focal epilepsy. A support vector machine classifier was employed for classification, and post-processing techniques to enhance classification accuracy were applied to the classifier output. The results show a sensitivity (recall) of 95.8%, specificity of 96.7%, and accuracy of 96.8% in differentiating between ictal and interictal conditions.
In Behnoush et al. (2021), a review was conducted with the main aim of evaluating machine learning algorithms for predicting seizure events, identifying critical patients, and guiding appropriate clinical interventions. The data were collected from the emergency department, which included multiple features of acute cases. Significant parameters were selected, and different machine learning classifiers were tested. The performance of these classifiers was measured using area under the curve (AUC) and other instruments. Out of a total of 909 patients, 544 (59.8%) were diagnosed with seizures. The significant predictors of seizures were found to be sex (male/female), pulse rate, blood oxygen pressure, bicarbonate level in the blood, and pH value.
Recently, deep learning has become popular due to its effectiveness in prediction and classification. Deep learning-based detectors and classifiers do not need sophisticated preprocessing and handcrafted feature extraction procedures. Deep learning algorithms, such as autoencoders (AEs), convolutional neural networks (CNNs), and recurrent neural networks (RNNs), can act as feature extractors and classifiers. CNNs are especially effective in identifying spatial patterns from images. RNNs are known to be capable of extracting discriminative patterns from time signals. In Truong et al. (2018), a CNN model, used to extract features from spectrograms to classify EEG signals into interictal and preictal periods, achieved a sensitivity of 81.2% with sEEG signals and of 75% with iEEG signals, which was a surprising finding, because iEEG had deemed to have better precision. A recurrent CNN model was used in Thodoroff et al. (2016) to learn the spatially invariant representation of seizures, which improved the results of seizure detection. In Movahedi et al. (2017), a deep belief network was designed to extract features from EEG signals for various applications, including emotion recognition, sleep stage classification, and seizure detection. Lastly, in Jiang et al. (2017), a transfer learning strategy was applied to tackle the problem of data shortage for training and testing data in seizure detection.
In Toraman (2020), a method was proposed for identifying preictal and interictal events in EEG recordings taken 30 min prior to the onset of seizures. The article also analyzed the four channels of EEG recordings separately to obtain channel-specific insights into preictal and interictal activity. Daoud and Bayoumi (2019) introduced a channel selection algorithm in their proposed system, making it suitable for real-time usage. Robustness was ensured through practical testing, and they achieved the highest accuracy of 99.6% using the CHB MIT dataset. Chandu and Fathimabi [43] demonstrated that learning provides superior outcomes compared to AI algorithms. Specifically, LSTM (long short-term memory) showed higher accuracy compared to other machine learning algorithms such as SVMs and random forests.
In this article, a multiresolution convolutional neural network (MRCNN) method is proposed for forecasting EEG seizure events. Maximal overlapping discrete wavelet transform (MODWT) is used to find multiresolution bands: delta (δ, 0–4 Hz), theta (θ, 4–8 Hz), alpha (α, 8–15 Hz), beta (β, 15–30 Hz), and gamma (γ, 30–120 Hz). The gamma subband is extended from 60 to 120 Hz to capture some of the ripples that are deemed important features of the disease (range maintained only modestly high to align with commonly restricted sampling rates used in the electrodiagnostic testing of epilepsy). A set of 1D CNN networks, one for each signal band, is then designed to classify the preictal EEG period as “pre-seizure” or “normal.” This is the first time that deep 1D-CNNs have been applied to forecast seizure events from EEG measurements. We demonstrate through experimentation that integrating MODWT, which is used to preprocess raw EEG signals into subbands, with parallel 1D CNNs is an effective method for seizure prediction. The proposed method is compared with those reported in the literature by testing on both sEEG and iEEG signals.
2 Methodology
2.1 System overview
A detailed description of the proposed method for seizure event forecasting is given in this section. The system diagram shown in Figure 2 consists of the following functional blocks: MODWT, Subband Separation, Multiresolution 1D-CNNs (MRCNN), and Post-Processing.
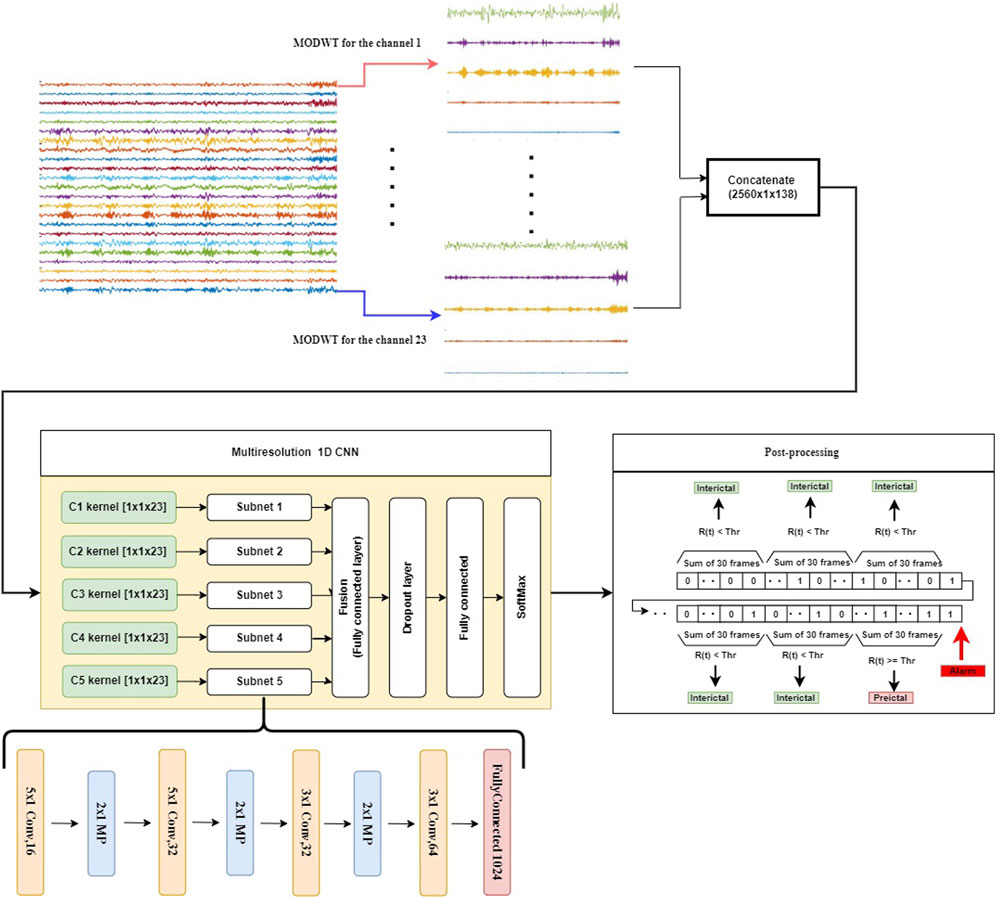
FIGURE 2. The proposed seizure prediction system consists of the following components: decomposition of the input into subbands (top panel), extracting discriminative patterns from individual subbands using CNNs, detecting preictal periods with a frame size of 10 s using a softmax classifier (yellow frame, center-left panel), and accumulating the detection results to produce a decision in a sliding window of 5-min duration (center-right panel). A dropout layer is used in this model to overcome the overfitting problem. To reduce the FPR during the interictal period, we add a post-processing step that accumulates the results from 30 consecutive 10-s time frames.
In the proposed method, the EEG or iEEG signal is first decomposed into subbands by using MODWT. Such a decomposition depends on the sampling frequency of the EEG signal. To ensure the effectiveness of the approach, different wavelet types were investigated. Daubechies wavelet of order 4 (Db4) produced superior results, which was then chosen for the subsequent experimental study. Moreover, the level of decomposition depends on the sampling frequency of the EEG signal, which is estimated by the following equation: fs/2n−1 ≈ 4, where fs is the sampling frequency, and n is the decomposition level. In case of the CHB-MIT dataset, the decomposition level n is 5, since fs in this case is 256. It produces a total of seven groups of wavelet coefficients, each corresponding to a frequency band of brain electrical activity: D1 (64–128 Hz), D2 (32–64 Hz), D3 (16–32 Hz), D4 (8–16 Hz), D5 (4–8 Hz), and A5 (0–4 Hz). This correlates with the EEG spectrum that falls within the following five frequency bands: delta (1–4 Hz), theta (4–8 Hz), alpha (8–13 Hz), beta (15–30 Hz), and gamma-band oscillations (
After the signal is decomposed into six bands, each of which is fed to a multiresolution 1D-CNN to learn the intrinsic patterns of seizure. The outputs of these CNNs (i.e., classifying each band) are then fused by a fully connected layer, and then a SoftMax layer is used to classify a signal segment of each 10-s frame into either 0 or 1. Following this, outputs of 30 consecutive frames are added together, and the sum is compared to a preset threshold value, which yields a decision to classify each 5-min sliding window into either the preictal period or the interictal period.
2.2 Dataset
In this study, two datasets are used to evaluate the effectiveness of the proposed method for seizure forecasting: the CHB-MIT scalp EEG dataset Shoeb (2009) and the American Epilepsy Society Seizure Prediction Challenge (Kaggle) dataset Brinkmann et al. (2016).
The CHB-MIT dataset is grouped into 24 cases and were collected from 23 subjects. Case number designations range from chb01 to chb24, as shown in Figure 3. Case chb01 is from the same subject as chb21, where chb21 is a recording 1.5 years after chb01. Since chb01 and chb21 are separated significantly from each other chronologically, their data characteristics should not be assumed to be similar. For this reason, chb01 and chb21 are considered to be separate cases in this study. For each case, there were multiple EEG recordings. The beginning and end of each seizure were annotated in the seizure annotation files by experts epileptologists and serve as a gold standard in this project. In total, there are 982.9 h of EEG data in the corpus, containing 198 seizure episodes. The data have been divided for each subject into multiple files of 1-h recordings. The sampling frequency of this dataset is 256 samples per second. The dataset holds diverse seizure types, including simple partial (SP), complex partial (CP), and generalized tonic–clonic (GTC) seizures from various locations in the brain. These locations include the frontal (F), temporal (T), and occipital (O) lobes on either hemisphere of the brain (Nasehi and Pourghassem, 2013).
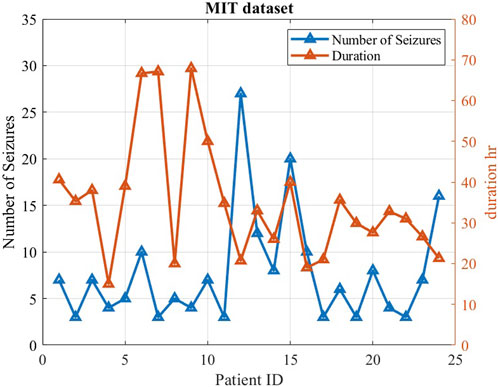
FIGURE 3. Characteristics of the MIT dataset, including seizure number and duration for each case. Each case included a minimum of three seizures.
The second dataset is part of an online competition through Kaggle.com Brinkmann et al. (2016). This dataset has seven subjects: two human patients and five dogs. The dataset was recorded in the form of a 10-minutes-long iEEG, obtained by positioning electrodes on the surface of cerebral cortex and measuring electrical signals sampled at 400 Hz in the case of dogs and 4,000 Hz in the case of human patients (Figure 4).
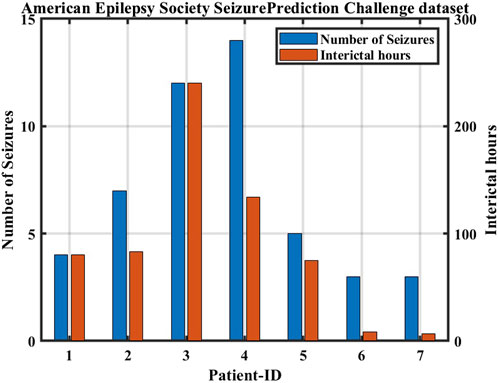
FIGURE 4. Characteristics of the American epilepsy society seizure prediction challenge dataset.
2.3 Maximal overlap discrete wavelet transform
MODWT is similar to discrete wavelet transform (DWT) in that low-pass and high-pass filters are applied to the input signal at each level. However, MODWT does not decimate the coefficients, and the number of wavelets and scaling coefficients are same as the number of samples at every level of the transform. In other words, MODWT does not down-sample the output at each scale and insert zeros between coefficients. For this reason, MODWT is also called non-decimated DWT, stationary DWT (Percival and Walden, 2000), translation-invariant DWT, and time-invariant DWT (Cornish et al., 2006). MODWT loses orthogonality and efficiency in computation. However, it has some advantages over DWT, which are summarized below:
1. It can handle any sample size n.
2. Its approximation and detail coefficients are associated with zero-phase filters.
3. It is translation invariant, because a shift in the signal does not change the pattern of the wavelet transform coefficients.
4. It produces a more asymptotically efficient wavelet variance estimator than DWT.
2.4 Multiresolution 1D-CNN
The data representation in the wavelet domain is mainly composed of signal components at different frequency resolutions, meaning that most signal characteristics are reflected by intra-component patterns, not inter-component behaviors. Therefore, we propose a novel structure of CNN to extract features from each wavelet component and effectively learn underlying patterns from each subband of MODWT. We name this multiresolution CNN, which consists of several 1D-CNNs in parallel to learn input patterns at different frequency bands, as shown in Figure 2. The structure of each subnet (1D-CNN) is determined mainly by the following considerations: size of MODWT filters, number of filter banks, number of convolutional layers, number of hidden neurons in the fully connected layer, and dropout rate in the dropout layer. “Dropout” here is equivalent to “down sample.” The dropout layer here is used to prevent overfitting. We first design a specific convolutional layer with constant weights to extract a specific resolution to train the subnet. Then, each subnet is implemented with multiple 1D convolution layers with max-pooling. Specifically, in each convolutional layer, there are 16 kernels. The size of each kernel is 5 × 1. These are followed by max-pooling of stride 2. For each subband, this process is repeated twice with a set of reduced-size (3 × 1) kernels. Each of the subnets is then connected to a fully connected layer of 1,024 neurons, which is followed by a dropout layer and then another fully connected layer, as shown in Figure 5. The output layer uses softmax activation to represent a categorical probability distribution of 10-s signal segments. For each 10-s frame, a binary threshold operation is conducted by comparing the output of the softmax layer with a preset threshold value between 0 and 1.
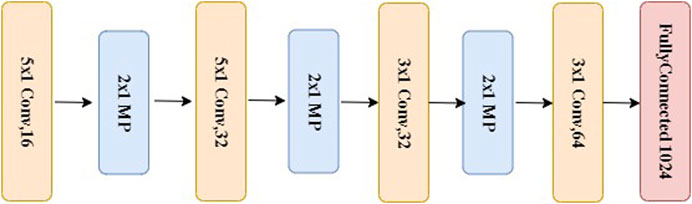
FIGURE 5. The structure of a subnet used for each of the subband signal, which is the same as the bottom portion of the system depicted in Figure 2.
2.5 Post-processing stage
In this study, the output of each 1D-CNN is computed from a sliding time frame of 10 s. The results of the n frames are then used to compute the following measure:
where yi is the output of the ith 10-s frame, and R(t) represents the number of preictal samples in a 5-min interval. Thus, n is 30 in this case.
The decisions for each 5-min window were computed using the following equation:
where Thr is a preset threshold value. As shown in Figure 6, the summation R(t) over each 5-min sliding window is compared with the threshold Thr. If R(t) is greater than the threshold, the 5-min time interval is considered to be in a preictal period.
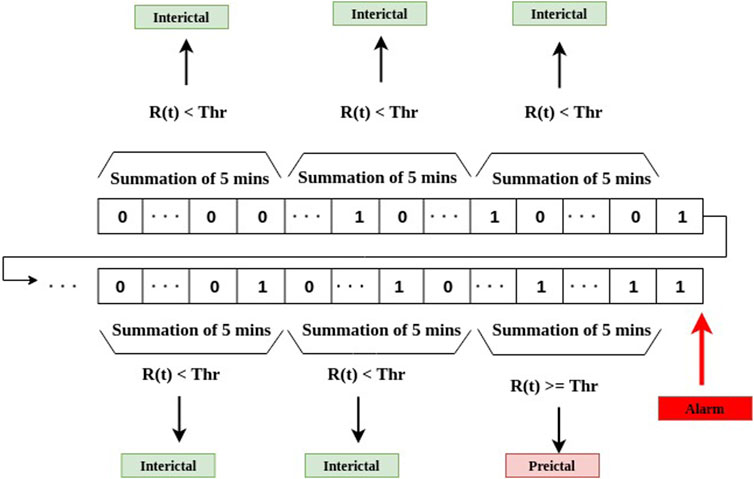
FIGURE 6. The stage of post-processing for decision-making as the final stage of the system depicted in Figure 2.
3 System evaluation
The performance of the proposed method was assessed using the following procedure for each subject. If a subject has N seizures, we pick up one seizure with the interictal region and set aside for testing. We then use the rest (N-1) of the seizure episodes for training and validation, with 60% of the training data for training and 40% for validation. After the training phase is complete, the one-seizure test data is used to evaluate the performance of the resulting model. We repeat this for all the seizure episodes for the assessment of the approach’s overall performance.
The following parameters are used to evaluate our proposed approach:
Seizure Occurrence Period (SOP): the time period within which a seizure is expected after a prediction alarm; in our case, we choose 30 min Shokouh Alaei et al. (2019); Yan et al. (2022).
Seizure Prediction Horizon (SPH): a time interval between any prediction alarm and the beginning of SOP. During SPH, no seizure is expected to occur, as depicted in Figure 7, and in our case, we choose an SPH equal to 5 min Shokouh Alaei et al. (2019); Yan et al. (2022).
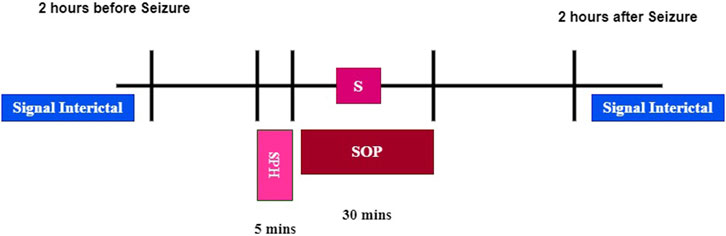
FIGURE 7. Seizure occurrence period (SOP) and seizure prediction horizon (SPH).
Sensitivity: The percentage of correctly predicted seizures over the total number of predicted seizures, which can be calculated as follows:
where Np is the number of seizures with at least one alarm within the SPH, and NT is the total number of seizures.
False Prediction Ratio (FPR/h): The ratio of the number of false positives divided by the duration of the interictal data (preictal periods are excluded). A false positive is defined as a prediction flag not followed by a seizure within the seizure occurrence period (Truong et al., 2018).
Portion of Time under false predictions (POT) in minutes: The duration of the interictal data containing false predictions. In this work, this metric is reported as the time period of seizure-free interictal data included in the testing set. The metrics are used to test the proposed prediction model in addition to sensitivity and FPR/h.
In the experimental study, we will also compare the performance of the proposed model with those obtained using the random and periodical prediction method as described by Winterhalder et al. (2003). The sensitivity of the random prediction method based on a Poisson process was obtained from a binomial distribution, with the probability defined as:
where FPRmax is the maximum false prediction rate. Thus, the probability of predicting at least m of M independent seizures is given by:
We calculate p for each patient by using the FPR of that patient and the number of seizures (m) predicted by our method. If p is less than 0.05, we can conclude that our prediction method is significantly better than a random predictor at a significance level of 0.05 (Truong et al., 2018).
4 Results and discussions
In most classification tasks, one of the challenges is to tackle the issue of dataset imbalance. In the CHB-MIT dataset, the ratio of interical samples to preictal samples is 20:1. To solve this issue, we created more preictal samples by extracting overlapping time frames in the training phase. We generated more preictal samples for training by sliding a 10-s frame along the time axis at every step over the preictal EEG signals, the overlapping window is chosen to be 90%, as shown in Figure 8.
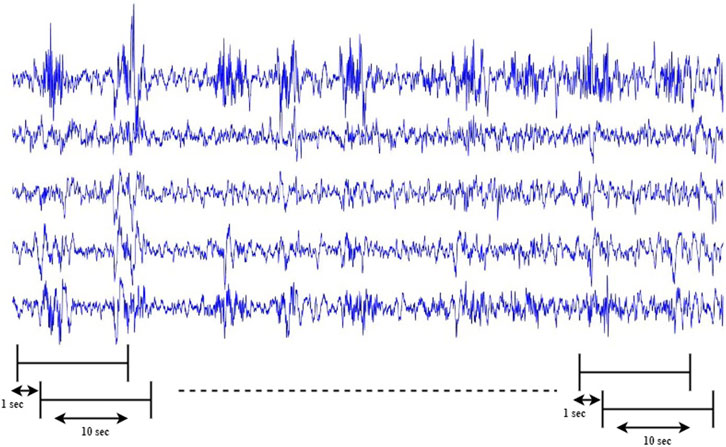
FIGURE 8. Generating extra preictal segments to balance the training dataset by sliding a 10-s frame along the time axis at every step S over preictal signals. S is chosen per subject so that there are a similar number of samples per class (preictal or interictal) in the training set.
It is important that for seizure prediction, one needs to be patient-specific, i.e., one prediction model for each patient. This is because preictal data varies from one patient to another and in the evolution of the disease over the years for specific patients. Using a patient-specific method tends to produce better prediction results. In this study, interictal and preictal measurements for a particular patient were divided into subsets of training, validation, and testing. There was no cross-testing performed across patients, which means that training, validation, and testing signals for a particular model were taken from the same patient.
As has been mentioned, the proposed method was tested using two different datasets: the CHB-MIT sEEG dataset and the American Epilepsy Society Seizure Prediction Challenge iEEG dataset. For both datasets, we used SOP of 30 min and SPH of 5 min to calculate sensitivity (S) and FPR/h.
The prediction results for each patient obtained by using the proposed method with the CHB-MIT dataset are reported in Figures 9–11. The average prediction sensitivity is 82%, and the average FPR is 0.058. For the American Epilepsy Society Seizure Prediction Challenge dataset, the overall sensitivity is 85%, and FPR is 0.19. The average validation accuracy for the CHB-MIT dataset is 93.1 ± 2.3, and the average testing accuracy is 85.114 ± 3.6.
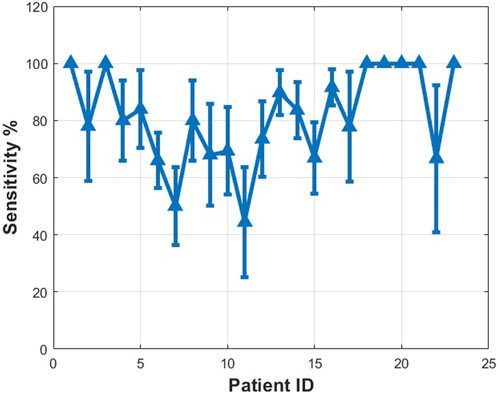
FIGURE 9. Measured sensitivity for different patients using proposed algorithms (MIT dataset scalp EEG). See details in text.
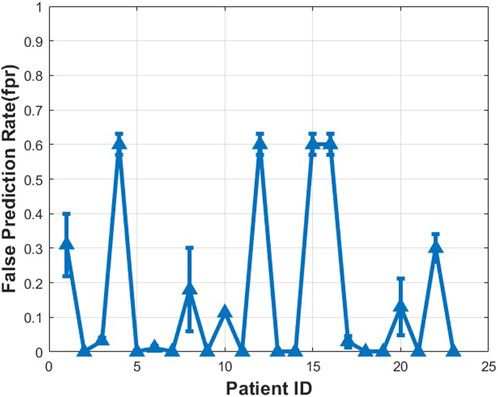
FIGURE 10. Measured false prediction rate (false alarm) for different patients using proposed algorithms (CHB-MIT dataset scalp EEG).
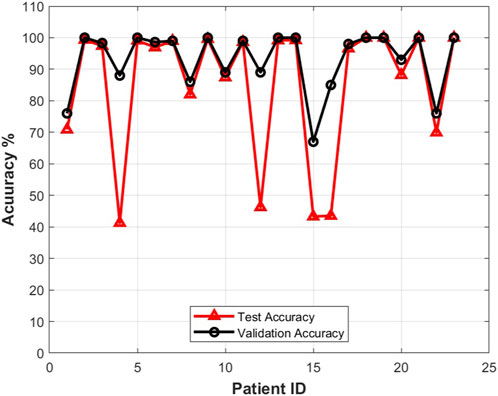
FIGURE 11. Testing accuracy vs. validation accuracy for different patients using the proposed approach with the CHB-MIT dataset scalp EEG dataset.
For the CHB-MIT dataset, the p value was calculated for the worst case for each patient with minimum sensitivity. The proposed seizure prediction approach achieved significantly better performance than an unspecific random predictor for all patients except Pat11, who had a p value of 0.059, in which case it was only marginally better than the random predictor’s. For the Kaggle dataset, the proposed seizure prediction approach achieved significantly better performance than an unspecific random predictor for all subjects except Patient 2, whose results were only marginally better than the random predictor’s, as shown in Table 1.
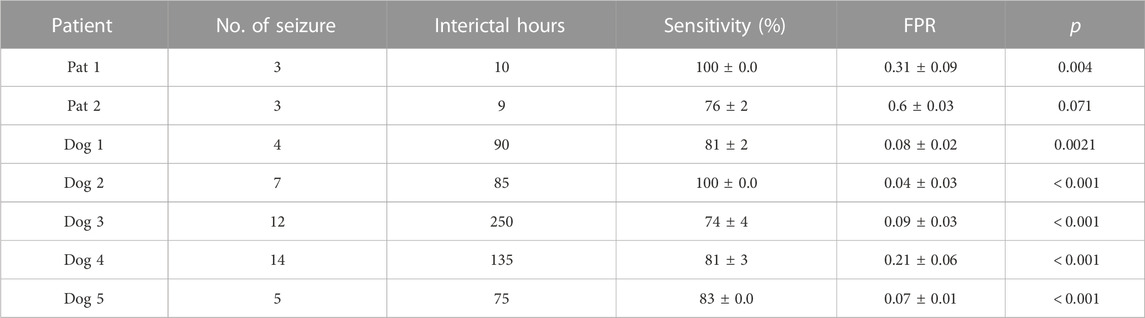
TABLE 1. Seizure prediction results obtained with the American Epilepsy Society Seizure Prediction Challenge dataset. The seizure occurrence period (SOP) was 30min, and the seizure prediction horizon (SPH) was 5 min.
It should be noted that a proper setting of the threshold for raising alarms influences the prediction results. If it is too high, the sensitivity of the model will be low, and if it is too low, the model suffers high false prediction rates. A trade-off is necessary in setting the threshold values. In our case, we set two threshold values: the first one is for deciding if a 10-s frame is in an interictal period (0) or in a preictal period (1). The second one, Thr, leads to a final decision to determine if a 5-min window is preictal or not. Our experiments showed that the first threshold is 0.6, and the second threshold is 2, against which R(t) is compared. Those threshold values were selected based on examining the CHB-MIT and Kaggle datasets. Moreover, these values were adjusted on the validation data not the testing data.
Figure 12 shows the alarm generation of the CHB-MIT dataset for a particular patient (patient 2). Similar results were obtained for other patients. The effect of post-processing thresholding mitigates the false alarm rate. The proposed algorithm successfully locates the preictal region and generates an alarm signal 30 min before the seizure starts.

FIGURE 12. Alarm generation for patient 2 of CHB-MIT dataset. The top plot shows the result of classifications with 10-s intervals, and the bottom plot shows that an alarm is generated at 11:05, which is about 30 min ahead of the seizure episode, represented by the light red rectangle.
Table 2 shows a comparison between the proposed approach and state-of-the-art approaches in seizure prediction. It needs to be emphasized that some of the approaches reported in the literature used handcrafted features, and most earlier results used the FB dataset, which is no longer publicly available. Moreover, some existing methods used zero SPH, and others used 5-min or 10-min SPH. The method used by Truong et al. (2018) achieved a sensitivity of 81.2% and an FPR of 0.16 for the selected 13 patients from the CHB-MIT dataset and 75% and 0.21 for the Kaggle dataset. On the other hand, the proposed method achieved a sensitivity of 90.2% and an FPR of 0.0713 for the same 13 patients from the CHB-MIT dataset. The main advantage of our method is that our model is able to extract features from individual frequency bands.
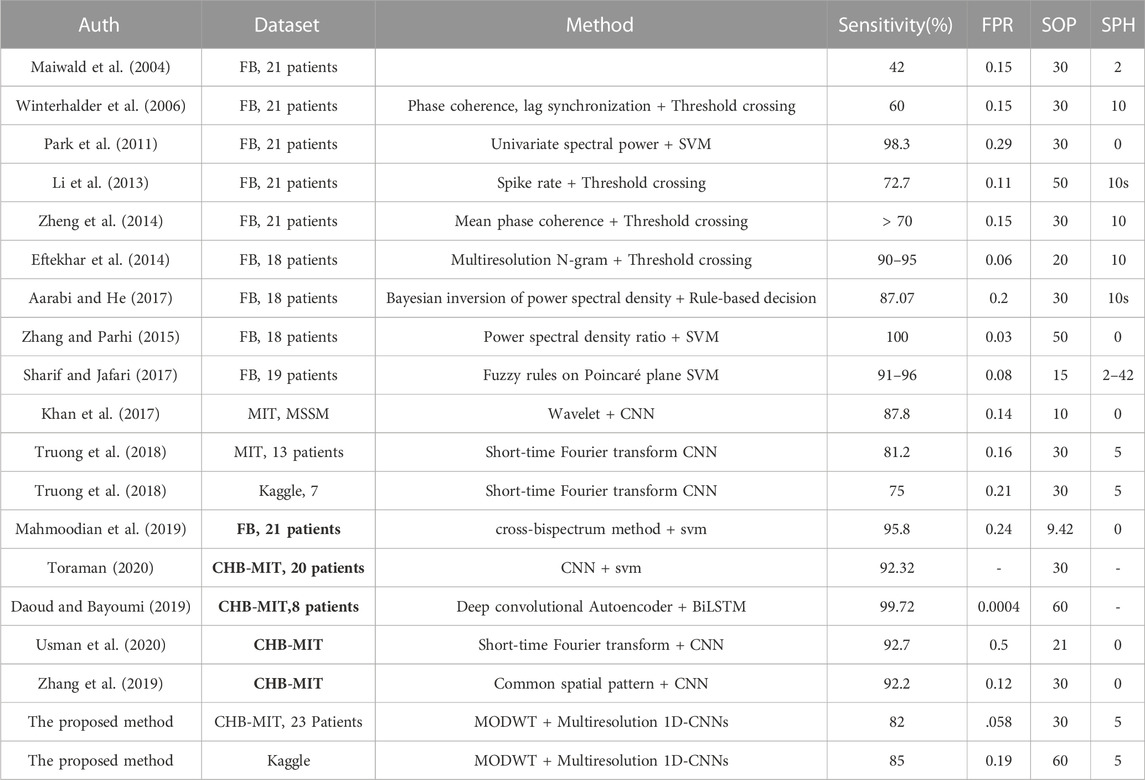
TABLE 2. Benchmark of recent seizure prediction approaches and this work.
5 Conclusion
This article developed a novel approach for integrating maximum overlapping discrete wavelet transform with multiresolution 1D CNNs to classify the preictal and interictal periods of EEG signals. In this approach, input signals are first divided into 10-s frames, which are further decomposed into a number of frequency bands. Each of the subband signals is then fed into a 1D CNN to produce discriminative features for the particular subband. These feature vectors are then fused with a fully connected layer and a dropout layer, as well as a softmax layer to determine if the 10 frame is preictal or not. An accumulation of these 10-s results over 5 min produces a final decision as to whether the input signal in this 5-min window is preictal or interictal. Experimental studies show that the prediction model works well with both sEEG and iEEG signals.
The proposed approach was tested with two popular epilepsy patient datasets: CHB-MIT and Kaggle. It is important to emphasize that the proposed method works best with both iEEG data and sEEG data without any artifact removal. It achieved a sensitivity of 82% and a false prediction rate of 0.058 with the CHB-MIT dataset and a sensitivity of 85% and a false prediction rate of 0.19 with the Kaggle dataset. An advantage of the proposed method, similarly to other data-driven approaches, is that it does not need a handcrafted feature extraction procedure. A uniqueness of the method is the use of the subband concept. Input signals are first decomposed into five subbands, and the results from all of these subbands are then fused with a fusion mechanism. Future work should include exploring the effectiveness of using randomized feature extractors and classifiers, which compete with one another, to produce a more robust performance.
A limitation of the multichannel 1D CNN model is that it does not provide a clear picture of which CNN features belongs to which signal channel or signal band, which reduces its interpretability. The CNN features take a collective effect of all the channels and all the bands. The fact that the problem involves multiple channels and multiple bands makes the issue more difficult to address. One idea is to mask out a particular channel/band to monitor its effect on the performance of the CNN model. However, this is a brute-force approach. A future study is warranted for improving the interpretability of the multichannel 1D CNN model. In addition, we did not isolate and remove artifacts in this study, which can be included in future work.
Data availability statement
Publicly available datasets were analyzed in this study. This data can be found here: https://www.kaggle.com/competitions/seizure-prediction/data.
Author contributions
Conceptualization, AI and HZ; methodology, AI and HZ; software, AI; validation, HZ, AI, and ET; formal analysis, AI,; writing—original draft preparation, AI, HZ, ET, NE, and AM; supervision, HZ, NE, and ET. All authors contributed to the article and approved the submitted version..
Conflict of interest
The authors declare that the research was conducted in the absence of any commercial or financial relationships that could be construed as a potential conflict of interest.
Publisher’s note
All claims expressed in this article are solely those of the authors and do not necessarily represent those of their affiliated organizations, or those of the publisher, the editors and the reviewers. Any product that may be evaluated in this article, or claim that may be made by its manufacturer, is not guaranteed or endorsed by the publisher.
References
Aarabi, A., and He, B. (2014). Seizure prediction in hippocampal and neocortical epilepsy using a model-based approach. Clin. Neurophysiol. 125, 930–940. doi:10.1016/j.clinph.2013.10.051
Aarabi, A., and He, B. (2017). Seizure prediction in patients with focal hippocampal epilepsy. Clin. Neurophysiol. 128, 1299–1307. doi:10.1016/j.clinph.2017.04.026
Bandarabadi, M., Teixeira, C. A., Rasekhi, J., and Dourado, A. (2015). Epileptic seizure prediction using relative spectral power features. Clin. Neurophysiol. 126, 237–248. doi:10.1016/j.clinph.2014.05.022
Behnoush, B., Bazmi, E., Nazari, S., Khodakarim, S., Looha, M., and Soori, H. (2021). Machine learning algorithms to predict seizure due to acute tramadol poisoning. Hum. Exp. Toxicol. 40, 1225–1233. doi:10.1177/0960327121991910
Brinkmann, B. H., Wagenaar, J., Abbot, D., Adkins, P., Bosshard, S. C., Chen, M., et al. (2016). Crowdsourcing reproducible seizure forecasting in human and canine epilepsy. Brain 139, 1713–1722. doi:10.1093/brain/aww045
Brinkmann, B. H., Karoly, P. J., Nurse, E. S., Dumanis, S. B., Nasseri, M., Viana, P. F., et al. (2021). Seizure diaries and forecasting with wearables: Epilepsy monitoring outside the clinic. Front. Neurol. 12, 690404. doi:10.3389/fneur.2021.690404
Cornish, C. R., Bretherton, C. S., and Percival, D. B. (2006). Maximal overlap wavelet statistical analysis with application to atmospheric turbulence. Boundary-Layer Meteorol. 119, 339–374. doi:10.1007/s10546-005-9011-y
da Silva, F. H. L. (2008). The impact of eeg/meg signal processing and modeling in the diagnostic and management of epilepsy. IEEE Rev. Biomed. Eng. 1, 143–156. doi:10.1109/rbme.2008.2008246
Daoud, H., and Bayoumi, M. A. (2019). Efficient epileptic seizure prediction based on deep learning. IEEE Trans. Biomed. Circ. Syst. 13, 804–813. doi:10.1109/tbcas.2019.2929053
Dominguez, L. G., Wennberg, R. A., Gaetz, W., Cheyne, D., Snead, O. C., and Velazquez, J. L. P. (2005). Enhanced synchrony in epileptiform activity? Local versus distant phase synchronization in generalized seizures. J. Neurosci. 25, 8077–8084. doi:10.1523/jneurosci.1046-05.2005
Duncan, J. S., Sander, J. W., Sisodiya, S. M., and Walker, M. C. (2006). Adult epilepsy. Lancet 367, 1087–1100. doi:10.1016/s0140-6736(06)68477-8
Eftekhar, A., Juffali, W., El-Imad, J., Constandinou, T. G., and Toumazou, C. (2014). Ngram-derived pattern recognition for the detection and prediction of epileptic seizures. PloS one 9, e96235. doi:10.1371/journal.pone.0096235
Fiest, K. M., Sauro, K. M., Wiebe, S., Patten, S. B., Kwon, C.-S., Dykeman, J., et al. (2017). Prevalence and incidence of epilepsy: A systematic review and meta-analysis of international studies. Neurology 88, 296–303. doi:10.1212/wnl.0000000000003509
Fisher, R. S., Boas, W. V. E., Blume, W., Elger, C., Genton, P., Lee, P., et al. (2005). Epileptic seizures and epilepsy: Definitions proposed by the international league against epilepsy (ilae) and the international bureau for epilepsy (ibe). Epilepsia 46, 470–472. doi:10.1111/j.0013-9580.2005.66104.x
Gadhoumi, K., Lina, J.-M., Mormann, F., and Gotman, J. (2016). Seizure prediction for therapeutic devices: A review. J. Neurosci. Methods 260, 270–282. doi:10.1016/j.jneumeth.2015.06.010
Ihle, M., Feldwisch-Drentrup, H., Teixeira, C. A., Witon, A., Schelter, B., Timmer, J., et al. (2012). Epilepsiae–a European epilepsy database. Comput. Methods Programs Biomed. 106, 127–138. doi:10.1016/j.cmpb.2010.08.011
Janse, S. A., Dumanis, S. B., Huwig, T., Hyman, S., Fureman, B. E., and Bridges, J. F. (2019). Patient and caregiver preferences for the potential benefits and risks of a seizure forecasting device: A best–worst scaling. Epilepsy Behav. 96, 183–191. doi:10.1016/j.yebeh.2019.04.018
Jiang, Y., Wu, D., Deng, Z., Qian, P., Wang, J., Wang, G., et al. (2017). Seizure classification from eeg signals using transfer learning, semi-supervised learning and tsk fuzzy system. IEEE Trans. Neural Syst. Rehabil. Eng. 25, 2270–2284. doi:10.1109/tnsre.2017.2748388
Jiruska, P., De Curtis, M., Jefferys, J. G., Schevon, C. A., Schiff, S. J., and Schindler, K. (2013). Synchronization and desynchronization in epilepsy: Controversies and hypotheses. J. Physiol. 591, 787–797. doi:10.1113/jphysiol.2012.239590
Khan, H., Marcuse, L., Fields, M., Swann, K., and Yener, B. (2017). Focal onset seizure prediction using convolutional networks. IEEE Trans. Biomed. Eng. 65, 2109–2118. doi:10.1109/tbme.2017.2785401
Klatt, J., Feldwisch-Drentrup, H., Ihle, M., Navarro, V., Neufang, M., Teixeira, C., et al. (2012). The epilepsiae database: An extensive electroencephalography database of epilepsy patients. Epilepsia 53, 1669–1676. doi:10.1111/j.1528-1167.2012.03564.x
Li, S., Zhou, W., Yuan, Q., and Liu, Y. (2013). Seizure prediction using spike rate of intracranial eeg. IEEE Trans. Neural Syst. Rehabil. Eng. 21, 880–886. doi:10.1109/tnsre.2013.2282153
Li, J., Zhou, W., Yuan, S., Zhang, Y., Li, C., and Wu, Q. (2016). An improved sparse representation over learned dictionary method for seizure detection. Int. J. Neural Syst. 26, 1550035. doi:10.1142/s0129065715500355
Mahmoodian, N., Boese, A., Friebe, M., and Haddadnia, J. (2019). Epileptic seizure detection using cross-bispectrum of electroencephalogram signal. Seizure 66, 4–11. doi:10.1016/j.seizure.2019.02.001
Maiwald, T., Winterhalder, M., Aschenbrenner-Scheibe, R., Voss, H. U., Schulze-Bonhage, A., and Timmer, J. (2004). Comparison of three nonlinear seizure prediction methods by means of the seizure prediction characteristic. Phys. D. Nonlinear Phenom. 194, 357–368. doi:10.1016/j.physd.2004.02.013
Margineanu, D. G. (2010). Epileptic hypersynchrony revisited. Neuroreport 21, 963–967. doi:10.1097/wnr.0b013e32833ed111
Moghim, N., and Corne, D. W. (2014). Predicting epileptic seizures in advance. PloS one 9, e99334. doi:10.1371/journal.pone.0099334
Mormann, F., Andrzejak, R. G., Elger, C. E., and Lehnertz, K. (2006). Seizure prediction: The long and winding road. Brain 130, 314–333. doi:10.1093/brain/awl241
Movahedi, F., Coyle, J. L., and Sejdić, E. (2017). Deep belief networks for electroencephalography: A review of recent contributions and future outlooks. IEEE J. Biomed. health Inf. 22, 642–652. doi:10.1109/jbhi.2017.2727218
Nasehi, S., and Pourghassem, H. (2013). A novel fast epileptic seizure onset detection algorithm using general tensor discriminant analysis. J. Clin. Neurophysiology 30, 362–370. doi:10.1097/wnp.0b013e31829dda4b
Park, Y., Luo, L., Parhi, K. K., and Netoff, T. (2011). Seizure prediction with spectral power of eeg using cost-sensitive support vector machines. Epilepsia 52, 1761–1770. doi:10.1111/j.1528-1167.2011.03138.x
Percival, D. B., and Walden, A. T. (2000). Wavelet methods for time series analysis, 4. Cambridge University Press.
Sharif, B., and Jafari, A. H. (2017). Prediction of epileptic seizures from eeg using analysis of ictal rules on poincaré plane. Comput. Methods Programs Biomed. 145, 11–22. doi:10.1016/j.cmpb.2017.04.001
Shoeb, A. H. (2009). Application of machine learning to epileptic seizure onset detection and treatment. Ph.D. thesis. Massachusetts Institute of Technology.
Shokouh Alaei, H., Khalilzadeh, M. A., and Gorji, A. (2019). Optimal selection of sop and sph using fuzzy inference system for on-line epileptic seizure prediction based on eeg phase synchronization. Australas. Phys. Eng. Sci. Med. 42, 1049–1068. doi:10.1007/s13246-019-00806-w
Stojanović, O., Kuhlmann, L., and Pipa, G. (2020). Predicting epileptic seizures using nonnegative matrix factorization. PloS one 15, e0228025. doi:10.1371/journal.pone.0228025
Teixeira, C. A., Direito, B., Bandarabadi, M., Le Van Quyen, M., Valderrama, M., Schelter, B., et al. (2014). Epileptic seizure predictors based on computational intelligence techniques: A comparative study with 278 patients. Comput. Methods Programs Biomed. 114, 324–336. doi:10.1016/j.cmpb.2014.02.007
Thodoroff, P., Pineau, J., and Lim, A. (2016). “Learning robust features using deep learning for automatic seizure detection,” in Machine learning for healthcare conference, 178–190.
Toraman, S. (2020). Preictal and interictal recognition for epileptic seizure prediction using pre-trained 2dcnn models. Trait. Du. Signal 37, 1045–1054. doi:10.18280/ts.370617
Truong, N. D., Nguyen, A. D., Kuhlmann, L., Bonyadi, M. R., Yang, J., Ippolito, S., et al. (2018). Convolutional neural networks for seizure prediction using intracranial and scalp electroencephalogram. Neural Netw. 105, 104–111. doi:10.1016/j.neunet.2018.04.018
Usman, S. M., Khalid, S., and Aslam, M. H. (2020). Epileptic seizures prediction using deep learning techniques. Ieee Access 8, 39998–40007. doi:10.1109/access.2020.2976866
Viana, P. F., Pal Attia, T., Nasseri, M., Duun-Henriksen, J., Biondi, A., Winston, J. S., et al. (2022). Seizure forecasting using minimally invasive, ultra-long-term subcutaneous electroencephalography: Individualized intrapatient models. Epilepsia. doi:10.1111/epi.17252
Vossler, D. G. (2021). Forecasting seizure storms using epilepsy wristband sensors. Epilepsy Curr. 21, 99–101. doi:10.1177/1535759721990062
Winterhalder, M., Maiwald, T., Voss, H., Aschenbrenner-Scheibe, R., Timmer, J., and Schulze-Bonhage, A. (2003). The seizure prediction characteristic: A general framework to assess and compare seizure prediction methods. Epilepsy Behav. 4, 318–325. doi:10.1016/s1525-5050(03)00105-7
Winterhalder, M., Schelter, B., Maiwald, T., Brandt, A., Schad, A., Schulze-Bonhage, A., et al. (2006). Spatio-temporal patient–individual assessment of synchronization changes for epileptic seizure prediction. Clin. Neurophysiol. 117, 2399–2413. doi:10.1016/j.clinph.2006.07.312
Yan, J., Li, J., Xu, H., Yu, Y., and Xu, T. (2022). Seizure prediction based on transformer using scalp electroencephalogram. Appl. Sci. 12, 4158. doi:10.3390/app12094158
Zambrana-Vinaroz, D., Vicente-Samper, J. M., Manrique-Cordoba, J., and Sabater-Navarro, J. M. (2022). Wearable epileptic seizure prediction system based on machine learning techniques using ecg, ppg and eeg signals. Sensors 22, 9372. doi:10.3390/s22239372
Zhang, Z., and Parhi, K. K. (2015). Low-complexity seizure prediction from ieeg/seeg using spectral power and ratios of spectral power. IEEE Trans. Biomed. Circuits Syst. 10, 693–706. doi:10.1109/tbcas.2015.2477264
Zhang, Y., Guo, Y., Yang, P., Chen, W., and Lo, B. (2019). Epilepsy seizure prediction on eeg using common spatial pattern and convolutional neural network. IEEE J. Biomed. Health Inf. 24, 465–474. doi:10.1109/jbhi.2019.2933046
Keywords: epilepsy, seizure prediction, CNN, wavelet transform, multiresolution convolutional neural networks
Citation: Ibrahim AK, Zhuang H, Tognoli E, Muhamed Ali A and Erdol N (2023) Epileptic seizure prediction based on multiresolution convolutional neural networks. Front. Sig. Proc. 3:1175305. doi: 10.3389/frsip.2023.1175305
Received: 27 February 2023; Accepted: 27 April 2023;
Published: 30 May 2023.
Edited by:
Kyriaki Kostoglou, Graz University of Technology, AustriaReviewed by:
Johannes Sarnthein, University of Zurich, SwitzerlandBaha Şen, Yıldırım Beyazıt University, Türkiye
Copyright © 2023 Ibrahim, Zhuang, Tognoli, Muhamed Ali and Erdol. This is an open-access article distributed under the terms of the Creative Commons Attribution License (CC BY). The use, distribution or reproduction in other forums is permitted, provided the original author(s) and the copyright owner(s) are credited and that the original publication in this journal is cited, in accordance with accepted academic practice. No use, distribution or reproduction is permitted which does not comply with these terms.
*Correspondence: Ali K. Ibrahim, YWlicmFoaW0yMDE0QGZhdS5lZHU=