 Till Branß
 Jochen Aberle
 Bernd Hentschel2
- 1Leichtweiß-Institute for Hydraulic Engineering and Water Resources, Technische Universität Braunschweig, Braunschweig, Germany
- 2Hydraulic Engineering in Inland Areas, Federal Waterways Engineering and Research Institute (BAW), Karlsruhe, Germany
This study investigates the occurrence and dynamics of single row alternate bars forming in a particular reach of the sand bed Elbe River in Germany. Although the formation and dynamics of alternate bars have been intensively investigated in the literature, there exists only a limited number of studies focusing on the characteristics of alternate bars forming under complex field conditions. This is particular the case for bars forming in trained sand bed rivers, as most previous field studies have focused on gravel bed rivers. Moreover, little is known on the impact of river training structures on bar characteristics in anthropogenic rivers. To close this gap, we present a comprehensive bed elevation data set that was collected over a period of 10 years within a 30 km long reach of the lower Elbe River in Germany by the Federal Waterways and Shipping Administration (WSV). The reach is characterized by a sand bed, has curved as well as straight parts, and exhibits a section that is less trained by groins than the neighboring sections. For our analyses, we propose a novel approach to estimate bar characteristics based on statistically derived geometrical parameters. The outcomes of the approach are used to show that bars in Elbe River belong to the free bar type and that their origin of formation and characteristics depend on hydrological and geometrical boundary conditions. The results reveal that the active width of the river bed, defined as the distance between the groin heads, is a crucial parameter for the occurrence of alternate in the reach. We further highlight the impact of river bends on bar characteristics, as bars in the outer bend were longer and higher than their inner bend counterparts. Finally, we show that simple predictors for bar formation can be successfully applied to predict bar formation in sand bed rivers but that care needs to be taken when applying such approaches to more complex boundary conditions.
1. Introduction
Alternate bars, sometimes also referred to as periodic bars, are large scale morphological features that occur in natural as well as trained river sections. They consist of alternating sequences of individual static or highly mobile bars that may initiate river meandering and impact river morphodynamics due to their height and associated scours (e.g., Blondeaux and Seminara, 1985; Corenblit et al., 2020; Okitsu et al., 2021). Especially in trained river sections, alternate bars are of importance for river management. For example, migrating alternate bars pose a threat for navigation and may necessitate a continuous adjustment of fairways. Moreover, alternate bars have the potential to endanger the stability of river training structures like revetments and groins due to the depth of the associated scour holes (e.g., Bertagni and Camporeale, 2018; Carlin et al., 2021).
Alternate bars have been in the focus of research for a long time and have been investigated in physical scale model studies (e.g., Fujita and Muramoto, 1985; Garcia and Niño, 1993; Redolfi et al., 2020; Ishihara and Yasuda, 2022), numerical studies (e.g., Jang and Shimizu, 2005; Duró et al., 2016; Cordier et al., 2019), theoretical studies based on linear and weakly linear instability theories (e.g., Colombini et al., 1987; Nelson, 1990; Tubino et al., 1999; Federici and Seminara, 2006), and field studies (e.g., Jaeggi, 1984; Rodrigues et al., 2012, 2015; Eekhout et al., 2013; Adami et al., 2016). These studies led to the classification of “free bars” and “hybrid bars” based on the underlying formation processes. Free bars, which are usually highly mobile, form solely due to the instability of the riverbed (e.g., Ikeda, 1984; Jaeggi, 1984; Lanzoni, 2000a; Redolfi et al., 2020) and their celerity depends on grain size, energy slope and Shields number (Jang and Shimizu, 2005; Ishihara and Yasuda, 2022). Hybrid bars, on the other hand, form due to the combined effect of riverbed instabilities and a local forcing current induced, for example, by geometric singularities like a single groin or a point bar (e.g., Duró et al., 2016; Jourdain et al., 2020). In contrast to free bars, hybrid bars are mostly immobile as they are fixed in place by the local forcing and do not show a migration front (Cordier et al., 2019). However, they can exhibit elongations during their development that may be mistaken for movement (Claude et al., 2014). Another distinctive feature distinguishing both bar types is the wavelength λB, i.e., the distance between subsequent bar tops or scours. Free bars are typically characterized by wavelengths λB in the range of 3–6 times the river width B while hybrid bar wavelengths are in the order of magnitude of 10–15 B (e.g., Duró et al., 2016). Hybrid bars are more common in natural rivers than free bars due to the multitude of geometric singularities that induce a local forcing leading to their formation (Crosato et al., 2012; Crosato and Mosselman, 2020). On the other hand, free bars occur predominantly in trained river sections and their formation is often associated with initial river straightening and regulation works (e.g., Young, 1933; Jaeggi, 1984; Chang, 1985; Adami et al., 2016; Corenblit et al., 2020).
The width to depth ratio of the river main channel has been identified to be the dominating factor for the formation of alternate bars. This ratio is often described by the width to depth parameter β = 0.5B/H, where H denotes the water depth (e.g., Tubino, 1991; Redolfi et al., 2020). When β exceeds a threshold value βc, often approximated by a constant value of βc ≈ 10 (Crosato and Mosselman, 2020), free bars may occur in a river reach. However, βc depends on a number of parameters such as sediment characteristics, bed shear stress, and the channel curvature, and this is why there is no general approach available to determine this parameter unambiguously (e.g., Ahmari and Da Silva, 2011; Crosato and Mosselman, 2020; Redolfi, 2021). Moreover, if β >> βc, rivers may exhibit two or more rows of alternate bars (Figure 1A). The number of rows of alternate bars is described by the so-called bar mode m. In case of single row alternate bars, which are in the scope of the present study, m = 1. River sections with a bar mode of m = 2 are typically characterized by two rows of alternate bars, i.e., such sections exhibit additional mid channel bars. Rivers with higher modes show braided river structures (e.g., Ikeda, 1984; Blondeaux and Seminara, 1985; Crosato and Mosselman, 2009; Kleinhans and van den Berg, 2011; Rashid and Habib, 2022).
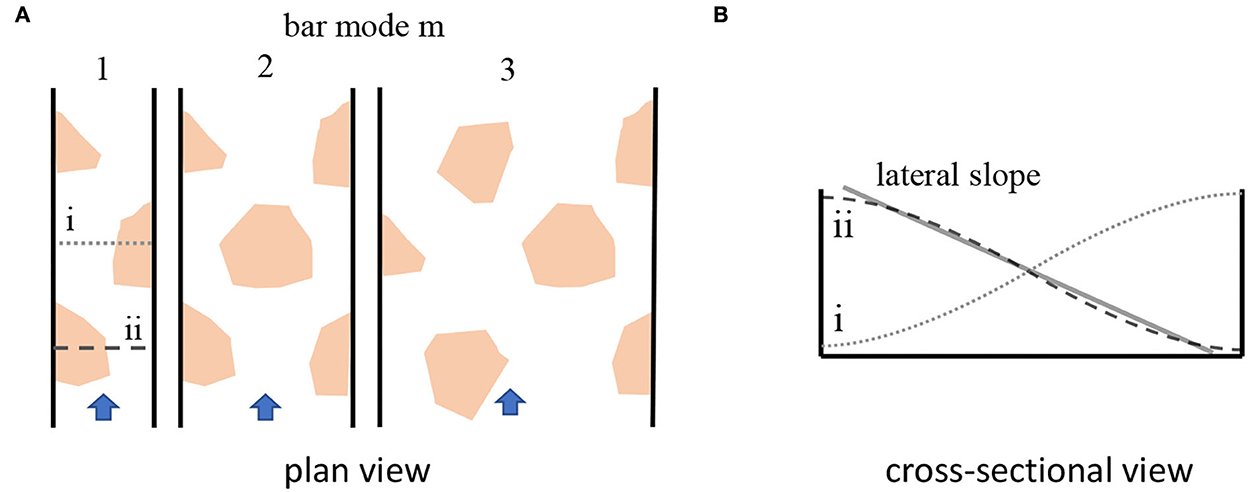
Figure 1. Sketch of alternate bars with different mode in plan view (A) and cross-sectional profile of single row alternate bars and definition of the lateral bed slope (B).
A prerequisite for the formation of free bars is active bed load transport. In gravel bed rivers like the upper Rhine River in Switzerland, bed load transport occurs primarily at higher discharges (Jaeggi, 1984; Adami et al., 2016). Bar characteristics in such environments are hence governed by the duration of the part of the flood wave during which the bed shear stress is large enough so that the sediment bed can be reworked (Tubino, 1991). This means that the grain size distribution of the bed material affects bar characteristics in gravel bed rivers as occasionally only a fraction of the bed material is transported (e.g., Lanzoni, 2000a,b; Crosato and Mosselman, 2020). In contrast, bed material of sand bed rivers like the Loire River in France or the lower Elbe River in Germany is transported at nearly all discharges, so that the grain size distribution of the bed material affects bar characteristics less. This is especially the case in sand bed rivers that are characterized by a uniform grain size distribution and transport of all fractions (Knaapen et al., 2001; Venditti et al., 2012), and bars in these environments may thus also form during low discharges (Rodrigues et al., 2012, 2015). Moreover, sand bed rivers transport an increasing part of bed material in suspension with increasing discharge. Studies based on linear theory (Tubino et al., 1999; Federici and Seminara, 2006; Bertagni and Camporeale, 2018) suggest that this may cause bars to become longer and higher, and that the threshold value βc decreases. This is due to the fact that the transport of suspended material is less affected by the lateral bed slope than bed load (c.f. Figure 1B). The lateral slope is known to dampen bar growth as it increases when bars grow higher and scours get deeper, so that bed load is increasingly directed toward the scour holes (e.g., Redolfi et al., 2020; Redolfi, 2021). This in turn limits the bar height which is commonly defined as the difference between the highest and lowest elevation of a bar unit. However, to the best of our knowledge, the effect of suspended load on bar characteristics has never been specifically investigated in physical model or field studies (c.f. Bertagni and Camporeale, 2018); an exception is the master thesis of Tewolde (2015).
River bends are another factor that have an impact on alternate bar characteristics. Experimental and theoretical studies showed that free bars can be suppressed in meandering river sections depending on meander wavelength, meander amplitude and hydraulic conditions (Tubino and Seminara, 1990; Seminara and Tubino, 1992; Whiting and Dietrich, 1993; Miwa and Nagayoshi, 1999; Tubino et al., 1999). At smaller curvature, free bars coexist with local forced bars i.e., point bars. Garcia and Niño (1993) as well as Whiting and Dietrich (1993) reported that, in this case, the celerity of free bars is locally reduced due to the superposition of both bar types. Moreover, Zolezzi et al. (2005) noted that that a single bend is not sufficient to impede bar migration. However, knowledge on the specific impact of river bends on geometrical characteristics of migrating alternate bars seems to be lacking.
From a river management point of view, it is important to predict the formation of alternate bars. Consequently, several predicting approaches have been developed based on empirical studies (e.g., Jaeggi, 1984; Yalin and Da Silva, 2001; Ahmari and Da Silva, 2011) and in particular on the linear stability theory (e.g., Struiksma et al., 1985; Colombini et al., 1987; Federici and Seminara, 2003). The applicability of empirical approaches is often limited by the boundary conditions of the data used for their derivation, and the application of linear theories is rather sophisticated (Redolfi, 2021). Therefore, simplified linear theory approaches were developed. The approach of Crosato and Mosselman (2009) makes use of the linear model of Struiksma et al. (1985) and allows to estimate the bar mode m. Initially developed for hybrid bars, it is also valid for free bars, and a single row of alternate bars is expected to form if 0.5 < m < 1.5 (Crosato and Mosselman, 2020). The approach by Redolfi (2021) builds upon the linear stability theory of Colombini et al. (1987) and was developed to determine the threshold parameter βc for free bars. It is worth noting that such approaches are generally applied to section averaged quantities and involve several simplifications and approximations. A particular issue is the definition of a formative discharge which is unknown for conditions with varying discharge, i.e., natural conditions (Jaballah et al., 2015; Carlin et al., 2021). Therefore, most approaches assume bank full discharge as the formative discharge (Carlin et al., 2021; Redolfi, 2021). This issue was recently addressed by Carlin et al. (2021) who developed an approach to calculate a probability for bar formation based on the probability density function (PDF) of the longtime discharge spectrum and the bar growth rate building upon the linear bar theory of Colombini et al. (1987).
Bar predictors can only be developed and tested based on data from laboratory and field observations. Hence their applicability is often limited to certain boundary conditions. One example is the empirical approach of Jaeggi (1984) that was developed for gravel bed rivers with low relative submergences (H/d; where d denotes the grain diameter) but provides no solution for sections with high relative submergences (c.f. Redolfi, 2021). Moreover, field data on alternate bars are sparse hampering the understanding of their formation under complex field conditions (e.g., Eekhout et al., 2013). This is especially the case for trained sand bed rivers, as most of the available field studies on alternate bars have focused on gravel bed rivers. Moreover, most scale model experiments on alternate bars used conditions resembling gravel bed rivers as the downscaling of sediment is limited. Data on alternate bars that form under high relative submergences (H/d) are therefore lacking.
Based on the aforementioned issues and identified open questions, the objective of this study is to investigate the occurrence and dynamics of single row alternate bars forming under complex field conditions in the trained German sand bed river Elbe. We investigate how river training, river curvature and hydrological conditions affect bar characteristics and if simple bar predictors are capable to forecast bar formation under such conditions. For this purpose, we analyze a comprehensive dataset of high-resolution echo sounder surveys to identify and characterize bars that form under high relative submergence conditions by applying a novel approach. The remainder of the manuscript is structured as follows: the research area, available data and methodology used for the analysis are presented in Section 2. The results are presented and discussed in Section 3 and Section 4 concludes the manuscript.
2. Study area and methodology
2.1. Study area and data basis
The bed topography data analyzed in this paper were collected in a 30 km long reach of the Elbe River (river kilometers Ekm 503.0–533.1) by the German Federal Waterways and Shipping Administration (WSV) on behalf of the German Federal Waterways Engineering and Research Institute (BAW). The reach, shown in Figure 2, is characterized by four successive bends (Ekm 503–507.5, Ekm 507.5–510, Ekm 510–517, and Ekm 517–522, respectively) which are followed by a nearly straight section (Ekm 523–533). The riverbed is composed of sand with a mean grain size of dm ≈ 1.2 mm, a coefficient of uniformity of d60 / d10 = 2.16, and has an average slope of S = 0.00012. The width of the main channel between the banks is fairly constant along the reach, but the active width of the riverbed, defined here as the distance between opposite groin heads, changes. The river section between Ekm 508–521, which is also known as the “Elbe-Reststrecke,” was historically not trained to the same extent as the neighboring sections being the reason why the active width of this reach corresponds to about 220 m. In contrast, the active width of the reaches upstream and downstream of Ekm 508 and 521 corresponds to approximately 175 and 180 m, respectively (cf. Figure 2).
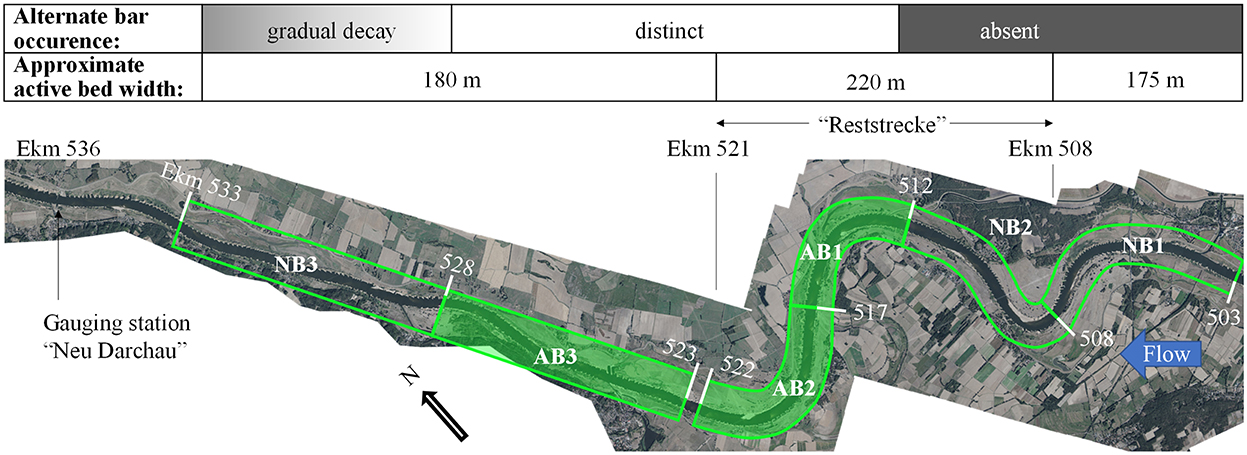
Figure 2. Overview of the investigated river sections NB1-3 and AB1-3, including the river kilometers, the approximate width of the active riverbed as well as the occurrence of alternate bars. Flow from right to left (Orthophoto courtesy of BAW).
Alternate bars are known to form at about Ekm 512 and to fade again downstream of Ekm 521. This offers the unique opportunity to test the applicability of bar predictors and to investigate bar characteristics considering different geometrical boundary conditions. For this purpose, the reach has been subdivided into six sections that are depicted in Figure 2. Three 5 km long sections (AB1, AB2 and AB3; marked by filled green frames in Figure 2) that are characterized by alternate bars are situated in and directly downstream of the Reststrecke and were used to characterize bars and to investigate the impact of the river course on bar characteristics. These sections range from Ekm 512–517 (AB1), Ekm 517–522 (AB2) and Ekm 523–528 (AB3) (the reason for the gap between Ekm 522 and 523 is explained below). Sections AB1 and AB2 cover a bend to the left and to the right, respectively, while section AB3 covers a straight section. We note that the bars propagate further downstream but fade with increasing distance to the Reststrecke, being the reason that they can only be identified occasionally in section NB3 (Ekm 528–533). The other two sections (NB1 and NB2), in which alternate bars were absent, cover the ranges from Ekm 503–508 and Ekm 508–512, respectively. The sections NB1, NB2, and NB3 were used to test the applicability of bar predictors (cf. Section 2.3).
The bed topography data used in this study were surveyed annually during the period from 2007 to 2016 by the WSV with the sounding vessel Kugelbake. The vessel was equipped with an Atlas Fansweep 20/200 multibeam echosounder with a measurement frequency of 200 kHz and a Trimble GPS-system using the federal Real Time Kinetics (RTK) service “SAPOS-HEPS.” The sections where surveyed in one or two parts on different dates which are given in the supplementary data section. The data were combined and post-processed by the WSV and made available for the present study in gridded form with a spatial resolution of 1 x 1 m (spatial reference system EPSG 31468). It must be noted that the echo sounder data exhibited gaps in 2013 (AB1 and AB2) and 2012 (AB3). These gaps were the reason for defining the sections AB2 and AB3 with a distance of 1 km (c.f. Figure 2). Moreover, the survey of AB1 in 2011 was omitted from further analyses as the time lag between the partial surveys was larger than 14 days which might bias the results.
Discharge and water levels were available from the records of the nearby gauging station “Neu Darchau” situated downstream at Ekm 536 (Figure 2) on the left channel side (GK coordinates E:4425900 N:5900611). According to DGJ (2014), the river has a drainage area of 131,950 km2 at the gauging station. The mean low discharge, mean discharge, and mean flood discharge correspond to MNQ = 276 m3/s, MQ =712 m3/s, and MHQ = 1,960 m3/s, respectively. The water stages W of MNW = 1.24 m, MW = 2.80 m and MHW = 5.78 m are given in relation to the gauge zero point (5.68 m above normal height null NHN) that corresponds to the mean bed elevation at the gauging site. Bankfull conditions in the investigated reach correspond to a water depth of ~5–6 m and prevail at discharges of ~2MQ–MHQ due to the locally varying floodplain elevations. The discharge and water levels at the gauging station are shown in Figure 3 for the period between 2006 and 2016 together with the dates of the echo sounder surveys for the sections AB1–AB3. We note that three major flood events, where MHQ was exceeded by approximately a factor of two, occurred in the investigated period in the years 2006, 2011 and 2013.
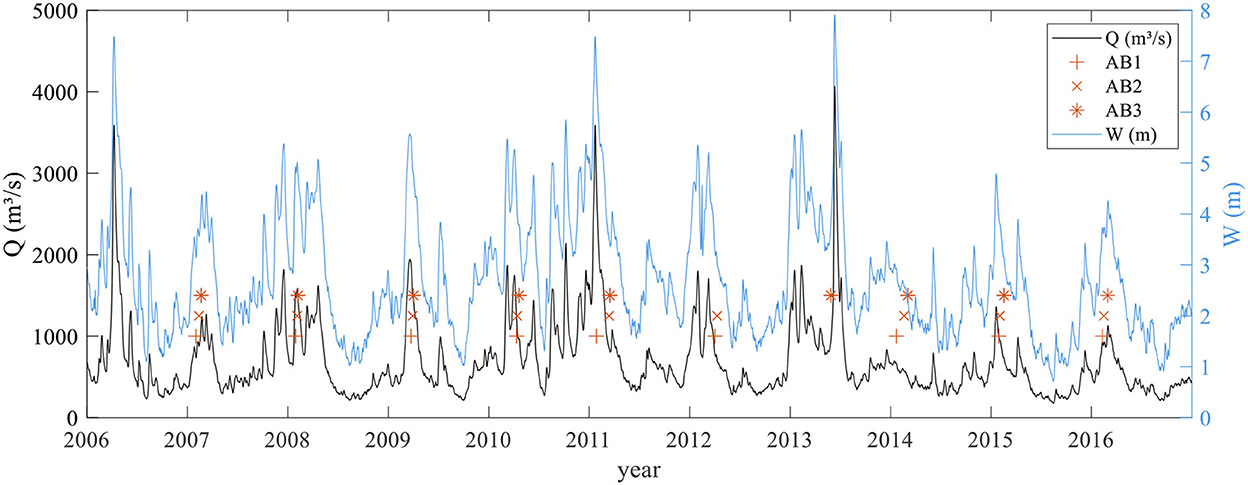
Figure 3. Discharge and water stage measured at the gauging station “Neu Darchau” in the years 2006–2016. Discharges are indicated by the black line, water levels by the blue line and the dates of the first echo sounder survey in the investigated sections AB1, AB2 and AB3 are marked by red crosses, x-symbols and asterisks, respectively.
2.2. Methodology
Most of the existing methods to analyze the geometry of alternate bars have been developed to characterize gravel bars in straight waterways or laboratory flumes. They require the characterization of individual bars which can be achieved by visually identifying every single bar complex from photographs and by local measurements of the bed elevation (e.g., Tubino, 1991; Garcia and Niño, 1993) or by determining an averaged bar geometry in the investigated reach (e.g., Redolfi et al., 2020). These methods could not directly be applied in the present study, since the investigated reach is characterized by four successive bends (Figure 2) hampering the spatial analysis of bed elevations, in general, and in particular of alternate bars due the channel curvature. Moreover, the investigated reach of the Elbe River is characterized by a sand bed, and bars in sand bed rivers are often superimposed by smaller bedforms (e.g., Colombini and Stocchino, 2012; Rodrigues et al., 2015; Le Guern et al., 2019). The resulting rather complex bed morphology therefore complicates the unambiguous identification of bar characteristics compared to gravel bars. A further approach found in the literature to characterize and track bars is the use of satellite imagery (e.g., Adami et al., 2016). However, this approach requires the visibility of the bars which, in case of trained sand bed rivers such as the Elbe River, is not necessarily given as the bars are mostly submerged and the turbidity does not allow for a visual identification of the bars. Therefore, we developed an approach to estimate bar characteristics from statistical parameters derived from the available echo-sounder data which is described in the following.
Statistical methods for the analysis of bar characteristics and bar dynamics can be applied most easily using equidistant and rasterized bed elevation data. Using such data in straight sections, it is straightforward to apply more complex approaches to describe the bed texture using, e.g., 2D-structure functions (e.g., Aberle et al., 2010; Qin et al., 2019). However, the application of such methods to describe the bed structure in curved river sections is sophisticated, if not even impossible, if the data are not accordingly transformed to account for skew coordinates. Therefore, the bed elevation data was remapped to a curvilinear coordinate system whose principal axis follows the river centerline (Figure 4). The centerline coordinates and the river kilometers (Ekm) were provided by the WSV, and cross-sectional profiles perpendicular to the centerline were constructed using a spacing of Δxc = 10 m. This spacing was arbitrarily chosen as the bar wavelength was expected to be more than 1,000 m so that the impact of small scale bedforms was assumed to be negligible. The cross-sectional profiles were constructed using a spacing of Δy = 1 m (cf. Figure 4) with the origin of the y-axis at the centerline. The defined cross-sectional profile points do not necessarily coincide with the gridded data points so that the elevation at the profile points were determined as follows. Beginning at the centerline (y(xc) = 0), a circular area with a radius of 1.0 m was defined and the elevation of all gridded data points falling into this circle were averaged and assigned as corresponding bed elevation. This procedure was subsequently repeated for the further cross-sectional profile points using Δy = 1 m (c.f. Figure 4). The cross-sectional profile width for the further analysis was set to 100 m and covered hence a distance of 50 m to the left and right of the centerline. This width was chosen to limit the data to the riverbed unimpacted by groins and hence to exclude the associated scours at the groin heads as good as possible. The lateral interval of Δy = 1 m allowed for the construction of longitudinal profiles parallel to the centerline. For the 5 km long sections, this resulted in bed elevation data sets for each available scan consisting of 500 cross-sectional profiles (Δxc = 10 m) with 101 data points. Defining an xc-y coordinate system (note again that y is oriented differently for each profile but defines the distance to the centerline), it became possible to project the curved topography using a straight reference system enabling a further analysis of the data with respect to the centerline distance. Fitting a plane to the projected elevation data in each section, the longitudinal and transverse trend was removed and the reach averaged mean elevation was set to zm = 0.
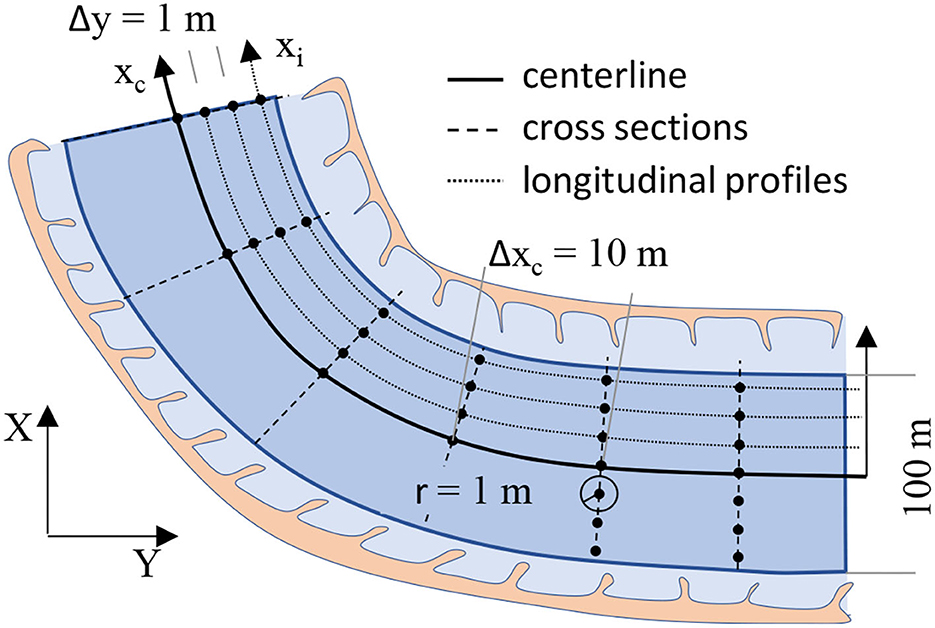
Figure 4. Sketch of the curvilinear coordinate system used for the further analysis.
For the subsequent analysis, we hypothesized that the alternate bars are most pronounced in the region defined by the 20 outer left and right longitudinal profiles. Since the investigated sections covered only a single river bend with rather mild curvature, or were straight, the longitudinal spacing between the points in the 20 outer right and left longitudinal profiles was assumed to be constant as these distances were much shorter than the bar lengths. We are aware of the fact that the profile points were, strictly speaking, not equidistantly spaced as the distance between successive points along each longitudinal profile depends on river curvature and centerline distance (cf. Figure 4). However, the main scope of our analysis is on the comparison of bar characteristics of the same (or geometrically similar) sections and not to develop predicting approaches for bar geometry. Thus, we assume that the resulting error in our analysis, which makes use of a reference system based on the channel centerline, is small. An advantage of the performed data transformation is that it enables the estimation of geometrical bar properties such as wavelength and height, and to investigate bar celerity on either channel side to reveal possible asymmetries due to the channel curvature. Moreover, it becomes straightforward to estimate the transverse bed slope (TS) of each cross-sectional profile by a linear regression. As alternate bars feature a regular pattern with a bank on one channel side and a scour on the other one (c.f. Section 1) the fluctuations of the TS mirror both the wavelength of the bar units (one bar on both channel sides) and the bar height.
The bar wavelength λB was estimated in a first step by calculating the power spectra of the 20 outer left and right longitudinal profiles, respectively, using a Hanning window. However, the spectra were difficult to analyze in more detail due to the large bar wavelengths and limited section length. Therefore, we decided to apply further methods to quantify the wavelength. In detail, we determined the averaged 1D-autocorrelation function of the outer right and left longitudinal profiles as well as the autocorrelation function of the TS. Only autocorrelation functions that showed a periodic pattern, which is characteristic for periodic input data like alternate bars (e.g., Bendat and Piersol, 2000), were further analyzed. The location of the first peak in the autocorrelation function for a spatial lag > 0 was used to estimate the bar wavelength.
The bar heights on the left and right side of the channel were characterized using the standard deviation (SD) of the longitudinal outer 20 right and left elevation profiles as a surrogate measure. We refrained from calculating the absolute bar height defined as the distance between the lowest and the highest elevation of one bar complex (e.g., Ikeda, 1984; Knaapen et al., 2001; Adami et al., 2016) as the identification of a single bar is rather subjective and can be easily biased by single extreme values (e.g., Redolfi et al., 2020). It is worth noting that restricting the analysis to the 100 m wide riverbed may underestimate bar height, as bars could be even higher in the omitted areas. However, since these areas are also affected by groin induced scours, the identification of the lowest elevation is associated with uncertainties so that an unambiguous quantification of bar heights would have been difficult. As mentioned before, the scope of our analysis was not the detailed quantification of bar characteristics but to determine the existence of bars and the dependency of bar geometry and dynamics on curvature and hydrological boundary conditions. Such insights may be gained using the outlined framework for the analysis of the data.
Bar celerity c was approximated by calculating the average 1D cross-correlation function of the 20 outer right and left longitudinal profiles, respectively, and the TS between successive years. The migration speed of the bars was evaluated by finding the spatial lag that resulted in the highest correlation coefficient and by dividing this value by the temporal lag between the subsequent datasets.
In order to link bar characteristics with hydraulic conditions, we used the water stage W at the gauging station as a surrogate measure for the discharge. This was due to the fact that the Elbe River exhibits large floodplains that convey an unknown part of the total discharge during overbank flow. This is partly accounted for by the water stage which increases less than the discharge once bank full conditions are exceeded in channels with a compound geometry (c.f. WMO, 2010). Keeping in mind the response time of large-scale morphological structures to changing hydrological and hydraulic boundary conditions, we used the average value of the water stage (termed W6 in the following) that was recorded at the gauging station during 6 weeks before the particular echo sounder survey to characterize the hydraulic boundary conditions. The duration a period of 6 weeks was chosen arbitrarily as the time scale for the morphodynamical adaption of the bars to discharge and hence water depth as well as β are unclear. Using a period of 6 weeks, we assumed that the duration for the bars adapting to the discharge is larger than the time lag needed for the adaption of dunes, which has been reported to be several days (e.g., Allen, 1976; Brinke et al., 1999). Finally, bar celerity was correlated with the average water stage (hereafter referred to as Wm) measured in the period between the subsequent echo sounder surveys.
2.3. Applied bar predictors
The available data were used to test the applicability of the approaches of Crosato and Mosselman (2009), Ahmari and Da Silva (2011) and Redolfi (2021) as bar predictors for the investigated sand bed reach. To allow a comparison between the results, the latter two approaches were rearranged to calculate βc. The approach of Ahmari and Da Silva (2011) can be formulated as follows:
where H is the section averaged water depth and d is the characteristic grain size that was assumed to correspond to dm. The approach of Crosato and Mosselman (2009) was rearranged to:
where b characterizes the degree of non-linearity of the sediment transport formula (-) and was assumed to b = 4 following the suggestion for sand bed rivers by Crosato and Mosselman (2009). C is the Chézy coefficient (m0.5/s), um is the section averaged flow velocity (m/s), Δ is the relative submerged density (-) assumed to be Δ = 1.65 and d is the characteristic grain size (m). We note that the bar mode for critical conditions was assumed to be m = 0.5 and the equation was multiplied by 0.5 compared to the original formula as Crosato and Mosselman (2009) defined β = B/H instead of β = 0.5B/H.
The approaches were applied for discharges that approximately represent bankfull conditions (2MQ ≤ Q ≤ MHQ c.f. Section 2.1) as these are often assumed to represent the formative discharge (c.f. Section 1). We refrained from applying the recent approach of Carlin et al. (2021) that considers the whole discharge spectrum to circumvent the assumption of a formative discharge due to the following reasons: i) it is not a simple predictor, ii) limited hydrological data impeded the calculation of a representative probability density function of the discharge, iii) the discharge fractions routed via the floodplains for overbank flow are unknown (c.f. Section 2.2), and iv) the river transports an increasing amount of bed material in suspension with higher discharges, especially at discharges exceeding bankfull conditions, i.e., a discharge that is considered in the approach but a transport mechanism which is not yet covered by it.
The application of the approaches revealed a critical issue regarding the river width B. This parameter is clearly defined in channels with a rectangular cross section like hydraulic flumes, where it is also independent from the discharge. However, this is not necessarily the case in natural rivers that often exhibit gently sloped banks complicating the definition of the correct width and hence obscuring the definition of the width to depth parameter β. Moreover, groins restrict the active width of the riverbed, i.e., the fraction of the bed contributing to bed load transport, so that it differs from the river width. This is why we defined B as the average width of the active riverbed in the investigated section (c.f. Section 2.1), as this definition is more straightforward and independent of the bank geometry and discharge (c.f. Table 1).
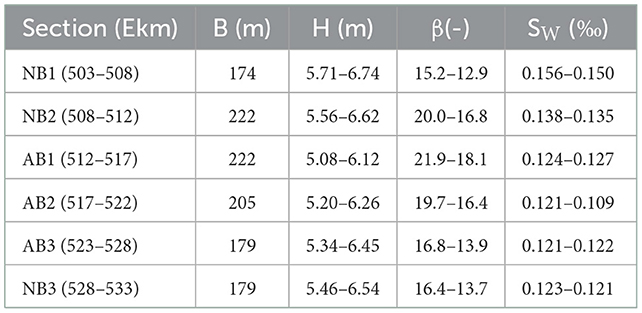
Table 1. Sections used to apply bar predictors and their characteristics.
For the application of the approaches, we finally assumed a rectangular cross section of the main channel with the width of the active bed B and a constant mean grain size of 1.2 mm. The active bed width B, the discharges and corresponding water depths H, as well as the water surface slope Sw were available in a longitudinal resolution of 100 m and were taken from the Elbe River data base “HyMoInfo” provided by BAW. The values were respectively averaged over the six investigated subsections. An overview over the discharge dependent value-ranges as well as the active bed width B is provided in Table 1.
3. Results and discussion
Figure 5 provides a visualization of the applied methodology outlined in Section 2.2. Figure 5A exemplarily shows the bed elevations in AB2 for the years 2007–2011 in geodetic coordinates and Figure 5B shows the transformed data along the river centerline for the same years. The comparison of Figures 5A, B shows that the method allowed to visualize the bars in the curved section in a rectified manner. They successively migrated downstream and were always superimposed by smaller bedforms. The latter exhibited lengths up to approximately 150 m and varied in their distinction with every year obscuring the geometrical characteristics of the bars (c.f. Section 2.2). The visual inspection of Figure 5 shows that bars were characterized by wavelengths of λB ≈ 1,000–1,500 m equaling a normalized length of λB / B ≈ 4.5–7.5. Moreover, depending on the investigated period, the bars migrated ~250–500 m downstream per year. These are strong indicators that the observed bars belong to the free bar type.
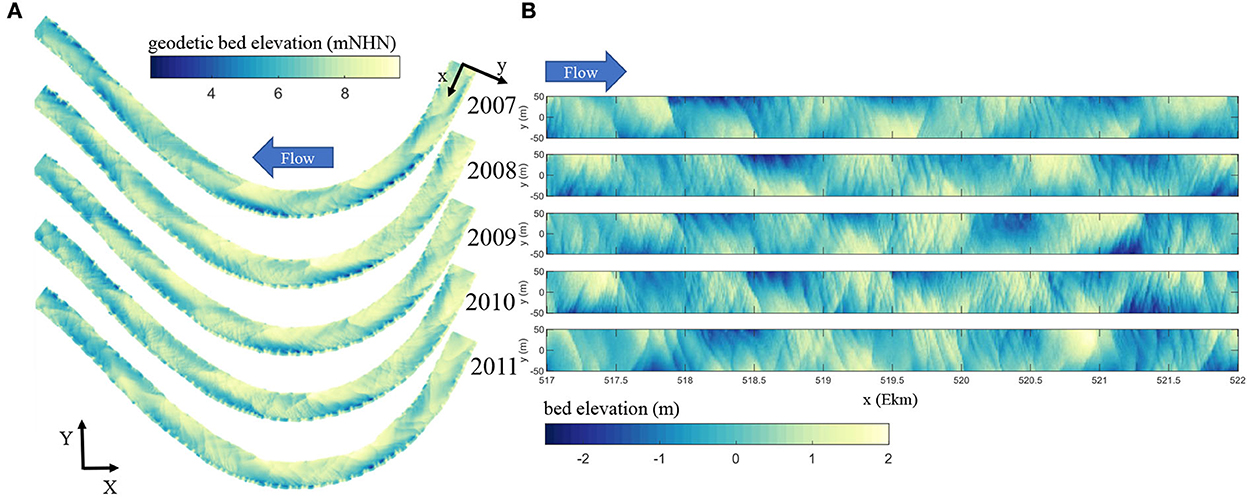
Figure 5. Bed elevation data from 2007 to 2011 in AB2 (A) plotted in original geodetic coordinates and (B) cut and detrended bed elevation data plotted cross-section wise along the river centerline. Please note the different color scales.
3.1. Bar formation
The visual inspection of the bed elevation data showed, in agreement with previous observation of the WSV, the formation of bars just downstream of Ekm 512 in section AB1. The existence of bars can be validated by investigating the cross-sectional distribution of the longitudinally averaged bed elevations which, in case of existence of alternate bars, should be characterized by a bell-shaped distribution (Fujita and Muramoto, 1985). Such a distribution can be identified for the sections AB1, AB2, and AB3 (using the mean value of all available scans) while it is absent or not as pronounced for sections NB1, NB2, and NB3 (Figure 6A). Moreover, the distributions indicate that alternate bars were most distinct in section AB2. The longitudinal distribution of the transverse slope (TS) shows a periodic behavior in AB1, AB2, and AB3, which is also a strong indicator for the presence of bars (Figure 6B). The small peaks that can be observed in this figure in the AB-sections gradually shift downstream from year to year indicating downstream migration of the bars. Moreover, the distinctness of bars is shown by the temporal variance of the TS (right axis in Figure 6B; moving average over 50 values along the river axis). The increasing variance in AB1 indicates the formation and growth of bars in this section, whereas the highest and nearly constant values in AB2 suggest that bars are quasi fully developed. The clear peak in variance at Ekm 521 correlates with the end of the river bend in this section and similar peaks can be seen at Ekm 509 and Ekm 515 i.e., locations also located at the end of a river bend. In AB3 the temporal variance of TS decreases and hence indicates the beginning decay of the bars. In contrast, only stationary point bars could be identified in the sections NB1 and NB2, i.e. in the sections upstream of AB1 (Ekm 503–512). In these sections, the longitudinally averaged distribution of the bed elevations does not show a bell-shape and the longitudinal distribution of the TS does not show a periodic behavior and is characterized by a low temporal variance. The absence of bars in section NB2 is an interesting fact, as the river bed already widens at the beginning of NB2 (Ekm 508) and has hence the same width as AB1 where bars are present. We therefore hypothesize that the absence of bars can be attributed to the river course as this is the major difference between the river sections. In fact, the river widening at Ekm 508 is located in a 2 km long sharp left bend (radius ≈ 800 m) directly followed by a right bend (c.f. Section 2) that likely impede the initial formation of bars. In contrast river curvature in AB1 and AB2 is smaller so free bars can coexist with local point bars (c.f. Section 1). In section NB3, located downstream of AB3 (Ekm 528), bars could only be identified in certain years using the aforementioned approaches. In the other years, the bed in this section was dominated by smaller bedforms and stationary bars with a wavelength larger than 2,000 m, which can be inferred from Figure 6B. This observation can be linked to a successive dampening of the alternate bars due to narrowing width of the active bed by the larger groins.
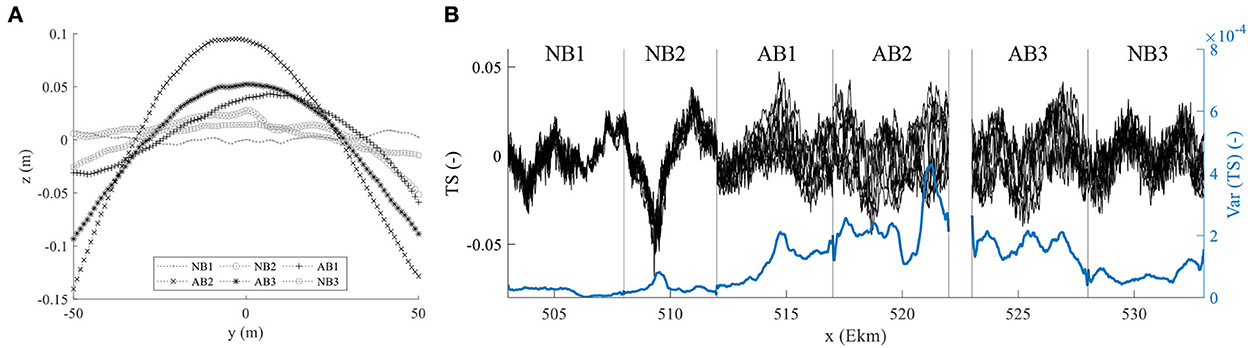
Figure 6. (A) Temporal and longitudinal averaged bed elevations z of the different sections plotted over the bed width y, and (B) transverse slope (TS) and the temporal varaince of the TS of all years and sections plottet along the river axis.
A further interesting aspect is that a trend between the origin of bar formation and the W6-parameter was identified (Figure 7). The origin of bar formation was determined by identifying the first apparent peak in the transverse slope distribution, and this peak was shifted up to 3.5 km downstream within AB1 with increasing W6 parameter, i.e. increasing discharge. We infer that this behavior can be attributed to the flow field upstream of AB1 that is governed by the bends and associated upstream point bars situated at Ekm 509 and 511 (c.f. Figure 2). Despite being fixed, the geometry of the point bars changed throughout the years (not shown here).
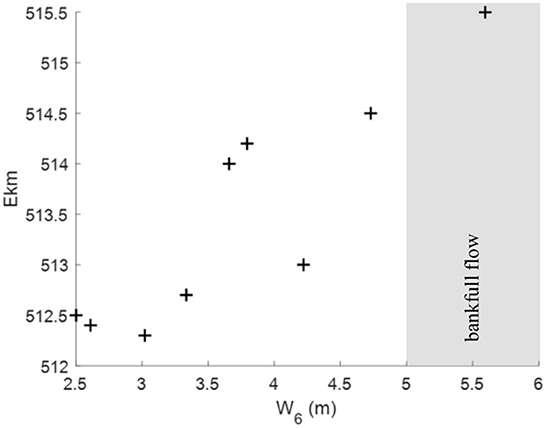
Figure 7. Origin of bar formation depending on the mean water level measured at gauging station Neu Darchau over a period of 6 weeks before the underlying echo sounder survey. The region of water levels that approximately represent bank full conditions in the investigated sections (c.f. Section 2.1) is highlighted in gray.
3.2. Bar characteristics
Figures 8A–C present the bar wavelength λB determined from the autocorrelation analysis of the bed profiles and TS, respectively, as a function of time for sections AB1–AB3. These figures reveal both different patterns and orders of magnitude. In AB1, λB was fairly constant over the years (λB ≈1,000 m) while in AB2 it decreased from λB ≈1,300 m in 2007 to λB ≈1,000 m in 2011 and increased to λB ≈1,500 m in 2016. Bars in AB3 showed the opposite trend compared to AB2; λB corresponded to about 1,000 m in 2007, increased to λB ≈1,250 m in 2011 before it decreased to λB ≈1,000 m in 2016. Note that the sections were situated next to each other and were surveyed within a short time frame in nearly every year. Thus, these figures indicate at the effect of different boundary conditions on bar characteristics and dynamics and fits to the variance pattern of the TS discussed before (c.f. Section 3.1).
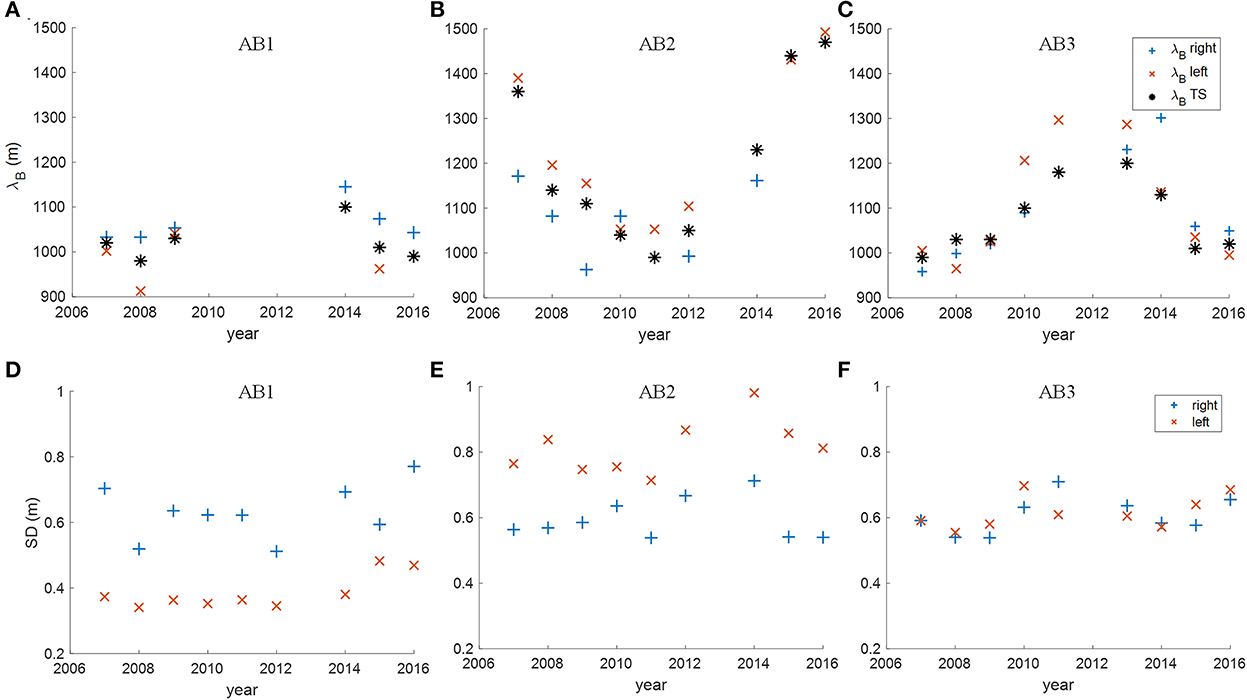
Figure 8. (A–C) Bar wavelength and (D–F) standard deviation over the years plotted respectively for the investigated sections AB1 (A, D), AB2 (B, E), and AB3 (C, F). Values calculated based on the outer right (left) elevation profiles are shown as blue + (red ×) and values calculated based on the transverse slope are marked with black *.
The mean standard deviation of the analyzed outer right and left bed elevation profiles, which serves as surrogate for relative bar height, is presented in Figures 8D–F for AB1, AB2 and AB3, respectively. In contrast to the wavelength, the standard deviation is nearly constant over the years but differs in between the investigated sections and channel sides. On average, the standard deviations of the right and left outer profiles in AB1 corresponded to 0.63 m and 0.39 m, respectively, whereas in AB2 these values were 0.60 and 0.82 m, respectively. Interestingly, both λB and SD were larger on the right channel side in AB1 and on the left channel side in AB2. We note also that the underlying autocorrelation functions used to estimate λB were more periodic on the right and left in AB1 and AB2, respectively (not shown here). As AB1 and AB2 cover a left and a right turn of the river, this is a strong indicator that bars on the outer side of the bend tend to be longer and relatively higher than their counterparts on the inner bank. Hence, this shows that the bar characteristics are affected by channel curvature, and this can be associated with the interaction of the free bars with the point bar in the inner bend, which has been reported to slow down free bars depending on channel curvature (c.f. Section 1). The findings in the nearly straight section AB3 substantiate these observations, as the differences in λB between both sides were minor and the SD of both sides were equal (0.61 m). Moreover, the analysis of the bed elevation data in AB1 and AB2 revealed that bars in the inner bend consistently changed their shape while moving through the bend. Bars approaching the bend exhibited a migration front (lee side) inclined toward the river centerline, whereas this inclination changed throughout the bend. Bars downstream of the bend apex had fronts inclined toward the inner bank. This effect can be seen in Figure 5A showing that in 2007 the migration front of the first bar on the inner bank was inclined toward the river bank, and this inclination was reversed after its migration through the bend in 2010. This change in geometry can again be associated with the interaction of the migrating bar with the point bar that locally led to a higher transverse slope (c.f. Struiksma et al., 1985) successively diverting bed load transport toward the outer bend (c.f. Section 1).
3.3. Bar dynamics
The bar celerity is presented in Figure 9 for the investigated sections and the observation period. In analogy to the bar wavelength, bar celerity changed over the years and exhibited different temporal trends in the investigated sections. In AB1, bar celerity decreased over the years from ~430 m/year in 2007–2008 to 300 m/year in the period 2015–2016. In AB2, bar celerity increased almost linearly from 330 m/year in 2007–2008 to 600 m/year in 2010–2011 and decreased to a minimum of 241 m/year in 2015–2016, hence showing the opposite trend to λB in this section. Section AB3 shows an overall trend of decreasing bar celerity over the years with a celerity of ~400 m/year in 2007–2008 and 340 m/year in 2015–2016. However, in 2010–2011 and 2013–2014 bar velocities where much higher (~500 m/year). It is worth mentioning that we observed the general trend that bars with smaller celerity exhibited longer wavelengths and vice versa (not shown here), an observation that fits to investigations of Crosato et al. (2011) and Jang and Shimizu (2005).
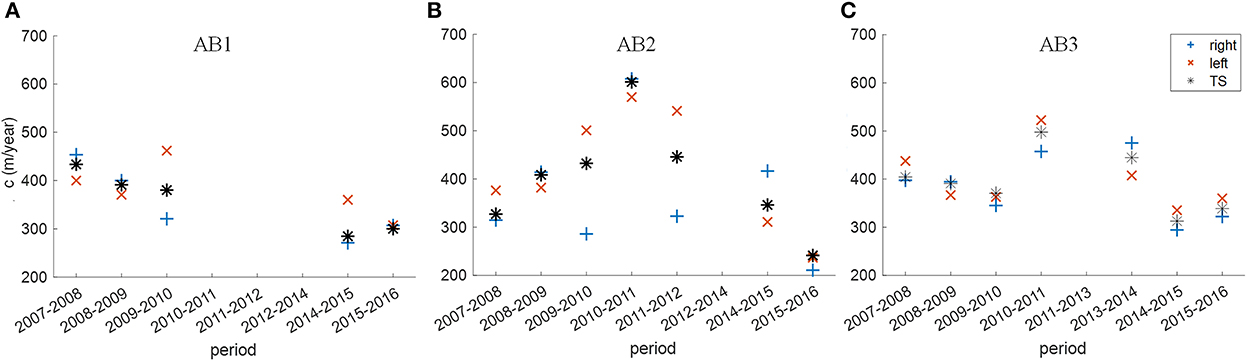
Figure 9. Bar migration between successive years for the different investigated sections [(A): AB1, (B): AB2, and (C): AB3].
3.4. Impact of discharge
As shown before, bar characteristics changed over years, and this can be linked to the hydraulic boundary conditions in the period before the surveys of the riverbed. This can be investigated by Figure 10 showing λB and SD plotted as a function of the average water stage W6.
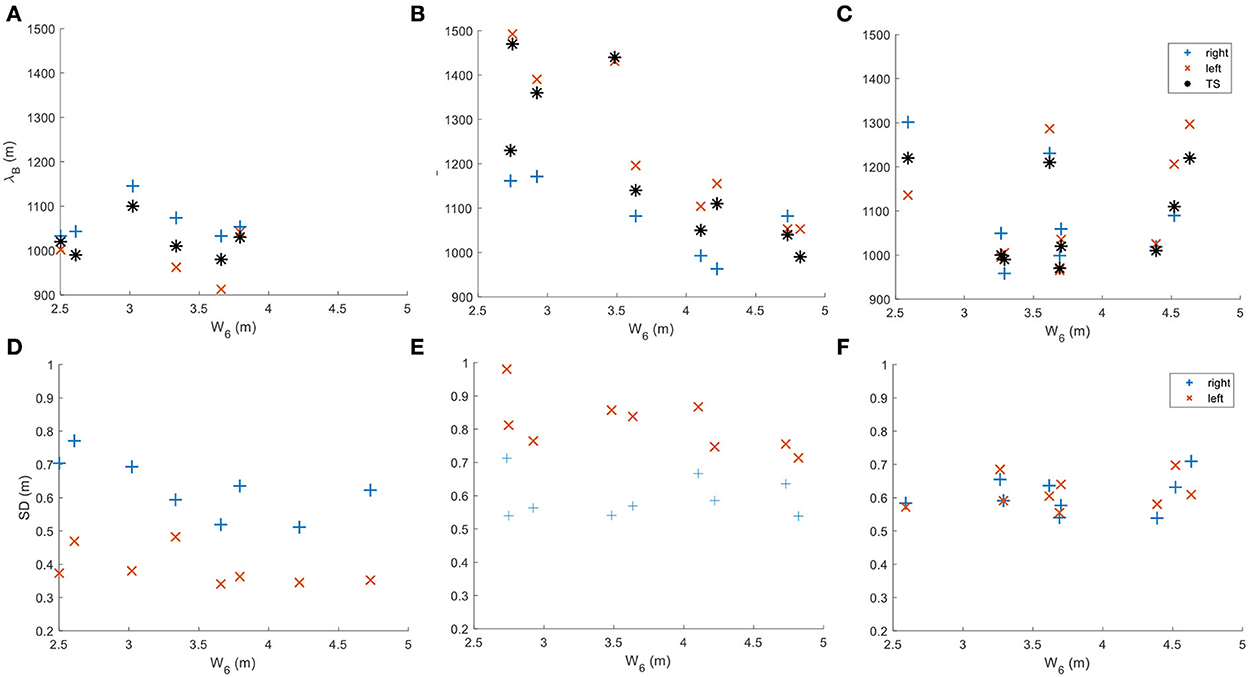
Figure 10. (A–C) Bar wavelength and (D–F) standard deviation over W6 parameter plotted respectively for the investigated sections AB1 (A, D), AB2 (B, E), and AB3 (C, F).
Figures 10A, B show that λB in AB1 is almost independent of the hydraulic conditions, whereas, in AB2, λB decreases with increasing water depth. It is interesting to note that this decrease is more distinct for the bars situated on the outer bend i.e., the left side in AB2. A similar trend can be observed for the standard deviation which decreases with increasing water levels on the left side in AB2 (Figure 10E) and also on the right side in AB1 (Figure 10D), whereas the standard deviation on respective other side remains nearly constant. Hence, this indicates that the geometry of bars in the outer bend is more affected by changes in the discharge than the ones in the inner bend. Moreover, the general trend in AB2 that increasing water stages (discharges) lead to decreasing bar dimensions substantiates findings of Redolfi et al. (2020) who found similar relations in their flume experiments for fully developed bars. Interestingly, neither the bar wavelength nor the bar height seemed to correlate with the water level in section AB3 and did not show differences between the channel sides. This indicates once more that bars in AB2 were quasi fully developed whereas this was not the case in AB1 and AB3, where bars grew and were successively damped, respectively.
Figure 11 shows the annual bar migration plotted against the average water stage Wm and reveals that bar celerity exhibited also a dependency on the hydrological conditions. In all investigated sections, bar migration rates increased with increasing Wm, which can be expected due to increased bed shear stress and hence sediment transport. Bar migration rates were fairly similar for the same Wm values indicating that bar celerity was mainly driven by the hydrological boundary conditions and was hence less affected by the geometrical characteristics. This is partly contradictory to the findings of Jang and Shimizu (2005) who reported a decrease in bar celerity with increasing channel width, as such a trend cannot be observed in the wider section AB3 compared to AB2. It is important to note that Jang and Shimizu (2005) focused on channel widening due to lateral erosion whereas the bed width of Elbe River is restricted by groins. Hence this may indicate on the important of such instream structures on bar dynamics. Moreover, Figure 11 shows that bar celerity correlated well with averaged hydrological conditions indicating that discharge variations only had a minor impact on average bar dynamics. This fits to the findings that short flood events do not affect bar characteristics (Carlin et al., 2021).
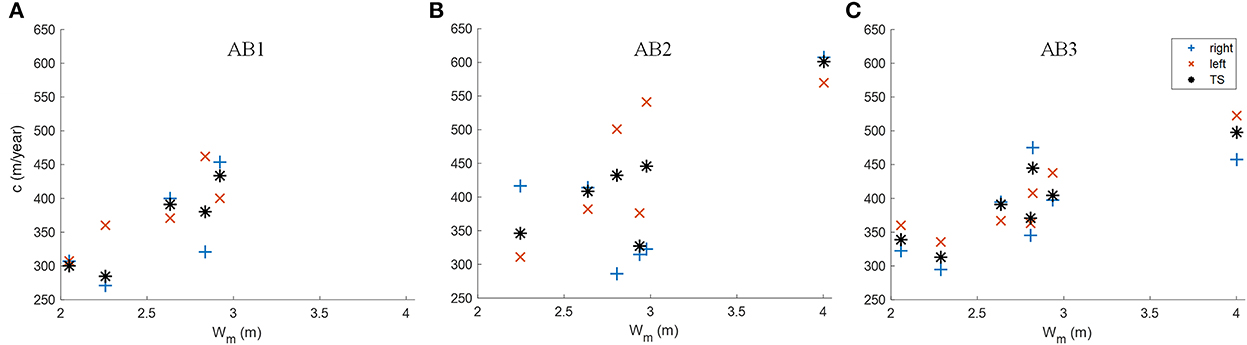
Figure 11. Bar celerity in the investigated sections [(A): AB1, (B): AB2, and (C): AB3] plotted over the average water stage measured in the period between subsequent echo sounder survays at the gauging station Neu Darchau (Ekm 536).
3.5. Application of bar-predictors
The bar predictors defined by equations 1 and 2 as well as the approach of Redolfi (2021) were applied to the six sections (c.f. Table 1), and the results are shown in Table 2 in terms of the width to depth parameter β and the threshold values βc calculated by the particular approaches. Similar βc-values were obtained for both investigated discharges and the different river sections when applying the approach of Redolfi (2021). However, β varies with the discharge and complicates the interpretation of the results as for 2MQ the approach forecasts β > βc, and hence the occurrence of bars in all sections, whereas for MHQ the prediction nearly mirrors the situation apparent from the field observations (c.f. Section 3.1). Assuming MHQ for bankfull conditions, the approach predicts the formation of bars in the sections NB2, AB1, and AB2 (Ekm 508-522), where β = 16.4–18.1 and βc = 15–15.3. This fits with the field observations except for NB2 (Ekm 508–512), where bars are absent, although the active bed width of B = 222 m is comparable to the active bed width in AB1. This can be attributed to the effect of the river curvature (c.f. Section 3.1). In section NB1 (upstream of the Reststrecke), β = 12.9 is below the calculated threshold βc = 14.8 and, hence the approach suggests the absence of bars which can be confirmed by the field observations. Finally, the sections AB3 and NB3 (downstream of the Reststrecke) are characterized by β = 13.7–13.9, i.e. values lower than βc that indicate the absence of bars. However, when considering that bars perturbate into theses sections from upstream the approach mirrors the field observation as bars slowly decay in these sections (c.f. Section 3.1).
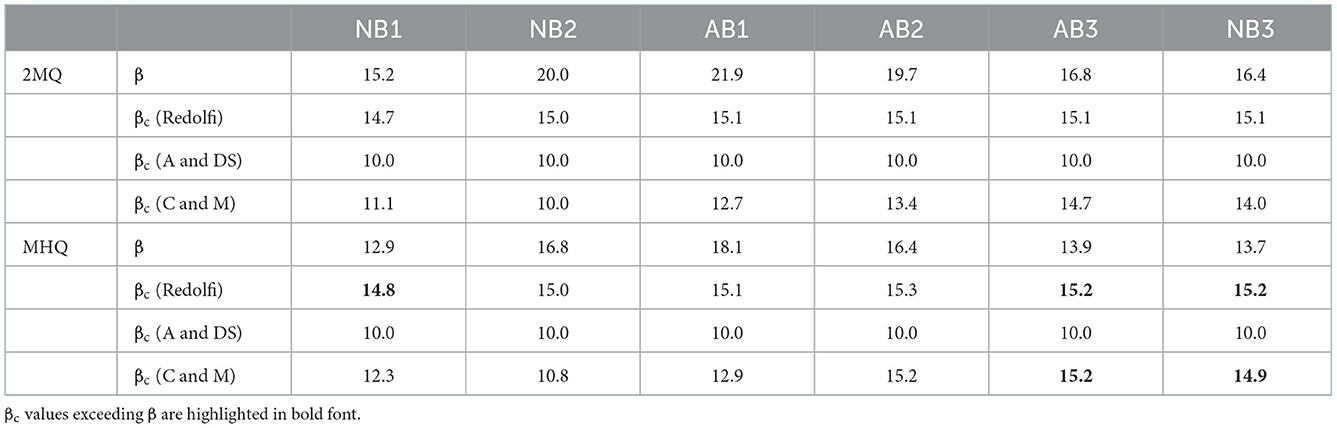
Table 2. Width to depth parameter β of the sections in comparison with βc calculated by the approaches of Redolfi (2021), Ahmari and Da Silva (2011) (A and DS) and Crosato and Mosselman (2009) (C and M) for the approximate bankfull discharges 2MQ and MHQ.
The criterium of Ahmari and Da Silva (2011) results in a constant threshold value of βc = 10 for all sections and discharges as H/d was always larger than 130 (see Equation 1). The minimum width to depth parameter in all investigated sections was βmin = 12.9, thus the approach suggests the formation of bars in all sections and for both discharges. This does not fit to the observations and is most likely caused by the empirical nature of the approach and the limited data basis for conditions with high relative submergences.
The critical width to depth ratios βc of the rearranged Crosato and Mosselman (2009) approach (calculated by assuming m = 0.5 as the minimum value for bar-formation) differed between the investigated sections (Table 2). Similar to the Redolfi-approach, this approach forecasts bars in all sections assuming 2MQ as bankfull discharge, whereas the results are more nuanced for MHQ. For MHQ, the approach yields βc < β for the sections NB1-2 and AB1-2 (Ekm 503–522) and hence forecasts the existence of alternate bars. While alternate bars could be identified in sections AB1 and AB2 (Ekm 512–522), the predictions for NB1 and NB2 (Ekm 503–5,012) could not be confirmed by the field observations. For the latter, this might be related to the bends situated in this area, as for the Redolfi-approach (cf. Section 3.1). However, bar formation is also suggested for NB1 which shows the smallest β values of all investigated sections. This can be linked to the different water-surface slopes of the sections which are highest in NB1 and indicates that the approach of Crosato and Mosselman is more sensitive to this parameter than the Redolfi-approach. Downstream of the Reststrecke in sections AB3 and NB3, βc values corresponded to βc = 14.9–15.2. They were hence similar to the ones of the Redolfi approach and fit the field data considering the decay of alternate bars in these sections.
In general, the bar predictors of Redolfi (2021) and Crosato and Mosselman (2009) can be applied to forecast bars in sand bed rivers like Elbe River. However, such complex field conditions bare the difficulty to define adequate values for river width and bankfull discharge. Moreover, when applying these approaches to river sections, one has to keep in mind that boundary conditions like river curvature or the migration of bars from upstream are not considered in the approaches, so the prediction can differ from the situation in the field.
4. Conclusion
In this paper we investigated the formation and characteristics of alternate bars in sand bed rivers and tested the applicability of simple bar predictors in such environments based on a comprehensive data set covering a 30 km long reach of the German trained sand bed river Elbe over a period of 10 years. Our results show that bars occurring in Elbe River are free alternate bars and that their formation is linked to river training by groins that set the active width of the riverbed.
By introducing a novel approach that allows to estimate bar characteristics in straight and curved river sections based on statistically derived geometrical parameters, we showed how bars develop and decay in the investigated river reach and characterized bars in three neighboring 5 km long river sections. Our results show that river bends affect alternate bar geometry and cause bars on the outer bank to be longer and higher than their counterparts on the inner bank leading to asymmetric bar units. By coupling bar characteristics and discharge, we showed that hydraulic conditions have an impact on the location of the origin of bar formation and correlate with bar characteristics. Moreover, we showed that bar wavelength and height respond differently to hydraulic conditions in the particular sections, which is presumably linked to the state of bar development, i.e., if bars initially form, are quasi fully developed, or decay. Moreover, our analysis revealed that bar celerity is mainly governed by the hydraulic boundary conditions and less impacted by bar geometry or river curvature.
Finally, we applied three simple bar predictors to six river sections and showed that approaches based on linear theory can correctly predict the formation of bars in trained sand bed rivers when additional factors like river curvature are considered in the evaluation of the results. However, care has to be taken in the analyses of the outcomes of such approaches when applying them to complex field conditions, as the definition of the cross-sectional dimensions is difficult and the formative discharge and temporal scales for bar formation are mostly unknown. This highlights the need for more research, as bars in sand bed rivers may also form at moderate discharges i.e., conditions that favor bar formation due to higher width to depth ratios. By trend, climate change will cause lower mean flow in the Elbe River (Vollmer et al., 2014) and especially in European rivers in the Mediterranean climate zone (Schneider et al., 2013). Hence, in the long run these rivers will exhibit larger average width to depth ratios throughout the year so that bar characteristics may be altered (Redolfi et al., 2022). Such a tendency could be observed in our study as bar wavelengths increased substantially in the years that were characterized by the smallest discharges. Moreover, larger width to depth ratios also bear the potential that free bars occur in trained river sections where they are absent today, which may impose new challenges for navigation and river management.
Data availability statement
The data analyzed in this study is subject to the following licenses/restrictions: The datasets presented in this article are not readily available because they belong to the German Federal Waterways Engineering and Research Institute (BAW). Requests to access these datasets should be directed to BAW, info@baw.de.
Author contributions
TB: conceptualization, methodology, data analysis, and writing. JA: methodology and writing (reviewing and editing). BH: providing data and writing (reviewing). All authors have read and agreed to the published version of the manuscript.
Funding
Funding for this study was provided by the Federal Waterways Engineering and Research Institute, Karlsruhe, Germany.
Acknowledgments
We gratefully acknowledge the support of Francisco Núñez-González who helped in our analysis with fruitful discussions.
Conflict of interest
The authors declare that the research was conducted in the absence of any commercial or financial relationships that could be construed as a potential conflict of interest.
Publisher's note
All claims expressed in this article are solely those of the authors and do not necessarily represent those of their affiliated organizations, or those of the publisher, the editors and the reviewers. Any product that may be evaluated in this article, or claim that may be made by its manufacturer, is not guaranteed or endorsed by the publisher.
Supplementary material
The Supplementary Material for this article can be found online at: https://www.frontiersin.org/articles/10.3389/frwa.2022.1091872/full#supplementary-material
References
Aberle, J., Nikora, V., Henning, M., Ettmer, B., and Hentschel, B. (2010). Statistical characterization of bed roughness due to bed forms: a field study in the Elbe River at Aken, Germany. Water Resour. Res. 46, 263. doi: 10.1029/2008WR007406
Adami, L., Bertoldi, W., and Zolezzi, G. (2016). Multidecadal dynamics of alternate bars in the Alpine Rhine River. Water Resour. Res. 52, 8938–8955. doi: 10.1002/2015WR018228
Ahmari, H., and Da Silva, F. A. M. (2011). Regions of bars, meandering and braiding in da Silva and Yalin's plan. J. Hydraulic Res. 49, 718–727. doi: 10.1080/00221686.2011.614518
Allen, J. (1976). Time-lag of dunes in unsteady flows: an analysis of Nasner's data from the R. Weser, Germany. Sediment. Geol. 15, 309–321. doi: 10.1016/0037-0738(76)90037-3
Bendat, J. S., and Piersol, A. G. (2000). Random Data Analysis and Measurement Procedures. New York, NY: John Wiley and Sons, Inc.
Bertagni, M. B., and Camporeale, C. (2018). Finite amplitude of free alternate bars with suspended load. Water Resour. Res. 54, 9759–9773. doi: 10.1029/2018WR022819
Blondeaux, P., and Seminara, G. (1985). A unified bar–bend theory of river meanders. J. Fluid Mech. 157, 449–470. doi: 10.1017/S0022112085002440
Brinke, W. B. M., ten Wilbers, A. W. E., and Wesseling, C. (1999). “Dune growth, decay and migration rates during a large-magnitude flood at a sand and mixed sand–gravel bed in the Dutch Rhine River system,” in Fluvial Sedimentology VI, eds J. Rogers and N. D. Smith (Blackwell Science: Oxford, Malden, Mass), 15–32.
Carlin, M., Redolfi, M., and Tubino, M. (2021). The long-term response of alternate bars to the hydrological regime. Water Resour. Res. 57, e2020WR029314. doi: 10.1029/2020WR029314
Chang, H. H. (1985). Formation of alternate bars. J. Hydra. Eng. 111, 1412–1420. doi: 10.1061/(ASCE)0733-9429(1985)111:11(1412)
Claude, N., Rodrigues, S., Bustillo, V., Bréhéret, J.-G., Tassi, P., and Jugé, P. (2014). Interactions between flow structure and morphodynamics of bars in a channel expansion/contraction, Loire River, France. Water Resour. Res. 50, 2850–2873. doi: 10.1002/2013WR015182
Colombini, M., Seminara, G., and Tubino, M. (1987). Finite-amplitude alternate bars. J. Fluid Mech. 181, 213. doi: 10.1017/S0022112087002064
Colombini, M., and Stocchino, A. (2012). Three-dimensional river bed forms. J. Fluid Mech. 695, 63–80. doi: 10.1017/jfm.2011.556
Cordier, F., Tassi, P., Claude, N., Crosato, A., Rodrigues, S., and van Pham Bang, D. (2019). Numerical study of alternate bars in alluvial channels with nonuniform sediment. Water Resour. Res. 55, 2976–3003. doi: 10.1029/2017WR022420
Corenblit, D., Vautier, F., González, E., and Steiger, J. (2020). Formation and dynamics of vegetated fluvial landforms follow the biogeomorphological succession model in a channelized river. Earth Surf. Process. Landforms 45, 2020–2035. doi: 10.1002/esp.4863
Crosato, A., Desta, F. B., Cornelisse, J., Schuurman, F., and Uijttewaal, W. S. J. (2012). Experimental and numerical findings on the long-term evolution of migrating alternate bars in alluvial channels. Water Resour. Res. 48, W06524. doi: 10.1029/2011WR011320
Crosato, A., and Mosselman, E. (2009). Simple physics-based predictor for the number of river bars and the transition between meandering and braiding. Water Resour. Res. 45, W03424. doi: 10.1029/2008WR007242
Crosato, A., and Mosselman, E. (2020). An integrated review of river bars for engineering, management and transdisciplinary research. Water 12, 596. doi: 10.3390/w12020596
Crosato, A., Mosselman, E., Beidmariam Desta, F., and Uijttewaal, W. S. J. (2011). Experimental and numerical evidence for intrinsic nonmigrating bars in alluvial channels. Water Resour. Res. 47, W03511. doi: 10.1029/2010WR009714
DGJ (2014). Deutsches Gewässerkundliches Jahrbuch / Elbegebiet / Teil 3: Untere Elbe ab der Havelmündung. – 2014. Freie und Hansestadt Hamburg, HPA Hamburg Port Authority.
Duró, G., Crosato, A., and Tassi, P. (2016). Numerical study on river bar response to spatial variations of channel width. Adv. Water Resour. 93, 21–38. doi: 10.1016/j.advwatres.2015.10.003
Eekhout, J. P. C., Hoitink, A. J. F., and Mosselman, E. (2013). Field experiment on alternate bar development in a straight sand-bed stream. Water Resour. Res. 49, 8357–8369. doi: 10.1002/2013WR014259
Federici, B., and Seminara, G. (2003). On the convective nature of bar instability. J. Fluid Mech. 487, 125–145. doi: 10.1017/S0022112003004737
Federici, B., and Seminara, G. (2006). Effect of suspended load on sandbar instability. Water Resour. Res. 42, W07407. doi: 10.1029/2005WR004399
Fujita, Y., and Muramoto, Y. (1985). Studies on the process of development of alternate bars. Bull. Disast. Pre. Res. Inst. 35: 55–86.
Garcia, M., and Niño, Y. (1993). Dynamics of sediment bars in straight and meandering channels: experiments on the resonance phenomenon. J. Hydraulic Res. 31, 739–761. doi: 10.1080/00221689309498815
Ikeda, S. (1984). Prediction of alternate bar wavelength and height. J. Hydraulic Eng. 110, 371–386. doi: 10.1061/(ASCE)0733-9429(1984)110:4(371)
Ishihara, M., and Yasuda, H. (2022). On the migrating speed of free alternate bars. J. Geophy. Res. Earth Surface 127, e2021JF006485. doi: 10.1029/2021JF006485
Jaballah, M., Camenen, B., Pénard, L., and Paquier, A. (2015). Alternate bar development in an alpine river following engineering works. Adv. Water Resour. 81, 103–113. doi: 10.1016/j.advwatres.2015.03.003
Jaeggi, M. N. R. (1984). Formation and effects of alternate bars. J. Hydra. Eng. 110, 142–156. doi: 10.1061/(ASCE)0733-9429(1984)110:2(142)
Jang, C.-L., and Shimizu, Y. (2005). Numerical simulations of the behavior of alternate bars with different bank strengths. J. Hydraulic Res. 43, 596–612. doi: 10.1080/00221680509500380
Jourdain, C., Claude, N., Tassi, P., Cordier, F., and Antoine, G. (2020). Morphodynamics of alternate bars in the presence of riparian vegetation. Earth Surf. Process. Landforms 51, 33. doi: 10.1002/esp.4776
Kleinhans, M. G., and van den Berg, J. H. (2011). River channel and bar patterns explained and predicted by an empirical and a physics-based method. Earth Surf. Process. Landforms 36, 721–738. doi: 10.1002/esp.2090
Knaapen, M., Hulscher, S., de Vriend, H. J., and van Harten, A. (2001). Height and wavelength of alternate bars in rivers: modelling vs. laboratory experiments. J. Hydra. Res. 39, 147–153. doi: 10.1080/00221680109499815
Lanzoni, S. (2000a). Experiments on bar formation in a straight flume: 1. Uniform sediment. Water Resour. Res. 36, 3337–3349. doi: 10.1029/2000WR900160
Lanzoni, S. (2000b). Experiments on bar formation in a straight flume: 2. Graded sediment. Water Resour. Res. 36, 3351–3363. doi: 10.1029/2000WR900161
Le Guern, J., Rodrigues, S., Tassi, P., Jugé, P., Handfus, T., Duperray, A., et al. (2019). “Interactions between flow structure and Influence of migrating bars on dune geometry,” in MARID VI. Sixth International Conference on Marine and River Dune Dynamics (Bremen: University Bremen and SHOM), 157–161.
Miwa, H., and Nagayoshi, T. (1999). Suppression limit of alternate bar migration through sine-generated meander channels. J. Nat. Disast. Sci. 21, 1–10.
Nelson, J. M. (1990). The initial instability and finite-amplitude stability of alternate bars in straight channels. Earth-Sci. Rev. 29, 97–115. doi: 10.1016/0012-8252(90)90030-Y
Okitsu, T., Iwasaki, T., Kyuka, T., and Shimizu, Y. (2021). The role of large-scale bedforms in driftwood storage mechanism in rivers. Water 13, 811. doi: 10.3390/w13060811
Qin, J., Aberle, J., Henry, P. Y., Wu, T., and Zhong, D. (2019). Statistical significance of spatial correlation patterns in armored gravel beds. J. Hydra. Res. 57, 90–106. doi: 10.1080/00221686.2018.1459894
Rashid, M. B., and Habib, M. A. (2022). Channel bar development, braiding and bankline migration of the Brahmaputra-Jamuna river, Bangladesh through RS and GIS techniques. Int. J. River Basin Manag. doi: 10.1080/15715124.2022.2118281. [Epub ahead of print].
Redolfi, M. (2021). Free alternate bars in rivers: Key physical mechanisms and simple formation criterion. Water Resour. Res. 57, e2021WR030617. doi: 10.1029/2021WR030617
Redolfi, M., Carlin, M., and Tubino, M. (2022). The geomorphic response of river alternate bars to climate change, EGU General Assembly 2022, Vienna, Austria, 23–27 May 2022. EGU22–11359. doi: 10.5194/egusphere-egu22-11359
Redolfi, M., Welber, M., Carlin, M., Tubino, M., and Bertoldi, W. (2020). Morphometric properties of alternate bars and water discharge: a laboratory investigation. Earth Surf. Dynam. 8, 789–808. doi: 10.5194/esurf-8-789-2020
Rodrigues, S., Claude, N., Juge, P., and Breheret, J.-G. (2012). An opportunity to connect the morphodynamics of alternate bars with their sedimentary products. Earth Surf. Process. Landforms 37, 240–248. doi: 10.1002/esp.2255
Rodrigues, S., Mosselman, E., Claude, N., Wintenberger, C. L., and Juge, P. (2015). Alternate bars in a sandy gravel bed river: generation, migration and interactions with superimposed dunes. Earth Surf. Process. Landforms 40, 610–628. doi: 10.1002/esp.3657
Schneider, C., Laizé, C. L. R., Acreman, M. C., and Flörke, M. (2013). How will climate change modify river flow regimes in Europe? Hydrol. Earth Syst. Sci. 17, 325–339. doi: 10.5194/hess-17-325-2013
Seminara, G., and Tubino, M. (1992). Weakly nonlinear theory of regular meanders. J. Fluid Mech. 244, 257. doi: 10.1017/S0022112092003069
Struiksma, N., Olesen, K. W., Flokstra, C., and de Vriend, H. J. (1985). Bed deformation in curved alluvial channels. J. Hydraulic Res. 23, 57–79. doi: 10.1080/00221688509499377
Tewolde, M. S. (2015). Effects of suspended sediments on river bars (Master Thesis). UNESCO-IHE Institute for Water Education, Delft, Netherlands.
Tubino, M. (1991). “Flume experiments on alternate bars in unsteady flow,” in Fluvial Hydraulics of Mountain Regions, eds. A. Armanini and G. Di Silvio (Berlin Heidelberg New York London Paris Springer-Verlag), 103–117.
Tubino, M., Repetto, R., and Zolezzi, G. (1999). Free bars in rivers. J. Hydraul. Res. 37, 759–775. doi: 10.1080/00221689909498510
Tubino, M., and Seminara, G. (1990). Free–forced interactions in developing meanders and suppression of free bars. J. Fluid Mech. 214, 131. doi: 10.1017/S0022112090000088
Venditti, J. G., Nelson, P. A., Minear, J. T., Wooster, J., and Dietrich, W. E. (2012). Alternate bar response to sediment supply termination. J. Geophys. Res. 117, F02039. doi: 10.1029/2011JF002254
Vollmer, S., Grätz, D., Schriever, S., Krötz, K., König, F., Svenson, C., et al. (2014). Sedimenttransport und Flussbettentwicklung der Binnenelbe. Koblenz: Bundesanstalt für Gewässerkunde (KLIWAS Schriftenreihe, 67/2014).
Whiting, P. J., and Dietrich, W. E. (1993). Experimental constraints on bar migration through bends: Implications for meander wavelength selection. Water Resour. Res. 29, 1091–1102. doi: 10.1029/92WR02356
WMO. (2010). Manual on Stream Gauging: Volume II - Computation of Discharge. WMO: no. 1044. Geneva: World Meteorological Organization.
Keywords: alternate bars, periodic bars, sand bed, river training, bar formation, Elbe River, bar characteristics, bar predictors
Citation: Branß T, Aberle J and Hentschel B (2023) Impacts on alternate bar geometry and dynamics in a trained sand bed river. Front. Water 4:1091872. doi: 10.3389/frwa.2022.1091872
Received: 07 November 2022; Accepted: 12 December 2022;
Published: 09 January 2023.
Edited by:
Michael Nones, Institute of Geophysics, Polish Academy of Sciences, PolandReviewed by:
Giuseppe Francesco Cesare Lama, University of Naples Federico II, ItalyMuhammad Abrar Faiz, Institute of Geographic Sciences and Natural Resources Research (CAS), China
Md. Bazlar Rashid, Geological Survey of Bangladesh, Bangladesh
Copyright © 2023 Branß, Aberle and Hentschel. This is an open-access article distributed under the terms of the Creative Commons Attribution License (CC BY). The use, distribution or reproduction in other forums is permitted, provided the original author(s) and the copyright owner(s) are credited and that the original publication in this journal is cited, in accordance with accepted academic practice. No use, distribution or reproduction is permitted which does not comply with these terms.
*Correspondence: Till Branß,  t.branss@tu-braunschweig.de