 Marc Stutter
 Miriam Glendell
 Adekunle Ibiyemi1
- 1Environmental and Biochemical Sciences Group, The James Hutton Institute, Aberdeen, United Kingdom
- 2Lancaster Environment Centre, Bailrigg, United Kingdom
- 3Department of Computer Science, Applied Mathematics and Statistics, University of Girona, Girona, Spain
- 4Biomathematics and Statistics Scotland, Edinburgh, United Kingdom
- 5UK Centre for Ecology & Hydrology, Edinburgh, United Kingdom
Phosphorus (P) pollution impairs river systems globally. There is long-standing interest in understanding catchment source P loads to inform mitigation to improve water quality. However, P sources to the hydrosphere differ individually in discharge behaviour, P intensity, bioavailability, and cumulative impacts. River condition also varies (e.g., riparian disturbance, climate change impacts) such that source and river resilience are likely synergistic but poorly studied controls on water quality variation. To challenge the use of overly-simplistic factors (e.g., basic soils and landcover) in empirical catchment pollution source-impact assessments, we pooled spatial data according to conceptual aspects of P source mechanisms and waterbody riparian condition. These were related empirically to P concentrations and loads, and trophic diatom indices, for 19 Scottish catchments (~10–250 km2) representing some mechanistic aspects of pollution loading and river impacts. Sources of P from septic tanks and farmyards influenced loads and ecological impacts. Some secondary calculations pooling spatial data such as septic tank source-delivery methods were novel, involving complex, but available, soil water flowpath data. In contrast, inclusion of channel condition and farmyard P loads used simple aerial imagery. Multiple Factor Analysis combined with Redundancy Analysis showed that source P loads expressed as bioavailable forms of P were better explanatory factors of diatom classification groups than stream soluble reactive P concentrations, although used together they improved explanation further. Riparian quality metrics were less powerful predictors than expected, likely with more scale-dependant effects on ecological functions than can be quantified by visual condition assessment on isolated short reaches. There was strong justification for examining separate P fractions (total, dissolved, particulate and bioavailable forms) by distinct catchment source types to understand better nutrient dynamics across land to waters, ecosystem degradation and waterbody impacts in the contemporary hydrosphere.
Introduction
Phosphorus (P) pollution remains a major water quality issue affecting aquatic habitats globally (Dodds et al., 2009; Finke et al., 2018; Jarvie et al., 2018). Strong legislative frameworks have been developed for protecting water quality and river ecosystems through monitoring and catchment management (EU, 2009). Landmark legislation such as the European Water Framework Directive (WFD; 2000/60/EC) has been founded on principles of closer management of waterbodies, their surrounding land and diversity of pollution sources. To inform effective mitigation, we need to understand not only the risks associated with sources of pollution and its transport to watercourses, but also how landscape pressures interact with different waterbody sensitivities to determine the level of water quality impacts (Bol et al., 2018). Land use change interacts with wider environmental change, such as climate, to alter pressures on rivers further (Ockenden et al., 2016). Phosphorus presents challenges for developing catchment frameworks, because of spatio-temporal patterns in waterbody biotic responses, complex mixes of diffuse and point sources, differing P forms with varying pathways and the nature of interactions with physical aspects such as light, temperature, water residence, sedimentation, and redox (Jarvie et al., 2013). There is a growing availability and awareness of spatial data for catchment characterisation (Tomsett and Leyland, 2019; Stutter et al., 2021a). This, coupled with developing environmental P concepts (e.g., Records et al., 2016; Goyette et al., 2018), means that it should be possible to explore simultaneously multiple aspects of catchment pressure and condition when examining ecological and hydrochemical responses of freshwater ecosystems and targeting P mitigation.
Load apportionment is a commonly applied tool for catchment P pollution management (Balana et al., 2012; Mockler et al., 2017). Approaches often target the relative roles of agricultural (mostly considered “diffuse”) and point sources. Basic discriminating characteristics between these source types may be included to provide a better link to spatio-temporal water quality variation (e.g., Greene et al., 2011). Edwards and Withers (2007) considered P sources in terms of their composition, using attributes of bioavailability (high, variable, low), strength (high, variable, low), and delivery (continuous, semi-continuous and episodic). They concluded that source distinction improved the understanding of biological impacts in receiving waters of different size and residence time, but that separation into point and diffuse P sources was too simplistic because important catchment P sources had intermediate behaviours in terms of concentrations and discharge drivers. For example, septic tanks, often considered diffuse sources, represent multiple small point sources ranging from diluted to concentrated effluents, discharging variously, including broken tanks flushed by rising water tables. Data on sources and water quality often differ; individual research catchments may have short-duration, intensive, sub-daily water quality characterisation to link with bespoke spatial characterisation (e.g., soil sampling; Jordan et al., 2012), whereas national studies often use country-wide spatial datasets and decadal, monthly regulatory river monitoring (Mockler et al., 2017), where utility to look at temporal aspects such as concentration vs. flow is being questioned (Pohle et al., 2021). However, approaches encompassing ecologically relevant pollution factors such as source bioavailable P are rare in individual catchment studies (McDowell et al., 2016) and very limited in national investigations.
Spatial data increasingly support catchment pollution investigations in connecting pollution sources to impacts. An example is progressing from whole catchment land cover proportions to land cover/management pressure characterisation in critical areas, such as near channel zones (Stutter et al., 2021a) or areas of high hydrological connectivity (Thomas et al., 2016). Close siting of P sources to rivers and alteration of pathways (e.g., ploughing, hard surfaces) maximises likelihood of P transport. Other frameworks express pollution risk concepts spatially, for example combining soil, crop and terrain parameters to derive spatial units of erosion risks (Baggaley et al., 2019) or leaching (Sinclair et al., 2013).
River ecosystem resilience is becoming recognised as a factor in river “state” that, alongside pollution source aspects, controls water quality outcomes due to the multiple interacting stressors of disturbance, pollution, and climate change (Wilby, 2020). Biogeochemical processes within a resilient river in good state may impart “self-cleansing,” reducing reactive nutrient concentrations and ecological impacts. Conversely, a sensitive river with high historical P enrichment, limited shading, and regulated flows may not buffer further changes in state, even to only small additional P loads or elevated temperature. River corridor management and condition is an example of developing research in multi-stressor water quality interactions (Feld et al., 2018; Pinay et al., 2018), with potential for explaining water quality variation alongside pollution source descriptors. This may also help to explain the observed disconnects between catchment source mitigation and expected ecological improvements, including lags and timescales for recovery (Meals et al., 2010). Structural degradation of riparian zones is associated with negative aspects of bank erosion, thermal stress, loss of carbon, and woody debris sources and loss of benthic habitat diversity (Stutter et al., 2021a). Hence, improving understanding of how waterbody condition interacts with pollution via experimental, empirical, and modelling approaches is a developing topic, with potential to inform risk and complimentary pollution and ecological improvement actions.
Increasingly complex catchment source and waterbody datasets are being brought together towards multiple stressor assessments in catchments with more sophisticated statistical techniques, and empirical-process model coupling, to evaluate individual stressors and stressor interactions and water quality trajectories (Segurado et al., 2018; Glendell et al., 2019). Glendell et al. (2019) used a variety of mixed model and regression tree approaches for P impact assessment in small UK catchments and concluded this benefitted the understanding of key drivers and interacting stressors. However, these authors also concluded that such methods would be robust and best tested using the highest temporal resolution stream data that is seldom available across wide stressor gradients. Pohle et al. (2021) used Multiple Factor Analysis (MFA) to integrate a range of catchment descriptors (landcovers, soils), derived hydrological indices with concentration-discharge (C-Q) hydrochemistry across macronutrients, major anions and cations in large UK catchments. The benefit of the MFA approach as a global principal components analysis type approach was to summarise multiple complex catchment datasets into an optimal low-dimensional space to facilitate interpreting data interactions; in their case catchment controls on solute exports.
The motivation for the present study was to challenge the use of overly-simplistic factors and supporting methods in empirical catchment pollution source-impact assessments by testing a suite of improved factors representing some mechanistic aspects of pollution loading and realised impacts. We developed concepts for representing sources in the hydrosphere, namely source behaviour, intensity, connectivity and phosphorus bioavailability into routines for catchment P source groups. Using spatial data and secondary calculations we combined representation of pollution sources with factors pertaining to P waterbody impacts. We recognise that the variety of simpler to bespoke methods we have combined have differing resource requirements, necessitating judgement of predictive returns for the efforts. This study provides a framework for evaluating the water quality assessment benefits of including such factors, using spatial data and pollution impact concepts, for 19 mesoscale catchments (~10–250 km2) in Scotland. The hypothesis being tested was that combining aspects along the P pollution chain from source behaviour to pollution delivery and waterbody condition could improve prediction of chemical and ecological attributes of stream water quality, as compared to simplistic source apportionment supplemented by basic catchment attributes. We aimed to assess whether the additional factors included in the model will aid the understanding and grouping of catchments according to their vulnerability (susceptibility cf. resilience) to water quality deterioration associated with P.
Methods
The methods and results are ordered (as Figure 1) by case study catchment characterisation, pollution source then waterbody condition parameters, followed by data synthesis.
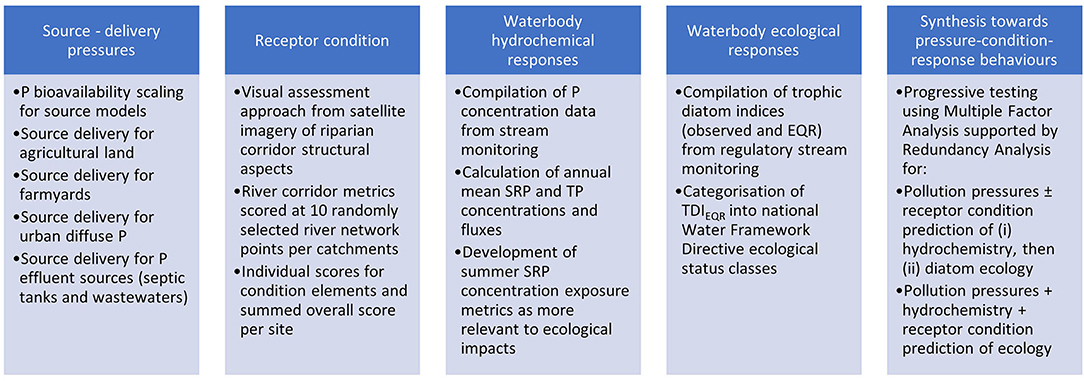
Figure 1. Overall concept linking methods across source delivery, receptor condition, waterbody responses, and catchment data synthesis for developing a better pressure-condition-response understanding.
Case Study Catchments
Nineteen small (<235 km2) catchments (Table 1, Supplementary Figure S1) were selected with national coverage across a gradient of diffuse and point source contributions types, availability of regulatory water chemistry data, and co-located discharge and ecological datasets (>10 years). The study presents a more detailed mechanistic scrutiny of a subset of a larger set of national catchments examined for landcover and soil drivers by Glendell et al. (2019). Topographic catchment areas were delineated from a 10 m resolution digital elevation model (DEM; ArcHydro tools in ArcGIS 10.2.1) and verified manually. We derived the structural attributes: channel network, field boundaries, slope (average per field) and land cover (Table 1). Channel network (natural watercourses and open ditches) and fields were derived from the Ordnance Survey Mastermap layer (https://www.ordnancesurvey.co.uk/docs/technical-specifications/os-mastermap-water-network-technical-specification.pdf). Proportion of arable, improved grassland, urban, woodland (native and plantation), and semi-natural land cover (grouping upland unimproved grassland and heath) were calculated for each catchment from the CEH Land Cover Map 2007 (Morton et al., 2011) in ArcGIS 10.2.1.
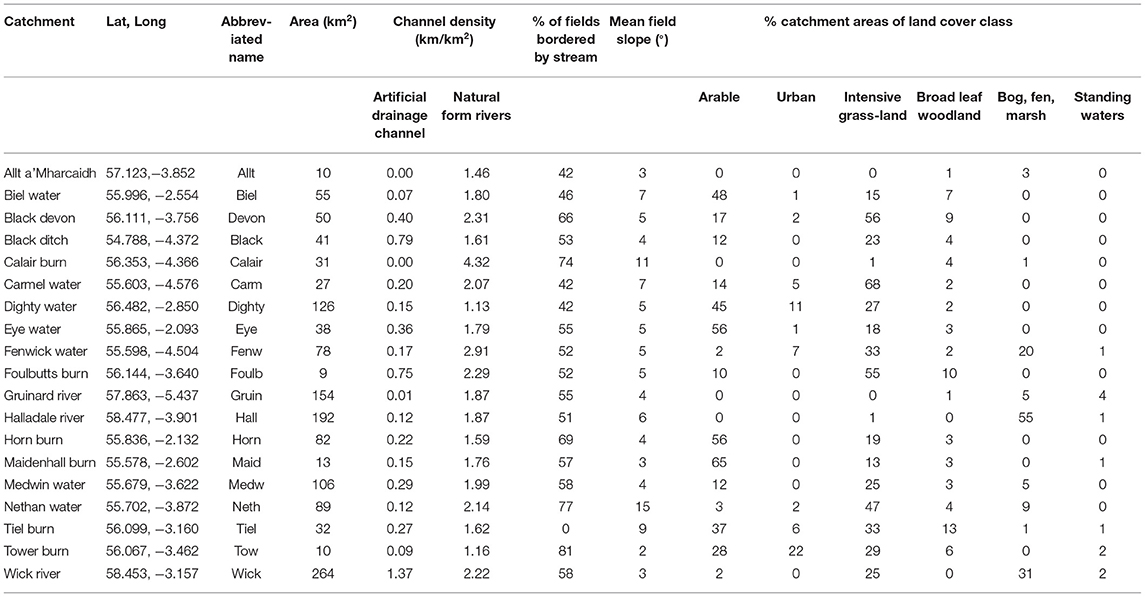
Table 1. Selected properties of the 19 case study catchments.
Source-Delivery Pressures
Source P Bioavailability Scaling
A literature review of catchment P pollution characterisation was undertaken (n = 24; Supplementary Table S1, methods and references in Supplementary methods); these were summarised for 10 source categories (Table 2). Sources were summarised in terms of continuous and episodic discharge behaviour (Edwards and Withers, 2007; McDowell et al., 2016), P concentration and bioavailability. The review included studies just reporting source P concentrations but specifically identified those evaluating the ecological relevance of source P (Ekholm and Krogerus, 2003; Ellison and Brett, 2006; McDowell and Koopmans, 2006; Su et al., 2014; Li and Brett, 2015; Qin et al., 2015; Prestigiacomo et al., 2016) according to the % of P deemed bioavailable through direct algal and bacterioplankton uptake and enzyme-labile P assays (full data Supplementary Table S1). Resulting summaries (Table 2) of the mean percentage of dissolved P (DP) and particulate P (PP) bioavailable fractions for each source group were calculated (subsequently termed BADP and BAPP, respectively (where BATP is the sum of BADP+BAPP) and compared to overall total P; defined in Supplementary Figure S2). Subsequently, for statistical evaluation, the source total P loads calculated for the 19 catchments (sections Source-Delivery for Agricultural Land, Source-Delivery for Farmyards, Source-Delivery for Urban Diffuse P Inputs, and Source-Delivery for P in Effluents) were scaled into loads associated with the constituent bioavailable P forms using the mean P % contributions for the relevant source groups in Table 2, according to:
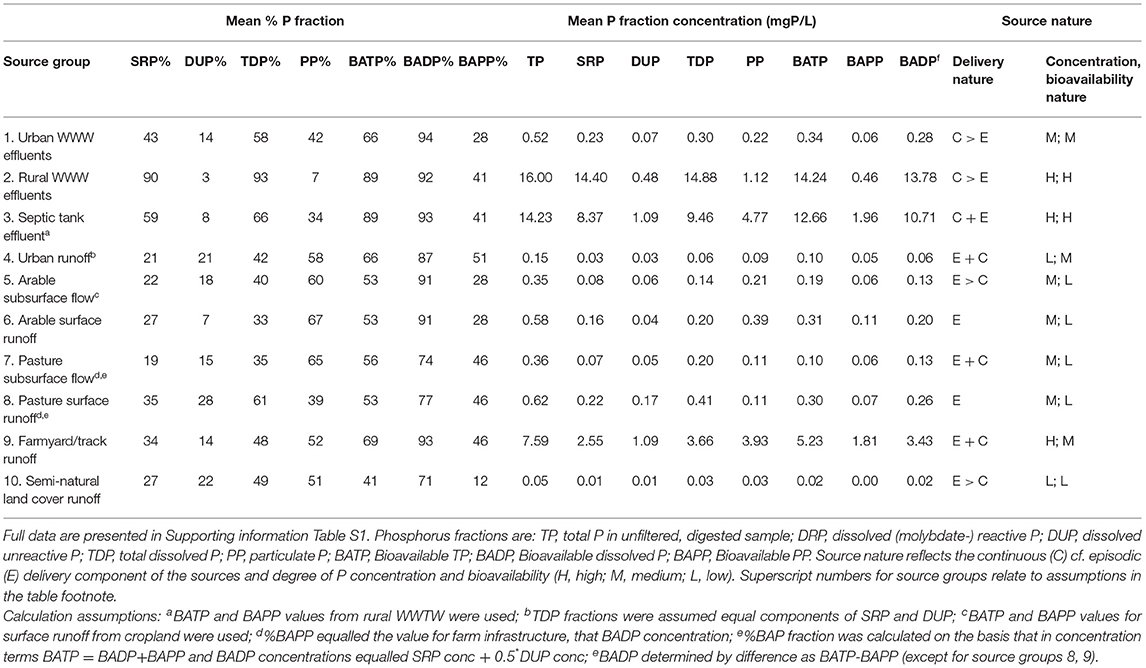
Table 2. Summary of literature-derived data on catchment source P chemistry, including dissolved and particulate fractions and their bioavailability from reported assays and interpretation of source behaviours.
Source load Pfr = Source total P load × (Pfr % source-specific contribution/100) [1],
where loads are kgP/ha/year and Pfr refers to one of the defined P fractions: BATP, BADP, BAPP.
Source-Delivery for Agricultural Land
Methods for this enhanced “loss coefficient” procedure are described in Supplementary Methods (Supplementary Figure S3). Phosphorus export risk classes were assigned to each field based on crop type and slope (adapted from Balana et al., 2012; Table 3). Crop type obtained from the 2016 agricultural census data (Integrated Agricultural Census Scotland; IACS) was assigned to one of five P risk classes that together with slope gave a source P export (Table 3) and this was subsequently modified by an export connectivity factor (Cf denoting a scaling of the proportion of the P load exported from the field to watercourse; Supplementary Table S2), the latter pragmatically differentiating riparian vs. non-riparian fields, surface, and subsurface pathways (see Supplementary methods). Briefly, unimproved grassland riparian fields (risk class 1) had a consistent Cf = 1 for surface runoff, non-riparian fields Cf from 0.1 to 0.3 (increases across gentle to steep slope categories), with negligible subsurface export. Increasing crop risk (intensive grassland P risk class 2, then cultivated risk class 3–5) increased surface relative to subsurface P exports for riparian fields and generated a greater overall contribution from non-riparian fields. At risk class above 2, commonly riparian fields had surface runoff Cf 0.5–0.8 (increasing with increasing slope categories) and surface and subsurface Cf summed to one. Non-riparian field surface Cf increased from zero to 0.5 with slope and risk class. Non-riparian subsurface Cf was constant across slope and risk class at 0.2. The mass of P (kg) exported annually from each individual field to the stream network was calculated as the product of the P export rate, field area (ha), and connectivity factor. Field loads were summed for each catchment (as g P/ha/year) for surface and subsurface pathways for the different forms of P (TDP, BADP, PP, and BAPP).
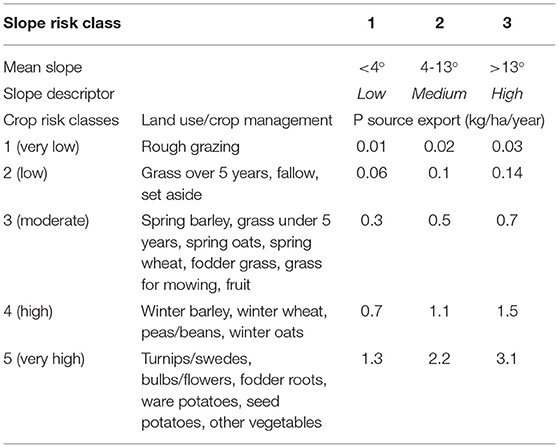
Table 3. Crop class and slope derived P source exports applied to field P losses.
Source-Delivery for Farmyards
The number and location of farmyards within each catchment were determined visually from Google Earth images. Mean number and range per catchment was 20 (0–49), with density 0.37 (0–0.93) yards/km2. The surface area of farmyard impermeable runoff generating areas (roof, concrete yard, hard tracks) was measured for 10 randomly selected farms in each catchment. The total farmyard area (average per farm area × counted number of farms) contributing to pollution in each catchment was split between grassland and arable P loadings according to the ratio of intensive grassland: arable land cover within each catchment (Table 1). Annual runoff volume for cumulative farmyard impermeable runoff generating areas area in each catchment was calculated as a product of area and average annual rainfall (observed at the nearest site held in the National River Flow Archive (https://nrfa.ceh.ac.uk/), ranging between 730 and 2,200 mm. Arable and grassland farm-specific runoff volumes were multiplied by total P (TP) runoff concentrations (3 and 16 mg P/L, respectively), split according to the fraction of TDP, BADP, PP, and BADP (Table 2), and expressed as g P/ha/year.
Source-Delivery for Urban Diffuse P Inputs
A simplistic export scaling of 1.5 kg TP/ha/yr was applied to areas of urban land cover (Morton et al., 2011) within a 500 m distance from the channel network (range 0–11 km2, mean 1.3 km2). Total P inputs from these areas were scaled according to the urban diffuse forms of P shown in Table 2.
Source-Delivery for P in Effluents
Municipal Wastewaters
Methods for deriving P loads from municipal wastewater treatment works (WWTW) are provided in Supplementary Methods (Supplementary Figure S4). Briefly, a national database of licenced effluent discharges monitored by the Scottish Environment Protection Agency (SEPA) indicated that 8, 4, 6 and 1 catchments had zero, 1, 2, and 3 WWTW effluent sources, respectively. This database included the location of each WWTW, with quarterly SRP concentrations (2008–2010) from which mean values (range 0.05–5.93 mg SRP/L) were derived. The WWTW discharge volumes were modelled using a relationship derived from the design capacity (person equivalent; P.E.) WWTW loading and the measured mean daily flow available from Scottish Water for a group of 82 WWTW. The derived relationship (with ±2 s.e. error term) was: Log10Measured mean daily effluent flow (m3/day) = 0.88 ± 0.04 × Log10 Design P.E; r2 = 0.85; p < 0.001. The SRP loads were scaled to the range of P forms in Table 2 and reported as g P/ha/year.
Domestic Septic Tanks
Full methods for deriving P loads from domestic effluents are given in Supplementary Methods (Supplementary Figure S5). Septic tank (ST) locations were determined using address-point locations outside of sewered areas (May et al., 1996) and straight-line distances were derived from each tank to the nearest watercourse. Spatial data for Scottish Soil Associations and drainage classes were used to assign transport modifiers from tank to watercourse (Supplementary Table S3) that reduce household P exports from the tank according to leachfield risk factors. The risk factors comprised:
(a) distance of the tank to the nearest watercourse (<100, 100–500, and >500 m);
(b) four soil P sorption risk classes (Supplementary Table S4; derived from Sinclair et al., 2013) ranging from 4 = greatest risk, low P sorption to 1 = lowest risk, high P sorption; based on mean soil oxalate extractable Fe + Al obtained for groups of parent materials (Soil Association parent material units);
(c) soil wetness class (Supplementary Table S5) translated from soil HOST (Hydrology of Soil Types; Boorman et al., 1995) classes and describing how wetter soils reduce the effectiveness of leach field sorption and increase the risk of effluent being transported from tank to stream (Neal et al., 2010).
For each dwelling, P losses per tank were calculated from P form concentrations in Table 2 multiplied by a daily per capita water usage of 150 L, assuming 2.17 persons/household (NRS, 2018). Leachfield modifiers were applied equally to all P fractions to reduce this load. The soil condition dependent scaling factors used were 0.2–0.8 in the <100 m distance class, 0–0.3 in the 100–500 m distance class and 0–0.1 for distances >500 m (Supplementary Table S3).
Waterbody Condition Assessment
This focused on visual assessment of Google Earth images using a scoring system for riparian characteristics (Table 4). Attributes for scoring were developed based on synthesis of riparian condition influences on river quality (e.g., Feld et al., 2018). Multi-criteria scores were developed for 100 m reaches upstream of 10 randomly assigned points along the channel network in each catchment (excluding channels designated as artificial ditches). Scores for each assessment factor were used individually and summed (out of a total of 30) to provide an overall condition score. The attribution for the Google Earth data was CNES/Airbus dated 2019. It should be noted that this post-dates the landcover dataset used by 10 years and the latest water quality data by 2 years. Whilst visually assessed development features may change within a decade the catchment-scale landcover data at the broad category level used will be expected to be more stable in time.
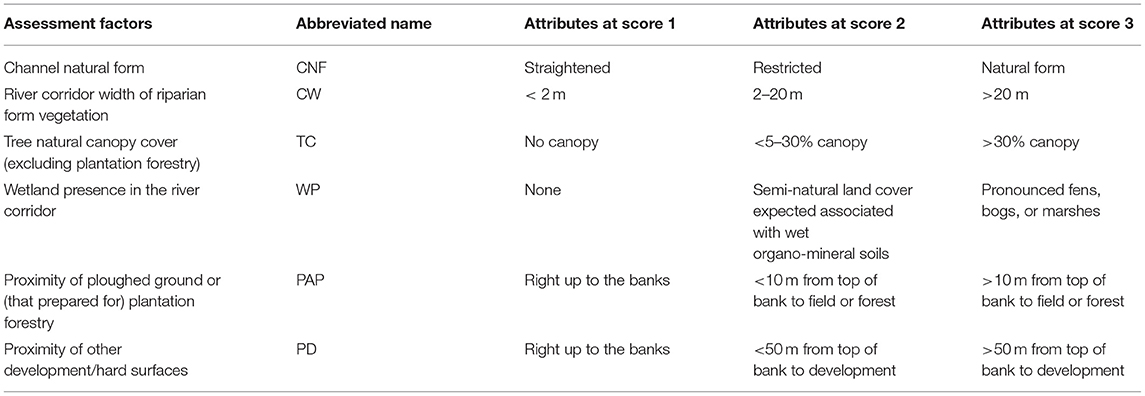
Table 4. Visual scoring assessment metrics used on 10 randomly located points and associated 100 m reaches upstream.
Catchment Chemical and Ecological Water Quality
Waterbody responses were derived from regulatory monitoring datasets, typically available at national scale. Ecological, water quality, and hydrological data were obtained from SEPA, with the selection criteria being that discharge observations were co-located (<200 m) with the water quality monitoring site.
Catchment P concentrations and fluxes were derived from 10 to 13 years of data (up to 2017) per site. Data comprised approximately monthly concentrations of soluble reactive P (SRP; molybdate reaction following <0.45 μm filtration), instantaneous river flows (Q) at the time of sampling and mean daily Q averaged from hourly data. Catchment SRP fluxes and flow-weighted mean concentrations were calculated using the interpolation method of Littlewood and Marsh (2005). Only SRP data facilitated this type of analysis because TP records were inconsistent. Hence, riverine SRP fluxes were compared with the results of the P source load modelling described in section Source-Delivery Pressures above.
A metric of summer exposure to elevated SRP concentrations was developed to compare with average annual SRP concentration as potential drivers of ecological condition. Average monthly SRP concentrations were calculated and cumulative exceedance above an ecological threshold concentration was summed between April and July, representing a period of maximum ecological sensitivity. The threshold of 0.1 mg P/L of SRP was applied since this has been shown to be associated with eutrophication impacts, whereby algal growth responds to changes below, but not above that concentration (Bowes et al., 2012). The computational steps applied to each catchment were: (i) calculation of the monthly averaged SRP concentrations (monthly [SRP]) over the monitoring period (± standard error confidence intervals) and (ii) calculation of cumulative concentration exceedance of the threshold SRP concentration (threshold [SRP]), then (iii) the mean gradient of the plot of cumulative exceedance vs. month for Apr-Jul was carried forwards into the statistical analyses.
Ecological monitoring data on benthic diatoms were obtained from SEPA; these covered spring and autumn sampling between January 2007 and September 2017. Data were summarised according to their pollution-tolerance using the Trophic Diatom Index (TDIobs) and expressed as the Environmental Quality Ratio TDI (TDIEQR), relative to the ecosystem quality potential of each stream type (UKTAG, 2014).
Statistical Evaluation of Catchment P Pressure-Response Behaviour Groups
Multivariate statistical analyses were undertaken to examine, progressively, individual, and cumulative effects of parameter groups on predicting waterbody responses using Multiple Factor Analysis (MFA) and Redundancy Analysis (RDA) (Escofier, 1994; Legendre and Legendre, 2012). The overarching aim of these methods is to find an optimal, low-dimensional representation of the information contained in the multi-parameter datasets to improve understanding and interpretation. MFA allowed us to analyse, jointly, the several parameter groups measured on the same catchments to identify common structures and discrepancies. The procedure fits common latent dimensions that allow each of the original datasets to be projected onto a consensus biplot display (including simultaneously parameters, treated symmetrically, and catchments). Within this process, adequate weights are applied to the datasets to reflect their individual degrees of variability so that each was represented equally in the common solution. This was complemented with RDA, which combined multivariate regression modelling with principal component analysis to enable the potential direction of the associations between parameter groups to be investigated explicitly. The graphical output of RDA is a triplot that combines the representation of parameters (in response or explanatory roles) and catchments.
The parameters selected for MFA and RDA comprised: (i) river corridor condition scores, (ii) a subset of P source load descriptors, namely BATP, BADP, and BAPP for field, farmyard, urban diffuse, ST and WWTW sources (informed by preliminary data screening that these P forms were most closely aligned to impacts), (iii) waterbody hydrochemistry, expressed as average annual mean concentrations and fluxes of SRP and TP and the summer SRP exposure metric, and (iv) the waterbody diatom ecology parameters of TDIobs and TDIEQR. Preliminary data exploration identified some very high Pearson's correlations within parameter groups (e.g., between sumTDP and sumBADP). Thus, redundant parameters were excluded from the prioritisation according to their relevance to the aims of the study to prevent instability among model coefficient estimates. Moreover, a further step was taken to reduce the two continuous TDI metrics to a single categorical variable based on the operational boundaries used in Scotland's implementation of TDIEQR scores into Water Framework Directive (WFD) status categories. We considered this suitable since there is already model uncertainty in the way that the TDIEQR score are derived, it simplified the data handling and messages in terms of relating to how these data are practically applied. These were High status (TDIEQR≥0.8; n = 6 sites in this study), Good status (≥0.6– <0.8; n = 7) and Moderate status (≥0.4– <0.6; n = 6), with no scores in the present study being in the Poor status class (<0.4). In addition, catchment area categories (<50 km2, n = 9 sites; ≥50– <100 km2, n = 5 sites; ≥100–264 km2, n = 5) were added to the graphical data depiction.
Following trial exploration of various parameters, the progressive analytical stages on the finalised data variables were: (1) MFA performed on the parameter groups for simultaneous representation of associations between all parameters, with continuous variables being scaled to unit variance, WFD status being used to represent waterbody diatom ecology, and the two first MFA dimensions (those accounting for the largest fraction of the total variability) being retained for biplot graphical representation; (2) RDA of hydrochemistry used as a response parameter group to pollution source descriptors and then to condition scores as explanatory parameter groups; (3) RDA of ecological response (TDIobs and TDIEQR continuous variables) to pollution source descriptors, then to condition scores and then to hydrochemistry as explanatory parameter groups; and, finally (4) variation partitioning based on partial RDA to assess the unique effects on ecological response of significant parameter groups (filtering out the influence of each other). The global view provided by MFA was supported with statistical results from the RDA to explore directional influences among datasets, including significance testing of RDA models using a pseudo-F statistic based permutational test (Legendre et al., 2011) and R2 coefficient of goodness of fit adjusted for number of explanatory variables and catchments (Ezekiel, 1930). These methods were applied using the R statistical computing v3.6 (R Core Team, 2019). Statistical significance was assessed at the usual 0.05 significance level.
Results
Phosphorus Concentrations and Bioavailability Associated With Sources
A literature synthesis of characteristics of catchment P sources (three effluent and seven diffuse P sources; Table 2) allowed the subsequent scaling of derived total P loads from sources (section Sources of Phosphorus in Catchments) to more ecologically relevant bioavailable P loads. In terms of source type group averages, the highest TP concentrations were associated with point source pollution from rural WWTWs and STs (16.0 and 14.2 mg P/L, respectively). Effluent from urban WWTWs had a smaller average concentration of 0.5 mg P/L due to legislation that promotes a higher level of treatment in urban WWTWs prior to discharge. In contrast, most land runoff sources (“diffuse” pollutants) had low TP concentrations (<0.1–0.6 mg P/L), apart from farmyards and tracks (7.6 mg P/L). The data compiled showed that SRP constituted a greater proportion of TP in effluents (43–90%) than in runoff (19–35%). In contrast, PP constituted a greater proportion of TP in land runoff (39–67%) than in effluents (7–42%). Mean BATP proportions were high for effluents (66–89%), intermediate for urban and farmyard runoff (66–69%) and low for other sources of land runoff (41–56%).
Sources of Phosphorus in Catchments
Here, total source P contributions are examined in terms of their total P (TP) and bioavailable scaled TP (BATP), and by their proportional contributions to the total of dissolved and particulate P forms (Figure 2; full data in Supplementary Table S6). Total P loads derived using the source estimation methods here (sections Source-Delivery for Agricultural Land, Source-Delivery for Farmyards, Source-Delivery for Urban Diffuse P Inputs, and Source-Delivery for P in Effluents) for combined sources ranged between <1 and 728 g P/ha/year (Figure 2C). Bioavailable total P (BATP) ranged from <1–487 g P/ha/year (Figure 2D), indicating 45–73% of TP being bioavailable. Of this, considerably more BATP came from BADP (60–88%) than BAPP (12–40%) due to the lower bioavailability of PP associated with dominant source types (Table 2).
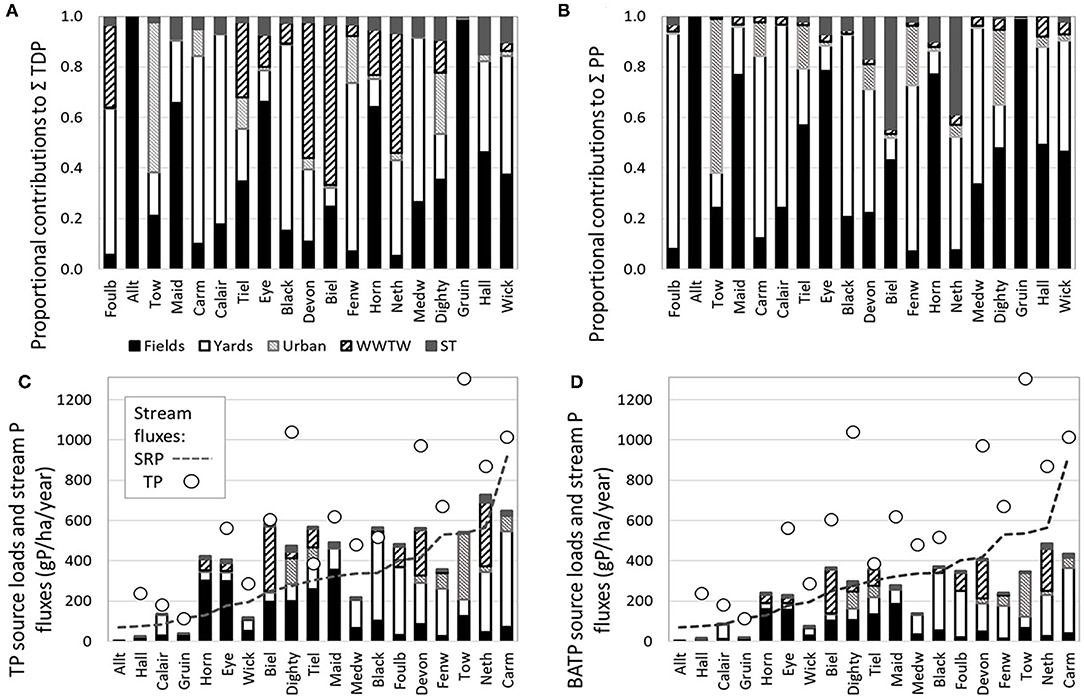
Figure 2. Summary results of the P source estimations and validation against the hydrochemical loads from observed data: Proportional contributions to the sum of (A) total dissolved P (TDP) source loads and (B) particulate P (PP) source loads. Absolute source loads of (C) total P (TP) and (D) bioavailable total P (BATP) are shown against the stream P fluxes (using common y axis). Note the different ordering of sites on the x axis: smallest to largest by catchment size on top row; by stream SRP flux on bottom row.
Overall, the greatest mean contributions to P loads across sites were from agriculture. Average percentage contributions of sources to TDP (Figure 2A) were: Field (36%) ~ Yard (35%) > Urban (8%) > ST (5%) > WWTW (2%). This was broadly similar for source contributions of PP (Figure 2B): Field (44%) > Yard (37%) > Urban (9%) > WWTW (7%) > ST (3%). For bioavailable P forms, there was an increase in the importance of farmyard and WWTW sources and decrease in field runoff importance, with average source contributions to BATP (data not shown): Yard (40%) > Fields (33%) > WWTW (14%) > Urban (9%) > ST (5%).
Field P inputs ranged from <1 to 356 g TP/ha/year, with considerable differences in source type contributions among individual sites. The highest P exports were not associated with the largest arable areas since gentle slopes led to lower predicted erosion (Table 3). Farmyard P inputs ranged from 0 to 474 g TP/ha/year, with the greatest exports found in areas of intensive grassland. There was an overall difference, nationally, between arable (mean ± 1 s.e. of 4,610 ± 995 m2) and grassland farm sizes (3,049 ± 420 m2).
In relation to effluent P sources, rural ST, and urban WWTW sources were considered separately. A total of 3,904 STs were evaluated, with numbers ranging between 0 and 1,180 STs per catchment and with a normal distribution of P losses between 0 and 32 g TP/ha/year. For the standardised tank TP export of 0.81 kg P/person/year the average (all catchments), post-leachfield loads had a mean (and range) 0.23 (0.15–0.53) kg P/person/year; a 72% reduction. Overall, the distribution according to the risk classes for distance from a watercourse was: 47% at <100 m, 49% at 100–500 m and 4% at >500 m. The distribution according to soil wetness/P transport risk was: 14, 51, and 35% in the highest, moderate, and lowest classes, respectively. Interestingly, 52% of ST in the closest class of proximity to receiving watercourses were also on soils at highest risk of being wet where the risks of P transport are greatest due to limited soil P sorption. Urban WWTW had a highly skewed distribution of P loads ranging between 0 and 319 g TP/ha/year. There were 8 catchments with no WWTWs (including one site at Tow, despite having an urban area of 22%). In extreme cases, WWTWs dominated overall P inputs at individual sites (>50% of TDP and BADP loads at three sites Devon, Biel and Neth). In contrast, ST P loading accounted for a more consistent background input of up to 15% of TDP and BADP.
Additionally, urban areas were examined in terms of diffuse urban P inputs. Total urban areas ranged from 0 to 22% of their respective catchment areas with a highly skewed distribution; at the extremes seven catchments had >2% urban areas and two catchments exceeded >10% urban areas (the latter accounting for 129 and 329 g TP/ha/year, respectively).
Waterbody Condition Scoring
The summed values from the visual assessment of Google Earth images highlighted considerable diversity among the structural aspects of the near-channel zone (Table 5). The total scores across sites ranged from 94 to 160 and the greatest and smallest variabilities were found in relation to presence of wetland (26%) and proximity to development/hard surfaces (11%), respectively. In Table 5, equal percentile scores for individual attributes are presented in bins equating to thirds of the range to convey low, medium and high risk values. In addition, sites are ordered from low to high according to the proportion of agricultural land cover in the study catchments. Catchments with lowest agricultural area contributions showed a dominance of high condition scores. However, condition scores within the lowest category occurred across all sites, showing that degraded river corridor conditions were observable across a range of land cover types at the time of the Google Earth imagery capture. The low scores ranged from catchments with limited extents of arable and intensive grassland (<12 and <25%, respectively; Wick, Black) to areas dominated by agriculture (>80%; Maid, Carm). Canopy cover (non-plantation) in the river corridor tended to be lower at sites with minimal agriculture, suggesting less coverage by riparian trees in moorland than in agricultural areas. Overall, the total condition score was correlated negatively with modelled TP load and arable landcover (p <0.05), but not other landcover types (Table 5B). Individual condition attributes correlated more often with landcover. Catchment areas of intensive grassland were negatively correlated with the width of natural vegetation along the river corridor, wetland presence and proximity of agriculture, whilst arable landcover was negatively correlated with channel natural form, presence of wetland, agriculture or plantation, and developed or hard surfaces, but correlated positively with riparian tree canopy cover.
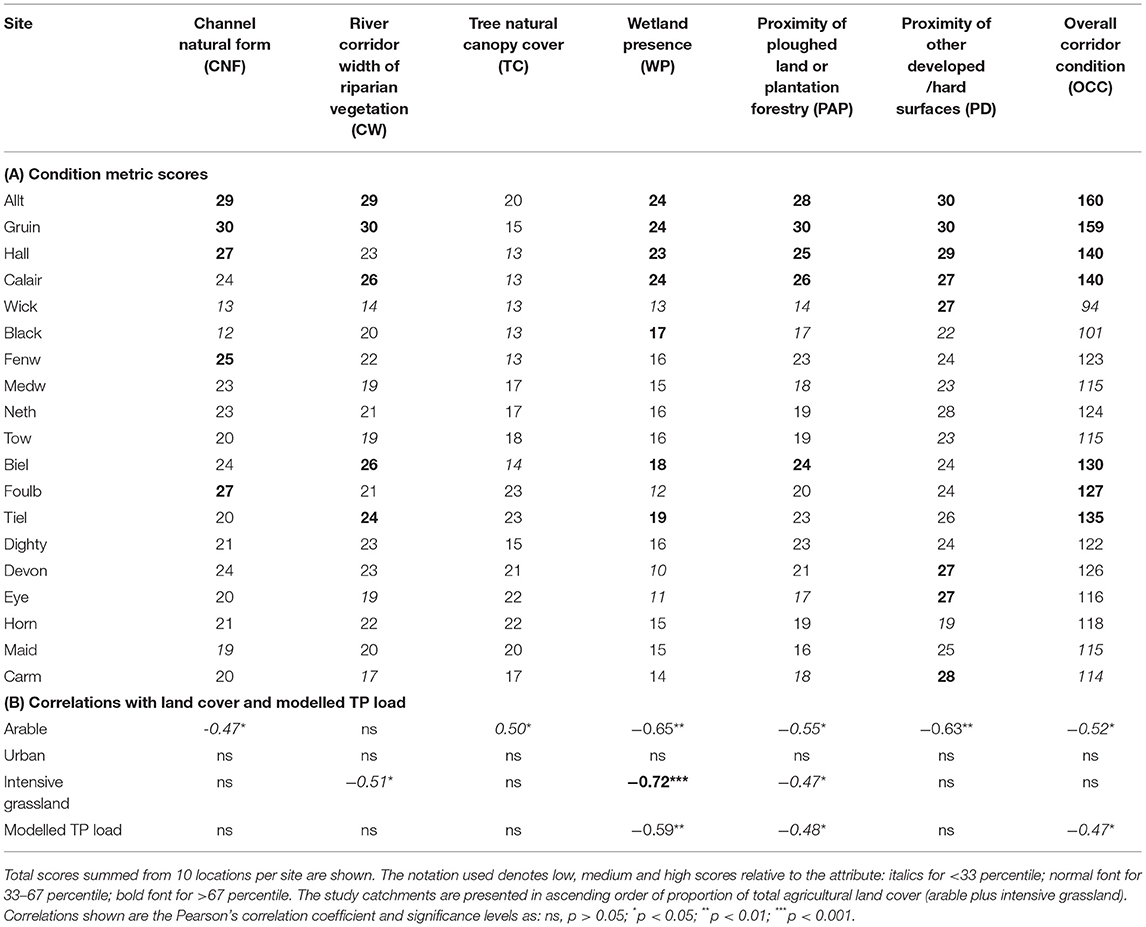
Table 5. (A) Visual assessment of structural attributes along stream corridors and (B) Correlations with selected variables.
Waterbody Phosphorus Exports Related to Source P Loading
Stream sampling data and discharge records allowed calculation of mean concentrations, flow weighted mean and fluxes of SRP (n = 19 sites) and TP (n = 16 sites only due to data gaps). Stream P fluxes (Figure 2, Table 6) taken from the observation hydrochemical and flow data (methods section Catchment Chemical and Ecological Water Quality) ranged from 71 to 917 g SRP/ha/year and 115 to 1,304 g TP/ha/year; the mean (and range) in SRP/TP flux ratios was 0.58 (0.27–1.00). The mean (and range) in SRP concentrations was 0.059 (0.004–0.135) mg P/L and in TP concentrations was 0.108 (0.008–0.232) mg P/L.
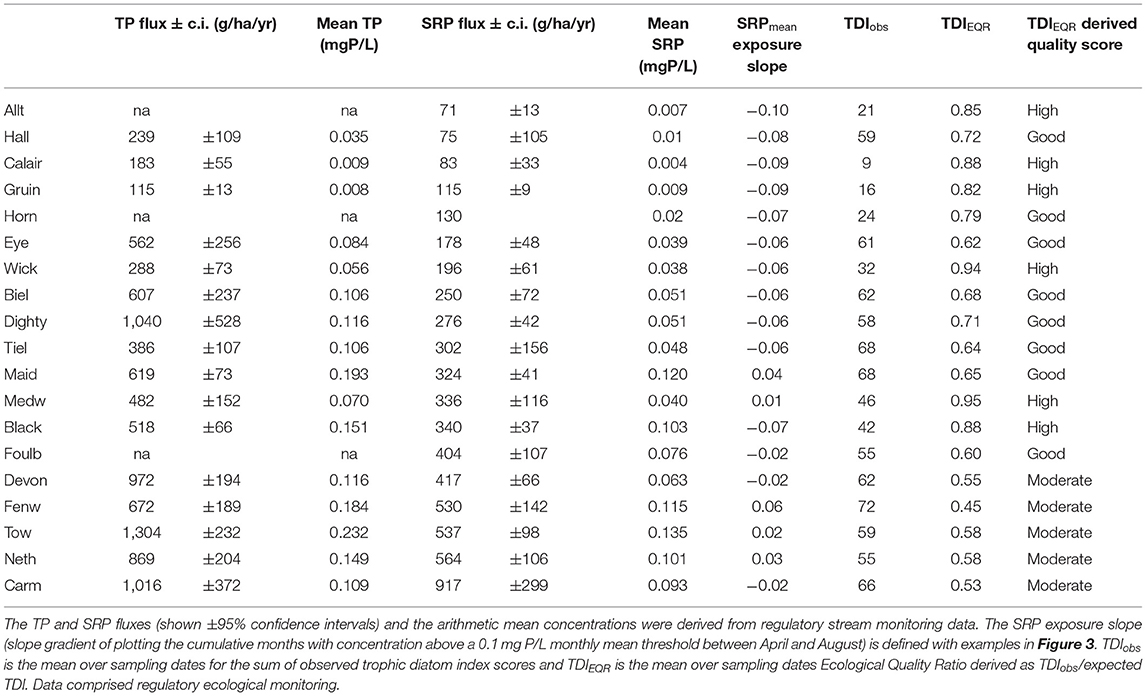
Table 6. Summary water chemistry and ecology data for sites ordered from lowest to highest SRP flux.
We compared the stream SRP flux to the modelled TP and BATP from combined sources (Figures 2C,D). Linear regression analyses explained approximately similar amount of between site variance in predicting modelled TP = (stream SRP flux * 0.74 ± 0.19) + 152 ± 71 (p = 0.001; R2 = 0.48) and BATP = (stream SRP flux * 0.52±0.12) + 84 ± 45 (p <0.001; R2 = 0.54). In terms of absolute magnitude, out of any of the calculated source P scaling factors, the modelled BATP loads agreed most closely with SRP stream flux calculated from monitoring data (Figure 2D). The order of decreasing Pearson's correlation of BATP loads from individual sources against stream SRP flux was: Yard (r = 0.79) > Urban (r = 0.68) > ST (r = 0.48) > Fields (not significant).
Water Ecological Condition and Exposure to Phosphorus
The trophic diatom indices of ecological condition comprised time averaged observed TDI values (TDIobs) and the ecological quality ratio (TDIEQR). It should be noted that TDIobs shows greater (percentage normalised) scores when pollution tolerant species are present (i.e., high values denote poor water quality) and TDIEQS shows higher ratios when better ecological quality potential is achieved (ie opposite direction to TDIobs). The mean (and range) across sites was 49 (9–72) for TDIobs and 0.70 (0.45–0.95) for TDIEQR (Table 6).
The sum of monthly average SRP exceedance (sum mg P/L) above the proposed biological threshold of 0.1 mg P/L summed for the ecologically-sensitive period May-July was explored for potential utility as a predictor of ecological impacts in comparison to the simple long-term average annual site SRP concentration. Representative summer SRP exposure profiles (Figure 3) for (a) a mixed agriculture, urbanised catchment (Tow), (b) an intensive grassland catchment (Carm), and (c) a semi-natural catchment (Gruin) show differing SRP seasonality. The exposure metric results in positive and negative slope gradients over months above or below 0.1 mg SRP/L, respectively. Slope gradients between May-July were positive at five sites and negative for the remaining (Table 6) and values were strongly related to mean SRP concentration (r2 = 0.95). Although the summer exposure index was also related to the sum of source P loads (R2 of 0.24, 0.21, and 0.31 for TP, BADP, and BAPP, respectively) there was no indication that P loads from sources characterised as more continuous discharges (WWTW, Urban and STs; traditionally viewed as consistent sources subject to limited dilution during summer river flows) were better predictors of streams exceeding the 0.1 mg SRP/L during summer. For example, of the four sites (Black, Maid, Neth, Tow) where SRP was consistently >0.1 mg P/L in summer, Maid was dominated by field sources (considered episodic rain-driven sources) and only Tow and Neth had appreciable WWTW and Urban sources.
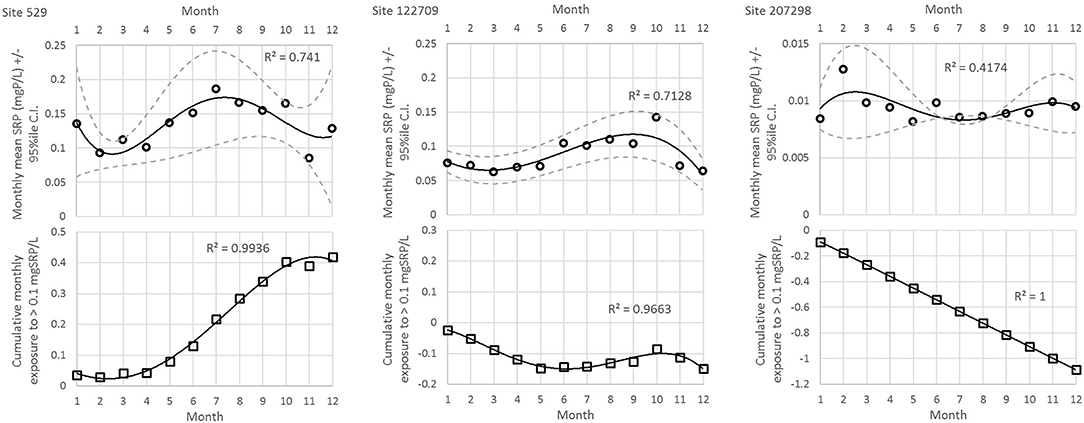
Figure 3. Example types of SRP concentration—exposure plots for three contrasting catchments.
Statistical Synthesis Towards Catchment P Pressure-Response Typologies
As a visual aid to the overall data, Supplementary Figure S6 provides a pollution “heat-map” of the 19 sites. Pearson's correlation coefficients between individual parameters are restricted to the Supplementary Information (Supplementary Table S7). The pairing of MFA (highlighting associations across pooled data) with RDA (exploring explanatory roles of data) provides the main empirical synthesis of findings.
The MFA biplot provides a global analysis based on the first two MFA dimensions accounting for 63% of the total variance. The first MFA dimension (43% variance) shows divergence between all but one of the condition scores to the left (see Table 4 for key) and hydrochemistry and some attributes of pollution sources to the right (Figure 4A, showing quantitative variables only). The second MFA dimension (20% variance) shows a weaker separation of attributes of the pollution sources and, to a lesser extent, condition scores. Where similarity of angle denotes the degree of correlation there were strongest positive associations within hydrochemical parameters for BATP_Yard, BATP_Urban, sumBAPP, whilst these formed an approximately right angle with BATP_WWTW and BATP_Fields indicating close to uncorrelation between the two parameter groups. The river corridor score of broadleaved tree cover (TC) appears uncorrelated with other condition metrics and closely correlated with BATP_Fields and BATP_WWTW. This counter-intuitive result relates to remnant river corridor tree cover in lowland arable landscapes contrasting with tree removal and lack of regeneration in semi-natural, upland Scottish landscapes.
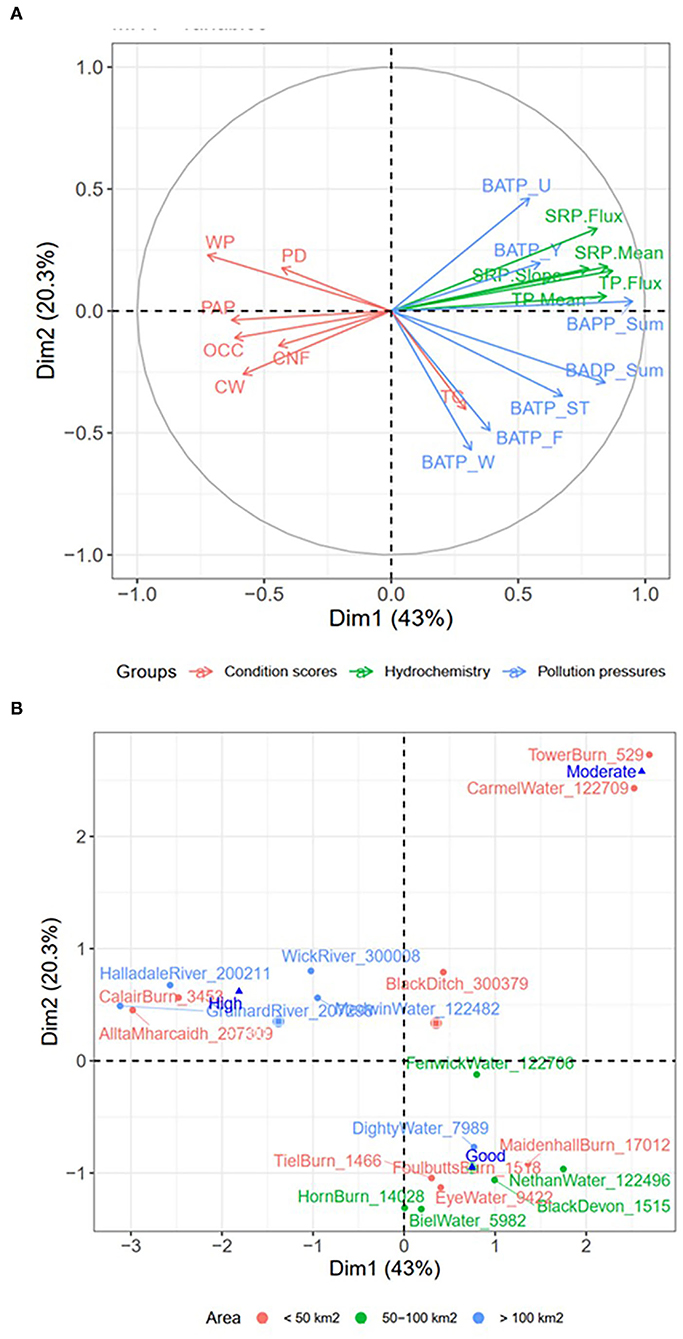
Figure 4. Multiple Factor Analysis (MFA) biplot in two dimensions split into (A) parameters and (B) catchments and waterbody diatom ecological status, with colour keys as separately noted. In (A) parameters are represented by rays coloured according to parameter group; in (B) sites and WFD ecological status clusters are identified, represented by sites with colour denoting catchment area.
The representation of the site's component of the MFA biplot (Figure 4B) shows three clusters with sites in the high status class (based on TDIEQR classification) clearly linked to higher river corridor condition scores. Sites with Good ecological class were linked to bioavailable P from WWTW and field sources and sites with Moderate condition were linked to urban and farmyard sources. The differentiation of area categories (Figure 4B) shows that moderate status occurred in smaller catchments with other ecological status classes in a mixture of catchment sizes (although medium size catchments tended to be of Good status and larger catchments were mostly High status).
The RDA results indicated that condition scores did not appear to show a statistically significant role in explaining variability in hydrochemistry (adj R2 = 33%, F-test p = 0.474) and had a weak but unclear role in explaining variability in the quantitative TDI scores (adj R2 = 30%, F-test p = 0.085). However, a statistically significant RDA model (F-test p = 0.002) indicated that 61.7% (adj R2) of the variance in hydrochemistry was explained by pollution source descriptors and was most closely correlated with sumBAPP and BATP_ST along the first RDA dimension (triplot Supplementary Figure S7). A highly statistically significant RDA model fit of ecological response (quantitative TDIobs and TDIEQR) on pollution sources was obtained (adj R2 = 64%, F-test p = 0.001; triplot Supplementary Figure S8), where higher TDIobs and lower TDIEQR were associated with higher source bioavailable P loading in general, particularly with BATP_Yard, BATP_ST and sumBAPP, whereas BADP_Field and BATP_Urban seemed the least related to ecology. Moreover, hydrochemistry was also found to have a statistically significant influence on ecological response (adj R2 = 68%, F-test p = 0.001). Variation partitioning analysis helped to decipher the unique contributions of pollution sources and hydrochemistry to the variability of ecological response by filtering out the interaction effect with the other (either hydrochemistry or pollution sources). These unique contributions were estimated to be 24% for pollution sources and 5% for hydrochemistry. Hence, pollution sources better explained ecology than hydrochemistry, however the largest effect came from the interaction of the two parameter groups.
Discussion
The motivation for this study was to go beyond the conventional data (such as landcover proportions) used by catchment scientists to explain spatial differences in water quality responses. Steps were taken to improve the characterisation of P pollution sources, behaviours and loadings, river corridor condition, and hydrochemical responses to predict ecological status based on regulatory monitoring of diatoms. The approaches derived here are discussed below with respect to previous methods applied in catchment studies, their predictive benefits, transferability, and potential for wider adoption.
Improvements to Phosphorus Source Representation
Phosphorus sources were considered in terms of source delivery behaviour and bioavailability scaling of total delivered P. Previous studies have contrasted P delivery from consistently discharging effluents and rain-driven field erosion as drivers of varying duration and seasonality of ecological exposure to elevated P concentrations in waterbodies (Edwards et al., 2000; Jarvie et al., 2006; Stutter et al., 2007; Jordan et al., 2012; Stamm et al., 2014). The method here expands on previous concepts of pollution source bioavailability, strength and nature of delivery (Edwards and Withers, 2007), substantiated by data from a literature review of catchment pollution studies to derive source group concentrations of functional P forms (Supplementary Table S1, Table 2). Studies determining P bioavailability from which scaling factors could be derived (dominated by algal and bacterial assays, some enzyme-labile P, supplemented by few chemical surrogate assays) were limited compared to more comprehensive data on total P concentrations and forms. Hence, future studies should target analysis of bioavailability of P forms, especially current knowledge gaps for ST effluents, surface runoff, and drain flow from pasture. Generally, the literature review highlights the high bioavailability of total dissolved P (71–94%; due to total bioavailability of the SRP component) but lower bioavailability of PP (12–51%), in agreement with Prestigiacomo et al. (2016). Considering that PP dominates P sources such as field runoff (PP:TP concentrations >0.5; Table 2) this strengthens the argument that dissolved P sources such as effluents and yard runoff may have greater ecological relevance. However, it should be recognised that particulate P can reside in benthic sediments, with in-stream release in summer influencing seasonal P exposure (Stutter et al., 2021b).
Furthermore, we separately calculated loads for a wide selection of P sources, with novelty in incorporating STs and farmyard loadings. For fields, our P loadings extended earlier export coefficient work (Balana et al., 2012) that was calibrated via stream P budgets in Scottish arable catchments. This earlier work utilised the same P exports based on slope and crop P risk classes (Table 3). The improvements, here, were to evaluate risks on a field-by-field basis, further adjust the exports using surface and subsurface delivery splitting TDP and PP (Supplementary Table S2, linking with Table 2) and utilising best available land management data collated from agricultural census to better refine crop management P risk (e.g., varying P exports for winter compared to spring sown cereals).
Septic tanks are an important potential source of bioavailable P that is generally poorly recognised in catchment modelling (Withers et al., 2014). Their high P concentration and bioavailability (Table 2) together with abundance in the case study catchments (up to 9.4 tanks/km2) supports them as important rural P sources. We considered that export from the tank was a product of the moderation of loads by the leachfield (often termed “soakaway”), as represented through soil P leaching risk factors. Estimates of P migration range from 97% TP retention (Mechtensimer and Toor, 2017) to SRP concentrations (4.8 mg P/L; 75% in tank effluent) migrating at 1 m per year (Robertson et al., 1998). Our modelling (Supplementary Figure S5, Supplementary Tables S3, S4) recognised that sorption/precipitation reactions dominate the retardation of P plumes from leachfields, meaning that redox, soil pH and P sorption capacity become important. We developed delivery multipliers for STs (Supplementary Table S3: 0.2–0.8, 0–0.3 and 0–0.1 at distance classes of <100, 100–500, and >500 m, respectively) that varied by soil P sorption and wetness/transport. Conceptually, these operate on the three pathways to surface waters identified by the ST modelling by Mockler et al. (2017); multipliers close to unity reflect pathways associated with near distance/wet ground indicative of low percolation, moderate values reflect surface soil transport of plume migration rates per distance according to soil P sorption and low to zero values show groundwater background pathways.
A further refinement to the P source modelling was inclusion of farmyards, already highlighted as sources of concentrated and bioavailable P (Table 2). It became apparent, when constructing relationships between P source loadings and stream P fluxes (Figure 2), that accumulated field, WWTW, urban and ST losses were small relative to those observed in rivers. Then, simple metrics were derived for scaling the farmyard P concentrations in Table 2 to P exports based on impermeable runoff generating yard areas and rain wash-off. Such routines based on data compilation and visual analysis of freely available aerial images showed considerable P loadings from yards to close the gap with observed stream P fluxes. This supports recent analysis of the role of farmyards in “diffuse” P loading from agriculture in Ireland (Harrison et al., 2019) where 75% of farms had direct hydrological connexion to streams and were highly influential sources of P to overall headwater P inputs. The simple model here recognises directly connected transport and the mobilisation process of rain wash off from the hard surfaces (Edwards and Hooda, 2008; Edwards et al., 2008).
The Incorporation of Waterbody Condition
River corridor condition scoring aimed to provide quantification of the state of the receiving waterbodies with a view that this would interact with phosphorus source behaviours to better explain the hydrochemistry and/or ecological condition. The metrics covered key riparian factors as reviewed by Feld et al. (2018) and found to be influential when interacting with physico-chemical parameters in shaping water quality: presence (here represented by aggregated score), density (here canopy cover), structure (here channel form, wetland presence), width (here as width of riparian vegetation, distance to plantation and hard surfaces). According to Feld et al. (2018), P and light drive change in aquatic primary production. In turn, evidence shows that P is affected by urban effluent and agricultural pollution interacting strongly with riparian width and moderately with composition and presence/length of riparian vegetation. Literature evidence indicates that light is affected by riparian composition, presence/length, and density. In the present study, low riparian condition scores (associated with loss of natural vegetation and wetlands) were weakly correlated (p < 0.05; Supplementary Table S7) with increased stream SRP concentration. Feld et al. (2018) noted that both light and P have uncertain interactions with riparian connectivity/location, but this was not scored by the spot survey approach in this study. The high scores of TDIobs, showing the presence of pollution tolerant species, were weakly correlated with the overall condition scores (p < 0.05) but were strongly related to degraded wetlands (p < 0.001) and proximity to ploughed land/plantation (p < 0.01; Supplementary Table S7) associated with intensive grassland land cover (Table 5). Hence, there were no clear links to diatom quality and drivers of altered light. The negative correlation of arable land cover with straightened channels, loss of wetland, and proximity to ploughed and developed land (Table 5) was not surprising given the extent of drainage and intensification of Scottish arable land. However, arable areas seem to maintain riparian zones where natural tree canopy cover of >30% exists; hence a key moderator of light availability occurs alongside arable P sources.
Few catchment frameworks have integrated condition and pollution metrics. Röman et al. (2018) reported additional catchment-wide parameters that improved empirical prediction of stream nutrient exports in Finland. These authors typically included parameters related to source descriptors (soils, deposition, livestock density), whereas lake and rivers connectivity was the only parameter relating to within waterbody conditions of P cycling or condition. Few studies have attempted to combine waterbody condition scores with river resilience to pollution. Shiel (2010) related water quality in subcatchments of the Mississinewa River, Indiana, to a range of GIS-derived landscape indices including natural landcover type, wetland and drained land extent, and catchment-wide and natural vegetation specific to a 100 m (each bank) river corridor. Whilst the present study has an exclusive focus on river corridors (Table 4), several of the metrics used by Shiel (2010) were similar although their study found no significant relationships with water quality, likely related to use of single water quality grab samples per location. In contrast, in Australia, the Index of Stream Condition has been developed into regulatory methods following successful evaluation (Ladson et al., 1999) and incorporates several metrics of corridor condition including width, longitudinal continuity and indigenous species contributions of corridor natural vegetation, wetland condition, bank and woody debris assessments. Villeneuve et al. (2018) concluded strong indirect effects of hydromorphological condition aspects (e.g., riparian characteristics) and inter-relationships with land cover controls on stream macro-invertebrates. According to Feld et al. (2018), stream invertebrates are affected by primary producer food sources (in turn with P and light controls) but additionally by more diverse riparian interactions controlling fine sediment, temperature and woody debris.
Parameter Explanatory Power vs. Effort in Water Quality Prediction for the 19 Scottish Catchments
This study sought to evaluate the hypothesis that combining source P behaviours and waterbody condition improved water quality responses and aimed to assess the relative benefits vs. resources associated with various parameters and their derivation. The study limited the number of catchments in favour of detailed analysis; seeking to balance sample size with the resource requirements of simple to complex, automated to manual, routines across the pressure-condition-response data sets. The more mechanistic exploration afforded here by inclusion of more detailed data on pollution and condition factors can be compared to the study by Glendell et al. (2019), that traded less detailed spatial data for a larger sample site population (inclusive of the current subset). Strong gradients across the relatively limited 19 case study catchments were incorporated to maximise likely relationships. The case study catchments had a large range of calculated P loadings (< 0.1–1.3 kg TP/ha/year; Figure 2C) and covered strong landform and land cover gradients across Scotland, which were expected to extend the range of possible stream hydrochemical and ecological responses. Bioavailable P (BATP) comprised 45–73% of TP, much greater than the ~26% found by Prestigiacomo et al. (2016) for sources to Lake Cayuga, New York, where point source reductions (~5% BATP contribution) had maximised relative agricultural BATP sources, with a large contribution of low bioavailable PP. Conversely, the present study found that bioavailable P from farmyards was appreciable (40% mean contribution across all sites) compared to field runoff (33%) and effluent sources (14%WWTW, 5% ST). Whilst farmyard loadings were modelled, confidence in their derivation is given by the fact that source P loadings only approximated the observed catchment stream P exports once farmyard sources were included (Figure 2).
Although nutrient concentrations scaled by bioavailability have been considered elsewhere (Stutter et al., 2007, 2018), studies relating P source bioavailability (even model scaling factors) to observed aquatic ecology are extremely limited. Herrero et al. (2018) and Munn et al. (2018) noted that TP predicted diatom responses better than SRP in Spain and the U.S., respectively; such studies are typical of those relating ecology to chemical analysis-defined P forms. In this study the strength of associations derived from simple correlations between pollution parameters and river ecology (TDIobs; Supplementary Table S7) followed the order: sumPP (r = 0.91) > sumBAPP (0.87) > %arable area (0.86) > sumTDP (0.83) > sumBADP (0.82) (all p < 0.001). Of note was: TDIobs was associated strongly with percentage of arable land cover, with PP at least as strongly associated as TDP and more than bioavailable P forms; whilst TDIEQR was associated with BATPurban and % urban land cover. However, more knowledge on the inter-relations between the factors is required from mechanistic studies and in this study the MFA-RDA approach provided a more appropriate multi-parameter synthesis to guide such future work.
The MFA statistical synthesis (Figure 4) is used to evaluate the integration of pressure-condition-response variables in this study. An initial exploration of TP vs. bioavailable P loading metrics noted near-perfect correlation with a slightly better performance of the bioavailable scaled loads, which were then carried forwards into further statistical analysis. The MFA targeted TDIEQR expressed as a categorical variable with three of the four possible quality categories implemented under the Water Framework Directive (WFD; Moderate, Good, High, with no sites scoring Poor). The TDIEQR is already a modelled value with uncertainty that is smoothed using the four categories that are embedded in the national regulatory framework. In summary of descending quality scores, the high ecological status group was associated with high condition scores (except for tree canopy cover noted above), low stream SRP concentrations and low source bioavailable P. The good ecological status group then showed an abrupt change to elevated pressures (high bioavailable P from WWTW, fields, and STs) and degraded riparian condition scores. The moderate ecological status group, found only in smaller catchments, was also associated with degraded riparian condition but also with high bioavailable P from urban and farmyard sources that manifested in elevated stream SRP concentrations.
Recent studies have noted that targeting catchment actions based on vulnerabilities would increase mitigation cost-effectiveness (Bol et al., 2018). This study suggests that improved P source characterisation as developed here, alongside SRP monitoring data, are best indicators for targeting of mitigation based on ecology; with variance partitioning showing that bioavailable P source loads were better predictors than river P concentrations, but both explained most variance when combined. The value of deriving riparian condition scores was only moderately supported. Such scores defined sites of high ecological status but had no relationship with stream P concentrations or loads (p = 0.5; by RDA) and was not significantly associated with the ecological status (p = 0.09). In the absence of stream monitoring data, aerial image assessment has a place in identifying sites of high, relative to impaired, ecology. However, when observed P concentrations (including national monthly regulatory data), or source P estimations are available, the conditions scores add relatively little additional explanation. Furthermore, the summer SRP exposure metric performed no better than annual mean SRP concentration (p < 0.001) that forms the basis of existing P assessment under WFD. Highly significant RDA models (p < 0.001) supported the effort in source P load calculations. Source total bioavailable P loads predicted both TDIobs and TDIEQR (with explanatory power: farmyards and STs > WWTW > urban and field sources). The RDA showed that river SRP concentrations were equally successful in explaining variation in ecological status (p < 0.001). However, variance partitioning showed that source bioavailable P loads (24%) explained a greater amount of variance in the ecological response than SRP concentration (5%) alone, with most variance explained when both sets of predictors were included in the analysis.
We selected diatoms as the ecological response due to known strong relationships with P, however we did not examine N limitations in the current study. Future incorporation of N alongside P may improve ecological predictions as N and P co-limitation is known, especially for headwaters with substantial semi-natural areas (Jarvie et al., 2018; Glendell et al., 2019).
Transferability of Approaches
This study aims to combine procedures that are transferable between differing national data sets and availabilities. To that end, regulatory environmental surveillance data have been used (e.g., effluent discharge locations, river chemical-ecological monitoring) assuming approximate comparability between countries/regions and that local specific data may be substituted. The hydrochemical and ecological data used here are typical of regulatory monitoring of water quality assessment since relationships between annual mean phosphate and ecological indicators such as diatoms have long been explored. The source P form and bioavailability database is transferable, having been drawn from international datasets and may be applied directly to other P loading case studies. A possible exception is in extreme climatic zones of cold-warm, or drought where the studies bias to warm to cooler temperate climates (NW Europe, supplemented by US and New Zealand).
The source loading methods are underpinned by spatial data within GIS frameworks that are, typically, highly available. Fundamentally, this is underpinned by an accurate representation of the watercourse network for riparian/non-riparian field discrimination and pollution transport distances. In the UK data used this includes connected, open artificial drainage channels (ditches) from the OS Mastermap database. We recognise a range of possible data availability from mapping of natural channel form to no channel data where flow accumulation routines must be run to map watercourses. Although field boundary mapping may be available, it is recognised that field by field agricultural census data as used here are seldom accessible, necessitating the use of land cover data with fewer basic cropping categories. Here, we advocate the utility of widely available satellite imagery (or aerial photography) such as Google Earth. The resolution and recent acquisition of these data, available at a Scotland level, was entirely appropriate for deriving farmyards and riparian-channel condition metrics and confirming WWTW presence. When overlain with catchment boundaries and stream networks, such imagery provides a tool for rapid and powerful visual assessment of riparian condition and land cover.
In this study, procedures to derive effluent losses have used quite specific data. For WWTWs, locations of regulatory licenced discharges were available. It is presumed that equivalent data will exist in many countries, albeit with varying availability to researchers. Septic tank P losses used specific datasets for locating and understanding P delivery risks. It is assumed that some ability to intersect rural households and non-sewered areas will be possible in many countries with existing spatial data (e.g., Mockler et al., 2017, for Ireland). The soil risk factors used here for the soil leachfield parameters use secondary frameworks of soil water flowpath and P sorption chemistry based on soil map units and soil and catchment hydrology calibrations (e.g., Boorman et al., 1995) and extended across Europe (Schneider et al., 2007). Hence, we believe that the proposed framework here will be transferable to many developed countries with regulatory monitoring data and widely available open-source spatial data sets.
Conclusions
This study sought to evaluate the potential of additional analyses, characterising the bioavailability of P sources and riparian condition, to improve prediction of P concentration and ecological status in 19 Scottish catchments, by combining novel metrics of pollution sources and receptor condition and relating them to P concentration and diatom conditions. Although of limited sample size, the study sites spanned large source loading and type, landform, and landcover gradients, while allowing the development of relatively time-consuming analysis routines and condition scores using a variety of automated to manual methods.
Septic tanks and farmyards were noted as important sources both quantitatively and in predicting hydrochemical water quality and ecological responses. A large source P load deficit was apparent when comparing total P catchment loadings and stream SRP and TP flux data until farmyard P contributions was accounted for. Multiple factor analysis (MFA) has shown that P from farmyards and STs explained better TDI scores than urban and field sources (with WWTW intermediate). These findings support further development work of these source terms that are seldom derived in existing models. This should include validation of farmyard loads, leachfield scaling factors modifying ST loads and potential for automated image analyses to identify farmyards. The concepts of source delivery behaviours (episodic vs. consistent) informed more on processes than having any empirical predictive power.
In the RDA approach, bioavailable P totals and source-related modelled P loadings explained more variance in TDI metrics than observed SRP concentrations, but combined predictors explained the most variance. In the absence of chemical monitoring data, the modelled P loads would provide a good screening tool for catchment mitigation and ecological improvement actions and this situation may be appropriate in countries with sparser regulatory surveillance. However, whilst some P load calculation routines relied on complex datasets (e.g., soil chemistry and flowpaths for STs), others are achievable from basic remote sensing imagery (e.g., farmyards and urban area). The MFA approach of pooling pollution metrics to explore site categorisation into ecological groups supports classification groups used in regulatory frameworks such as the EU WFD. The simplistic pairwise correlations and the synthesis of MFA-RDA approaches support examining particulate, dissolved and bioavailable forms of these broader P form groups as they relate differently to river ecological effects alongside source descriptors and overall land cover statistics.
We hypothesised that combining characterisation of catchment pressure-sensitivity-responses would aid water quality prediction and understanding and tested this by pooling P source aspects with riparian condition and chemical and ecological stream quality metrics. Furthermore, we hoped that bioavailable P loads would bring improved mechanistic connexion to effects of riparian characteristics on water quality outcomes (consider, for example, that riparian variation in shade or water residence time affects cycling of reactive P more so than total P). However, whilst the aerial imagery methods used to derive riparian condition scores were manual, but highly achievable, these brought a surprising lack of association with between-river variation in diatom indicators (considering evidence for P and light interactions on diatoms).
The limitations of the study in terms of validation of source P methods are the relatively small number of sites and use of monthly regulatory hydrochemical data. Increased temporal hydrochemical monitoring resolution (weekly to daily) and water sample analytical P speciation would improve confidence in stream P loads, across P forms, to validate source P fractionation in export approaches. We recommend (i) this focusses on fewer highly resourced research catchments initially, with (ii) direct bioavailable P assays being applied to source and stream waters, then (iii) rolled out towards national investigative programs; where biological, alongside chemical P speciation should be undertaken more widely. Potentially, discrete location assessment of riparian condition undertaken here limited this study in terms of the inferences for waterbody condition assessment. Further research should explore continuous, sub-catchment or scale-dependant river corridor properties as interacting with P source behaviour to govern hydrochemical water quality and ecological responses.
Data Availability Statement
The original contributions presented in the study are included in the article/Supplementary Material, further inquiries can be directed to the corresponding author.
Author Contributions
MS and LM contributed to conception and design of the study. AI organised the database. JP-A performed the statistical analysis. MS wrote the first draught of the manuscript. MG, AI, JP-A, and LM wrote sections of the manuscript. All authors contributed to manuscript revision, read, and approved the submitted version.
Funding
This work was funded by Scottish Government's Rural and Environment Science and Analytical Services under the 2016-22 Environment Program.
Conflict of Interest
The authors declare that the research was conducted in the absence of any commercial or financial relationships that could be construed as a potential conflict of interest.
Publisher's Note
All claims expressed in this article are solely those of the authors and do not necessarily represent those of their affiliated organizations, or those of the publisher, the editors and the reviewers. Any product that may be evaluated in this article, or claim that may be made by its manufacturer, is not guaranteed or endorsed by the publisher.
Supplementary Material
The Supplementary Material for this article can be found online at: https://www.frontiersin.org/articles/10.3389/frwa.2022.852883/full#supplementary-material
References
Baggaley, N. J., Lilly, A., Blackstock, K. L., Dobbie, K., Carsons, A., and Leith, F. (2019). Soil risks - Interpreted soils data for policy makers, agencies and industry. Soil Use Manage. 36, 19–26. doi: 10.1111/sum.12541
Balana, B. B., Lago, M., Baggaley, N., Castellazzi, M., Sample, J., Stutter, M. I., et al. (2012). Integrating economic and biophysical data in assessing cost-effectiveness of buffer strip placement. J. Environ. Qual. 41, 380–388. doi: 10.2134/jeq2010.0544
Bol, R., Grau, G., Mellander, P.-E., Dupas, R., Bechmann, M., Skarbovik, E., et al. (2018). Challenges of reducing phosphorus based water eutrophication in the agricultural landscapes of northwest Europe. Front. Mar. Sci. 5, 276. doi: 10.3389/fmars.2018.00276
Boorman, D. B., Hollis, J. M., and Lilly, A. (1995). Hydrology of Soil Types: A Hydrologically Based Classification of the Soils of the United Kingdom. Institute of Hydrology. Available online at: http://nora.nerc.ac.uk/id/eprint/7369/1/IH_126.pdf (accessed March 24, 2022).
Bowes, M. J., Ings, N. L., McCall, S. J., Warwick, A., Barrett, C., Wickham, H. D., et al. (2012). Nutrient and light limitation of periphyton in the River Thames: implications for catchment management. Sci. Total Environ. 434, 201–212. doi: 10.1016/j.scitotenv.2011.09.082
Dodds, W. K., Bouska, W. W., Eitzmann, J. L., Pilger, T. J., Pitts, K. L., Riley, A. J., et al. (2009). Eutrophication of U.S. freshwaters: analysis of potential economic damages. Env. Sci. Technol. 43, 12–19. doi: 10.1021/es801217q
Edwards, A. C., and Hooda, P. S. (2008). Farmyard point discharges and their influence on nutrient and labile carbon dynamics in a second order stream draining through a dairy unit. J. Environ. Manage. 87, 591–599. doi: 10.1016/j.jenvman.2007.02.013
Edwards, A. C., Kay, D., McDonald, A., Francis, C., Watkins, J., Wilkinson, R. J., et al. (2008). Farmyards, an overlooked source for highly contaminated runoff. J. Env. Manage. 87, 551–559. doi: 10.1016/j.jenvman.2006.06.027
Edwards, A. C., Twist, H., and Codd, G. A. (2000). Assessing the impact of terrestrially derived phosphorus on flowing water systems. J. Environ. Qual. 29, 117–124. doi: 10.2134/jeq2000.00472425002900010015x
Edwards, A. C., and Withers, P. J. A. (2007). Linking phosphorus sources to impacts in different types of water body. Soil Use Manage. 23, 133–143. doi: 10.1111/j.1475-2743.2007.00110.x
Ekholm, P., and Krogerus, K. (2003). Determining algal-available phosphorus of differing origins: routine phosphorus analyses versus algal assays. Hydrobiologia 492, 29–42. doi: 10.1023/A:1024857626784
Ellison, M. E., and Brett, M. T. (2006). Particulate phosphorus bioavailability as a function of stream flow and land cover. Water Res. 40, 1258–1268. doi: 10.1016/j.watres.2006.01.016
Escofier, B., and Pag?s, J. (1994). Multiple factor analysis (AFMULT package). Comput. Statist. Data Anal. 18, 121–140. doi: 10.1016/0167-9473(94)90135-X
EU (2009). Commission Report (COM(2009) 156 final): “Report From the Commission to the European Parliament and the Council in Accordance With Article 18.3 of the Water Framework Directive 2000/60/EC on Programmes for Monitoring of Water Status”. Available online at: http://ec.europa.eu/environment/archives/water/implrep2007/index_en.htm#second (accessed March 24, 2022).
Feld, C. K., Rosario Fernandes, M., Teresa Ferreira, M., Hering, D., Ormerod, S. J., Venohr, M., et al. (2018). Evaluation riparian solutions to multiple stressor problems in river ecosystems – a conceptual study. Wat. Res. 139, 381–394. doi: 10.1016/j.watres.2018.04.014
Finke, G., Florke, M., Reder, K., and Alcamo, J. (2018). Phosphorus loadings to the world's largest lakes: sources and trends. Glob. Biogeochem. Cycles 3, 617–634. doi: 10.1002/2017GB005858
Glendell, M., Palarea-Albaladejo, J., Pohle, I., Marrero, S., McCreadie, B., Cameron, G., et al. (2019). Modeling the ecological impact of phosphorus in catchments with multiple environmental stressors. J. Environ. Qual. 48, 1336–1346. doi: 10.2134/jeq2019.05.0195
Goyette, J.-O., Bennet, E. M., and Maranger, R. (2018). Low buffering capacity and slow recovery of anthropogenic phosphorus pollution in watersheds. Nat. Geosci. 11, 921–925. doi: 10.1038/s41561-018-0238-x
Greene, S., Taylor, D., McElarney, F.oy R. H., and Jordan, P. (2011). An evaluation of catchment-scale phosphorus mitigation using load apportionment modelling. Sci. Total Environ. 409, 2211–2221. doi: 10.1016/j.scitotenv.2011.02.016
Harrison, S., McAree, C., Mulville, W., and Sullivan, T. (2019). The problem of agricultural ‘diffuse' pollution: getting to the point. Sci. Total Environ. 677, 700–717. doi: 10.1016/j.scitotenv.2019.04.169
Herrero, A., Gutierrez-Canovas, C., Vigiak, O., Lutz, S., Kumar, R., Gampe, D., et al. (2018). Multiple stressor effects on biological quality elements in the Ebro River: present diagnosis and predicted responses. Sci. Total Environ. 630, 1608–1618. doi: 10.1016/j.scitotenv.2018.02.032
Jarvie, H., Sharpley, A. N., Withers, P. J., Scott, J. T., Haggard, B. E., and Neal, C. (2013). Phosphorus mitigation to control river eutrophication: murky waters, inconvenient truths, and ‘post-normal' science. J. Environ. Qual. 42, 295–304. doi: 10.2134/jeq2012.0085
Jarvie, H. P., Neal, C., and Withers, P. J. A. (2006). Sewage-derived phosphorus: a greater risk to river eutrophication than agricultural phosphorus? Sci. Total Environ. 360, 246–253. doi: 10.1016/j.scitotenv.2005.08.038
Jarvie, H. P., Smith, D. R., Norton, L. R., Edwards, F. K., Bowes, M. J., King, S. M., et al. (2018). Phosphorus and nitrogen impairment of headwater streams relative to rivers in Great Britain: a national perspective on eutrophication. Sci. Total Environ. 621, 849–862. doi: 10.1016/j.scitotenv.2017.11.128
Jordan, P., Melland, A. R., Mellander, P.-E., Shortle, G., and Wall, D. (2012). The seasonality of phosphorus transfers from land to water: Implications for trophic impacts and policy evaluation. Sci. Total Environ. 434, 101–109. doi: 10.1016/j.scitotenv.2011.12.070
Ladson, A. R., White, L. J., Doolan, J. A., Finlayson, B. L., Hart, B. T., Lake, S., et al. (1999). Development and testing of an Index of Stream Condition for waterway management in Australia. Freshwater Biol. 41, 453–468. doi: 10.1046/j.1365-2427.1999.00442.x
Legendre, P., Oksanen, J., and ter Braak, C. J. F. (2011). Testing the significance of canonical axes in redundancy analysis. Methods Ecol. Evolut. 2, 269–277. doi: 10.1111/j.2041-210X.2010.00078.x
Li, B., and Brett, M. T. (2015). The relationship between operational and bioavailable phosphorus fractions in effluents from advanced nutrient removal systems. Int. J. Sci. Technol. 12, 3317–3328. doi: 10.1007/s13762-015-0760-y
Littlewood, I. G., and Marsh, T. J. (2005). Annual freshwater river mass loads from Great Britain, 1975–1994: estimation algorithm, database and monitoring network issues. J. Hydrol. 304, 221–237. doi: 10.1016/j.jhydrol.2004.07.031
May, L., Place, C. J., and George, D. G. (1996). “Estimating total phosphorus losses from diffuse sources within the catchment of Bassenthwaite Lake,” in Diffuse Pollution and Agriculture, Proceedings of a Conference held in Edinburgh, eds A. Petchey, B. D'Arcy, and A. Frost (Edinburgh), 247–250.
McDowell, R. W., and Koopmans, G. F. (2006). Assessing the bioavailability of dissolved organic phosphorus in pasture and cultivated soils treated with different rates of nitrogen fertiliser. Soil Biol. Biochem. 38, 61–70. doi: 10.1016/j.soilbio.2005.03.026
McDowell, R. W., Norris, M., and Cox, N. (2016). Using the provenance of sediment and bioavailable P to help mitigate water quality impact in an agricultural catchment. J. Environ. Qual. 45, 1276–1285. doi: 10.2134/jeq2015.10.0536
Meals, D. W., Dressing, S. A., and Davenport, T. E. (2010). Lag time in water quality response to best management practices: a review. J. Environ. Qual. 39, 85–96. doi: 10.2134/jeq2009.0108
Mechtensimer, S., and Toor, G. S. (2017). Septic systems contribution to phosphorus in shallow groundwater: Field-scale studies using conventional drainfield designs. PLoS ONE. 12, e0170304. doi: 10.1371/journal.pone.017030
Mockler, E. M., Deakin, J., Archbold, M., Gill, L., Daly, D., and Bruen, M. (2017). Sources of nitrogen and phosphorus emissions to Irish rivers and coastal waters: estimates from a nutrient load apportionment framework. Sci. Total Environ. 60, 326–339. doi: 10.1016/j.scitotenv.2017.05.186
Morton, D., Rowland, C., Wood, C., Meek, L., Marston, C., Smith, G., et al. (2011). Final Report for LCM2007 - the new UK land cover map. Countryside Survey Technical Report No 11/07. NERC/Centre for Ecology & Hydrology, Wallingford, UK.
Munn, M. D., Waite, I., and Konrad, C. P. (2018). Assessing the influence of multiple stressors on stream diatom metrics in the upper Midwest, USA. Ecol. Indic. 85, 1239–1248. doi: 10.1016/j.ecolind.2017.09.005
Neal, C., Jarvie, H., Withers, P. J. A., Whitton, B. A., and Neal, M. (2010). The strategic significance of wastewater sources to pollutant phosphorus levels in English rivers and to environmental management for rural, agricultural and urban catchments. Sci. Total Environ. 408, 1485–1500. doi: 10.1016/j.scitotenv.2009.12.020
NRS. (2018). National Records of Scotland, Statistics by Theme: Households. Available online at: https://www.nrscotland.gov.uk/statistics-and-data/statistics/statistics-by-theme/households (accessed March 21, 2022).
Ockenden, M., Deasy, C. E. H, Benskin, C. M, Beven, K. J, Burke, S., Collins, A. L., et al. (2016). Changing climate and nutrient transfers: evidence from high temporal resolution concentration-flow dynamics in headwater catchments. Sci. Total Environ. 548, 325–339. doi: 10.1016/j.scitotenv.2015.12.086
Pinay, G., Bernal, S., Abbott, B. W., Lupon, A., Marti, E., Sabater, F., et al. (2018). Riparian corridors: a new conceptual framework for assessing nitrogen buffering across biomes. Front. Environ. Sci. 6, 47. doi: 10.3389/fenvs.2018.00047
Pohle, I., Baggaley, N., Palarea-Albaladejo, J., Sutter, M., and Glendell, M. (2021). A framework for assessing concentration-discharge catchment behavior from low-frequency water quality. Water Res. Res. 57, e2021WR029692. doi: 10.1029/2021WR029692
Prestigiacomo, A. R., Effler, S. W., Gelda, R. K., Matthews, D. A., Auer, M. T., Downer, B. E., et al. (2016). Apportionment of bioavailable phosphorus loads entering Cayuga Lake, New York. J. Am. Water Resour. Assoc. 52, 31–47. doi: 10.1111/1752-1688.12366
Qin, C., Liu, H., Liu, L., Smith, S., Sedlak, D. L., and Gu, A. Z. (2015). Bioavailability and characterization of dissolved organic nitrogen and dissolved organic phosphorus in wastewater effluents. Sci. Total Environ. 511, 47–53. doi: 10.1016/j.scitotenv.2014.11.005
R Core Team (2019). R: A Language and Environment for Statistical Computing. Vienna: R Foundation for Statistical Computing. Available online at: URL https://www.R-project.org/.
Records, R. M., Wohl, E., and Arabi, M. (2016). Phosphorus in the river corridor. Earth Sci. Rev. 158, 65–88. doi: 10.1016/j.earscirev.2016.04.010
Robertson, W. D., Schiff, S. L., and Ptacek, C. J. (1998). Review of phosphate mobility and persistence in 10 septic system plumes. Groundwater 36, 1000–1010. doi: 10.1111/j.1745-6584.1998.tb02107.x
Röman, E., Ekholm, P., Tattari, S., Koskiaho, J., and Notamäki, N. (2018). Catchment characteristics predicting nitrogen and phosphorus losses in Finland. River. Res. Applic. 34, 397–405. doi: 10.1002/rra.3264
Schneider, M. K., Brunner, F., Hollis, J. M., and Stamm, C. (2007). Towards a hydrological classification of European soils: preliminary test of its predictive power for the base flow index using river discharge data. Hydrol. Earth Syst. Sci. 11, 1501–1513. doi: 10.5194/hess-11-1501-2007
Segurado, P., Almeida, C., Neves, R., Teresa, M., Branco, P., Ferreira, M. T., et al. (2018). Understanding multiple stressors in a Mediterranean basin: Combined effects of land use, water scarcity and nutrient enrichment. Sci. Total Environ. 624, 1221–1233. doi: 10.1016/j.scitotenv.2017.12.201
Shiel, D. R. (2010). Implementing landscape indices to predict stream water quality in an agricultural setting: an assessment of the Lake and River Enhancement (LARE) protocol in the Mississinewa River watershed, East central Indiana. Ecol. Indicators 10, 1102–1110. doi: 10.1016/j.ecolind.2010.03.007
Sinclair, A. H., Crooks, B., Edwards, A. C., Lumsdon, D., Coull, M., and Shand, C. (2013). Assessing the Potential Risks to Water Quality From Phosphate Leaching: SEPA Contract Number R11123STA. Available online at: https://www.sepa.org.uk/media/344293/sepa-p-report.pdf (accessed March 24, 2022).
Stamm, C., Jarvie, H. P., and Scott, T. (2014). What's more important for managing phosphorus: loads, concentrations or both? Environ. Sci. Technol. 48, 23–24. doi: 10.1021/es405148c
Stutter, M., Baggaley, N., Ó hUallacháin, D., and Wang, C. (2021a). The utility of spatial data to delineate river riparian functions and management zones: a review. Sci. Total Environ. 757, 143982. doi: 10.1016/j.scitotenv.2020.143982
Stutter, M., Graeber, D., Evans, C., Wade, A., and Withers, P. (2018). Balancing macronutrient stoichiometry to alleviate eutrophication. Sci. Tot. Environ. 634, 439–447. doi: 10.1016/j.scitotenv.2018.03.298
Stutter, M., Richards, S., Ibiyemi, A., and Watson, H. (2021b). Spatial representation of in-stream sediment phosphorus release combining channel network approaches and in-situ experiments. Sci. Total Environ. 795. doi: 10.1016/j.scitotenv.2021.148790
Stutter, M. I., Langan, S. J., and Demars, B. O. D. (2007). River sediments provide a link between catchment pressures and ecological status in a mixed land use Scottish River system. Wat. Res. 41, 2803–2815. doi: 10.1016/j.watres.2007.03.006
Su, J., van Bochove, E., Auclair, J.-C., Theriault, G., Denault, J.-T., Bosse, C., et al. (2014). Phosphorus algal availability and release potential in suspended and streambed sediments in relation to sediment and catchment characteristics. Agric. Acosyst. Environ. 188, 169–179. doi: 10.1016/j.agee.2014.03.001
Thomas, I. A., Mellander, P.-E., Murphy, P. N. C., Fenton, O., Shine, O., Djodjic, F., et al. (2016). A sub-field scale critical source area index for legacy phosphorus management using high resolution data. Agric. Ecosystem Environ. 233, 238–252. doi: 10.1016/j.agee.2016.09.012
Tomsett, C., and Leyland, J. (2019). Remote sensing of river corridors: A review of current trends and future directions. River Res. Applic. 35, 779–803. doi: 10.1002/rra.3479
UKTAG (2014). UKTAG River Assessment Method Macrophytes and Phytobenthos: Diatoms for Assessing River and Lake Ecological Quality (River DAR-LEQ2). Stirling: WFD-UKTAG.
Villeneuve, B., Piffady, J., Valette, L., Souchon, Y., and Usseglio-Polatera, P. (2018). Direct and indirect effects of multiple stressors on stream invertebrates across watershed, reach and site scales: a structural equation modelling better informing on hydromorphological impacts. Sci. Total Environ. 612, 660–671. doi: 10.1016/j.scitotenv.2017.08.197
Wilby, R. L. (2020). Resilience viewed through the lens of climate change and water management. Water 12, 2510. doi: 10.3390/w12092510
Keywords: phosphorus, macronutrients, water quality, river condition assessment, pollution source analysis, catchment
Citation: Stutter M, Glendell M, Ibiyemi A, Palarea-Albaladejo J and May L (2022) Can Prediction and Understanding of Water Quality Variation Be Improved by Combining Phosphorus Source and Waterbody Condition Parameters? Front. Water 4:852883. doi: 10.3389/frwa.2022.852883
Received: 11 January 2022; Accepted: 17 March 2022;
Published: 22 April 2022.
Edited by:
Qian Zhang, University of Maryland Center for Environmental Science (UMCES), United StatesReviewed by:
Anna Lintern, Monash University, AustraliaXi Chen, University of Cincinnati, United States
Copyright © 2022 Stutter, Glendell, Ibiyemi, Palarea-Albaladejo and May. This is an open-access article distributed under the terms of the Creative Commons Attribution License (CC BY). The use, distribution or reproduction in other forums is permitted, provided the original author(s) and the copyright owner(s) are credited and that the original publication in this journal is cited, in accordance with accepted academic practice. No use, distribution or reproduction is permitted which does not comply with these terms.
*Correspondence: Marc Stutter, marc.stutter@hutton.ac.uk