 Uttiya Dey1
 Soumyajit Sarkar1
 Srimanti Duttagupta2
 Animesh Bhattacharya1
 Kousik Das1,3Sumedha Saha4
 Abhijit Mukherjee1,5,6*
- 1School of Environmental Science and Engineering, Indian Institute of Technology Kharagpur, Kharagpur, India
- 2School of Public Health, San Diego State University, San Diego, CA, United States
- 3Centre for Water Supply Studies, Department of Physical and Environmental Sciences, Texas A&M University-Corpus Christi, Corpus Christi, TX, United States
- 4Advance Technology Development Centre, Indian Institute of Technology Kharagpur, Kharagpur, India
- 5Geology and Geophysics, Indian Institute of Technology Kharagpur, Kharagpur, India
- 6Applied Policy Advisory to Hydro Geosciences Group, Indian Institute of Technology Kharagpur, Kharagpur, India
Access to clean water has been identified as one of the primary Sustainable Development Goals. Rapid urbanization is going on in developing nations creating additional pressure on water resources in most of these places which in turn also affects individuals which is largely reliant on proper sanitation and drinking water quality. In addition, open sanitation practice is becoming major public health problem in rural and in some urban areas in India. Groundwater contamination by pathogenic bacteria sourced from both sanitation system and surface water is becoming one of the major concerns now-a-days. The residents of the Ganges river basin in India are already stressed with natural arsenic pollution as well as other various types of water pollution, and microbial pollution from sanitation is a new addition to it. A field-based hydrogeological investigation with the identification of sanitation sites (surface and subsurface) was conducted in some parts of the Ganges basin, in and around a lower order distributary river, River Churni in West Bengal state, to identify the natural and human influences on sanitation drinking water pollution in a highly populated part of South Asia. Groundwater was found to be contaminated severely with total (TC) and fecal (FC) coliform bacteria. The abundance of TC was found to be the highest in monsoon season (78%) than in pre-monsoon (48%) and post-monsoon (29%) seasons. The results revealed that the groundwater samples from shallow depths and close to sanitation sites were highly contaminated with coliform bacteria than the deeper and higher distant (>30 m distance) ones. Shallow groundwater samples near to surface water (River Churni) source, other than sanitation sites, showed elevated TC levels. The occurrence of coliform bacteria in studied groundwater samples was observed to be positively correlated with conductivity, TDS, TOC, chloride, and sulfate, while the abundance was restricted by pH and temperature of groundwater. Thus, improper sanitation systems and contaminated surface water were identified as one of the major sources of pathogenic contamination of groundwater-sourced drinking water in the studied area, whereas improper human practices further complicate the scenario which needs to be managed properly.
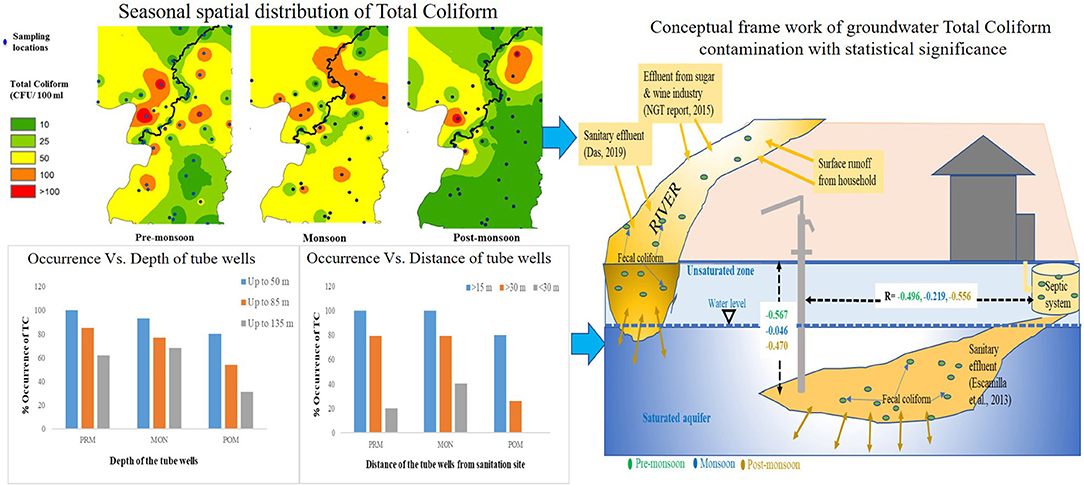
Graphical Abstract.
Introduction
Access to safe drinking water is one of the primary determining factors toward environmental sustainability and improved public health. Various physicochemical, hydrological, and biological processes as well as human activities may influence the availability and quality of safe water which is accessible to the people. Groundwater is considered to be less prone to pathogenic contamination as compared to surface water because of natural filtration by the aquifer sand (Ravenscroft et al., 2017). However, recently groundwater has also been reported to be contaminated mainly due to the absence of proper waste management system, leakage from sewage pipes, open defecation system, extraction of groundwater in excess, drilling of wells in an unsuitable condition, low depth of water table due to human activities, and mostly because of the ignorance toward water conservation (Tripathi and Sharma, 2011; Das, 2019), which can cause a sudden outbreak of waterborne diseases (Wang et al., 2014). In the Indian sub-continent, 60% of the rural population use groundwater for drinking purpose (Mukherjee et al., 2015). The consumption of contaminated drinking water is the root cause of 80% of diseases occurring globally, either through chemical imbalances or microbial contamination (World Health Organization, 2004). In developing nations including India, the scenario is particularly concerning as a large number of people do not have access to safe drinking water. Each year, nearly 2 million people die from waterborne diseases in the developing nations, especially children under the age of five (World Health Organization, 2008), mostly from diarrhea caused by coliform bacteria (Shar et al., 2008). Among other microorganisms, the presence of coliform bacteria in groundwater is one of the major threats to human health and possesses the risk of an outbreak of waterborne diseases.
Transportation of coliform bacteria from surface and subsurface sources is dependent on various factors like the specific hydrogeological settings, depth of tube well, tube well construction, and the amount and intensity of precipitation (Atherholt et al., 2017). Shallow groundwater is more vulnerable than the deeper one because of the shorter vertical distance and the attenuation of pathogenic bacteria depends on retention and die-off in the flow path (van Geen et al., 2011). Recent fecal contamination and the potential presence of pathogenic bacteria in water can be detected by the presence of thermotolerant fecal coliform bacteria, generally known as fecal indicator bacteria (FIB) (Kostyla et al., 2015), especially Escherichia coli in water because they are always found in untreated waste from humans and other warm-blooded animals (Atherholt et al., 2017; Dayanti et al., 2018). Potable water should contain <10 CFU of total coliform (TC) and nearly no fecal coliform per 100 ml of water (World Health Organization, 2004).
The Indo-Gangetic-Brahmaputra basin is one of the largest freshwater resources in the world, which is already threatened by geogenic arsenic contamination in inland aquifers (Mukherjee et al., 2015) and saltwater intrusion in coastal aquifers (Das and Mukherjee, 2019). Against the backdrop of the geogenic groundwater contamination and industrial pollution, improper sanitation practices add another threat to the available freshwater resources, which directly has an acute impact on human health (Verhougstraetea et al., 2015). In India, more than 500 million of its population are still practicing open defecation, resulting in the unhealthy disposal of fecal waste in the vicinity of the drinking water sources.
The dependency on groundwater for drinking purposes needs attention toward the necessity of groundwater quality monitoring at regular intervals. The Nadia district is known to have actively involved in surface water and groundwater interaction process in terms of meteoric recharge and base flow to river in the favorable aquifer-aquitard framework, which consists of medium-to-coarse grain sand to silts (Mukherjee et al., 2008; Hussain et al., 2017). Thus, in this pre-existing surface water–groundwater processes and seasonal recharge, the role of sanitation and open defecation in the microbial contamination of groundwater in the lower Gangetic basin, particularly in the rural areas in district Nadia, West Bengal, is rarely explored. It is also important to have sound knowledge about the seasonal variation of groundwater quality to understand the particular period of the year when pollution load becomes high for the adaptation of suitable policy to secure continuous supply of potable water throughout the year. Based on the vulnerability of open defecation practices in the rural areas of Nadia district, this study was conducted to fingerprint the presence and source of human-dependent pathogens in groundwater in various spatio-temporal scales. This study builds the relationship between the distance of sanitation construction from groundwater source and anthropogenic fecal pollution of groundwater in the lower Ganges basin based on in situ observation.
Materials and Methods
Study Area
Both sides of the Churni river in Nadia district, West Bengal, were selected for this study (Figure 1). The river originates from the Mathavanga river, east of Krishnanagar, and flows through Hanskhali and Ranaghat block of Nadia district throughout 56 km and falls into the river Bhagirathi–Hooghly (Ganga) between Shantipur and Chakdaha. Nadia district is a part of western Bengal Basin, and the aquifer structure, consisting with heterogeneous variability of sand, comprises of fine to medium-to-coarse sand with clayey intercalations. Broadly, the aquifer-aquitard framework of Nadia district changes from unconfined to confined from the north to the south of the district. Southwestern part has thick aquitard up to the maximum depth of 60 m bgl while it gets thin (10–15 m) toward the eastern part of the district, and it disappeared close to the Bangladesh border (Mukherjee et al., 2007). The aquifer is mainly consisting of Fe-coated micaceous sand, silt, and clay with upward fining sequence (Mukherjee et al., 2008). This area is mainly the Holocene sedimentary successions of fluvial deposits by the regional meandering of Bhagirathi–Hooghly river (Mukherjee et al., 2008). The aquifers (up to 250 m) are mainly constructed by sands overlain by surface silty clay. This aquifer is named as Sonar Bangla aquifer after Mukherjee et al. (2007). We have presented five lithologs where different proportion of sand, with silt and clay, is variably present across the depth (Figure 1d). All of the presented lithologs are from the north of the study area and are validated with the aquifer-aquitard framework of Western Bengal basin proposed by Mukherjee et al. (2007). The climate of Nadia has hot summer, high humidity all around the year, well-distributed rainfall during the monsoon season. The winter starts from the middle of November up to February end. Maximum rainfall occurs during June to September which constitutes about 78% of the total annual rainfall (AFR, 2014), with the highest average in July–August. The average temperature of this area ranges from 27 to 42°C with a maximum humidity of 96% (CDAP, 2014).
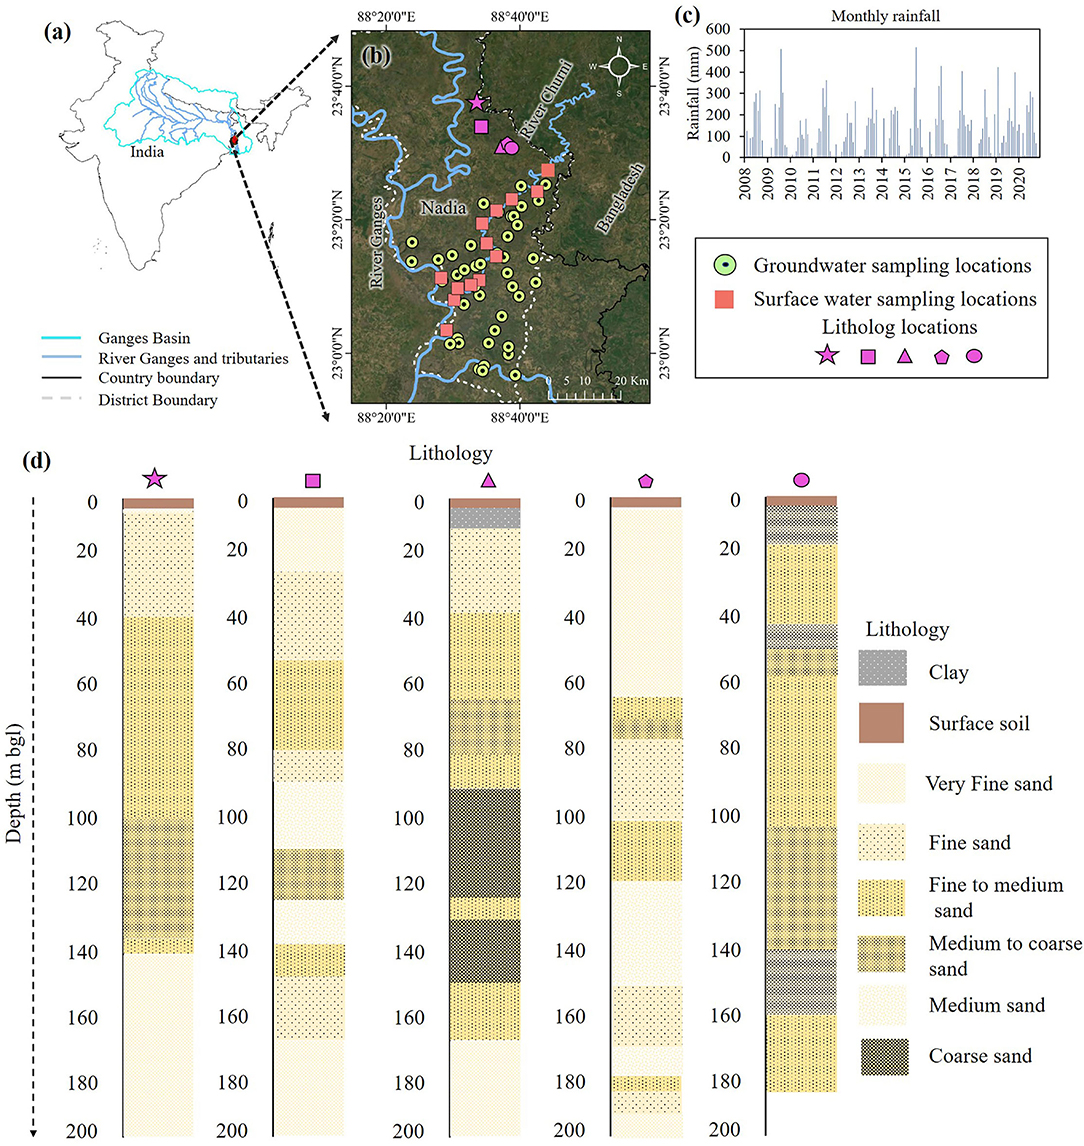
Figure 1. Study area map showing sampling locations of groundwater and river water. (a) Map of India showing Ganges basin and location of Nadia district, (b) Aerial view of study area map (GeoEye-2) showing sampling locations, (c) Monthly rainfall of last 12 years (Indian Meteorological Department, 2022), and (d) Lithological cross section of respective study area.
Collection and Preservation of Water Samples
Sampling of groundwater and river water were done in January 2018 (post-monsoon), May–June 2018 (pre-monsoon), and August–September 2018 (monsoon). Groundwater samples were collected from 45 tube wells from either side of Churni river course, as near to far distance from the river stream, and the geographical coordinates were recorded by a handheld Global Positioning System (GPS) (Etrex 10, GARMIN). River water samples were also collected from 11 different locations from upstream to downstream of Churni river within the stretch of Nadia district, having an average distance of 5 km between two sampling points.
Groundwater samples were collected from the previously mentioned public tube wells after flushing for 20 to 30 mins to eliminate the stagnant water of the pipes. Preservation of groundwater samples and field measurement were done by following standard hydrochemical procedures (Wood, 1981; Mukherjee and Fryar, 2008). About 0.22 μm filter paper was used for the filtration of the collected samples (for chemical analysis) in in situ conditions and collected in 15 ml glass bottles with 6 NH2SO4 for the determination of total organic carbon (TOC) and in 30 ml HDPE bottles with few drops of chloroform for analysis of anions. For microbial analysis, water samples were collected in sterilized polyethylene bottles and were taken to the laboratory in isothermal boxes maintaining the temperature at 4°C.
In addition, information, such as well depth and numbers of users of the wells, was also collected by interacting with the local people. For assessing the sanitation impacts on groundwater quality, the distances between latrines or closest sanitation facilities and the tube well were also measured.
Sample Analysis
Temperature, conductivity, pH, TDS, and salinity of the water samples were measured in situ during sample collection with Hanna multi-parameter probe (HI929828). TOC was analyzed in a total organic carbon analyzer (OI Analytical, Aurora1030), and anions were analyzed in an ion chromatograph (Dionex ICS 2100, Thermo Fisher) in the laboratory of School of Environmental Science and Engineering, IIT, Kharagpur.
The microbial analysis was done in the PHED Water Treatment Plant Laboratory, Haringhata, Nadia, within 24 h of sample collection. TC and E. coli were determined by the membrane filtration method [American Public Health Association (APHA), 2005] on chromogenic coliform agar. Samples were filtered through 0.45-μm nitrocellulose filters (diluted in requirement). The filter papers were then placed on chromogenic coliform agar (CCA) plates and incubated at 37°C (±1°C). After 24 hours of incubation, microbial colonies were enumerated and recorded as colony-forming units per 100 ml of sample (CFU/100 ml). All the purple-colored colonies were considered as total coliform, and bright blue-colored colonies on the CCA plates were considered as E. coli.
Statistical Analysis
The principal component analysis was adapted for the reduction in dimensionality of a larger data set of 13 variables of 45 groundwater samples in three seasons and for the identification of the most influencing factor and the pattern of influence on the occurrence of TC by using Xl-stat (version 8.1).
A univariate logistic regression model was used to identify the significant covariates of TC and E. coli amount in groundwater among the other hydrogeochemical and anthropogenic parameters for all three seasons. The covariates that met the 95% confidence interval were considered significant concerning TC and E. coli amount. Univariate logistic regression was done using the R studio.
Results
Physicochemical Properties of Groundwater
The summarized value of all physicochemical parameters of the groundwater samples along with coliform contamination is presented in Table 1. The average temperature of the groundwater samples was 29.43, 27.18, and 23.26°C in pre-monsoon, monsoon, and post-monsoon seasons, respectively. All the water samples were alkaline with an average pH value of 7.54, 7.61, and 7.85 in pre-monsoon, monsoon, and post-monsoon seasons, respectively. Conductivity was highest in post-monsoon followed by monsoon and pre-monsoon seasons and the ranges were 406–1,316, 413–1,066, and 409–1,894 μS/cm, respectively. Like conductivity, the TDS value was also highest in post-monsoon and decreased in pre-monsoon season with an average value of 314, 319, and 343 mg/L in pre-monsoon, monsoon, and post-monsoon seasons, respectively. Organic carbon is generally used by the microbes as a potential nutrient source; hence, it acts as the indicator of the potentiality of water to be contaminated by microbes. Total organic carbon was recorded highest in monsoon followed by pre-monsoon and post-monsoon seasons and ranged between 1.426 and 44.57, 1.637 and 61.713, and 0.566 and 24.88 mg/L, respectively, in pre-monsoon, monsoon, and post-monsoon seasons.
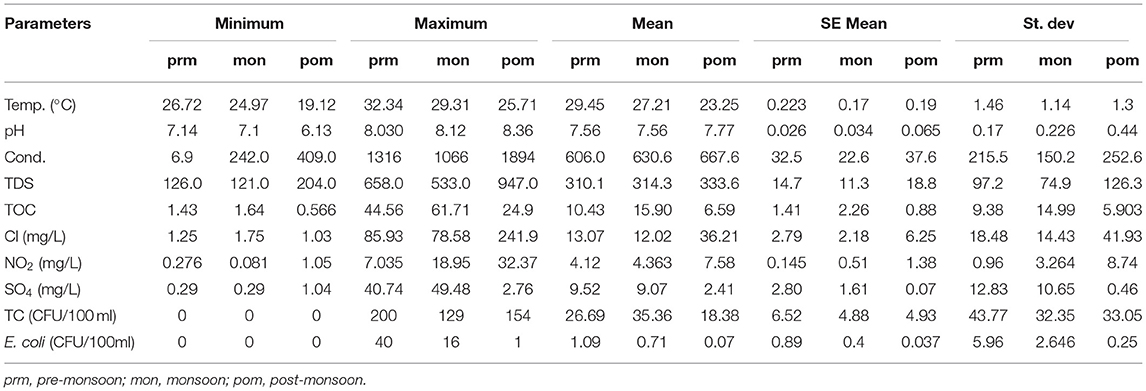
Table 1. Statistical summary of the observed results of groundwater physicochemical parameters in different seasons.
Major anions, viz., chloride, sulfate, and nitrite, were measured through ion chromatography to find out the effects of these ions on the population growth of coliform bacteria. Chloride concentration was highest in post-monsoon and decreased in pre-monsoon and monsoon with an average value of 36.21, 13.07, and 12. 02 mg/L, respectively, in three respective seasons, but the concentration was higher in monsoon than in pre-monsoon and post-monsoon seasons while sulfate was recorded highest in pre-monsoon and then decreased in post-monsoon and monsoon season. The average value of nitrate and sulfate was 4.12 and 9.52 mg/L in pre-monsoon, 4.36 and 9.07 mg/L in monsoon, and 2.41 and 7.58 mg/L in post-monsoon season, respectively.
Seasonal Variation of Coliform in Groundwater
Most of the groundwater samples were free of E. coli, although significant numbers of TC were observed in a few samples in all the seasons. TC in the groundwater was lowest in the post-monsoon season and highest in the pre-monsoon season. The most frequent contamination was detected in monsoon and lowest in the post-monsoon period. The occurrence of TC was highest in monsoon than in pre-monsoon season, and TC count was higher in monsoon than pre-monsoon (Figure 2). An increasing trend of TC has been observed from post-monsoon to pre-monsoon and monsoon season. In post-monsoon, only 49% of the samples contained TC, whereas, in pre-monsoon and monsoon season, 80 and 89% of the samples exhibited TC among which 59, 61, and 87.5% in post-monsoon, pre-monsoon, and monsoon season, respectively, contained TC beyond the permissible limit of drinking water, that is, >10 CFU/100 ml of water (World Health Organization, 2008). In the post-monsoon season, fecal coliform (FC), primarily E. coli, was found in only three groundwater samples; however, in pre-monsoon and monsoon, it had been observed in eight and five groundwater samples. In all the seasons, the highest number of both TC and E. coli was observed in sample “S37” (Hanskhali health center) where the latrine of the health center was located within 1 m to the tube well and the well depth was ~35 m.
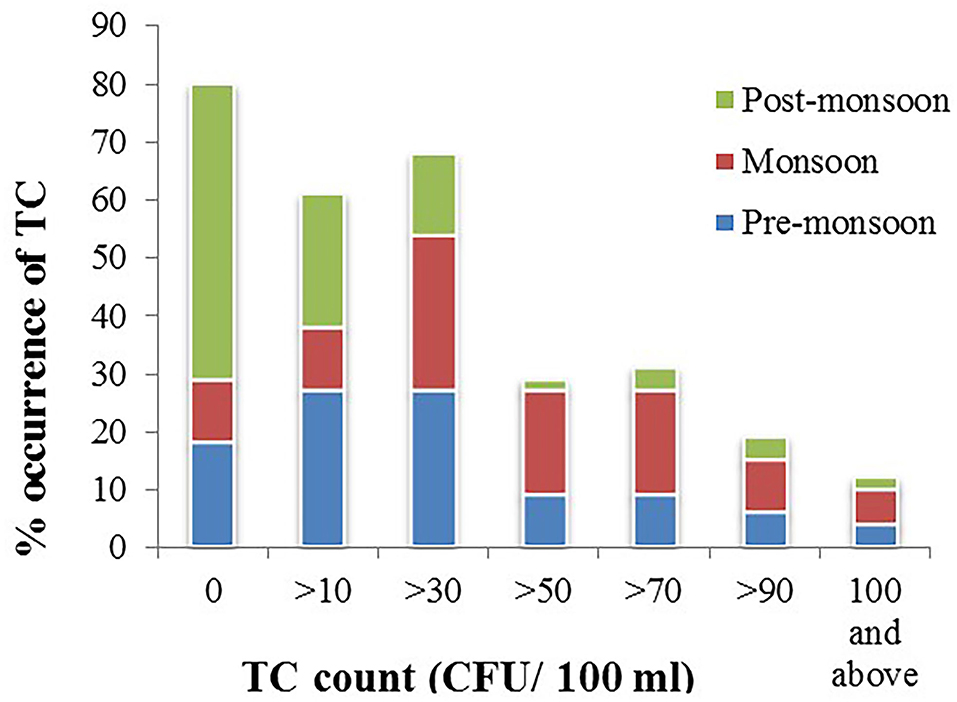
Figure 2. Percent occurrence of total coliform (TC) in groundwater samples in pre-monsoon, monsoon, and post-monsoon seasons.
Depth and Source Dependence Coliform Distribution
The number of occurrence of coliform bacteria was observed to be comparatively lower in deep tube well than the shallower ones (Figure 3A). All the tube wells were grouped into three depth categories, viz., A (up to 50 m bgl), B (up to 85 m bgl), and C (up to 135 m bgl). From the results, it was observed that in pre-monsoon, all the groundwater samples had coliform bacteria in shallower depth, whereas 85 and 62% of samples were coliform contaminated in middle depth (B) and deep (C) tube wells, respectively. In the other two seasons, a higher frequency of coliform occurrence was noted, that is, 93% in a shallow depth, 77% in middle depth, and 68% in deeper tube wells in monsoon; 80% in shallower depth, 54% in middle depth, and 31% in deeper tube wells in post-monsoon season, respectively. From our study results, it was also observed that the presence of coliform bacteria decreased with the increasing distance of the tube wells from the sanitation site (Figure 3B). The groundwater wells, from less than 35 m away from the sanitary point, contained more coliform bacteria than those which were located far distant. Even in post-monsoon season, no tube well located beyond 35-m distance from sanitation site contained coliform bacteria. Interestingly, coliform count was increasing with decreasing distance from the Churni river (Figure 4). Groundwater samples collected near the Churni river course exhibited higher TC and E. coli than those that were collected far from the river course. The TC and E. coli count of different points of the Churni river is presented in Table 2.
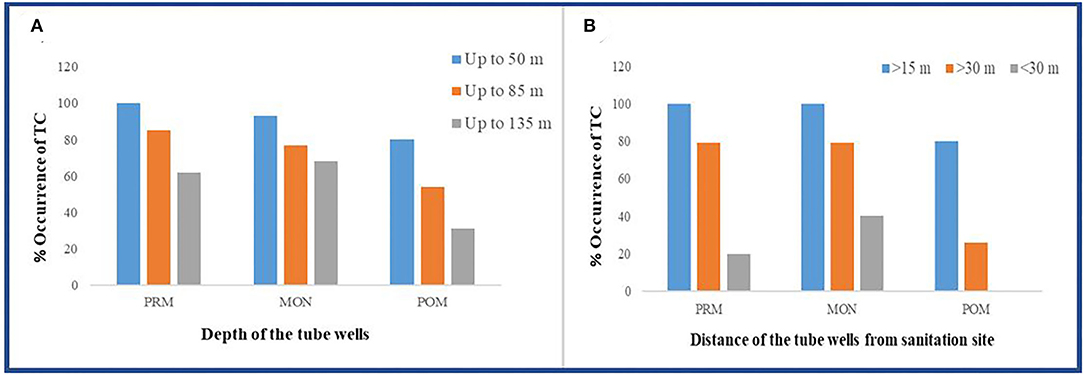
Figure 3. Occurrence of total coliform in (A) different depths and (B) different distances of tube well from sanitation site.
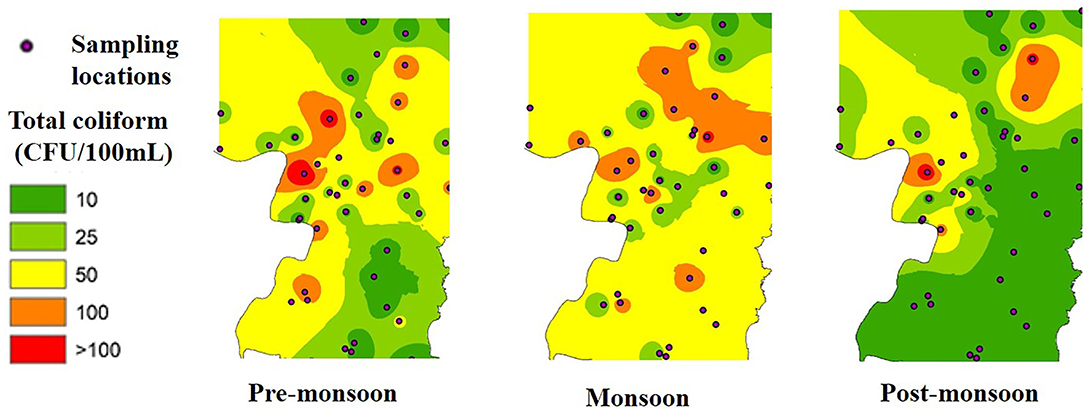
Figure 4. Seasonal and spatial distribution of total coliform across the study area.
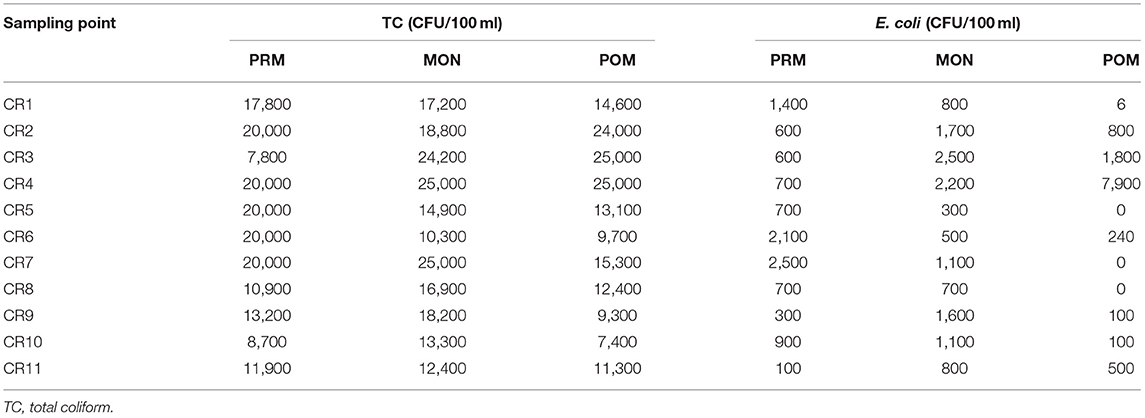
Table 2. Total coliform and E. coli concentration of Churni river in different seasons.
Principal Component Analysis
From the entire data set, four principal components (PCs) in each season were extracted after varimax rotation which has eigen values more than 1. These PCs can explain 73.66, 67.83, and 68.43% of the total variance cumulatively in pre-monsoon, monsoon, and post-monsoon, respectively (Figure 5). After the construction of PCA on these large data sets, it can be said that the dimensionality of the observed data was reduced significantly (p < 0.0001) as the Kaiser–Meyer–Olkin (KMO) test results were 0.547, 0.542, and 0.576 in three seasons, respectively. There was a highly significant correlation among the variables in all seasons (p < 0.0001) at a 95% confidence interval.
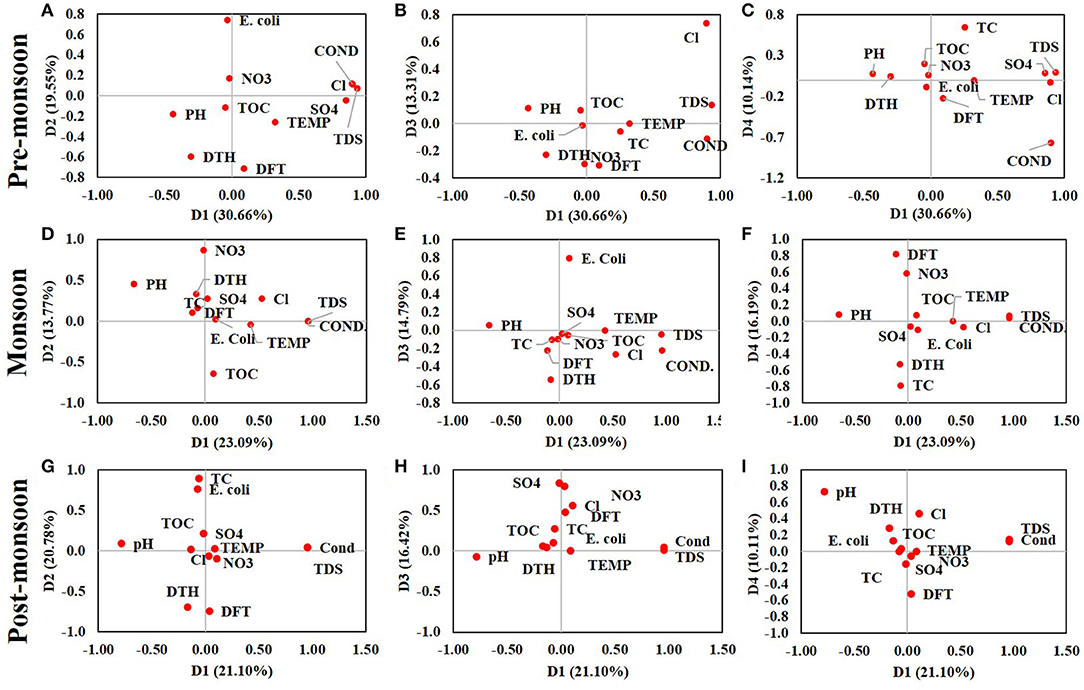
Figure 5. Plot of the correlations between variables and factors after Varimax rotation in pre-monsoon, monsoon, and post-monsoon seasons from principal component analysis of the entire data set. (A) D1 vs. D2, (B) D1 vs. D3, and (C) D1 vs. D4 representing the relationship among the variables during the pre-monsoon season, (D) D1 vs. D2, (E) D1 vs. D3, and (F) D1 vs. D4 representing the relationship among the variables during the monsoon, and (G) D1 vs. D2, (H) D1 vs. D3, and (I) D1 vs. D4 representing the post-monsoon season.
In pre-monsoon season, the first component (D1) accounts for 30.66% of the total variance and loaded highly and positively correlated with temperature, conductivity, TDS, sulfate, and TC and negatively correlated with pH and depth of the tube wells. The second component (D2) showed strong negative loading with temperature, pH, TOC, the distance of the tube wells from sanitation site, and depth of the tube wells and accounts for 19.55% of the total variability. The third component (D3) showed 13.31% variability with high positive loading of TOC and nitrite and negative loading of chloride, sulfate, and distance of the tube wells from sanitation site. The fourth component (D4), which showed only 10.14% variability, has strong negative loading with pH and positive with a depth of the tube wells. In the monsoon season, component D1 showed high positive loading with temperature, chloride, TDS, and chloride and negative loading with pH and accounts for 23.09% of the total variance. The second component (D2) showed 13.76% of the total variance and has a positive loading with pH, chloride, nitrite, sulfate, and depth of the tube wells and is highly negative with TOC. The third component (D3) accounts for only 14.78% having positive loading with TC and E. coli, whereas the fourth component (D4) accounts for 16.19% of the total variability and has strong positive loading with chloride and sulfate and negative with a depth of the tube wells. The cumulative variability in a post-monsoon season was 68.425%, where the four components account for 21.1, 20.78, 16.42, and 10.11%, respectively. The first component was highly and positively loaded with conductivity and TDS and negatively with pH and depth of the tube wells. The second component has positive loading with TC and E. coli and negative with depth and distance of the tube wells. The third component was positively loaded with TOC, chloride, nitrite, sulfate, and depth of the tube wells. The fourth component in the PCA of the post-monsoon season was positively loaded with temperature, TOC, and distance of the tube wells from sanitation site and negatively loaded with sulfate (Mukherjee et al., 2009).
From the Pearson correlation analysis, it was observed that conductivity, TDS, TOC, chloride, and sulfate have a positive correlation with total and fecal coliform (E. coli) in both pre-monsoon and post-monsoon season, but the correlation was not significant in monsoon.
Univariate Logistic Regression
A univariate logistic regression model was used to identify the significant covariates of TC and E. coli amount in groundwater among other hydrogeochemical and anthropogenic parameters for all three seasons. The covariates that met 95% confidence intervals were considered significant concerning TC and E. coli amount. For the monsoon season, a significant covariate for TC was ORP and bicarbonate for E. coli. Distance from the toilet, well depth, and ORP was significant for TC, whereas carbonate and groundwater levels were significant for E. coli for the post-monsoon season. For the pre-monsoon season, distance from toilet and depth of well were the significant covariates of TC, but none of the variables were found to be significant covariate of E. coli.
Discussion
Seasonal Variation in Physicochemical Parameters of Groundwater
The alkaline nature of the groundwater can be attributed to the presence of hydroxides, carbonates, and bicarbonates (Sajil Kumar et al., 2013). pH value was highest in monsoon season and decreased gradually in post-monsoon and pre-monsoon season, which was similar to the reported study of Frengsted et al. (2001). This value of pH is very suitable for the healthy growth of microorganisms (Banerjee and Gupta, 2010). Organic carbon is generally used by the microbes as a potential nutrient source; hence, it acts as the indicator of the potentiality of water to be contaminated by microbes. The highest concentration of TOC was recorded in the monsoon season because of the decomposition of organic matter by rainwater in the moist environment prevailing in this season and the low amount in other seasons indicates the consumption of TOC by microbial population present in the groundwater (Keesari et al., 2015). Chloride concentration was recorded highest in post-monsoon and decreased in pre-monsoon and monsoon. Generally, high chloride content is attributed to enriched irrigational return flow and intensive irrigational activities and possibly the higher rate of mineralization during the monsoon season (Sajil Kumar et al., 2013). All the water samples of this area can be grouped under soft water because the chloride values were far less than the permissible limit according to World Health Organization (2008), that is, 600 mg/L (Table 3). A study of the source of nitrite which is a good indicator of anthropogenic contamination, using stable isotopic composition of water reported an elevated nitrite concentration in the groundwater of this study area which was sourced from onsite sanitation, sewage, and animal manure (Elisante and Muzuka, 2016). Nitrite was recorded highest in monsoon than other two seasons, and this fact can be attributed to the seepage of wastewater with rain water from the sewage system, septic tank, and agricultural land surrounding the tube wells. Similar results of seasonal changes in nitrite concentration in groundwater were reported earlier by Rengaraj (1996); and Jhansilakshmi and Reddi (2014). Sulfate concentration in this study was recorded highest in pre-monsoon season than monsoon and post-monsoon probably due to dilution effect with rainwater. The sulfate concentration of all the groundwater samples was below the maximum permissible limit for drinking purposes which is 250 mg/ L set up by World Health Organization (2008).
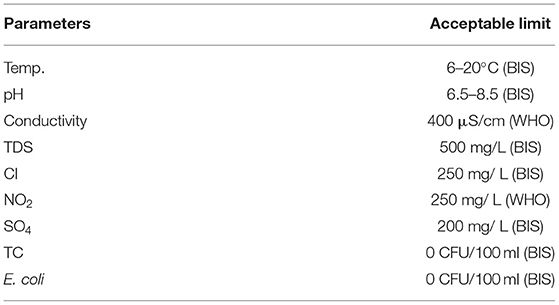
Table 3. Acceptable limit of physicochemical parameters in drinking water.
Role of Hydrogeological Conditions on Occurrence of Total Coliform
Groundwater quality in terms of chemical composition is dependent on local and regional geology. On the contrary, meteoric recharge of groundwater also plays a crucial role in its chemical compositions (Guler and Thyne, 2004; Sunne et al., 2005). The occurrence of TC in groundwater is evidence of filtration through aquifer sands to shallow water table, which is a likelihood condition for the migration to shallow aquifer. The contamination of groundwater TC is by 100 orders of magnitudes lower than the surface water. The occurrence of TC is high and frequent in shallow aquifers than the deep aquifers because of retardation of and die-off along the long vertical flow path. The number of occurrences of TC in groundwater samples was highest in monsoon than in pre-monsoon season, but abundance was higher in pre-monsoon than monsoon. Richardson et al. (2009) also observed an increase in coliform detection rates in groundwater in warm weather than in cold while conducting a large survey of groundwater and surface water in England, but the occurrence of TC and E. coli in groundwater samples in monsoon over the other two seasons depicts that microbial transport mechanism is season-dependent possibly because of local groundwater recharge (Atherholt et al., 2017). An increase in the groundwater TC concentration after rainfall event in monsoon can be attributed to the vertical flushing of bacteria when they are introduced to the vadose zone as well as mobilization of the bacteria from the grain surface as both water content and shear velocity increase in monsoon (DeNovio et al., 2004; Pronk et al., 2007). The lithological configuration in the respective study area is made up to lose to medium-to-coarse grain sand in up to the depth of the study interest in this study and is justifying the monsoonal mobilization of TC and E. coli in groundwater (Figure 1d). Few earlier reports from England, Scotland, and Canada also reported similar seasonal coliform occurrence patterns in groundwater (Raina et al., 1999; Rutter et al., 2000; Reid et al., 2003; Kostyla et al., 2015).
Richardson et al. (2009) demonstrated that the mechanism behind the seasonal trend of coliform contamination may have been influenced by seasonal agricultural practices and climatic factors. Generally, the transport of bacteria to groundwater through porous media in different seasons is controlled by three major processes, that is, straining, adsorption, and inactivation. In dry periods, bacteria travel through the unsaturated zone with mobile water and continuously interact with a gaseous and solid phase which causes their temporary immobilization and the bacteria remain trapped and inactive in the stagnant pore water and the gas bubbles between soil particles. During heavy rainfall in the monsoon season, the connectivity increases between the mobile and immobile phases of water which activates the bacterial cells and increases their migration toward underlying groundwater (Ausland et al., 2002; Łuczkiewicz and Quant, 2007). On the contrary, low-lying areas and depressions are among the major recharge areas for groundwater which can also act as a secondary point source of pathogenic contaminants to shallow depth groundwater. In the monsoon season, heavy rainfall washes out sanitary waste from over a vast area into nearby low land or depressions from where pathogenic bacteria get entry to the underlying shallow aquifer (Escamilla et al., 2013). Inundation of land including the wellheads as a result of heavy rainfall in monsoon can lead to the contamination of surface water which can easily reach the groundwater in inundated conditions (Luby et al., 2008). Previous studies have also explained inundation as an important cause of groundwater contamination (Godfrey et al., 2006). As coliform is a group of thermotolerant bacteria, the abundance of TC was found to be less at low temperature in post-monsoon, the growth was enhanced, and reproduction rates became higher in warm weather under favorable environmental conditions (Bronikowski et al., 2001). An increase in coliform concentration in summer than winter may be related to an increase in the volume of groundwater extraction during warm weather. As the groundwater extraction rate increases, the travel time of the microorganisms from the source to the well becomes shorter and thus reduces the rate of die-off (John and Rose, 2005; Atherholt et al., 2017). Coliform-associated health hazard, mainly diarrhea, is also found to outbreak in the wet season (Alexander and Blackburn, 2013).
Source of Coliform Contamination
From our study, it was observed that shallow depth tube wells nearer to sanitation site were more contaminated with coliform bacteria than the deeper tube wells (Figure 3). High concentrations of coliform bacteria in the domestic wells located near latrines and septic tanks were reported earlier by Banerjee (2011). There are several possible pathways for the pathogenic contamination of groundwater from a sanitation source. Francy et al. (2000) and Valenzuela et al. (2009) indicated that microorganisms from onsite sanitation and sewage from animal sheds come into contact with the groundwater by percolation through aquifer media. If concrete platforms are absent around hand-pumps and if the shallow depth tube wells are located in the vicinity of potential contamination sources like septic tanks, onsite sanitary land, and animal sheds, the contaminated water could reach the underlying groundwater by percolation which would consequently contaminate the groundwater by pathogenic microorganism (Gupta et al., 2014). Fecal waste can also enter the wells through unsealed annulus or subsurface leakage in pipes (Morris et al., 2003). Another possible pathway of coliform contamination is direct vertical infiltration of effluent from below the sanitation site or latrines to the shallow unconfined aquifer through the unsaturated zone above it (Escamilla et al., 2013). From correlation analysis, the existence of a negative correlation between TC contamination and the distance of the tube well from sanitary latrines was also noticed (Figure 3). A negative correlation was also observed between coliform bacteria and the depth of the tube wells. From this result, it can be said that pathogenic contamination of shallow groundwater is influenced by surface contamination through some indirect pathways like infiltration from the sanitation site or through lateral transport due to leakage in the pipe (Knappett et al., 2012a,b). The coliform counts were decreasing significantly with increasing depth of the tube wells in all the seasons due to retention of bacteria by soil particles and death of the microorganisms at a greater depth as the environment becomes extremely hostile for life with increasing depth (Bitton and Harvey, 1992; Graham and Polizzotto, 2013; Keesari et al., 2015; Elisante and Muzuka, 2016). In a study of Bangladesh, Knappett et al. (2012b) also observed a continuous decrease in fecal indicator bacteria with a depth of wells located near latrine ponds. This negative correlation between TC count and the depth of the tube wells can also be attributed to the sediment heterogeneity and some well-specific processes like the growth of biofilm in the space between the contamination source and the deeper aquifer that can filter out bacterial cells from reaching the groundwater (Ferguson et al., 2011). Different sources of groundwater coliform contamination are described in Figure 6 through a schematic diagram with seasonal statistical significance.
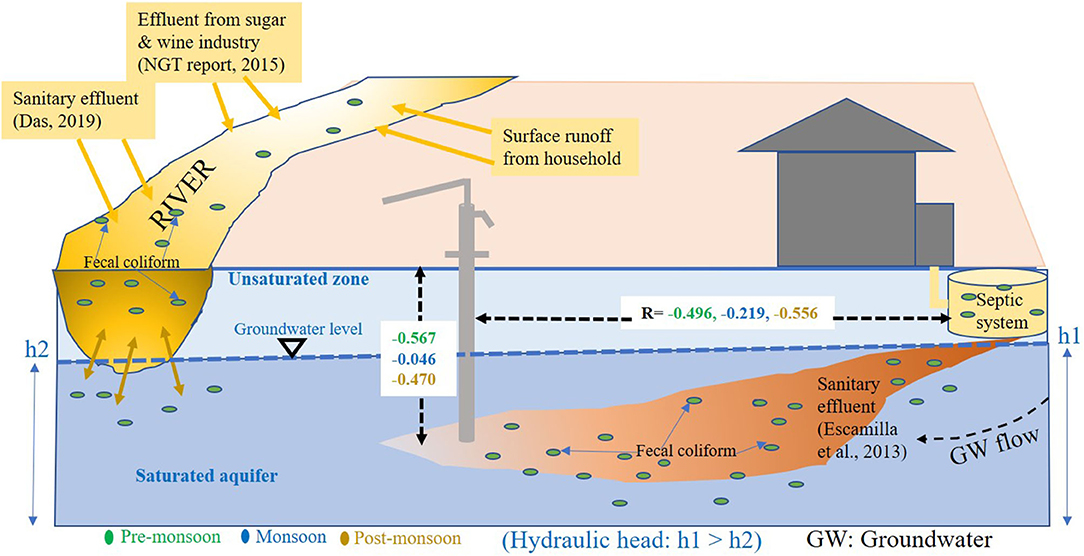
Figure 6. Schematic diagram of groundwater coliform contamination from sanitation and contaminated surface water with statistical significance in different seasons.
In our study, a few samples showed very low coliform concentration despite being located near a sanitation site. Sometimes, transportation of bacteria from the contaminated source to fresh groundwater is prohibited by a “scum mat,” also known as “bioactive layer” or “clogged zone” which automatically develops around the contamination source due to blockage of soil pore spaces by filtered out solids or swelling of clay minerals or by the precipitating of insoluble salts. Such kind of biologically active layer limits the movement of pathogenic bacteria either through filtration or by killing them by antagonistic organisms that reside in these zones (Graham and Polizzotto, 2013).
It was also observed from our study that higher TC bacteria were present in the groundwater samples which were collected from the tube wells nearer to the Churni river course which was highest in monsoon season. Previously, coliform contamination of groundwater, sourced from contaminated surface water bodies like a pond and lakes, was reported through a comparison between groundwater and surface water stable isotopic composition study (Neumann et al., 2010; van Geen et al., 2011). In some rural villages, coliform was reported to enter shallow groundwater through seepage from canals (Knappett et al., 2011) and pit latrines (Shivendra and Ramaraju, 2015). Knappett et al. (2012a,b), in their study of input of fecal bacteria from the latrine-contaminated pond into the wells in the sandy aquifer in Bangladesh, considered the latrine-contaminated ponds as a significant source of coliform contamination to the shallow confined aquifer adjacent to the pond, with contamination being highest in early monsoon season. It is already evident that if a very small fraction of contaminated surface water is mixed with the groundwater, it can contaminate the groundwater beyond the permissible limit (Leber et al., 2011). From our study result also, it can be speculated that a high level of TC in the groundwater near the river course can come through the river bed to the shallow aquifer as the river water was found to be highly contaminated with both TC bacteria and E. coli in all three seasons, being highest in monsoon.
Implication for Safe Drinking Water and Role of Population
Access to safe water and basic sanitation, along with good health and wellbeing for all by 2030, has been identified as one of the primary goals by The United Nations Millennium Plan for Sustainable Development (Dutta Gupta et al., 2019). Over the past few decades or to be very specific in the last few years, administrative authorities have implemented policies for the development of millions of sanitation structures, but their implications on groundwater quality or consequent health effects are yet to be understood (Mukherjee et al., 2020). From our study, it was clear that some physicochemical parameters have a positive influence and some have a negative influence on the growth and abundance of coliform bacteria in groundwater. Also, the occurrence and concentration of coliform bacteria vary seasonally. Among the total groundwater samples, 61% in pre-monsoon, 87.5% in monsoon, and 59% in the post-monsoon season have TC count over the permissible limit of 10 CFU/ 100 ml of water (World Health Organization, 2008). Although Nadia district has been declared as an open defecation-free district in 2015 (The Hindu, 2015), poor sanitation infrastructure and the location of sanitation sites are still affecting the groundwater quality at shallow depths observed from this study. The owner of the tube wells and the tube well drillers have a poor understanding of the groundwater system and contamination pathways (observed from the filed survey), which leads to the installation of tube wells near the sanitation system or building a sanitation facility near a tube well to easily access the water. Local people have mere knowledge that the shallow groundwater is being contaminated due to the proximity to the sanitation site.
Use of shallow groundwater is evident in the respective study area which is susceptible and contaminated with the TC. As per our field survey, each of the wells has average 200 users with minimum 4 to maximum 600 person. With the increasing population trend and having population density of 1,316/km2 (as 2011 Indian census report) would create additional increasing pressure on groundwater depletion, which would lead to decline groundwater quality and quantity in the present day and impending future.
The groundwater fecal contamination also depends on the casing of tube wells, which could cause contamination directly being transported to the groundwater from the nearby sources. The unsafe concrete floor of a septic tank is highly vulnerable when the depth to water level is very low like in this study area. Univariate logistic regression also shows a similarly significant negative relationship between distance from toilet and well depth with the TC, whereas groundwater level has a significant negative correlation with E. coli for the post-monsoon season.
Possible Risk Factors for Groundwater Fecal Contamination
Fecal contamination sourced acute diarrhea was recorded highest in the 1990s (212 cases in block Hanskhali) within the period of 1990 to 2015. The “Swachh Bharat Abhiyan” was initiated in 2014, and it was found that the acute diarrhea cases were significantly reduced in each of the blocks in the year 2015 (Figure 7) (Mukherjee et al., 2019). However, this study shows that the presence of TC in groundwater is significantly high in the monsoon season than in the other. Although there are presently no acute diarrhea cases in the study area, TC is present in groundwater at an alarming level. Based on the results of our study, it can be highlighted that the groundwater used for drinking purposes in the study area was possibly unsafe by coliform contamination due to (1) the lack of awareness among the local people, (2) limited knowledge of local stakeholders for drilling wells by maintaining the safe distance from the sanitary sources, and (3) unwise site selection for construction and improper infrastructure of the public and household latrines. Thus, these findings indicate that our primary responsibility would be to find out the potential risky sanitary sources around the drinking water wells.
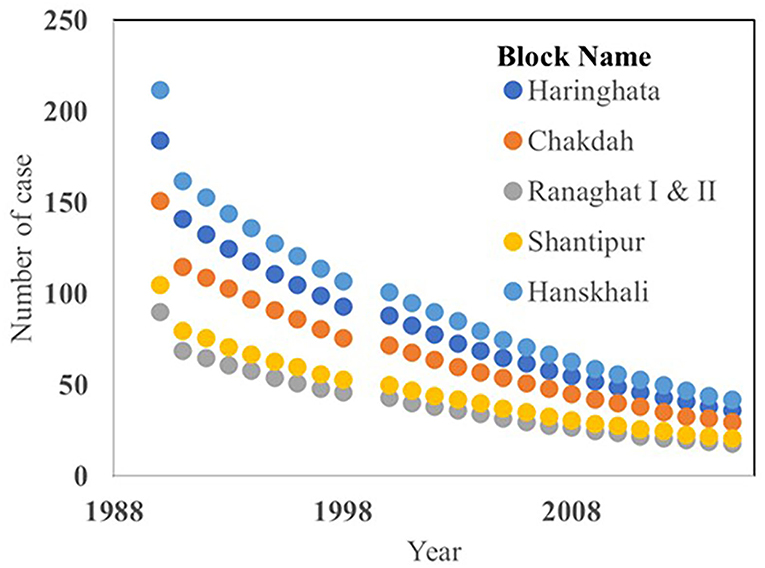
Figure 7. Year-wise number of acute diarrhea cases in the study area.
It is very convenient to build latrines in the vicinity of tube wells for local community, but our study suggests that improvement of sanitation infrastructure and spatial separation of tube wells from sanitation sites can improve groundwater quality. Therefore, detection of even a very low TC count in any groundwater requires an affordable treatment process or supply from an alternative source. Rainwater harvesting can be an alternative source, but it is less accepted because of interruption in the supply of freshwater throughout the year. The piped water system, that is, providing treated and safe drinking water through a pipeline to individual houses or the community level, is a healthier option. Although in some areas of the district, PHED (Public Health and Engineering Department, West Bengal) is providing treated drinking water through the pipeline, which is also arsenic-free, people in some rural areas are still using such contaminated water which is causing serious threat to their health like bloody diarrhea and watery diarrhea, particularly among children.
Conclusion
Improper sanitation system has the potential to contaminate microbially both groundwater and surface water. In our study, we have demonstrated the seasonal changes in coliform contamination of groundwater collected from both sides of the Churni river course, Nadia, West Bengal. Most of the groundwater samples were contaminated with TC in all the seasons, whereas maximum samples were free of fecal coliform. TC count was lowest in the post-monsoon season and highest in the pre-monsoon season, but the detection rate of TC was highest in monsoon than pre-monsoon season. Physicochemical parameters like conductivity, TDS, TOC, chloride, and sulfate have a positive correlation with total and fecal coliform (E. coli) in both pre-monsoon and post-monsoon seasons, while in monsoon the correlations were not significant. From our observations, it can be said that the sources of contamination were both from improper sanitation system and the contaminated surface water because contamination was higher in the tube wells which was located closer to the sanitation site and the highest TC bacteria were present in the groundwater samples which were collected from the tube wells nearer to the Churni river course. Coliform contamination also increased with decreasing depth of the tube wells. Shallow tube wells adjacent to the sanitation site were more susceptible to microbial contamination than the deeper ones. The findings of our study would be helpful to provide coliform-free drinking water in the study area as well as the other parts of the world where a large proportion of the population is primarily dependent on groundwater as the primary source of drinking water.
Data Availability Statement
The raw data supporting the conclusions of this article will be made available by the authors, without undue reservation.
Author Contributions
AM and UD conceived the idea of the study and the manuscript. UD, SoS, SD, AB, and KD did the all sampling, fieldwork, and geospatial and statistical analyses. KD and SuS helped with the biological analyses. UD authored the manuscript with inputs of others. AM was supervised the work. All authors contributed to the article and approved the submitted version.
Funding
Thanks to the DST-SERB National Post-doctoral Fellowship to UD (Project code: PDF/2017/000661). The work was primarily supported by the WSSO, Public Health Engineering, Government of West Bengal [vide no. PHE/WSSO/37 (PI-II) 206, dt. February 2, 2017], partly supported by the Department of Science and Technology (DST), Government of India [vide no. DST/TM/INDO-UK/2K17/55(C) & 55(G)], through NERC-DST Newton-Bhabha Project FAR-GANGA (NE/R003386/1), and partly funded by DST, Project No. DST/TMD-EWO/WTI/2K19/EWFH/2019/201 (G) & (C).
Conflict of Interest
The authors declare that the research was conducted in the absence of any commercial or financial relationships that could be construed as a potential conflict of interest.
The handling editor MS declared a past co-authorship with the authors SoS and AM.
Publisher's Note
All claims expressed in this article are solely those of the authors and do not necessarily represent those of their affiliated organizations, or those of the publisher, the editors and the reviewers. Any product that may be evaluated in this article, or claim that may be made by its manufacturer, is not guaranteed or endorsed by the publisher.
Acknowledgments
The authors are very much thankful to the Government of West Bengal (PHED) for their cooperation and assistance during field instrumentation and logistics. The authors express their gratitude to the School of Environmental Science and Engineering, Indian Institute of Technology Kharagpur. Special thanks to Mr. Gangadhar Puttunuru and Mr. Amit Chowdhury for their continuous help in fieldwork for the entire period of study and lastly to the colleagues at IIT Kharagpur for their informal review.
References
Alexander, K. A., and Blackburn, J. K. (2013). Overcoming barriers in evaluating outbreaks of diarrheal disease in resource poor settings: assessment of recurrent outbreaks in Chobe District, Botswana. BMC Public Health 13, 775. doi: 10.1186/1471-2458-13-775
American Public Health Association (APHA) (2005). Standard Methods for the Examination of Water and Wastewater, 21st ed. Washington, DC: APHA, AWWA, WEF.
Atherholt, T. B., Procopio, N. A., and Goodrow, S. M. (2017). Seasonality of coliform bacteria detection rates in New Jersey domestic wells. Groundwater. 55, 346–361. doi: 10.1111/gwat.12482
Ausland, G., Stevik, T. K., Hanssen, J. F., Kohler, J. C., and Jenssen, P. D. (2002). Intermittent filtration of waste water removal of fecal coliforms and fecal streptococci. Water Res. 36, 3507.
Banerjee, G. (2011). Underground pollution travel from leach pits of on-site sanitation facilities: a case study. Clean Technol. Environ. Pol. 13, 489–497. doi: 10.1007/s10098-010-0331-3
Banerjee, U. S., and Gupta, S. (2010). Seasonal assessment of irrigation water suitability of river Damodar in West Bengal, India. J. Crop Weed. 6, 6–12.
Bitton, G., and Harvey, R. W. (1992). “Transport of pathogens though soil and aquifers,” in Environmental Microbiology, ed Mitchell R. (New York, NY: Wiley-Liss), p. 103–124.
Bronikowski, A. M., Bennett, A. F., and Lenski, R. E. (2001). Evolutionary adaptation to temperature. VIII. Effects of temperature on growth rate in natural isolates of Escherichia coli and Salmonella enterica from different thermal environments. Evolution. 55, 33–40. doi: 10.1111/j.0014-3820.2001.tb01270.x
Das, K., and Mukherjee, A. (2019). Depth-dependent groundwater response to coastal hydrodynamics in the tropical, Ganges river mega-delta front (the Sundarbans): Impact of hydraulic connectivity on drinking water vulnerability. J. Hydrol. 575, 499–512. doi: 10.1016/j.jhydrol.2019.05.053
Das, S. (2019). Churni River Pollution and Cause Effects of This Pollution and Prevention. Blog. Available online at: https://churni-river.blogspot.com/2019/11/detail-report-on-churni-river-and-its.html?m=1
Dayanti, M. P., Fachrul, M. F., and Wijayanti, A. (2018). Escherichia coli as bioindicator of the groundwater quality in Palmerah District, West Jakarta, Indonesia. IOP Conferance Series: Earth Environ. Sci. 106, 1–6. doi: 10.1088/1755-1315/106/1/012081
DeNovio, N. M., Saiers, J. E., and Ryan, J. N. (2004). Colloid movement in unsaturated porous media: recent advances and future directions. Vadose Zone J. 3, 338–351. doi: 10.2136/vzj2004.0338
Dutta Gupta, S., Bhattacharya, A., Mukherjee, A., Chattopadhyay, S., Bhanja, S. N., Sarker, S., et al. (2019). Groundwater faecal pollution observation in parts of Indo-Ganges–Brahmaputra river basin from in-situ measurements and satellite-based observations. J. Earth Sys. Sci. 128, 1–6. doi: 10.1007/s12040-019-1087-8
Elisante, E., and Muzuka, A. N. (2016). Sources and seasonal variation of coliform bacteria abundance in groundwater around the slopes of Mount Meru, Arusha, Tanzania. Environ. Monit. Assess. 188, 1–19. doi: 10.1007/s10661-016-5384-2
Escamilla, V., Knappett, P. S. K., Yunus, M., Streatfield, P. K., and Emch, M. (2013). Influence of latrine proximity and type on tubewell water quality and diarrheal disease in Bangladesh. Ann. Am. Assoc. Geogr. 103, 299–308. doi: 10.1080/00045608.2013.756257
Ferguson, A. S., Mailloux, B. J., Ahmed, K. M., van Geen, A., McKay, L. D., and Culligan, P. J. (2011). Hand-pumps as reservoirs for microbial contamination of well water. J. Water Health. 9, 708–717. doi: 10.2166/wh.2011.106
Francy, D. S., Helsel, D. R., and Nally, R. A. (2000). Occurrence and distribution of microbiological indicators in groundwater and stream water. Water Environ. Res. 72, 152–161. doi: 10.2175/106143000X137220
Frengsted, B., Banks, D., and Siewers, U. (2001). The chemistry of Norwegian groundwater, the pH dependence of element concentration in crystalline bed rock groundwater. Scie. Tot. Environ. 277, 101–117.
Godfrey, S., Timo, F., and Smith, M. (2006). Microbiological risk assessment and management of shallow groundwater sources in Lichinga, Mozambique. Water Environ. J. 20, 194–202. doi: 10.1111/j.1747-6593.2006.00040.x
Graham, J. P., and Polizzotto, M. L. (2013). Pit latrines and their impacts on groundwater quality: a systematic review. Environ. Health Perspect.121, 521–530. doi: 10.1289/ehp.1206028
Guler, C, and Thyne, G. D. (2004). Hydrologic and geologic factors controlling surface and groundwater chemistry in Indian Wells-Owens Valley area, southeastern California, USA. J. Hydrol. 285, 177–198.
Gupta, P., Pandey, G., Milind, G., Sravastava, D. K., and Misra, B. R. (2014). A study on the presence of faecal coliforms (E. coli) in groundwater samples of Gorakhpur city, India. Int. J. Environ. Sci. 3, 9–12.
Hussain, S. A., Das, K., Bhanja, S., and Mukherjee, A. (2017). Potential Impact of Climate Change on Surface Water and Groundwater Interactions in lower reaches of Ganges river, India. Groundwater of South Asia. Chapter 34, 583–591.
Indian Meteorological Department (2022). Customized Rainfall Information System (CRIS) Hydromet Division, India Meteorological Department Ministry of Earth Science, New Delhi. Available online at: https://mausam.imd.gov.in/imd_latest/contents/rainfall_statistics_3.php
Jhansilakshmi, E., and Reddi, E. U. B. (2014). Seasonal variations in physico-chemical parameter of groundwater in Bhimavaram, Andhra Pradesh India. Int. J. Eng. Res. 10, 58–65.
John, D. E., and Rose, J. B. (2005). Review of factors affecting microbial survival in groundwater. Environ. Sci. Technol. 39, 7345–7356. doi: 10.1021/es047995w
Keesari, T., Ramakumar, K. L., Bala Krishna Prasad, M., Chidambaram, S., Perumal, P., Prakash, D., et al. (2015). Microbial evaluation of groundwater and its implications on redox condition of a multi-layer sedimentary aquifer system. Environ. Process. 2, 331–346. doi: 10.1007/s40710-015-0067-5
Knappett, P. S. K., Escamilla, V., Layton, A., McKay, L. D., Emch, M., Williams, D. E., et al. (2011). Impact of population and latrines on fecal contamination of ponds in rural Bangladesh. Sci. Total Environ. 409, 3174–3182. doi: 10.1016/j.scitotenv.2011.04.043
Knappett, P. S. K., McKay, L. D., Layton, A., Williams, D. E., Alam, M. J., Huq, M. R., et al. (2012a). Implications of fecal bacteria input from latrine-polluted ponds for wells in sandy aquifers. Environ. Sci. Technol. 46, 1361–1370. doi: 10.1021/es202773w
Knappett, P. S. K., McKay, L. D., Layton, A., Williams, D. E., Alam, M. J., Mailloux, B. J., et al. (2012b). Unsealed tubewells lead to increased fecal contamination of drinking water. J. Water Health. 10, 565–578. doi: 10.2166/wh.2012.102
Kostyla, C., Bain, R., Cronk, R., and Bartram, J. (2015). Seasonal variation of fecal contamination in drinking water sources indeveloping countries: a systematic review. Sci. Total Environ. 514, 333–343 doi: 10.1016/j.scitotenv.2015.01.018
Leber, J., Rahman, M. M., Ahmed, K. M., Mailloux, B., and van Geen, A. (2011). Contrasting influence of geology on E. coli and arsenic levels in sedimentary aquifers. Ground Water. 49, 111–123. doi: 10.1111/j.1745-6584.2010.00689.x
Luby, S. P., Gupta, S. K., Sheikh, M. A., Johnston, R. B., Ram, P. K., and Islam, M. S. (2008). Tube well water quality and predictors of contamination in three flood-prone areas in Bangladesh. J. Appl. Microbiol. 105, 1002–1008. doi: 10.1111/j.1365-2672.2008.03826.x
Łuczkiewicz, A., and Quant, B. (2007). Soil and groundwater fecal contamination as a result of sewage sludge land application. Pol. J. Environ. Stud. 16, 587–593.
Morris, B. L., Lawrence, A. R. L., Chilton, P. J. C., Adams, B., Calow, R. C., and Klinck, B. A. (2003). “Groundwater and its susceptibility to degradation: a global assessment of the problem and options for management,” in Early Warning and assessment report series, RS 03-3. Nairobi, Kenya: United Nations Environment Programme.
Mukherjee, A., Babu, S. S., and Ghosh, S. (2020). Thinking about water and air to attain sustainable Development Goals during times of COVID-19 pandemic. J. Earth Syst. Sci. 129, 1–8. doi: 10.1007/s12040-020-01475-0
Mukherjee, A., Bhattacharya, P., Shi, F., Fryar, A. E., Mukherjee, A. B., Xie, Z. M., et al. (2009). Chemical evolution in the high arsenic groundwater of the Huhhot basin (Inner Mongolia, PR China) and its difference from the western Bengal basin (India). Appl. Geochem. 24, 1835–1851. doi: 10.1016/j.apgeochem.2009.06.005
Mukherjee, A., Duttagupta, S., Chattopadhyay, S., Bhanja, S. N., Bhattacharya, A., Chakraborty, S., et al. (2019). Impact of sanitation and socio-economy on groundwater fecal pollution and human health towards achieving sustainable development goals across India from ground-observations and satellite-derived nightlight. Sci. Rep. 9, 1–11. doi: 10.1038/s41598-019-50875-w
Mukherjee, A., and Fryar, A. E. (2008). Deeper groundwater chemistry and geochemical modelling of the arsenic affected western Bengal basin, West Bengal, India. App. Geochem. 23, 863–894. doi: 10.1016/j.apgeochem.2007.07.011
Mukherjee, A., Fryar, A. E., and Howell, P. D. (2007). Regional hydrostratigraphy and groundwater flow modeling in the arsenic-affected areas of the western Bengal basin, West Bengal, India. Hydrogeol. J. 15, 1397–1418. doi: 10.1007/s10040-007-0208-7
Mukherjee, A., Saha, D., Harvey, C. F., Taylor, R. G., Ahmed, K. M., and Bhanja, S. N. (2015). Groundwater systems of the Indian sub-continent. J. Hydrol. Reg. Stud. 4, 1–14. doi: 10.1016/j.ejrh.2015.03.005
Mukherjee, A., von Brömssen, M., Scanlon, B. R., Bhattacharya, P., Fryar, A. E., Hasan, M. A., et al. (2008). Hydrogeochemical comparison and effects of overlapping redox zones on groundwater arsenic near the western (Bhagirathi sub-basin, India) and Eastern (Meghna sub-basin, Bangladesh) margins of the Bengal Basin. J. Contam. Hydrol. 99, 31–48. doi: 10.1016/j.jconhyd.2007.10.005
Neumann, R. B., Ashfaque, K. N., Badruzzaman, A. B. M., Ali, M. A., Shoemaker, J. K., and Harvey, C. F. (2010). Anthropogenic influences on groundwater arsenic concentrations in Bangladesh. Nat. Geosci. 2010, 46–52. doi: 10.1038/ngeo685
Pronk, M., Goldscheider, N., and Zopfi, J. (2007). Particle-size distribution as indicator for fecal bacteria contamination of drinking water from karst springs. Environ. Sci. Technol. 41, 8400–8405. doi: 10.1021/es071976f
Raina, P. S., Pollari, F. L., Teare, G. F., Goss, M. J., Barry, D. A. J., and Wilson, J. B. (1999). The relationship between E. coli indicator bacteria in well-water and gastrointestinal illnesses in rural families. Can. J. Public Health. 90, 172–175. doi: 10.1007/BF03404501
Ravenscroft, P., Mahmud, Z. H., Shafiqul Islam, M., Hossain, A. K. M. Z., Zahid, A., Saha, G. C., et al. (2017). The public health significance of latrines discharging to groundwater used for drinking. Water Res.124, 192–201. doi: 10.1016/j.watres.2017.07.049
Reid, D., Edwards, A., Cooper, D., Wilson, E., and McGraw, B. (2003). The quality of drinking water from private water supplies in Aberdeenshire, UK. Water Res. 2, 245–254. doi: 10.1016/S0043-1354(02)00266-X
Rengaraj, S. (1996). Groundwater quality in sub urban regions of Madras city. Pollut. Res. 15, 325–328.
Richardson, H. Y., Nichols, G., Lane, C., Lake, I. R., and Hunter, P. R. (2009). Microbiological surveillance of private water supplies in England – the impact of environmental and climate factors on water quality. Water Res. 43, 2159–2168. doi: 10.1016/j.watres.2009.02.035
Rutter, M., Nichols, G. L., Swan, A., and De Louvois, J. (2000). A survey of the microbiological quality of private water supplies in England. Epidemiol. Infect. 124, 417–425. doi: 10.1017/S0950268899003970
Sajil Kumar, P. J., Jose, A., and James, E. J. (2013). Spatial and seasonal variation in groundwater quality in parts of Cuddalore district, South India. Natl. Acad. Sci. Lett. 36, 167–179.
Shar, A. H., Kazi, Y. F., and Soomro, I. H. (2008). Impact of seasonal variation on bacteriological quality of drinking water. Bangladesh J. Microbiol. 25, 69–72. doi: 10.3329/bjm.v25i1.4862
Shivendra, B. T., and Ramaraju, H. K. (2015). Impact of onsite sanitation system on Groundwater in different Geological settings of Peri Urban areas. Aquat. Procedia. 4, 1162–1172. doi: 10.1016/j.aqpro.2015.02.148
Sunne, V. E., Sanchez Vila, X., and Carrera, J. (2005). Introductory review of specific factors influencing urban groundwater, an emerging branch of hydrogeology, with reference to Barcelona, Spain. Hydrogeol. J. 13, 522–533.
The Hindu. (2015). “Mamata declares Nadia first 'open defecation-free' district in India”. Krishnanagar.
Tripathi, K., and Sharma, A. K. (2011). Seasonal variation in bacterial contamination of water sources with antibiotic resistant faecal coliforms in relation to pollution. J. appl. nat. sci. 3, 298–302. doi: 10.31018/jans.v3i2.202
Valenzuela, M., Lagos, B., Claret, M., Mondaca, M. A., Pérez, C., and Parra, O. (2009). Fecal contamination of groundwater in a small rural dry land watershed in central chile. Chil. J. Agric. Res. 69, 235–243. doi: 10.4067/S0718-58392009000200013
van Geen, A., Ahmed, K. M., Akita, Y., Alam, M. J., Culligan, P. J., Emch, M., et al. (2011). Fecal contamination of shallow tubewells in Bangladesh inversely related to arsenic. Environ. Sci. Tech. 45, 1199–1205. doi: 10.1021/es103192b
Verhougstraetea, M. P., Martinb, S. L., Kendallb, A. D., Hyndmanb, D. W., and Rosea, J. B. (2015). Linking fecal bacteria in rivers to landscape, geochemical, and hydrologic factors and sources at the basin scale. PNAS. 112, 10419–10424. doi: 10.1073/pnas.1415836112
Wang, Y., Bradford, S. A., and Simunek, J. (2014). Physicochemical factors influencing the preferential transport of Escherichia coli in soils. Vadose Zone J. 13, 1–10. doi: 10.2136/vzj2013.07.0120
Wood, W. W. (1981). “Guidelines for collection and field analysis of groundwater samples for selected unstable constituents,” in Techniques of Water-Resources Investigations of the United States Geological Survey, Book 1, Chapter D2,11 p.
World Health Organization (2004). The World health report: 2004: Changing history. World Health Organization. Available online at: https://apps.who.int/iris/handle/10665/42891
Keywords: coliform contamination, groundwater, sanitation, Churni river, fecal coliform
Citation: Dey U, Sarkar S, Duttagupta S, Bhattacharya A, Das K, Saha S and Mukherjee A (2022) Influence of Hydrology and Sanitation on Groundwater Coliform Contamination in Some Parts of Western Bengal Basin: Implication to Safe Drinking Water. Front. Water 4:875624. doi: 10.3389/frwa.2022.875624
Received: 14 February 2022; Accepted: 19 May 2022;
Published: 22 June 2022.
Edited by:
Mohammad Shamsudduha, University College London, United KingdomReviewed by:
Sandipan Ghosh, Chandrapur College, IndiaPankaj K. Gupta, University of Waterloo, Canada
Copyright © 2022 Dey, Sarkar, Duttagupta, Bhattacharya, Das, Saha and Mukherjee. This is an open-access article distributed under the terms of the Creative Commons Attribution License (CC BY). The use, distribution or reproduction in other forums is permitted, provided the original author(s) and the copyright owner(s) are credited and that the original publication in this journal is cited, in accordance with accepted academic practice. No use, distribution or reproduction is permitted which does not comply with these terms.
*Correspondence: Abhijit Mukherjee, amukh2@gmail.com