 Mark Wang
 Paola Passalacqua
 Shukai Cai
 Clint Dawson
- 1Center for Water and the Environment, Maseeh Department of Civil, Architectural and Environmental Engineering, The University of Texas at Austin, Austin, TX, United States
- 2Computational Hydraulics Group, Oden Institute for Computational Engineering and Sciences, The University of Texas at Austin, Austin, TX, United States
The Texas Gulf Coast region contains significant centers of population, infrastructure, and economy and is threatened by intensifying tropical storms. The flooding from these tropical storms often has multiple compounding drivers. This characteristic presents a complex numerical problem where a simulation must consider multiple hydrologic forcings. While several procedures exist for addressing this problem numerically, they tend to be resource-intensive and cannot be conducted in near real-time. We extend GeoFlood, a reduced physics approach for fluvial flood forecasting, to rapidly predict coastal and compound fluvial-coastal inundation. This method is validated against a numerical ocean circulation model (ADCIRC) simulation of Hurricane Ike, a major coastal flooding event that happened on the Texas Gulf Coast in 2008. We show that the inundation map generated by coastal HAND (c-HAND) has reasonable agreement with the ADCIRC simulation while taking about 1.7% of the time currently needed to run ADCIRC on a supercomputer. While our model correctly predicts 99% of ADCIRC-inundated DEM cells, it also overpredicts inundated area by a factor of approximately 27%. We combine c-HAND with the GeoFlood framework for fluvial flood forecasting to create a compound fluvial-coastal inundation mapping workflow that can be run in near real-time. c-HAND's fast wall-clock time and low CPU requirements can support decision making by first response personnel. The method provides timely and convenient access to crucial information, such as the locations of flooded roads and inundated coastal areas.
1 Introduction
Tropical storms across the North Atlantic have been increasing in severity over the past 40 years due to anthropogenic climate change, a trend which is expected to continue (Kossin et al., 2020). Flood damage in coastal cities could cost the United States $52 billion annually by 2050 (Hallegatte et al., 2013). The Gulf Coast region of the southern United States is also subjected to intensifying tropical storms (Dykstra and Dzwonkowski, 2021) and includes the Houston and Beaumont-Port Arthur metropolitan areas, where critical energy infrastructure coexists with a socially vulnerable population (Griego et al., 2020; Williams and Webb, 2021). Of the five costliest hurricanes in the United States, three devastated the Gulf Coast region (Katrina, Harvey, and Ida), totalling nearly half a trillion dollars in damage and causing over 2,000 fatalities (NOAA, 2022).
Flooding caused by tropical storms has compounding drivers–including fluvial, coastal, and pluvial flooding–and is difficult to model conventionally (Zscheischler et al., 2018; Jafarzadegan et al., 2022). Modeling solely fluvial flooding while neglecting other drivers is common (FEMA, 2017); however, this approach underestimates risk in coastal areas (Khanam et al., 2021). Understanding fluvial-coastal compound flooding is vital: the joint hazard of rainfall and coastal flooding may increase up to 3,600% in the southern United States by 2100 (Gori et al., 2022).
Accurate and efficient flood maps are essential for reducing impacts (Jafarzadegan et al., 2023). These maps are produced for three main objectives: planning purposes such as risk mapping and floodplain delineation (FEMA, 2017), damage assessment (Bhuiyan et al., 2012), and emergency response (Zheng et al., 2018a). Flood inundation mapping methods can be characterized as empirical, hydrodynamic, or conceptual (Teng et al., 2017). Empirical models are derived from remote-sensing data (Tellman et al., 2021), measurements (Watson et al., 2018), or statistical approaches (Moftakhari et al., 2017; Orton et al., 2020). Empirical approaches reflect direct observation of flooding. However, they depend on data availability, sensor calibration, weather conditions, and vegetation.
Hydrodynamic models solve the Navier-Stokes equations. Depth integrating the Navier-Stokes equations yields the shallow-water equations, which are solved by software packages such as ANUGA (Mungkasi and Roberts, 2013), GeoClaw (Clawpack Development Team, 2020), LISFLOOD-FP (Horritt and Bates, 2002), and ADCIRC (Westerink et al., 1992). Integrating over both depth and width results in the Saint-Venant equations, which are used by 1D HEC-RAS for fluvial flood mapping (Brunner, 2002). Hydrodynamic models have explanatory power because they rely on physical relationships (French and Clifford, 2000); however, they are computationally expensive to run (Miura et al., 2021). Hydrodynamic models also have difficulty considering multiple forcings such as coastal flooding and rainfall-runoff (Santiago-Collazo et al., 2019; Jafarzadegan et al., 2023), and are most appropriate for non-time prohibitive objectives such as planning and assessment.
Finally, simplified conceptual models have been proposed to map flood inundation in time prohibitive situations, e.g., for first responders (Zheng et al., 2018a). Conceptual models use approximate physical relationships and assumptions, are more computationally efficient than hydrodynamic models, and can be applied to high-resolution topography (Teng et al., 2017; McGrath et al., 2018). Simplified conceptual DEM-based approaches have been applied to calculate floodplain geometry as a power law function of stream contributing area (Nardi et al., 2006, 2019; Annis et al., 2022) and identify floodplains in ungaged watersheds (Manfreda et al., 2011; Jafarzadegan and Merwade, 2017; Samela et al., 2017, 2018).
The Height Above Nearest Drainage (HAND) method, first described by Rennó et al. (2008), can be used to calculate flood inundation along a river reach by converting stage height to spatial inundation (Figure 1). HAND scales efficiently and has been applied to the continental United States (Liu et al., 2018). Recently, simplified conceptual models have been applied to map the inundation from fluvial flooding, tidal flooding, and sea level rise (Knowles, 2010; Lichter and Felsenstein, 2012; Zheng et al., 2018a; Li et al., 2022; Enriquez et al., 2023) and to downscale hydrodynamic results (Rucker et al., 2021). To the best of our knowledge, a simplified conceptual model has not been developed yet for near real-time compound flood mapping.
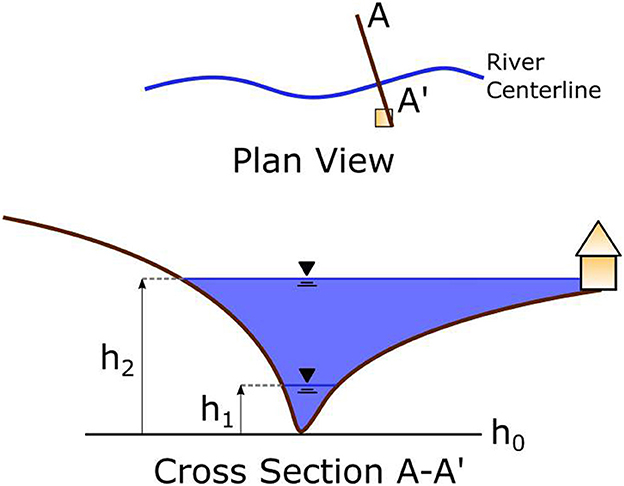
Figure 1. Schematic of the HAND method at a river cross-section. The “nearest drainage” height is h0. h1 represents the Height Above Nearest Drainage (HAND) value for a typical streamflow, while h2 represents a HAND value that causes flooding.
This research aims to address the following three questions: (i) whether a simplified conceptual model can efficiently map coastal inundation, (ii) how the model's results agree with a hydrodynamic and ocean circulation model (ADCIRC) simulation, and (iii) if this coastal inundation mapping approach can be combined with GeoFlood, a simplified conceptual fluvial inundation model (Zheng et al., 2018a), to obtain inundation from a compound fluvial-coastal event. To address these questions, we develop a HAND-inspired approach to quantify coastal flooding dubbed c-HAND (coastal HAND). We apply this method to a maximum coastal inundation map of Hurricane Ike and validate it against a maximum inundation backcast generated by ADCIRC. Finally, we demonstrate that the combined GeoFlood/c-HAND method can generate compound fluvial-coastal flood inundation maps in near real-time.
2 Data and methods
2.1 Data
2.1.1 Study area
The study area of Southeast Texas (Figure 2) contains the densely populated Beaumont-Port Arthur metropolitan area, several clusters of critical energy infrastructure, and is vulnerable to increasingly intense tropical storms. Southeast Texas has experienced several significant coastal compound flooding events recently, including floods caused by Hurricanes Harvey and Ida and Tropical Storm Imelda within the past 5 years. In addition to physical vulnerability, the region is home to socially vulnerable populations.
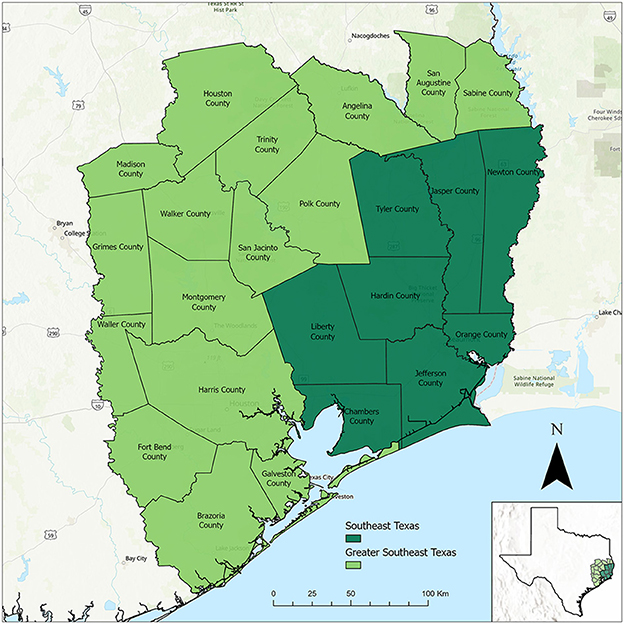
Figure 2. The region of Southeast Texas.
Southeast Texas is located along the Gulf of Mexico and is typically considered to include the Texas counties of Tyler, Jasper, Newton, Liberty, Hardin, Orange, Chambers, and Jefferson (Figure 2). Some definitions of Southeast Texas further include the counties of Houston, Trinity, Angelina, San Augustine, Sabine, Madison, Walker, San Jacinto, Polk, Grimes, Montgomery, Waller, Harris, Fort Bend, Brazoria, and Galveston (Figure 2). The low-relief topography can be characterized as Texas Coastal Plains and slopes gently toward the Gulf. In addition to the Sabine, Neches, and Trinity Rivers draining into the Gulf, many smaller streams drain into marshy bayous near the coast. The region has two major bays: Galveston Bay and Sabine Lake. Further inland there are pine, hardwood, and post oak forests and grasslands. Culturally, the eastern portion of Southeast Texas is closely linked to neighboring Louisiana.
2.1.2 Digital elevation models
We downloaded a 1/3 arc-second (about 10 m) resolution DEM with the U.S. Geological Survey online tool The National Map v2 (U.S. Geological Survey, 2018). The DEM resolution is equal in both the x and y direction. To compare the results of c-HAND with the ADCIRC model, we cropped the DEM (Figure 3) to spatially correspond to the higher resolution inland mesh of the ADCIRC model around Southeast Texas (Section 2.2.1). This DEM covers an area of 23,688 square kilometers and has approximately 600 million cells.

Figure 3. 1/3 arc-second resolution DEM covering Southeast Texas for comparison with the ADCIRC model. NOAA gage 8770777 at Manchester was used to obtain the coastal water surface elevation at this site.
2.1.3 Tide gage data
We downloaded ocean water surface elevation data from the Tides and Currents website maintained by NOAA CO-OPS. We obtained the coastal water surface elevation for Hurricane Ike from NOAA gage 8770777 at Manchester and applied it to the DEM (Figure 3). The Manchester gage has a 6-min resolution time series of ocean water surface elevation during the study period (Hurricane Ike: September 2008). The gage is located relatively far inland and in a highly developed area. Although several other NOAA gages have been installed closer to the coast, we chose this gage to more closely capture inland coastal inundation elevation. NOAA gage 8770777 at Manchester measured a maximum height of 3.8 m during Hurricane Ike, deviating substantially from the predicted tidal elevation in the absence of Hurricane Ike (Figure 4).

Figure 4. NOAA tide gage 8770777 at Manchester, TX during Hurricane Ike.
2.1.4 ADCIRC model results
ADCIRC is a hydrodynamic ocean circulation model that simulates storm surge with the shallow water equations and takes into account physical parameters such as wind direction and atmospheric pressure (Westerink et al., 1992). We conducted an ADCIRC simulation of Hurricane Ike (September 11–13 2008) on an unstructured triangular mesh covering the entire United States Eastern Seaboard and parts of Central and South America for model validation (we provide a link to this dataset in the data availability section) (Figure 5). The mesh has a varying spatial resolution with a higher average resolution (maximum 30 × 30 m) in our study area of Southeast Texas and in the Rio Grande Valley. The ADCIRC maximum elevation output file provides each mesh node's topographic elevation above the geoid and the maximum water surface elevation achieved at each node.
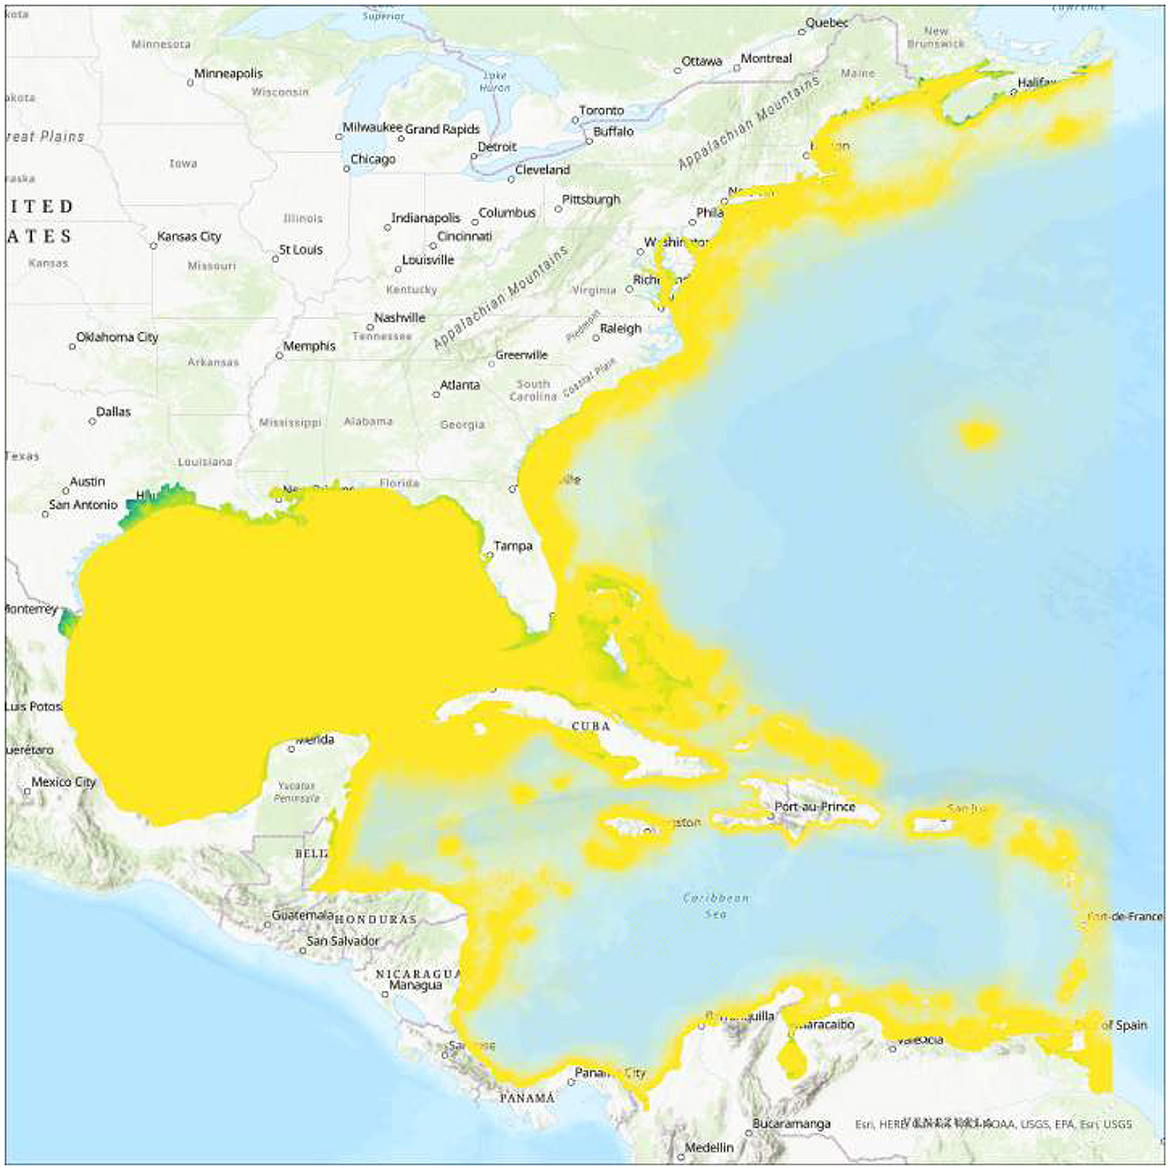
Figure 5. Full ADCIRC mesh. Figure created with the maximum surface elevation information in the maxele.63.nc output file.
Another ADCIRC output file provides a time series of coastal inundation conditions for Hurricane Ike. Hourly results are available from 01:00 11 September 2008 to 00:00 14 September 2008 UTC time. We chose four representative timestamps from the time series output file to characterize the dynamics of the ADCIRC simulated coastal inundation: 12:00 12 September 18:00 12 September 00:00 13 September and 00:00 14 September. We generated profiles by creating a Triangular Irregular Network (TIN) surface for ADCIRC's predicted inundation elevation at each representative timestamp and the maximum inundation case (Supplementary Figures S1–S3). We then extracted coastal inundation elevations along transverse (perpendicular to the coastline) and longitudinal (parallel to the coastline) profiles with the generated TINs from ADCIRC (Figure 6).
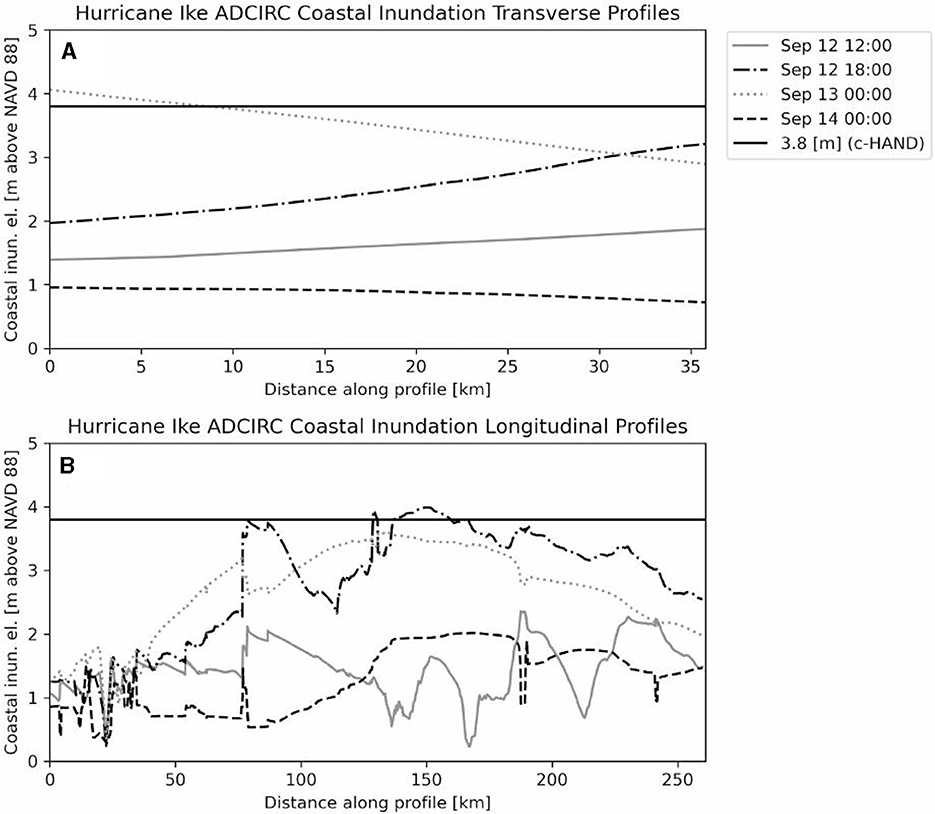
Figure 6. Coastal inundation profiles for each representative timestamp and for the case of maximum inundation along a transverse profile [(A) Perpendicular to the coast] and longitudinal profile, [(B) parallel to the coast]. The left side of each plot corresponds to each profile's eastern endpoint. All times are UTC.
2.1.5 GeoFlood data inputs
The GeoFlood workflow requires several data inputs to generate near-real time fluvial flood inundation maps. For a complete explanation of these inputs, see Passalacqua et al. (2010) and Zheng et al. (2018a,b). We provide a brief description below and in Table 1.
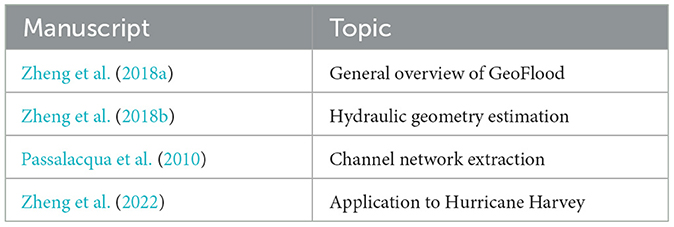
Table 1. GeoFlood manuscripts and their subject material.
2.1.6 National Hydrography Dataset (NHD)
The freely accessible National Hydrography Dataset Plus Version 2 (NHDPlusV2) is maintained by the U.S. Environmental Protection Agency (McKay et al., 2012). It contains spatial representations of river thalwegs and various waterbodies and their respective catchments. We obtained the river flowline dataset used in this study from the NHDPlusV2 Medium Resolution (MR) data product and the catchments from the NHDPlusV2's Watershed Boundary Dataset (WBD) data product.
2.1.7 National Water Model (NWM) forecasts
The National Water Model (NWM) simulates streamflows for NHDPlusV2 MR stream reaches across the continental United States (Cosgrove et al., 2016). In this study, we used the NWM's hourly analysis and assimilation outputs to compute compound fluvial-coastal inundation. Analysis and assimilation files are a real-time snapshot of the flow rates of all medium resolution stream reaches across the continental United States, and they are generated from a combination of real-time gage readings, interpolation, and empirically calibrated relationships.
2.2 Methods
We develop a workflow to compute compound fluvial-coastal flood inundation maps (Figure 7). First, we obtain a DEM corresponding to the study area and an ocean surface elevation gage reading. The DEM and gage reading must have the same vertical datum (here, we use NAVD 88). Then, we apply the c-HAND algorithm as explained below to calculate coastal inundation. In parallel, we use GeoFlood to calculate a fluvial flood inundation map. Finally, we combine coastal and fluvial inundation maps to form a compound inundation map. We describe below each step of the workflow.
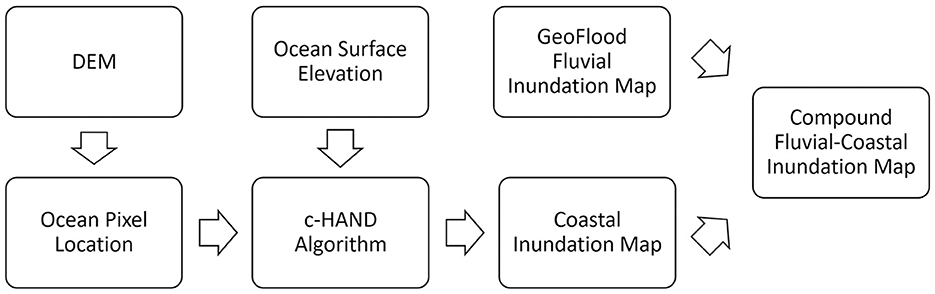
Figure 7. Overview of c-HAND's workflow.
2.2.1 DEM Processing
We mosaic the downloaded DEM tiles together and project them to UTM Zone 15N coordinates (EPSG:26915). We use ArcGIS Pro's convex hull method (Weisstein, 2018), to trace the ADCIRC mesh's boundary. We crop the DEM such that it is bounded by the inland ADCIRC mesh boundary and the coast. We obtain the coastline from the GSHHG World Vector Shorelines database (NCEI, 2018).
2.2.2 GeoFlood workflow
GeoFlood is a suite of terrain analysis tools released as open source software (Zheng et al., 2018a), which is capable of computing fluvial flood inundation in near-real time. We provide a general overview of the GeoFlood workflow below. Table 1 provides references for further reading.
GeoFlood requires a high-resolution DEM, WBD catchments, NHDPlusV2 MR flowlines, and NWM hourly flowrates for each flowline as inputs. After a series of terrain operations, it converts the flowrates to stream stage heights at segments along each stream with Manning's Equation and hydraulic geometry estimations (Zheng et al., 2018b). Finally, GeoFlood converts the stage height at each stream segment to a flood inundation map using the HAND method.
2.2.3 c-HAND
We extend GeoFlood's fluvial flood forecasting workflow to include coastal inundation mapping by modifying the HAND method for coastal environments. HAND at the coast is very similar to a fluvial inundation scenario. The ocean and the coast are analogous to a large river channel and a bank along that channel, respectively. We neglect the other bank across from the coast, which is analogous to another continent or island. The ocean water surface elevation is extended horizontally from the ocean surface to the landscape topography, taking an approximate but computationally efficient approach that can be referred to as “bathtub,” “equilibrium,” or “static” (Gallien et al., 2011; Rucker et al., 2021). We apply a static equilibrium assumption to the water surface, assuming that the water surface is absolutely motionless and horizontal, similar to the water surface of a still bathtub (Figure 8).
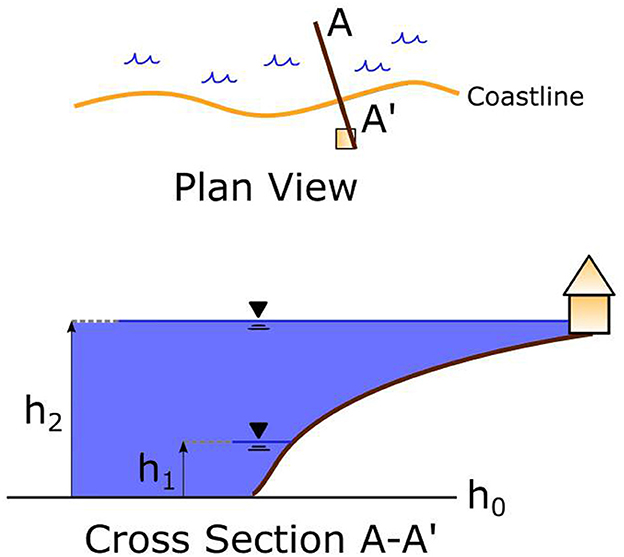
Figure 8. Modification of Figure 1 to illustrate c-HAND. Flooding is due to coastal inundation in this figure.
We refer to ocean connectivity as the condition of a grid cell (pixel) having surface water that is hydrologically connected to the ocean. That is, a parcel of water at any location satisfying this condition can flow directly to the ocean without any physical obstructions. For example, Galveston Bay always satisfies the ocean connectivity requirement because water in Galveston Bay is directly connected to the ocean. Similarly, rivers that feed into the ocean or bays connected to the ocean have ocean connectivity. Dry land and inland lakes that do not drain to the ocean do not satisfy the ocean connectivity condition.
First, we manually choose a grid cell located in the ocean. Then, we use that cell to determine ocean connectivity, while several disconnected regions of inundation satisfy the elevation requirement of coastal flooding, only one of those regions is physically connected to the ocean. That region contains the manually chosen ocean pixel. We discard all regions at lower elevation except the one containing the ocean pixel.
Based on this approach, we consider grid cells to be inundated when their DEM surface elevation is lower than the gage elevation and they are connected to the ocean. For the remainder of this study, we dub this combination of satisfying both elevation and ocean connectivity constraints the c-HAND method. c-HAND is illustrated as a simple algorithm in pseudocode below (Algorithm 1).
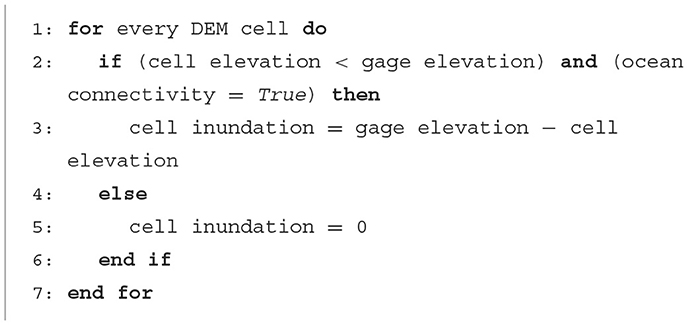
Algorithm 1. c-HAND method.
Topography-based coastal inundation mapping methods have been applied to inform land-use management policy (Brown, 2006), assess damages due to climate change (Lichter and Felsenstein, 2012), and downscale coarse hydrodynamic outputs (Rucker et al., 2021), but to the authors' knowledge, this is the first time a topography-based approach has been applied to high-fidelity near real-time coastal flood inundation mapping.
We apply c-HAND (Section 2.2.3) to a demonstration DEM (Figure 9). The bottom elevations of the channel, estuary, and isolated depression are all below 0 m. When the ocean surface elevation is exactly 0 m, it extends to the edge of the coastline, through the channel, and into the estuary but not to the isolated depression. An ocean surface elevation of 5 m leads to inundation farther up the coast, but the isolated depression is not inundated, despite its bottom elevation being lower than the ocean, because that depression is not connected to the ocean when 5 m of coastal inundation is applied. After we apply 6 m of coastal inundation, the ocean connectivity requirement is satisfied for the depression. Due to the static equilibrium assumption made by the model, the depression immediately has a water surface elevation corresponding to the ocean surface elevation (Figure 10).
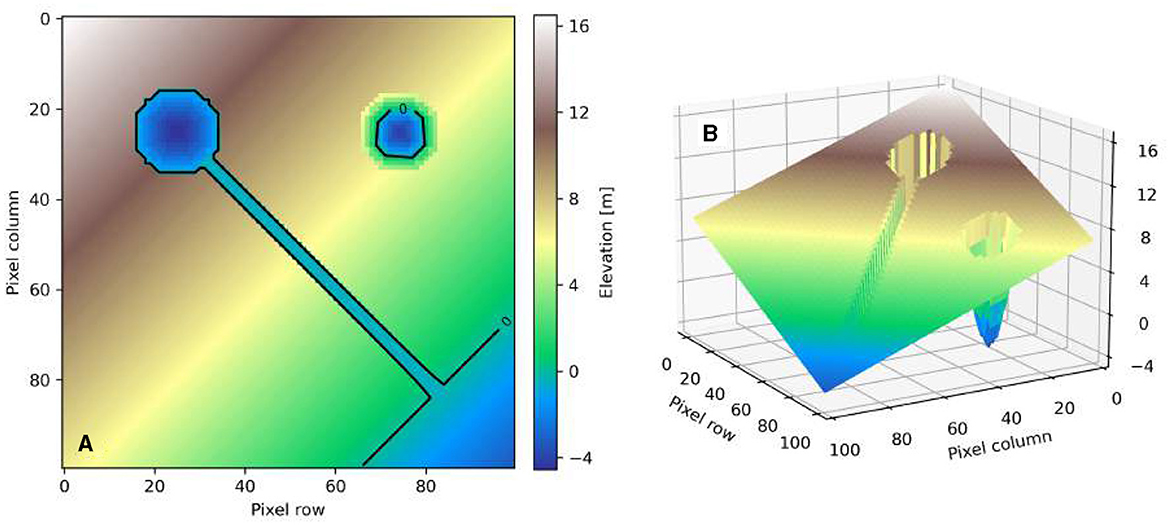
Figure 9. 2D (A) and 3D (B) views of the demonstration DEM. The 0-meter contour line is shown in black.
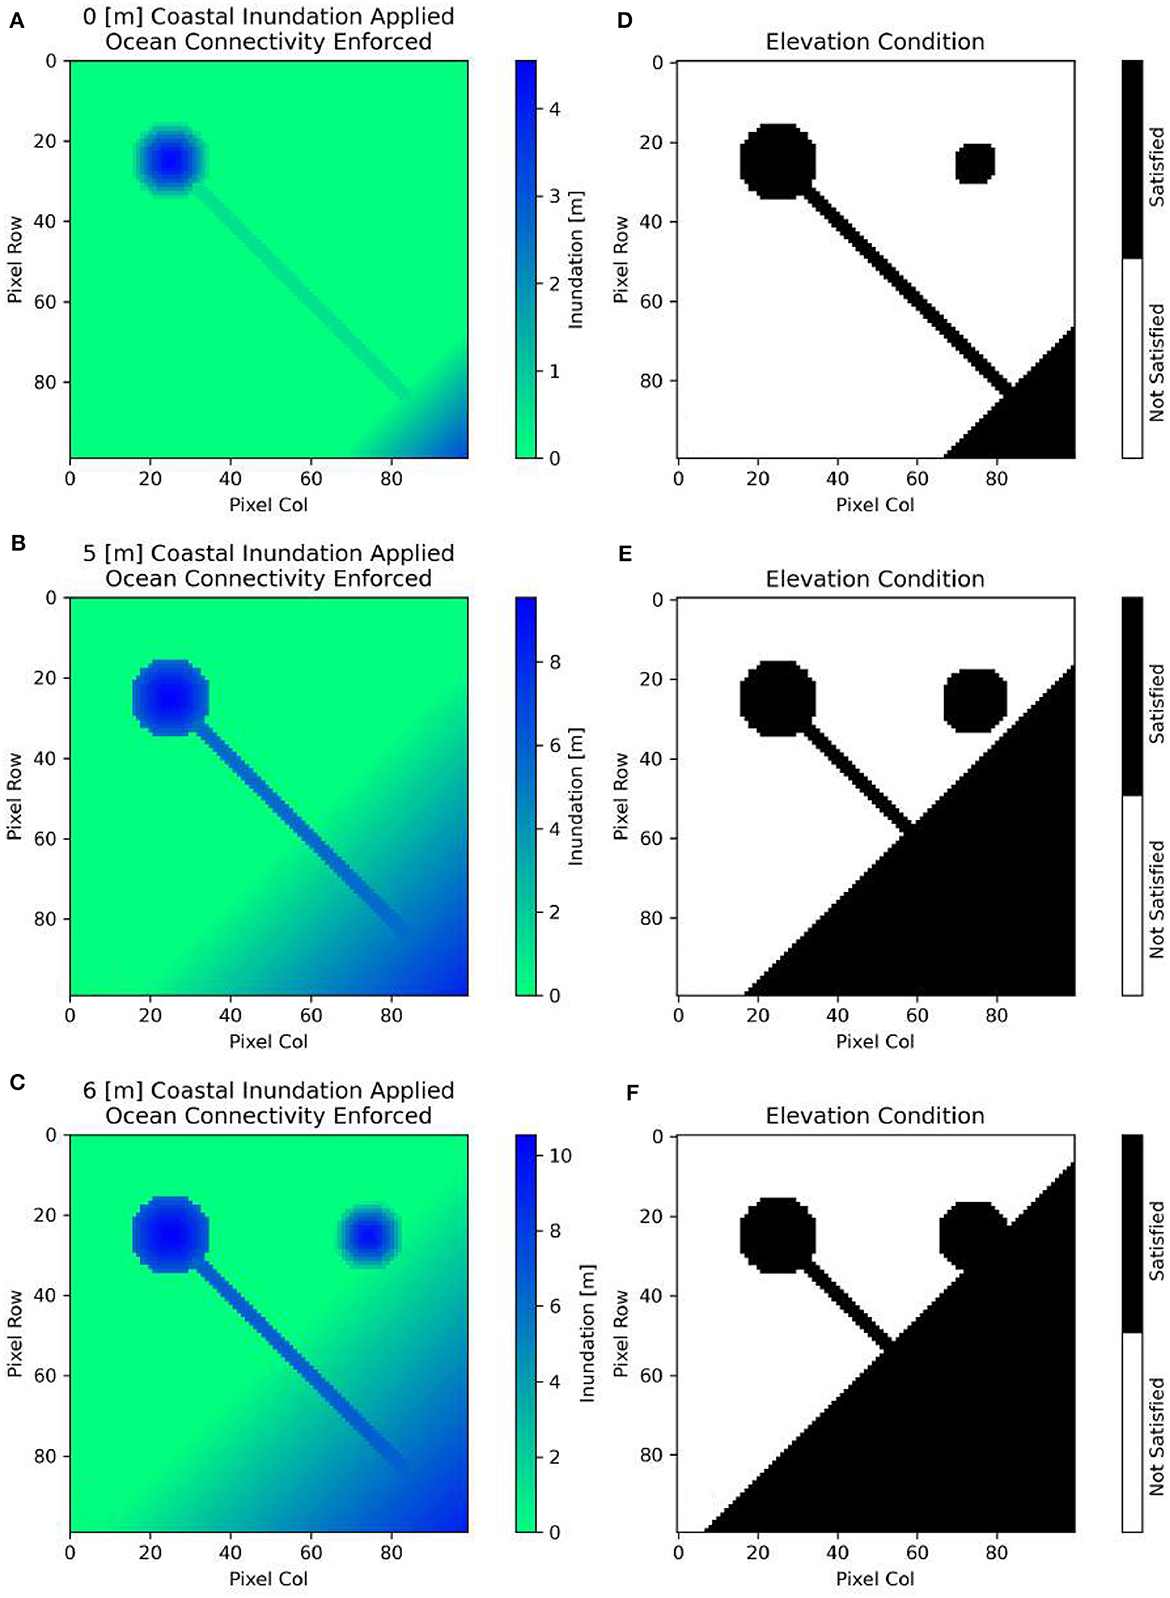
Figure 10. Coastal inundation on the demonstration DEM. Left subplots (A–C) depict inundation depth given a forcing. Right subplots (D–F) are binary masks showing all DEM locations satisfying the elevation condition without checking connectivity.
2.2.4 Compound fluvial-coastal flooding
We develop a simplified model of compound fluvial-coastal flooding by combining fluvial and coastal inundation via a maximum operation. We compute coastal and fluvial inundation separately on the same DEM, then superimpose the coastal inundation raster on the fluvial inundation raster. If fluvial (hFluvial) and coastal (hCoastal) flooding both occur at the same grid cell, we compute the depth of compound flooding (hCompound) as the maximum value (Equation 1), resulting in a compound fluvial-coastal flood inundation map:
2.2.5 Validation metrics
To assess the performance of c-HAND relative to ADCIRC, we measure the model's ability to classify the presence or absence of flood inundation. We use a confusion matrix (Figure 11), which is commonly used in the field of machine learning to characterize a model's classification performance (Provost, 1998). With this approach, we frame flood inundation as a binary variable in an image classification problem. We consider ADCIRC model results to be true (actual) and c-HAND results to be predicted.
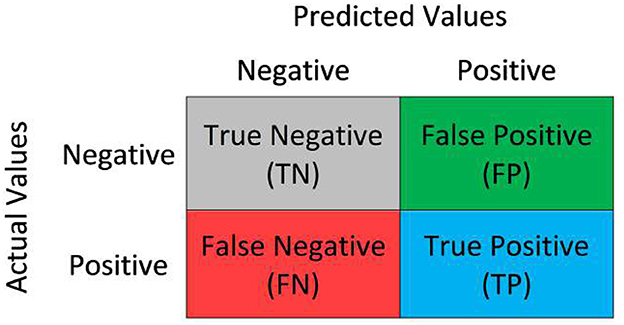
Figure 11. Confusion matrix key for Figure 12. ADCIRC inundation is “actual” and c-HAND inundation is “predicted”.
Several metrics are available for assessing a model's ability to classify a binary variable (Landis and Koch, 1977; Levine, 2000). These standard metrics have been applied to assess flood models' skill, according to Li et al. (2022). We include four such metrics: the Critical Success Index measures a model's ability to correctly inundate cells while considering predictive errors (Equation 2), the Proportion Correct is the proportion of all DEM cells that are correctly classified (Equation 3), the Bias Ratio is the proportion of c-HAND inundated pixels to ADCIRC inundated pixels (Equation 4), and the Hit Rate measures c-HAND's ability to predict inundation when ADCIRC predicts inundation (Equation 5).
where TP is true positive, TN is true negative, FP is false positive, and FN is false negative. We do not further test GeoFlood since it has been done in previous publications (Zheng et al., 2018a, 2022).
3 Results
3.1 Coastal and compound fluvial-coastal maps
We use ADCIRC and c-HAND to compute Hurricane Ike's maximum coastal inundation extent in Houston (Figure 12) and maximum inundation depth distribution (Figure 13). c-HAND has a mean inundation elevation of 2.39 m while ADCIRC has a mean inundation elevation of 2.52 m. ADCIRC generates a broader distribution of maximum depth values than c-HAND. We then use c-HAND and GeoFlood to compute Hurricane Ike's maximum compound fluvial-coastal inundation in Southeast Texas (Figure 14).
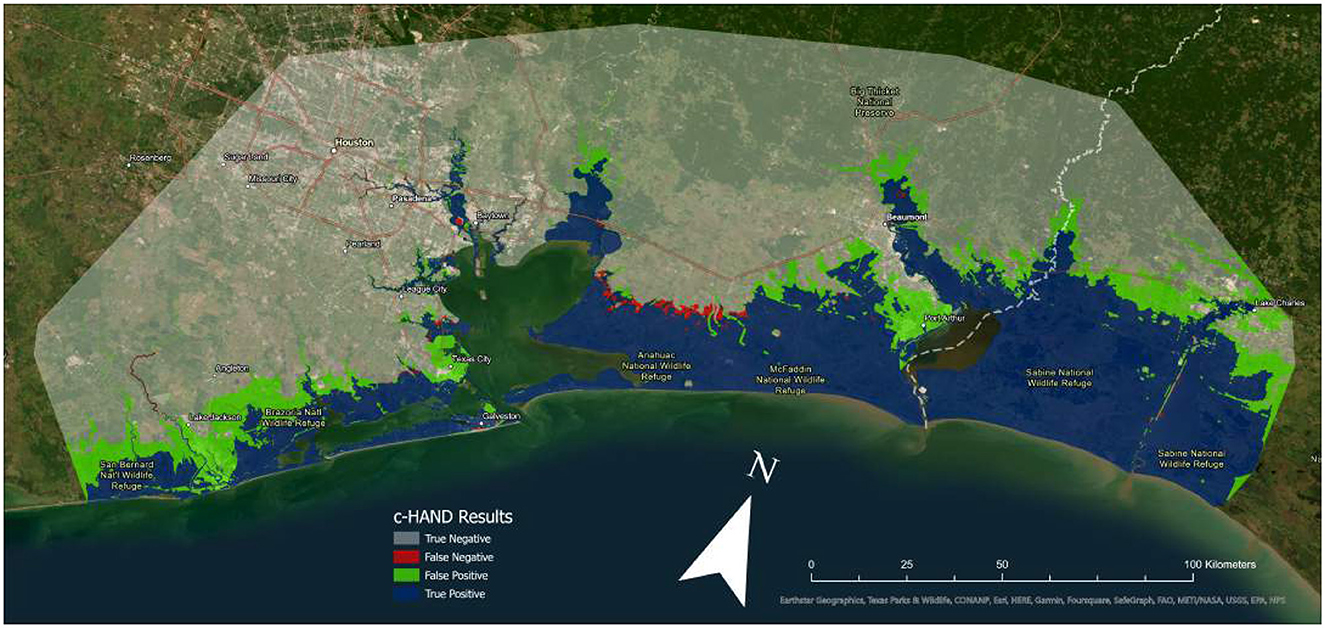
Figure 12. Coastal inundation caused by Hurricane Ike on the DEM. See Figure 11 for the confusion matrix that describes these results.
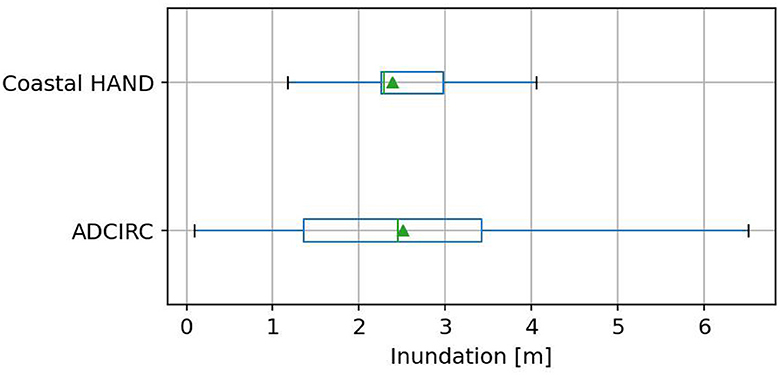
Figure 13. Maximum inundation depth distributions of both models. The triangle denotes the mean value.
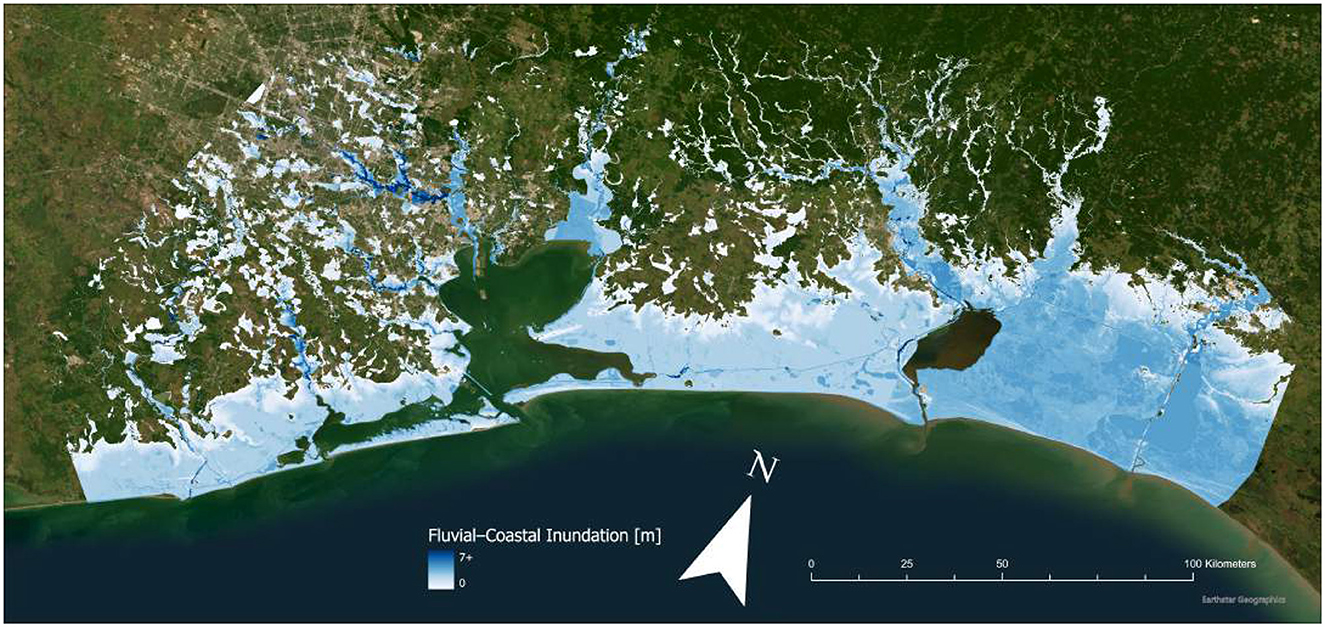
Figure 14. Compound fluvial-coastal inundation due to Hurricane Ike.
3.2 Validation
We classify the inundation condition of grid cells (Figure 12), according to a confusion matrix (Figure 11). The Critical Success Index is approximately 77%, the Proportion Correct is approximately 92%, the Bias Ratio is approximately 1.27, and the Hit Rate is approximately 99% (Table 2). We also report the total pixel counts underlying these calculations (Table 3).

Table 2. Pixel counts for each performance classification.
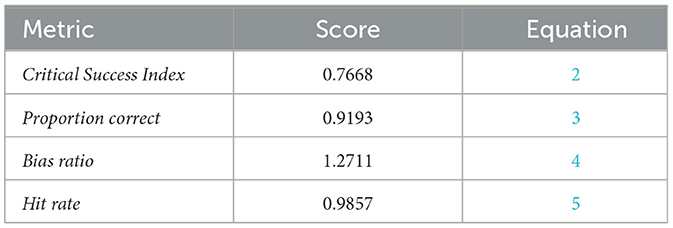
Table 3. Model assessment metric results.
4 Discussion
The research questions stated in the introduction are addressed below.
4.1 Can a simplified conceptual model map coastal inundation efficiently and accurately?
In Section 2.2.3, we develop an algorithm for approximating coastal inundation with a single gage elevation (we provide the code repository in the data availability section). This calculation takes us under 20 s to complete on a 600 million cell (2.2 GB uncompressed) DEM with an office workstation (RAM: 64 GB, CPU: i7 10700). c-HAND computes inundation approximately 60 times faster than an ADCIRC simulation running on a state-of-the-art supercomputer (Dubrow, 2020).
c-HAND relies on terrain analysis operations to map flood inundation, making it dependent on the quality of input topography data. Urban features and drainage infrastructure are only considered in c-HAND's output inundation map if the input DEM's resolution is fine enough to resolve those features, or if they are manually burned into the DEM. The DEM we use in this study is bare-earth, so it does not include structures. c-HAND's accuracy is also dependent on the vertical accuracy of the input DEM.
4.2 Do these model results agree with an ADCIRC simulation's results?
The two models have a reasonable visual agreement (Figure 12). The Critical Success Index is 0.7668, meaning that when neglecting True Negative cells, c-HAND correctly inundates 77% of the domain's remaining cells. The Proportion Correct score is 0.9193, indicating that c-HAND correctly identifies the presence or absence of coastal inundation 92% of the time. Furthermore, the Hit Rate of 0.9857 shows that c-HAND correctly identifies nearly 99% of the DEM cells inundated by the ADCIRC model. However, c-HAND also overpredicts inundation by approximately 27%, as reflected in the Bias Ratio. This result is visually confirmed by observing that the green FP area is larger than the red FN area, as shown in Figure 12. Previous studies have also shown that static methods tend to overpredict flood inundation (Ramirez et al., 2016; Didier et al., 2019; Rucker et al., 2021; Li et al., 2022).
To eliminate bias that might favor c-HAND, we mask out inundation beyond the coast and some inland estuarine features before calculating performance metrics on flood inundation extent. We do this because both c-HAND and ADCIRC are guaranteed to inundate water-covered bays in a coastal flooding scenario. The distributions of maximum inundation depths predicted by both models show that c-HAND calculates a mean maximum inundation elevation of 2.39 m while ADCIRC calculates a mean maximum inundation elevation of 2.52 m (Figure 13). Although these mean maximum inundation values are close, ADCIRC has a wider distribution. This difference may be due to the fact that c-HAND makes an approximate static equilibrium assumption, while ADCIRC captures the spatial dynamics of coastal inundation including waves and other disturbances.
4.3 Can coastal inundation calculated by c-HAND be combined with GeoFlood to obtain inundation from a compound flooding event?
We developed a compound maximum fluvial-coastal inundation map for Hurricane Ike. Ike was the second most expensive hurricane in the United States when it occurred (Blake et al., 2010). We chose Ike to demonstrate c-HAND because it was a recent major coastal flooding event in our study area (Hope et al., 2013). We calculated Hurricane Ike's maximum coastal inundation with c-HAND and maximum fluvial inundation with GeoFlood (Figure 14). We combined coastal and fluvial flooding with the maximum depth of inundation approach described in Section 2.2.3. c-HAND's coastal inundation calculation and combination with fluvial inundation costs less than a minute in total to compute. c-HAND and GeoFlood can be combined to generate coastal compound flood maps which can be updated when new data are released (the selected tide gage updates every 6 min and the NWM releases streamflow forecasts every hour).
4.4 Conclusion
We proposed a new method and workflow for rapid mapping of compound fluvial-coastal flood inundation that can be run in near real-time. By leveraging publicly available real-time sensor data, high-resolution DEMs, and topographic methods such as c-HAND and GeoFlood, we can rapidly predict coastal compound flooding. Because c-HAND can map flooding on high-resolution DEMs on the order of minutes, it is appropriate for near real-time coastal flood mapping. We are able to map coastal inundation approximately 60 times faster than an ADCIRC simulation running on a state-of-the-art supercomputer (Dubrow, 2020) by using a simplified conceptual method with terrain analysis operations on high-resolution terrain.
Although c-HAND cannot capture the dynamics of a coastal flooding event in the way a hydrodynamic model like ADCIRC can, it can provide first responders with crucial and timely coastal compound flooding information. Emergency responders can use near real-time flood extent and depth information to inform decisions while responding to coastal flooding events. For the purpose of emergency response, a model capable of providing quick and approximate results is preferable to a slow and more accurate model.
By assuming that the larger magnitude flood driver dominates at any given location on our model domain, we efficiently combine fluvial and coastal flood inundation to create a compound flooding map. This superposition method can be extended to create a compound hazard map for any combination of flood drivers, for example, fluvial-coastal-pluvial flooding. Pluvial flooding is a major driver of catastrophic compound flood events; Hurricane Harvey is a recent example (Sebastian et al., 2021). Preisser et al. (2022) computed fluvial-pluvial inundation by combining GeoFlood and Fill-Spill-Merge, an algorithm for routing flows through terrain depressions (Barnes et al., 2021). Using a method similar to the combination carried out in Equation 1, a fluvial-coastal inundation map could quickly be combined with a pluvial inundation map.
To control the overprediction of inundation extent that is inherent to static methods, more simplified conceptual physics could be added to c-HAND. For example, as an approximation of hydraulic energy losses, a rate of water surface elevation reduction that is proportional to distance from the coast could be incorporated. This type of approximation has been successfully applied in other simplified conceptual models (Enriquez et al., 2023).
c-HAND maps compound flooding almost instantaneously via simple topographic operations. Compound flooding information is invaluable when determining evacuation corridors and infrastructure impacts. c-HAND can support first responders making decisions during critical and time-constrained periods, and is also suitable for use in data-scarce regions where only surface elevation models and coastal water surface elevation gage measurements are available.
Data availability statement
The original contributions presented in the study are publicly available. The c-HAND code repository is available on GitHub: https://github.com/passaH2O/c-HAND. The Hurricane Ike ADCIRC simulation is available on Box: https://utexas.box.com/v/dawson-adcirc-ike.
Author contributions
MW: Writing—original draft, Writing—review & editing. PP: Writing—review & editing. SC: Writing—review & editing. CD: Writing—review & editing.
Funding
The author(s) declare financial support was received for the research, authorship, and/or publication of this article. Financial support for this work was provided by the NSF Graduate Research Fellowship Program (DGE-2137420), the NOAA Adaptation Sciences Program (NOAA-OAR-CPO-2021-2006389), the Cockrell School of Engineering, and Planet Texas 2050, a research grand challenge at the University of Texas at Austin. This material is based upon work supported by the U.S. Department of Energy, Office of Science, Biological and Environmental Research Program under Award Number DE-SC0023216.
Acknowledgments
The authors thank Dr. David Maidment of the Center for Water and the Environment at UT Austin for his feedback and suggestions when this study was presented as MW's M.S. Thesis.
Conflict of interest
The authors declare that the research was conducted in the absence of any commercial or financial relationships that could be construed as a potential conflict of interest.
Publisher's note
All claims expressed in this article are solely those of the authors and do not necessarily represent those of their affiliated organizations, or those of the publisher, the editors and the reviewers. Any product that may be evaluated in this article, or claim that may be made by its manufacturer, is not guaranteed or endorsed by the publisher.
Supplementary material
The Supplementary Material for this article can be found online at: https://www.frontiersin.org/articles/10.3389/frwa.2024.1329109/full#supplementary-material
References
Annis, A., Karpack, M., Morrison, R. R., and Nardi, F. (2022). On the influence of river Basin morphology and climate on hydrogeomorphic floodplain delineations. Adv. Water Resour. 159:104078. doi: 10.1016/j.advwatres.2021.104078
Barnes, R., Callaghan, K. L., and Wickert, A. D. (2021). Computing water flow through complex landscapes - part 3: fill-spill-merge: flow routing in depression hierarchies. Earth Surf. Dynam. 9, 105–121. doi: 10.5194/esurf-9-105-2021
Bhuiyan, M., Naser, J. A., and Dutta, D. (2012). Analysis of flood vulnerability and assessment of the impacts in coastal zones of Bangladesh due to potential sea-level rise. Nat. Hazards 61, 729–743. doi: 10.1007/s11069-011-0059-3
Blake, E., Gibney, E., and Landsea, C. (2010). “The Deadliest, Costliest, and Most Intense United States Tropical Cyclones from 1851 to (and Other Frequently Requested Hurricane Facts),” in NOAA/National Weather Service, National Centers for Environmental Prediction (Washington, DC: National Hurricane Center).
Brown, I. (2006). Modelling future landscape change on coastal floodplains using a rule-based GIS. Environm. Model. Softw. 21, 1479–1490. doi: 10.1016/j.envsoft.2005.07.011
Brunner, G. W. (2002). HEC-RAS (River Analysis System). In North American Water and Environment Congress & Destructive Water (Washington, DC: ASCE), 3782–3787.
Cosgrove, B., Gochis, D., Clark, E. P., Cui, Z., Dugger, A. L., Feng, X., et al. (2016). “An overview of the National Weather Service National Water Model,” in AGU Fall Meeting Abstracts (San Francisco, CA: American Geophysical Union).
Didier, D., Baudry, J., Bernatchez, P., Dumont, D., Sadegh, M., Bismuth, E., et al. (2019). Multihazard simulation for coastal flood mapping: Bathtub versus numerical modelling in an open estuary, Eastern Canada. J. Flood Risk Manage. 12, 505. doi: 10.1111/jfr3.12505
Dubrow, A. (2020). “Frontera on the front lines during record hurricane season,” in Planet Texas 2050-News Stories. (Austin, TX: Texas Advanced Computing Center). Available online at: https://repositories.lib.utexas.edu/items/129b2481-8a61-4751-b313-a3b79f00cd5c/full
Dykstra, S. L., and Dzwonkowski, B. (2021). The role of intensifying precipitation on coastal river flooding and compound river storm surge events, Northeast Gulf of Mexico. Water Resour. Res. 57, 2020WR029363. doi: 10.1029/2020WR029363
Enriquez, A. R., Wahl, T., Talke, S. A., Orton, P. M., Booth, J. F., Agulles, M., et al. (2023). MatFlood: an efficient algorithm for mapping flood extent and depth. Environmental Modelling & Softw. 169, 105829. doi: 10.1016/j.envsoft.2023.105829
French, J., and Clifford, N. (2000). Hydrodynamic modelling as a basis for explaining estuarine environmental dynamics: some computational and methodological issues. Hydrol. Process. 14, 2089–2108. doi: 10.1002/1099-1085(20000815/30)14:11/12<2089::AID-HYP56>3.0.CO;2-L
Gallien, T., Schubert, J., and Sanders, B. (2011). Predicting tidal flooding of urbanized embayments: a modeling framework and data requirements. Coastal Eng. 58, 567–577. doi: 10.1016/j.coastaleng.2011.01.011
Gori, A., Lin, N., Xi, D., and Emanuel, K. (2022). Tropical cyclone climatology change greatly exacerbates US extreme rainfall surge hazard. Nat. Clim. Chang. 12, 171–178. doi: 10.1038/s41558-021-01272-7
Griego, A. L., Flores, A. B., Collins, T. W., and Grineski, S. E. (2020). Social vulnerability, disaster assistance, and recovery: a population-based study of Hurricane Harvey in Greater Houston, Texas. Int. J. Disaster Risk Reduct. 51, 101766. doi: 10.1016/j.ijdrr.2020.101766
Hallegatte, S., Green, C., Nicholls, R. J., and Corfee-Morlot, J. (2013). Future flood losses in major coastal cities. Nat. Clim. Chang. 3, 802–806. doi: 10.1038/nclimate1979
Hope, M. E., Westerink, J. J., Kennedy, A. B., Kerr, P., Dietrich, J. C., Dawson, C., et al. (2013). Hindcast and validation of Hurricane Ike (2008) waves, forerunner, and storm surge. J. Geophys. Res.: Oceans 118, 4424–4460. doi: 10.1002/jgrc.20314
Horritt, M., and Bates, P. (2002). Evaluation of 1D and 2D numerical models for predicting river flood inundation. J. Hydrol. 268, 87–99. doi: 10.1016/S0022-1694(02)00121-X
Jafarzadegan, K., and Merwade, V. (2017). A DEM-based approach for large-scale floodplain mapping in ungauged watersheds. J. Hydrol. 550, 650–662. doi: 10.1016/j.jhydrol.2017.04.053
Jafarzadegan, K., Moradkhani, H., Pappenberger, F., Moftakhari, H., Bates, P., Abbaszadeh, P., et al. (2023). Recent advances and new frontiers in riverine and coastal flood modeling. Rev. Geophys. 61, e2022RG000788. doi: 10.1029/2022RG000788
Jafarzadegan, K., Mu noz, D. F., Moftakhari, H., Gutenson, J. L., Savant, G., and Moradkhani, H. (2022). Real-time coastal flood hazard assessment using DEM-based hydrogeomorphic classifiers. Nat. Hazards Earth Syst. Sci. 22, 1419–1435. doi: 10.5194/nhess-22-1419-2022
Khanam, M., Sofia, G., Koukoula, M., Lazin, R., Nikolopoulos, E. I., Shen, X., et al. (2021). Impact of compound flood event on coastal critical infrastructures considering current and future climate. Nat. Hazards Earth Syst. Sci. 21, 587–605. doi: 10.5194/nhess-21-587-2021
Knowles, N. (2010). Potential inundation due to rising sea levels in the San Francisco Bay region. San Francisco Estuary Watershed Sci. 8, 1. doi: 10.15447/sfews.2010v8iss1art1
Kossin, J. P., Knapp, K. R., Olander, T. L., and Velden, C. S. (2020). Global increase in major tropical cyclone exceedance probability over the past four decades. Proc. Nat. Acad. Sci. 117, 11975–11980. doi: 10.1073/pnas.1920849117
Landis, J. R., and Koch, G. G. (1977). The measurement of observer agreement for categorical data. Biometrics 33, 159–174. doi: 10.2307/2529310
Levine, R. A. (2000). Statistical methods in the atmospheric sciences review. J. Am. Stat. Assoc. 95, 344–345. doi: 10.2307/2669579
Li, Z., Mount, J., and Demir, I. (2022). Accounting for uncertainty in real-time flood inundation mapping using hand model: Iowa case study. Nat. Hazards. 112, 977–1004. doi: 10.1007/s11069-022-05215-z
Lichter, M., and Felsenstein, D. (2012). Assessing the costs of sea-level rise and extreme flooding at the local level: A GIS-based approach. Ocean & Coastal Manage. 59, 47–62. doi: 10.1016/j.ocecoaman.2011.12.020
Liu, Y. Y., Maidment, D. R., Tarboton, D. G., Zheng, X., and Wang, S. (2018). A CyberGIS integration and computation framework for high-resolution continental-scale flood inundation mapping. JAWRA 54, 770–784. doi: 10.1111/1752-1688.12660
Manfreda, S., Di Leo, M., and Sole, A. (2011). Detection of flood-prone areas using digital elevation models. J. Hydro. Eng. 16, 781–790. doi: 10.1061/(ASCE)HE.1943-5584.0000367
McGrath, H., Bourgon, J.-F., Proulx-Bourque, J.-S., Nastev, M., and Abo El Ezz, A. (2018). A comparison of simplified conceptual models for rapid web-based flood inundation mapping. Nat. Hazards 93, 905–920. doi: 10.1007/s11069-018-3331-y
McKay, L., Bondelid, T., Dewald, T., Johnston, J., Moore, R., and Rea, A. (2012). NHDPlus Version 2: User Guide Washington, DC: U.S. Environmental Protection Agency.
Miura, Y., Mandli, K. T., and Deodatis, G. (2021). High-speed GIS-based simulation of storm surge-induced flooding accounting for sea level rise. Nat. Hazards Rev. 22, 04021018. doi: 10.1061/(ASCE)NH.1527-6996.0000465
Moftakhari, H. R., Salvadori, G., AghaKouchak, A., Sanders, B. F., and Matthew, R. A. (2017). Compounding effects of sea level rise and fluvial flooding. Proc. Nat. Acad. Sci. 114, 9785. doi: 10.1073/pnas.1620325114
Mungkasi, S., and Roberts, S. (2013). Validation of ANUGA hydraulic model using exact solutions to shallow water wave problems. J. Phys. 423, 012029. doi: 10.1088/1742-6596/423/1/012029
Nardi, F., Annis, A., Di Baldassarre, G., Vivoni, E. R., and Grimaldi, S. (2019). GFPLAIN250m, a global high-resolution dataset of Earth's floodplains. Scientific Data. 6, 180309. doi: 10.1038/sdata.2018.309
Nardi, F., Vivoni, E. R., and Grimaldi, S. (2006). Investigating a floodplain scaling relation using a hydrogeomorphic delineation method. Water Resour. Res. 42, 9. doi: 10.1029/2005WR004155
NCEI (2018). Shoreline/Coastline Databases. Available online at: https://www.ngdc.noaa.gov/mgg/shorelines/ (accessed September 2023).
NOAA (2022). U.S. Billion-Dollar Weather and Climate Disasters. Asheville: NOAA National Centers for Environmental Information (NCEI).
Orton, P., Conticello, F., Cioffi, F., Hall, T., Georgas, N., Lall, U., et al. (2020). Flood hazard assessment from storm tides, rain and sea level rise for a tidal river estuary. Nat. Hazards 102, 729–757. doi: 10.1007/s11069-018-3251-x
Passalacqua, P., Do Trung, T., Foufoula-Georgiou, E., Sapiro, G., and Dietrich, W. E. (2010). A geometric framework for channel network extraction from lidar: Nonlinear diffusion and geodesic paths. J. Geophys. Res. 115, F1. doi: 10.1029/2009JF001254
Preisser, M., Passalacqua, P., Bixler, R. P., and Hofmann, J. (2022). Intersecting near-real time fluvial and pluvial inundation estimates with sociodemographic vulnerability to quantify a household flood impact index. EGUsphere 2022:1–37. doi: 10.1002/essoar.10507281.2
Provost, F. (1998). Glossary of terms special issue on applications of machine learning and the knowledge discovery process. Mach. Learn. 30, 271–274. doi: 10.1023/A:1017181826899
Ramirez, J. A., Lichter, M., Coulthard, T. J., and Skinner, C. (2016). Hyper-resolution mapping of regional storm surge and tide flooding: comparison of static and dynamic models. Nat. Hazards 82, 571–590. doi: 10.1007/s11069-016-2198-z
Rennó, C. D., Nobre, A. D., Cuartas, L. A., Soares, J. V., Hodnett, M. G., Tomasella, J., et al. (2008). HAND, a new terrain descriptor using SRTM-DEM: mapping terra-firme rainforest environments in Amazonia. Remote Sens. Environ. 112, 3469–3481. doi: 10.1016/j.rse.2008.03.018
Rucker, C. A., Tull, N., Dietrich, J. C., Langan, T. E., Mitasova, H., Blanton, B. O., et al. (2021). Downscaling of real-time coastal flooding predictions for decision support. Nat.Hazards 107, 1341–1369. doi: 10.1007/s11069-021-04634-8
Samela, C., Albano, R., Sole, A., and Manfreda, S. (2018). A GIS tool for cost-effective delineation of flood-prone areas. Comput. Environ. Urban Syst. 70:43–52. doi: 10.1016/j.compenvurbsys.2018.01.013
Samela, C., Troy, T. J., and Manfreda, S. (2017). Geomorphic classifiers for flood-prone areas delineation for data-scarce environments. Adv. Water Resour. 102:13–28. doi: 10.1016/j.advwatres.2017.01.007
Santiago-Collazo, F. L., Bilskie, M. V., and Hagen, S. C. (2019). A comprehensive review of compound inundation models in low-gradient coastal watersheds. Environm. Model. Softw. 119, 166–181. doi: 10.1016/j.envsoft.2019.06.002
Sebastian, A., Bader, D. J., Nederhoff, C. M., Leijnse, T. W., Bricker, J. D., and Aarninkhof, S. G. (2021). Hindcast of pluvial, fluvial, and coastal flood damage in Houston, Texas during Hurricane Harvey (2017) using SFINCS. Nat, Hazards 109, 2343–2362. doi: 10.1007/s11069-021-04922-3
Tellman, B., Sullivan, J., Kuhn, C., Kettner, A., Doyle, C., Brakenridge, G., et al. (2021). Satellite imaging reveals increased proportion of population exposed to floods. Nature 596, 80–86. doi: 10.1038/s41586-021-03695-w
Teng, J., Jakeman, A. J., Vaze, J., Croke, B. F., Dutta, D., and Kim, S. (2017). Flood inundation modelling: a review of methods, recent advances and uncertainty analysis. Environm. Model. Softw. 90, 201–216. doi: 10.1016/j.envsoft.2017.01.006
US Geological Survey (2018). “3D elevation program digital elevation models,” in The National Map v2 (Reston, VA: U.S. Geological Survey).
Watson, K. M., Harwell, G. R., Wallace, D. S., Welborn, T. L., Stengel, V. G., McDowell, J. S., et al. (2018). Characterization of peak streamflows and flood inundation of selected areas in southeastern Texas and southwestern Louisiana from the August and September 2017 flood resulting from Hurricane Harvey. Sci. Investigati. Report. 56, 5070. doi: 10.3133/sir20185070
Weisstein, E. W. (2018). “Convex hull,” in MathWorld-A Wolfram Web Resource (Champaign, IL: Wolfram Research, Inc.).
Westerink, J. J., Luettich, R. A., Baptists, A., Scheffner, N. W., and Farrar, P. (1992). Tide and storm surge predictions using finite element model. J. Hydraul. Eng. 118, 1373–1390. doi: 10.1061/(ASCE)0733-9429(1992)118:10(1373)
Williams, B. D., and Webb, G. R. (2021). Social vulnerability and disaster: understanding the perspectives of practitioners. Disasters 45, 278–295. doi: 10.1111/disa.12422
Zheng, X., D'Angelo, C., Maidment, D. R., and Passalacqua, P. (2022). Application of a large-scale terrain-analysis-based flood mapping system to hurricane harvey. JAWRA. 58, 149–163. doi: 10.1111/1752-1688.12987
Zheng, X., Maidment, D. R., Tarboton, D. G., Liu, Y. Y., and Passalacqua, P. (2018a). GeoFlood: Large-scale flood inundation mapping based on high-resolution terrain analysis. Water Resour. Res. 54, 10, 013–10,033. doi: 10.1029/2018WR023457
Zheng, X., Tarboton, D. G., Maidment, D. R., Liu, Y. Y., and Passalacqua, P. (2018b). River channel geometry and rating curve estimation using height above the nearest drainage. JAWRA. 54, 785–806. doi: 10.1111/1752-1688.12661
Keywords: coastal compound flooding, Height Above Nearest Drainage (HAND), real-time inundation mapping, GeoFlood, Geographic Information Systems (GIS)
Citation: Wang M, Passalacqua P, Cai S and Dawson C (2024) c-HAND: near real-time coastal flood mapping. Front. Water 6:1329109. doi: 10.3389/frwa.2024.1329109
Received: 28 October 2023; Accepted: 28 February 2024;
Published: 22 March 2024.
Edited by:
Sujan Pal, Argonne National Laboratory (DOE), United StatesReviewed by:
Antonio Annis, University for Foreigners Perugia, ItalyFernando Nardi, University for Foreigners Perugia, Italy
Copyright © 2024 Wang, Passalacqua, Cai and Dawson. This is an open-access article distributed under the terms of the Creative Commons Attribution License (CC BY). The use, distribution or reproduction in other forums is permitted, provided the original author(s) and the copyright owner(s) are credited and that the original publication in this journal is cited, in accordance with accepted academic practice. No use, distribution or reproduction is permitted which does not comply with these terms.
*Correspondence: Paola Passalacqua, paola@austin.utexas.edu