 Seongmin Choi1
 Wonjun Lee2Hanwoong Kim1Gwangtaek Lee3
 Changsoo Lee1,4Dae-Yeol Cheong5Won-Keun Son6
 Kwiyong Kim1,4*
- 1Department of Civil, Urban, Earth, and Environmental Engineering, Ulsan National Institute of Science and Technology (UNIST), Ulsan, Republic of Korea
- 2Department of Environmental Engineering, College of Ocean Sciences, Jeju National University, Jeju City, Republic of Korea
- 3Department of Sustainable Environment Research, Korea Institute of Machinery and Materials (KIMM), Daejeon, Republic of Korea
- 4Graduate School of Carbon Neutrality, Ulsan National Institute of Science and Technology (UNIST), Ulsan, Republic of Korea
- 5Research Institute, BioX Inc., Seoul, Republic of Korea
- 6Innochemtech Inc., Daejeon, Republic of Korea
An intensifying global alarm over excessive total ammonia nitrogen (TAN) calls for innovative recovery strategies. Although electrochemically-driven TAN concentration and recovery have been explored, limited research on upscaling lab-scale advancements with careful system engineering leaves a notable gap in practical application. Here, in the context of implementing an upscaled electrochemical system, we carefully chose a suitable cation exchange membrane to ensure the best ammonium migration, energy efficiency, and stability. Systematically examining the effects of applied current density and loading rate using Neosepta CSE, we achieved final concentrated TAN levels in the receiving catholyte, reaching 836.7 mM (4.4-fold), 778.8 mM (3.5-fold), and 980.4 mM (2.8-fold), with nitrogen flux values of 801, 817, and 955 g-N m−2 d−1 for synthetic, food, and livestock wastewater, respectively, at a current density of 25 mA cm−2 and a loading rate of 2.5 mL cm−2 h−1. Successful upscaling to an 8-cell stack, capable of treating 100 L every 20 h (recovering 207 g-N d−1) of synthetic wastewater, showcases the feasibility of upscaled electrochemical systems for TAN recovery.
1 Introduction
The element nitrogen is essential for all living organisms, but excessive reactive nitrogen, particularly in the form of total ammonia nitrogen (TAN), can produce serious environmental problems, including eutrophication, degradation of water quality, loss of biodiversity, and even climate change (Huang et al., 2016; Georg et al., 2023). TAN contamination in water is largely due to anthropogenic fertilizers applied to agricultural fields. Upon permeation of these fertilizers into the soil, they eventually reach deeper layers or the water table, where they are no longer accessible to crops, leading to a significant release of reactive TAN into the environment (McKay Fletcher et al., 2022). In conventional wastewater treatment plants, either a two-stage nitrification-denitrification process or Anammox has been employed (Kuntke et al., 2018a,b; Georg et al., 2023). While both these methods convert TAN into dinitrogen, they do so without taking advantage of the opportunity to recover it in a usable reactive form and also generate the potent greenhouse gas, N2O (Kuntke et al., 2018a). Currently, ammonia is produced using the Haber-Bosch process, which consumes 2% of the world's energy and contributes to 1–2% of carbon dioxide emissions (Kim et al., 2019, 2023; Chen et al., 2020). Given that the linear process of Haber-Bosch (10.3–12.5 kWh kg-N−1) and conventional TAN removal (6.18–13.6 kWh kg-N−1 for nitrification-denitrification and 1.5–5 kWh kg-N−1 for Anammox) are energy-intensive and do not involve resource recovery (Chen et al., 2021), extracting valuable nutrient, especially from what is considered waste, could offer a route to a circular economy.
Many research studies have recently explored physical and chemical methods for recovering TAN from waste streams, including reverse osmosis, stripping, adsorption, ion exchange, membrane distillation, and struvite precipitation (Iddya et al., 2020; Kogler et al., 2021; Jiang et al., 2022). However, there are limitations to these approaches, including high energy requirements and the use of chemical inputs. For instance, techniques such as stripping and struvite precipitation require the addition of chemicals to control the solution pH, in addition to elevated temperatures (Etter et al., 2011; Limoli et al., 2016). Membranes for reverse osmosis have limited selectivity, while ion exchange materials are often expensive, sensitive to competing ions, and require significant quantities of chemicals to regenerate, such as NaCl (Deng et al., 2014).
In recent decades, electrified TAN recovery has garnered attention due to its ability to recover TAN with minimal energy and chemical input, and in some instances, simultaneously generate energy (Kelly and He, 2014; Tarpeh et al., 2018). Within an electrochemical setup, external electrical energy is applied to initiate water electrolysis (Figure S1), which proceeds as follows:
The electric current generated by water splitting is harnessed to recover TAN from wastewater feed (anolyte) by the migration of cations through a cation exchange membrane (CEM) toward the receiving solution (or concentrate). In this migration process, ammonium () can function as a charge carrier moving toward the concentrate, with its selectivity basically determined by the feed cationic content (Lee et al., 2021). At the same time, the production of hydroxyl ions (OH−) (Eq. 1) results in an increase in the pH of the /NH3 receiving solution, leading to the accumulation of up-concentrated neutral ammonia species (NH3). The high alkalinity in the concentrated NH3 solution provides an optimal environment for subsequent effective stripping or extraction, as evidenced by prior TAN separations from the receiving solution utilizing a stripping module (Desloover et al., 2012; Luther et al., 2015; Christiaens et al., 2017) or a hydrophobic gas-permeable membrane (Hou et al., 2018; Kuntke et al., 2018a; Tarpeh et al., 2018) to an acidic trap. While recent investigations have explored the transfer of electro-concentrated NH3 to the acidic trap through methods such as optimizing the stripping stage (Losantos et al., 2021) or developing a novel gas diffusion electrode-membrane assembly to prevent severe back-diffusion of NH3 in membrane-based extraction processes (Hou et al., 2018; Zhu et al., 2023), the prior electrochemically-driven step for the concentration and migration of remains crucial for the success of the entire process (Lee et al., 2021). Despite successfully demonstrating laboratory-scale electrochemical systems for the electrochemical concentration of TAN using commercial CEMs like Ralex® CMHPP (MEGA) (Zamora et al., 2017; Kuntke et al., 2018a; Georg et al., 2023), CMI-7000 (Membranes International) (Ledezma et al., 2017; Hou et al., 2018; Tarpeh et al., 2018; Kim et al., 2024), or Nafion 117 (DuPont) (Rodríguez Arredondo et al., 2017; Lee et al., 2021) (Table 1), the challenges of electrochemical systems become more pronounced with up-scaling, particularly concerning membrane performance, stability, and cost. The careful gains achieved in laboratory-scale operations can easily be undermined by inadequate system engineering, whereas careful optimization of CEM in an upscaled electrochemical system will significantly showcase the feasibility of electrochemical systems for TAN recovery as an alternative to conventional technologies.
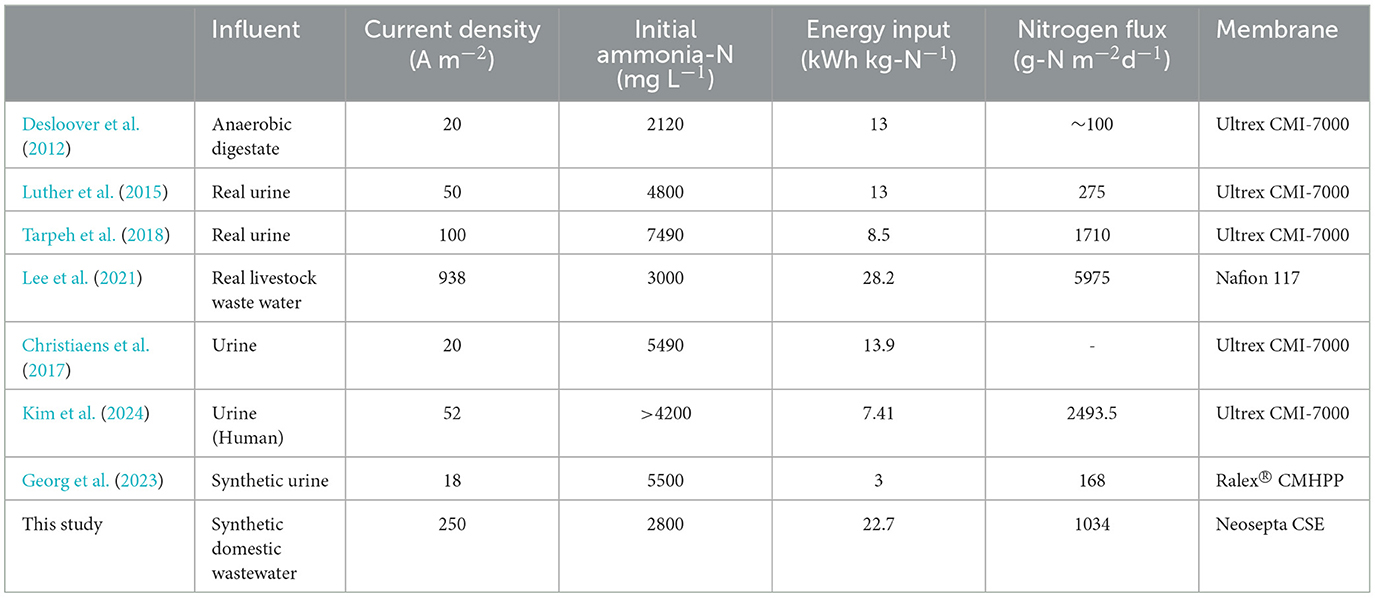
Table 1. The performance of recent studies for electrochemical TAN recovery.
The aim of this study was thus to showcase the performance of an upscaled electrochemical system (100 L per 20 h) for TAN concentration. Specifically, the study sought to accelerate and optimize the migration of , with a focus on identifying the most effective CEMs from various commercial options in terms of nitrogen flux, TAN selectivity, electrical energy consumption, and stability. Additionally, careful consideration was given to the impact of applied current density (mA cm−2) and load rate (in mL cm−2 h−1) of the feed on TAN recovery performance from synthetic wastewater. Finally, the system was applied for TAN recovery from real food and livestock wastewaters and upscaled to an 8-cell stack with 2,000 cm2 of electrode area, capable of treating up to 100 L per 20 h (recovering 207 g-N d−1) of synthetic wastewater. The results of this study bring energy-efficient TAN recovery closer to practical application.
2 Materials and methods
2.1 Experimental setup of the 40 cm2 cell
As depicted in a schematic diagram (Figure S1), a two-chambered electrochemical cell was established for TAN recovery at two different scales, with electrode areas of 40 cm2 and 0.2 m2 (2,000 cm2). In the 40 cm2 electrochemical cell, the dimensions of the anodic and cathodic compartments were 5 cm × 8 cm × 0.1 cm. Two mesh structures of dimensionally stable electrodes (measuring 5 cm × 8 cm × 0.1 cm, KOELECTRODE, South Korea) with Ir-Ru coating were employed, serving as the anode and cathode, fitting perfectly into their respective chambers. These compartments were separated by a CEM from various commercial vendors, with their characteristics summarized in Table S1. Consequently, the anode, cathode, and CEM all had the same projected area of 40 cm2 (5 cm × 8 cm). In the experiment utilizing the 40 cm2 cell, unless otherwise specified, the total working volume of the anolyte feed (synthetic or real wastewater) was 2 L, while the catholyte (receiving solution) was 0.2 L of 0.1 M Na2SO4. Both the anolyte and catholyte were circulated by a peristaltic pump (Masterflex) at a flow rate of 20 mL min−1. A power supply (SDP30–30D, SM Techno, South Korea) maintained a constant current (0.25, 0.5, 1, 2, 4 A) between the electrodes, and the resulting cell voltage was monitored using a potentiostat (Squidstat Plus, Admiral Instruments, USA). Due to the hydrogen evolution on the cathode, pressure built up within a cathode tank, sufficient to continuously push the gas over the headspace in the catholyte tank into the acid trap (50 mL of 1 M H2SO4).
2.2 Experimental setup of the 8-cell stack (2,000 cm2 cell)
As illustrated in Figure S2, an 8-cell stack was established with a total active electrode area of 0.2 m2 (2,000 cm2). The dimensions of the anodic and cathodic compartments were 10 cm × 25 cm × 0.1 cm. A total of sixteen dimensionally stable electrode meshes (measuring 5 cm × 8 cm × 0.1 cm, KOELECTRODE, South Korea) with Ir-Ru coating were utilized, functioning as the anode and cathode, fitting into their respective chambers. These compartments were separated by a CEM found to be optimal for our TAN recovery purpose (CSE, Astom, Japan). Each unit cell, consisting of an anode, cathode, and CEM, had the same projected area of 250 cm2 (10 cm × 25 cm), and a total of 8 unit cells were stacked to achieve a total area of 2,000 cm2. The total working volume of the anolyte feed (synthetic wastewater) was 100 L, while the catholyte was 10 L of 0.1 M Na2SO4. Both the anolyte and catholyte were circulated by a peristaltic pump (WT600–2J, LongerPump) at a flow rate of 0.2 L min−1 into each unit cell. A power supply with a current limit of 400 A (KSC, South Korea) maintained a constant current (12.5 A, 25 A, 50 A) between the electrodes, and the resulting cell voltage was monitored using a potentiostat (Squidstat Plus, Admiral Instruments, USA). Like the 40 cm2 cell operations, the hydrogen evolution reaction on the cathode resulted in a buildup of pressure in the cathode tank, providing sufficient pressure to continuously push the gas into the acid trap (500 mL of 1 M H2SO4).
2.3 Design of electrochemical operations
First, chronopotentiometric experiments were conducted at an applied current of 1 A (25 mA cm−2) to evaluate membrane performance using the 40 cm2 cell. In this step, 120 mL of the anolyte (synthetic wastewater) and 60 mL of the catholyte (0.1 M Na2SO4) were separately recirculated at 20 mL min−1 for 1 h, assessing membrane performance based on anodic TAN removal (%), nitrogen flux (g-N m−2 d−1), transference number, and energy consumption (kWh kg−1). Following the screening of optimal CEMs, the determination of the optimal current density was performed in batch operations under various applied current densities ranging from 6.25 to 100 mA cm−2 (0.25 to 4 A) utilizing a 40 cm2 cell, with 2 L of anolyte feed (synthetic wastewater) and 0.2 L of a 0.1 M Na2SO4 solution as the catholyte receiving solution. The investigation into the effect of loading rate, defined as the volume of the anolyte feed per given electrode area (40 cm2) and duration (20 h) during batch operation, involved varying the anolyte volume to 0.5, 1, and 2 L while changing the corresponding receiving volume to 0.05, 0.1, and 0.2 L, respectively. Subsequently, the identified optimal load rate was applied to the upscaled 8-cell stack.
2.4 Electrolyte solutions
The synthetic wastewater composition is summarized in Table S2. The real livestock wastewater and food wastewater were sourced from Dukwon Farm in Eonyang (Ulsan, South Korea) and BioX Clan (Seoul, South Korea), respectively, and their compositions are presented in Table S3.
2.5 Analytical methods
concentrations were assessed using the indophenol blue method. Three reagents were made: solution A containing 0.75 M NaOH in 10 ml NaOCl (available chlorine 4.00–4.99%), solution B composed of 0.4 M sodium salicylate (NaC7H5O3) and 0.32 M NaOH, and solution C comprising 0.1 g sodium nitroferricyanide dihydrate (Na2 [Fe (CN) 5NO] · 2H2O) in 10 ml deionized water. In the procedure, 0.3 mL of the catholyte or diluted acidic trap sample was added to 3.7 mL of 0.2 M NaOH. Subsequently, 50 μL of solution A, 500 μL of solution B, and 50 μL of solution C were sequentially added. After 2-h incubation, the absorbance was measured at a wavelength of 665 nm. Solution pH was determined using a pH meter (pH meter SevenDirect SD20 Kit, Mettler Toledo). COD concentration was quantified using the HS-COD-MR kit (HUMAS, South Korea) using a UV-vis spectrophotometer. Anions were measured using Dionex ICS-1100 ion chromatographs equipped with an IonPac AS14 column (Thermo Scientific, USA). Cations were measured using inductively coupled plasma optical emission spectrometry (ICP-OES, Thermo, iCAP Pro). For electrochemical impedance spectroscopy (EIS) analysis, a symmetric batch cell (platinum//platinum) with a 30 mL working volume was filled with fresh 1 M NH4Cl or HCl electrolyte in both chambers. In potentiostatic EIS analysis, the initial DC voltage was fixed to 0 V, with an AC voltage amplitude of 10 mV. EIS data were acquired over a frequency range spanning from 100 kHz to 10 Hz, with a sampling rate of 10 points per decade. Resistance values were derived from the Nyquist plot produced, and the obtained impedance was indicative of the membrane resistance specific to a particular cation migration.
2.6 Calculations
The TAN removal efficiency (in %) denotes the quantity of TAN removed from the anolyte following the electrochemical operation. Nitrogen flux (in g-N m−2 d−1) quantifies the amount of TAN migrating through the CEM, normalized by the projected membrane surface area (m2) per day. Transference numbers, representing the fraction of current carried by specific ions, were determined based on measurements from the indophenol method (for ) and ICP-OES (for K+), normalized by the total charge. Electrochemical energy input per mass of nitrogen (kWh kg-N−1) reveals the total electrical energy input needed to transfer one kilogram of TAN. Comprehensive equations for these metrics are available in the Supporting Information (Section S1).
3 Results and discussions
3.1 Screening of CEMs for electrochemically-mediated TAN recovery
Initially, the TAN removal efficiency and nitrogen flux were investigated for various commercial CEMs. Employing constant-current operation (galvanostatic chronopotentiometry) at 25 mA cm−2 (1 A for the 40 cm2 cell) for 1 h facilitated the assessment of TAN recovery performance variation among different CEMs under the same total charge. While the theoretically migrated charge was identical (3,600 C), the resulting compositions of the catholyte (including TAN content in the acidic trap) after electrolysis were significantly influenced by the selection of CEM. Figure 1A illustrates that Neosepta CSE achieved the highest TAN removal in the anolyte (64.5%), followed by Aquivion E98–15S (58.5%), and InnoPep-C (57.0%) during the 1 h operation with a 120 mL synthetic anolyte feed. Generally, the trend in TAN removal efficiency from the anolyte closely correlated with the corresponding nitrogen flux toward the catholyte through the CEM. Neosepta CSE exhibited the highest nitrogen flux of 1078 g-N m−2 d−1 (Figure 1A), resulting in a final catholyte TAN concentration of 208.8 mM (Figure S3). In contrast, Nafion 117 showed a much lower flux of 634.7 g-N m−2 d−1 and a final catholyte concentration of 125.9 mM (Figure S3).
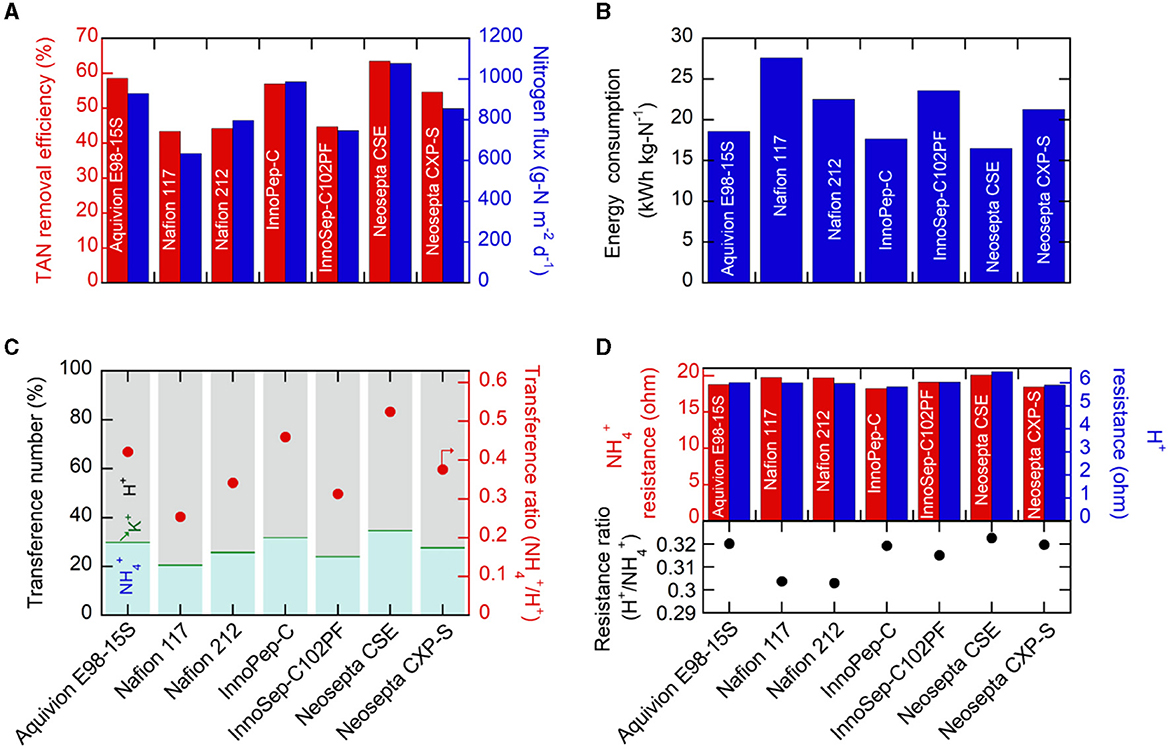
Figure 1. (A) TAN removal efficiencies and nitrogen flux, (B) electrical energy consumption, and (C) transference numbers and transference ratios (/H+) during electrochemical operations for 1 h at 25 mA cm−2 using various CEMs. In this experimental setup, the anolyte feed had a volume of 120 mL, while the catholyte volume was 60 mL. (D) Membrane resistance values for and H+ migration and resistance ratios (H+/) determined using different membranes soaked in 1 M NH4Cl and 1 M HCl solutions.
The comparison of Nafion 117 and Nafion 212, thought to have the same polymer structure except for thickness, revealed similar TAN removal efficiency (43.4% for Nafion 117 and 44.2% for Nafion 212) but a significant difference in nitrogen flux (634.7 g-N m−2 d−1 for Nafion 117 and 797.5 g-N m−2 d−1 for Nafion 212) (Figure 1A). This difference could be attributed to the amount of retained in the CEM matrix. When the used CEMs were cleansed and soaked in 1 M H2SO4 for over 24 h, and then released was measured, the thicker Nafion 117 exhibited a larger amount of released from the membrane compared to the much thinner Nafion 212 (Figure S4). Consequently, the larger retention in Nafion 117 partially explained the lower nitrogen flux toward the catholyte compared to Nafion 212, despite both having the same TAN removal in the anolyte.
In practical electrochemical TAN accumulation, it is essential to consider the amount of required electrical energy. Therefore, during constant current operation (25 mA cm−2), the resulting cell voltages were closely monitored. As depicted in Figure S5, Neosepta CSE demonstrated the lowest cell voltage (<2.9 V), while Nafion 117 exhibited the highest required cell voltage. Taking these cell voltages into account, the corresponding energy consumption per unit mass of recovered nitrogen was calculated (Figure 1B). Neosepta CSE, with the highest nitrogen flux and the lowest cell voltage, demonstrated the most exceptional energy efficiency (16.5 kWh kg-N−1), whereas Nafion 117 exhibited the highest energy consumption (27.6 kWh kg-N−1).
As direct current plays a crucial role in TAN migration from the anolyte to the catholyte, we further investigated the influence of the CEM on the preferential transport of . We observed that the electrochemical migration primarily involved protons (H+) and from the synthetic anolyte feed to the catholyte; the accumulation of H+ in the anolyte was the major concern, caused by the oxygen evolution reaction on the anode (Eq. 2). This effect was further pronounced due to the smaller effective ionic radius of protons (0.18–0.38 Å) compared to (1.50–1.61 Å) (Hanzu et al., 2013). This observation presents a challenge as the increasing H+ levels compete with the desired migration of in the two-chambered system, lowering selectivity (Lee et al., 2021). The corresponding transference numbers (fraction of current density carried by specific cations) were determined through a chronopotentiometric test at 25 mA cm−2. CEMs demonstrating high nitrogen flux (> 900 g m−2 d−1), such as Neosepta CSE, Aquivion E98–15S, and InnoPep-C, exhibited relatively higher transference numbers (>30%) compared to others (Figure 1C). Interestingly, these three membranes also displayed higher transference ratios (the ratio of two transference numbers; /H+) exceeding 0.4, indicating relatively higher preferential selectivity in the transport of over H+ compared to other CEMs. On the contrary, despite applying the same total charge, Nafion 117 exhibited the lowest transference number at ~20.7%, with the transference ratio of to H+ (0.25) significantly lower than that of Neosepta CSE. As such, while it is widely recognized that the cationic composition of the feed solution is primarily responsible for preferential selectivity of the transported cation, there can also be, albeit marginal, preferential selectivity toward specific cations depending on the type of membrane used. We also observed that for a CEM exhibiting higher transport to the catholyte, fewer H+ were involved in the migration, leading to a greater accumulation of H+ in the anolyte chamber and consequently a lower anolyte pH value. As shown in Figure S6, for instance, Neosepta CSE, which demonstrated the highest TAN removal from the anolyte and nitrogen flux, exhibited the lowest anolyte pH (1.48) after 1 h of operation. Conversely, the Nafion series, which demonstrated the poorest TAN removal efficiencies, exhibited the highest final anodic pH (>1.67). This is reasonable given that the Nafion series were originally developed as proton exchange membranes (Waters et al., 2022). Generally, a lower final anolyte pH was consistently associated with higher nitrogen flux, and this finding further suggests that a CEM that can preferentially, albeit slightly, transport can suppress undesired H+ transport and result in a lower anolyte pH. While this study utilized various commercially available CEMs, the discovery encourages future efforts in developing -selective membranes through thoughtful molecular engineering.
Furthermore, the comparison of membrane resistance in and H+ migration across different membranes provides insights into the relative selectivity and ease of ion migration ( vs. H+). To investigate this, EIS analysis was performed using a symmetric electrochemical cell with a Pt//membrane//Pt configuration, and both chambers were filled with a specific 1 M X+Cl solution. As shown in Figure 1D, the resistance values associated with migration (18.2–20.3 Ω) were 3 to 4 times larger than those for H+ migration (5.9–6.5 Ω) (Figure S7), consistent with the higher H+ transference number (Figure 1C) and smaller H+ size compared to NH4 [+29]. Notably, we focused on a specific metric—the resistance ratio of H+/–to assess its potential as an indicator for ion selectivity; a higher resistance ratio of H+/ was considered indicative of relatively greater difficulty in transporting H+, suggesting a preference for selective migration. The resistance for H+ migration was 6.5 Ω for Neosepta CSE, somewhat higher than others, and its resistance ratio of H+/ was the largest (0.323) (Figure 1D). The overall trends in nitrogen flux, transference number, and the transference ratio of /H+ correlated well with the trend in the resistance ratio (H+/) (Figures 1A, B, D). The Nafion series, exhibiting poor nitrogen flux, displayed the lowest resistance ratio of H+/ (0.303) due to more facile proton transport compared to . While this observation suggests that the resistance ratio of H+/ can serve as a straightforward indicator for dictating H+/ selectivity, further investigation into designing molecular selectivity for transport is needed to achieve higher nitrogen flux and selectivity.
In addition, due to the anolyte feed primarily originating from wastewaters with high chemical oxygen demand (COD), we assessed the extent of undesired crossover of organic compounds (e.g., glucose) from the anolyte to the catholyte. Thin Nafion 212 and InnoPep-C (based on polyamide nylon 66 mesh) exhibited significant glucose crossover, while Neosepta CSE displayed an acceptable degree of crossover (Figure S8). Furthermore, the Fenton oxidation test results revealed that perfluorinated or cross-linked membranes demonstrated superior oxidation stability, whereas hydrocarbon-based membranes without crosslinking (e.g., InnoSep-C102PF) were prone to degradation (Figure S8). Ultimately, Neosepta CSE was chosen as the optimal membrane for further research based on its performance in TAN removal, nitrogen flux, energy consumption, TAN selectivity, crossover, and stability.
3.2 The effect of applied current density on TAN recovery with neosepta CSE membrane
Subsequently, employing the optimal Neosepta CSE membrane, we thoroughly explored the impact of varying applied current density on TAN recovery. As depicted in Figure 2A, across all current densities, the anolyte TAN concentration experienced a rapid initial decrease, but the concentration trend reached a plateau with prolonged electrolysis, indicating a limitation in achieving maximum TAN removal due to the accumulation of H+ (Eq. 2). As anticipated, the final anolyte pH was consistently below 2 for all applied current densities, exhibiting a more pronounced pH drop at higher applied current densities (Figure S9). The higher current densities resulted in greater TAN removal from the anolyte; specifically, the final TAN concentrations in the anolyte feed were 153.8, 124.7, 104.6, 59.4, and 22 mM at 6.25, 12.5, 25, 50, and 100 mA cm−2, respectively (Figure 2A). The corresponding catholyte TAN concentration also exhibited a rapid increase in the first 3 h, slowing down over time, likely due to accelerated H+ migration (Figure 2B). Interestingly, although the anodic TAN removal was higher at 100 mA cm−2 compared to 50 mA cm−2 (Figure 2A), the final catholyte TAN concentrations were similar (1143 and 1116 mM, respectively). This was attributed first to water transport from the anolyte to the catholyte through (electro)osmosis21, which was more pronounced at higher applied current densities (over 80 mL transport at 100 mA cm−2, Figure S10), resulting in dilution of the TAN in the catholyte. Second, higher cathodic current density (e.g. 100 mA cm−2) resulted in a more substantial catholyte pH increase (Figure S9) with a more vigorous formation of H2 microbubbles, facilitating the in-situ stripping of NH3 that would eventually be trapped in the acid and thus resulting in somewhat lower TAN concentration in the catholyte. A TAN up-concentration factor of 5.7, from 200 mM to 1143 mM, was attained at a current density of 50 mA cm−2. The nitrogen flux–considering the amount of TAN in the catholyte, as well as the amount of NH3 that escaped from the catholyte and was captured in the acidic trap (1 M H2SO4)–was greater at higher current densities (Figure S11). Moreover, in the nitrogen mass balance (Figure 2C), higher applied current density led to more TAN distribution in the catholyte and acidic trap, indicating higher recovery. Across all applied current densities, close to 100% nitrogen mass balance was observed, suggesting no discernible anodic degradation of /NH3 (Figure 2C).

Figure 2. (A, B) Change in (A) the anolyte TAN concentrations and (B) catholyte TAN concentrations during electrochemical operations utilizing the Neosepta CSE membrane at different applied current densities. (C) The nitrogen mass balance before and after the electrolysis. (D) Electrical energy consumption during the electrochemical operations employing the Neosepta CSE membrane. In these experiments, the anolyte feed consisted of 2 L, while the catholyte volume was 0.2 L. Various constant current densities were maintained between the anode and cathode for a duration of 20 h.
We also observed a decrease in the contribution of to the overall charge transport, as indicated by the transference number, with an increase in current density (Figure S12). This decrease can be attributed to the accelerated generation of H+ (Eq. 2) and the resulting drop in anodic pH (Figure S9), aligning with findings from a previous study (Kuntke et al., 2018a). This inefficiency at higher applied current density became notably prominent, especially when considering the greater cell voltage requirement at elevated current density levels (Figure S13), leading to increased energy consumption (Figure 2D). At a current density of 6.25 mA cm−2, the energy consumption was 8.66 kWh kg-N−1, escalating to over 70 kWh kg-N−1 at 100 mA cm−2 (Figure 2D). In this investigation, a current density of 25 mA cm−2 was determined to be the optimal level for balancing TAN removal and energy consumption; at this current density, ~50% of TAN was removed from the anolyte, resulting in a final TAN concentration of over 0.8 M in the catholyte, with the energy consumption at this level comparable to the combined energy usage of the nitrification-denitrification (from dilute NH3 to N2; 6.18–13.6 kWh kg-N−1) and Haber-Bosch processes (N2 to high-purity NH3, 10.3–12.5 kWh kg-N−1) (Chen et al., 2021).
3.3 The effect of loading rate on TAN recovery with neosepta CSE membrane
The investigation into the influence of loading rate, characterized by the anolyte feed volume per specified electrode area (40 cm2) and duration (20 h) in batch operation, was performed at 25 mA cm−2. The anolyte volume was changed to 0.5, 1, and 2 L (equivalent to the loading rates of 0.625, 1.25, and 2.5 mL cm−2 h−1, respectively). Simultaneously, changes were made to the corresponding cathodic receiving volumes−0.05, 0.1, and 0.2 L, respectively–ensuring that the volume ratio (Vanolyte/Vcatholyte) remained at 10. As the loading rate decreased, i.e., when the total anolyte volume was smaller, a more favorable TAN removal efficiency was achieved (Figure 3A), resulting in 79.0%, 61.5%, and 47.8% TAN removal from the anolyte. Concurrently, the cathodic TAN concentration increased more rapidly within the first 6 h at a lower loading rate (Figure 3B), reaching 902 mM at 6 h for the loading rate of 0.625 mL cm−2 h−1. However, the smaller loading rate, along with the reduced catholyte volume under the same Vanolyte/Vcatholyte ratio of 10, experienced more pronounced water osmosis, and the resulting dilution effect was evident in the decreasing TAN concentration after 6 h at 0.625 mL cm−2 h−1 (Figure 3B). For the smaller loading rate, the accumulation of H+ in the anolyte and OH− in the catholyte was more noticeable (Figure S14). The lower anolyte pH at a lower loading rate, coupled with a more rapid decrease in anolyte concentration, led to reduced energy efficiency in transport, resulting in higher energy consumption (Figure 3C). Nevertheless, nitrogen mass balance was well-maintained for all cases (Figure 3D). Considering that efficient removal was achievable when treating a larger feed volume (2 L) for a given electrode area (40 cm2), the loading rate of 2.5 mL cm−2 h−1 was selected for further experiments.
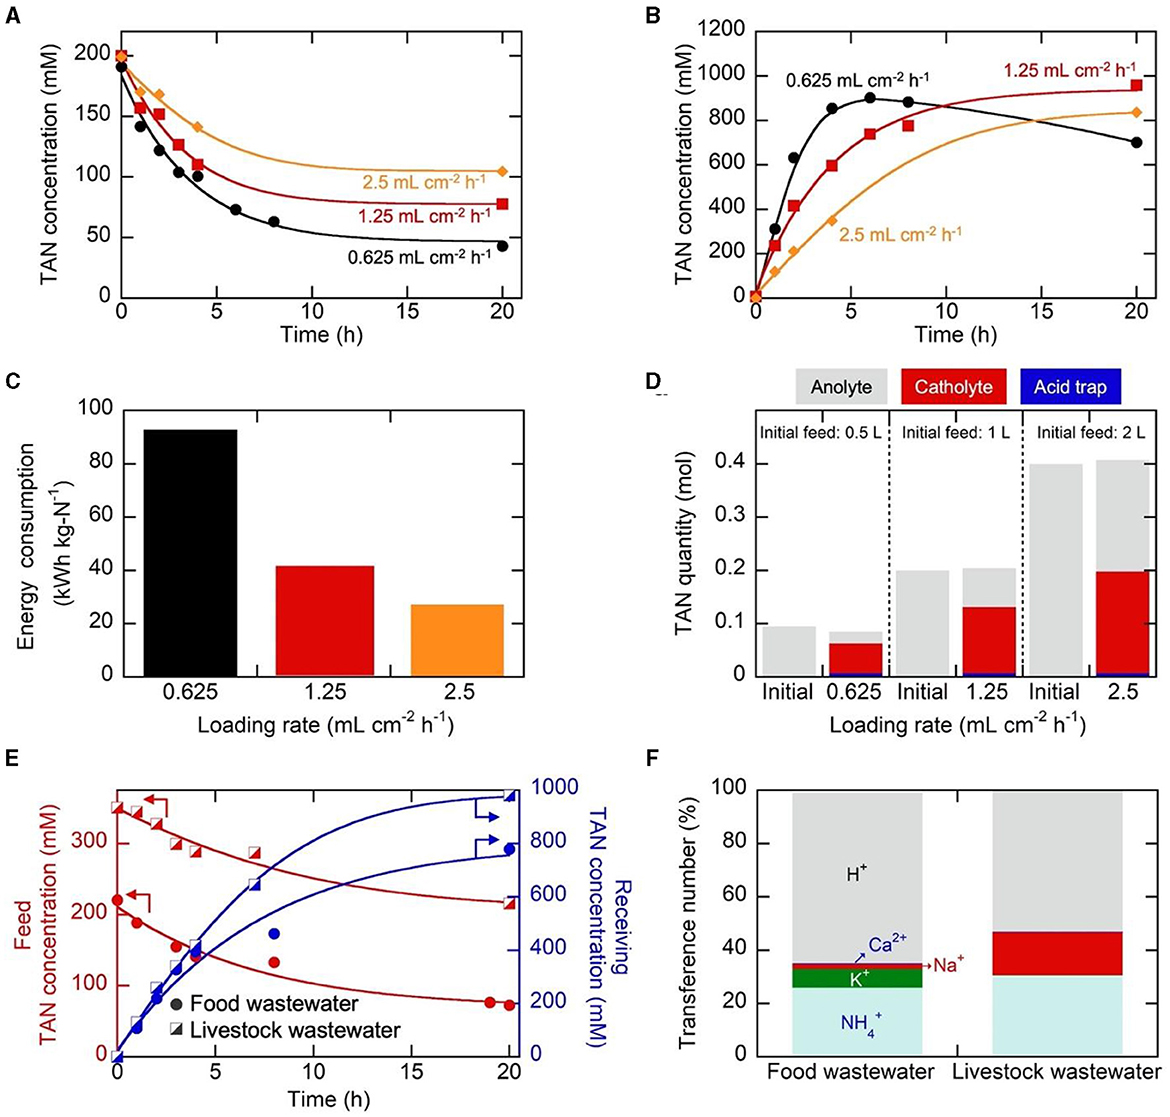
Figure 3. (A–C) Change in (A) the anolyte TAN concentrations, (B) catholyte TAN concentrations, and (C) electrical energy consumption during electrochemical operations utilizing the Neosepta CSE membrane at different loading rates. (D) The nitrogen mass balance before and after the electrolysis. In these experiments, the anolyte feed was set at 0.5, 1, or 2 L, while the catholyte volume was adjusted to 0.05, 0.1, or 0.2 L. 25 mA cm−2 was applied between the anode and cathode for a duration of 20 h. (E) Change in the anolyte and catholyte TAN concentrations, employing food and livestock wastewater as the anolyte feed. (F) Transference numbers during electrochemical operations for 20 h at 25 mA cm−2 using food and livestock wastewater as the anolyte feed.
Based on the determined optimal current density and loading rate, the obtained results from synthetic wastewater were validated before scaling up the electrochemical system. This validation was conducted by utilizing practical food and livestock wastewater streams, with their compositions summarized in Table S3. Both wastewater samples had elevated initial TAN content, making them conducive to our electrochemical TAN concentration. Following 20 h of electrochemical operation, TAN removal rates of 67% and 40% were achieved for food and livestock wastewater samples, respectively (Figure 3E). At the same time, highly concentrated streams were generated, with final catholyte TAN concentrations of 778.8 mM and 980.4 mM for food and livestock wastewater, respectively (Figure 3E), comparable to synthetic wastewater (Figure 3B). The nitrogen flux values for food wastewater and livestock wastewater, at 817 and 955 g-N m−2 d−1, respectively, surpassed that of synthetic wastewater, which was 801 g-N m−2 d−1. As observed in synthetic wastewater samples, the transference number analysis revealed H+ as the major cationic charge carrier (~60%), while the transference numbers for were 25.9% and 30.5% for food and livestock wastewater, respectively (Figure 3F). Monovalent ions also played a significant role in ion transport, primarily influenced by the initial anolyte feed composition, consistent with the previous observation.
3.4 Experimental setup of the 8-cell stack (2,000 cm2 cell)
Finally, we sought to scale up the electrochemical system for TAN recovery utilizing the Neosepta CSE membrane. The up-scaled 8-cell stack (2,000 cm2) (Figure S2), was 50 times larger than the smaller 40 cm2 cell. Our emphasis was on confirming the consistency of observations obtained in the smaller scale, with the applied current density varied. The loading rate was maintained at 2.5 mL cm−2 h−1, equivalent to treating 100 L synthetic wastewater over 20 h in the 2,000 cm2 system. The cathodic receiving solution was 10 L of 0.1 M Na2SO4 to have the volume ratio (Vanolyte/Vcatholyte) at 10, consistent with the 40 cm2 cell experiments described above. In the up-scaled system, consistent reproducibility was observed as in the small-scale system (Figure 4). TAN removal efficiencies in the anolyte feed were 19.0, 44.5, and 64.6% at applied current densities of 6.25, 12.5, and 25 mA cm−2, respectively (Figure 4A). The nitrogen flux (Figure 4A) and final TAN concentration in the catholyte receiving solution (Figure 4B) exhibited an increasing trend with higher applied current density. Notably, at 25 mA cm−2 in the 8-cell stack, the nitrogen flux (1034 g-N m−2 d−1) and final catholyte TAN concentration (1151.0 mM) surpassed those in the 40 cm2 cell (nitrogen flux: 801 g-N m−2 d−1, final catholyte TAN concentration: 836.7 mM) at the same current density. Required cell voltages (Figure S15) and the energy consumptions (Figure 4C) in the up-scaled cell closely mirrored those of the smaller scale, with a consumption of 22.7 kWh kg-N−1 at 25 mA cm−2 in the 8-cell stack, similar to the energy consumption value in the 40 cm2 cell at the same current density (23.5 kWh kg-N−1). Importantly, irrespective of applied current densities, a nearly 100% nitrogen mass balance was consistently observed (Figure 4D). The remarkable consistency and agreement between the smaller (40 cm2) and up-scaled (2,000 cm2) systems affirm the outstanding scalability of the electrochemically-mediated TAN recovery system, enabled by the appropriate selection of CEM.

Figure 4. Experimental results with the 8-cell stack (2,000 cm2 cell). (A) TAN removal efficiencies and nitrogen flux, (B) final catholyte TAN concentrations, (C) electrical energy consumptions during the electrochemical operations employing the Neosepta CSE membrane in the 8-cell stack. (D) The nitrogen mass balance before and after the electrolysis. In these experiments, the anolyte feed consisted of 100 L synthetic wastewater, while the catholyte volume was 10 L 0.1 M Na2SO4. Various constant current densities were maintained between the anode and cathode for a duration of 20 h.
4 Conclusions
In conclusion, this study implemented an upscaled electrochemical system for TAN recovery. The judicious selection of the appropriate CEM, notably Neosepta CSE among several commercial options, facilitated optimal TAN recovery with the highest selectivity over competing H+, with additional advantages in terms of energy consumption and stability. Regarding the impact of increasing applied current density, we observed improved TAN removal from the anolyte feed and increased recovery in the catholyte receiving solution with a commendable balance of high nitrogen flux and low energy consumption. At the optimal current density and loading rate, we achieved final concentrated TAN levels in the catholyte of 836.7, 778.8, and 980.4 mM, accompanied by nitrogen flux values of 801, 817, and 955 g-N m−2 d−1 for synthetic wastewater, food wastewater, and livestock wastewater, respectively. Finally, we successfully scaled up the electrochemical system to an 8-cell stack with an electrode area of 0.2 m2, capable of treating up to 100 L per 20 h (recovering 207 g-N d−1) of synthetic wastewater. The successful realization of a scalable electrochemical platform highlights the potential for broader implementation and impact in wastewater treatment scenarios.
Data availability statement
The original contributions presented in the study are included in the article/Supplementary material, further inquiries can be directed to the corresponding author.
Author contributions
SC: Conceptualization, Data curation, Formal analysis, Investigation, Methodology, Validation, Writing—original draft, Writing—review & editing. WL: Conceptualization, Data curation, Formal analysis, Writing—original draft, Writing—review & editing. HK: Writing—original draft, Writing—review & editing. GL: Writing—original draft, Writing—review & editing. CL: Writing—original draft, Writing—review & editing. D-YC: Writing—original draft, Writing—review & editing. W-KS: Writing—original draft, Writing—review & editing. KK: Conceptualization, Data curation, Formal analysis, Funding acquisition, Investigation, Methodology, Project administration, Resources, Supervision, Validation, Visualization, Writing—original draft, Writing—review & editing.
Funding
The author(s) declare financial support was received for the research, authorship, and/or publication of this article. This work was financially supported by the A.I. Incubation project (1.240013.01) of UNIST (Ulsan National Institute of Science and Technology) and Korea Ministry of Environment (MOE) as Graduate School specialized in Integrated Water Resources Management.
Conflict of interest
D-YC was employed by BioX Inc. W-KS was employed by Innochemtech Inc.
The remaining authors declare that the research was conducted in the absence of any commercial or financial relationships that could be construed as a potential conflict of interest.
Publisher's note
All claims expressed in this article are solely those of the authors and do not necessarily represent those of their affiliated organizations, or those of the publisher, the editors and the reviewers. Any product that may be evaluated in this article, or claim that may be made by its manufacturer, is not guaranteed or endorsed by the publisher.
Supplementary material
The Supplementary Material for this article can be found online at: https://www.frontiersin.org/articles/10.3389/frwa.2024.1367315/full#supplementary-material
References
Chen, T. L., Chen, L. H., Lin, Y. J., and Yu, C. P. (2021). Advanced ammonia nitrogen removal and recovery technology using electrokinetic and stripping process towards a sustainable nitrogen cycle: a review. J. Cleaner Prod. 309, 127369. doi: 10.1016/j.jclepro.2021.127369
Chen, Y., Liu, H., Ha, N., Licht, S., Gu, S., Li, W., et al. (2020). Revealing nitrogen-containing species in commercial catalysts used for ammonia electrosynthesis. Nat. Catalysis 3, 1055–1061. doi: 10.1038/s41929-020-00527-4
Christiaens, M. E. R., Gildemyn, S., Matassa, S., Ysebaert, T., Vrieze, D., Rabaey, J., et al. (2017). From source-separated urine for microbial protein production. Environ. Sci. Technol. 51, 13143–13150. doi: 10.1021/acs.est.7b02819
Deng, Q., Dhar, B. R., Elbeshbishy, E., and Lee, H. S. (2014). Ammonium nitrogen removal from the permeates of anaerobic membrane bioreactors: economic regeneration of exhausted zeolite. Environ. Technol. 2014, 35, 2008–2017. doi: 10.1080/09593330.2014.889759
Desloover, J., Abate Woldeyohannis, A., Verstraete, W., Boon, N., and Rabaey, K. (2012). Electrochemical resource recovery from digestate to prevent ammonia toxicity during anaerobic digestion. Environ. Sci. Technol. 46, 12209–12216. doi: 10.1021/es3028154
Etter, B., Tilley, E., Khadka, R., and Udert, K. M. (2011). Low-cost struvite production using source-separated urine in Nepal. Water Res. 45, 852–862. doi: 10.1016/j.watres.2010.10.007
Georg, S., Puari, A. T., Hanantyo, M. P. G., Sleutels, T., and Kuntke, P. (2023). Low-energy ammonium recovery by a combined bio-electrochemical and electrochemical system. Chem. Eng. J. 454, 140196. doi: 10.1016/j.cej.2022.140196
Hanzu, I., Hornebecq, V., Djenizian, T., and Knauth, P. (2013). In situ study of electrochromic properties of self-assembled TiO2 nanotubes. Comptes Rendus. Chimie. 16, 96–102. doi: 10.1016/j.crci.2012.11.005
Hou, D., Iddya, A., Chen, X., Wang, M., Zhang, W., Ding, Y., et al. (2018). Nickel-based membrane electrodes enable high-rate electrochemical ammonia recovery. Environ. Sci. Technol. 52, 8930–8938. doi: 10.1021/acs.est.8b01349
Huang, H., Liu, J., Xiao, J., Zhang, P., and Gao, F. (2016). Highly efficient recovery of ammonium nitrogen from coking wastewater by coupling struvite precipitation and microwave radiation technology. ACS Sust. Chem. Eng. 2016, 4, 3688–3696. doi: 10.1021/acssuschemeng.6b00247
Iddya, A., Hou, D., Khor, C. M., Ren, Z., Tester, J., Posmanik, R., et al. (2020). Efficient ammonia recovery from wastewater using electrically conducting gas stripping membranes. Environ. Sci. Nano 7, 1759–1771. doi: 10.1039/C9EN01303B
Jiang, H., Straub, A. P., and Karanikola, V. (2022). Ammonia recovery with sweeping gas membrane distillation: energy and removal efficiency analysis. ACS EST Eng. 2, 617–628. doi: 10.1021/acsestengg.1c00294
Kelly, P. T., and He, Z. (2014). Nutrients removal and recovery in bioelectrochemical systems: a review. Biores. Technol. 153, 351–360. doi: 10.1016/j.biortech.2013.12.046
Kim, H., Park, H., Kim, K., and Lee, C. (2024). Electrochemical recovery of nutrients from human urine coupled with biogas upgrading. Biores. Technol. 394, 130298. doi: 10.1016/j.biortech.2023.130298
Kim, K., Chen, Y., Han, J. I., Yoon, H. C., and Li, W. (2019). Lithium-mediated ammonia synthesis from water and nitrogen: a membrane-free approach enabled by an immiscible aqueous/organic hybrid electrolyte system. Green Chem. 21, 3839–3845. doi: 10.1039/C9GC01338E
Kim, K., Zagalskaya, A., Ng, J. L., Hong, J., Alexandrov, V., Pham, T. A., et al. (2023). Coupling nitrate capture with ammonia production through bifunctional redox-electrodes. Nat. Commun. 14, 823. doi: 10.1038/s41467-023-36318-1
Kogler, A., Farmer, M., Simon, J. A., Tilmans, S., Wells, G. F., Tarpeh, W. A., et al. (2021). Systematic evaluation of emerging wastewater nutrient removal and recovery technologies to inform practice and advance resource efficiency. ACS EST Eng. 1, 662–684. doi: 10.1021/acsestengg.0c00253
Kuntke, P., Rodrigues, M., Sleutels, T., Saakes, M., Hamelers, H. V. M., Buisman, C. J. N., et al. (2018a). Energy-efficient ammonia recovery in an up-scaled hydrogen gas recycling electrochemical system. ACS Sust. Chem. Eng. 6, 7638–7644. doi: 10.1021/acssuschemeng.8b00457
Kuntke, P., Sleutels, T. H. J. A., Rodríguez Arredondo, M., Georg, S., and Barbosa, S. G. (2018b). (Bio)electrochemical ammonia recovery: progress and perspectives. Appl. Microbiol. Biotechnol. 102, 3865–3878. doi: 10.1007/s00253-018-8888-6
Ledezma, P., Jermakka, J., Keller, J., and Freguia, S. (2017). Recovering nitrogen as a solid without chemical dosing: bio-electroconcentration for recovery of nutrients from urine. Environ. Sci. Technol. Lett. 4, 119–124. doi: 10.1021/acs.estlett.7b00024
Lee, G., Kim, K., Chung, J., and Han, J. I. (2021). Electrochemical ammonia accumulation and recovery from ammonia-rich livestock wastewater. Chemosphere 270, 128631. doi: 10.1016/j.chemosphere.2020.128631
Limoli, A., Langone, M., and Andreottola, G. (2016). Ammonia removal from raw manure digestate by means of a turbulent mixing stripping process. J. Environ. Manage. 176, 1–10. doi: 10.1016/j.jenvman.2016.03.007
Losantos, D., Aliaguilla, M., Molognoni, D., González, M., Bosch-Jimenez, P., Sanchis, S., et al. (2021). Development and optimization of a bioelectrochemical system for ammonium recovery from wastewater as fertilizer. Cleaner Eng. Technol. 4, 100142. doi: 10.1016/j.clet.2021.100142
Luther, A. K., Desloover, J., Fennell, D. E., and Rabaey, K. (2015). Electrochemically driven extraction and recovery of ammonia from human urine. Water Res. 87, 367–377. doi: 10.1016/j.watres.2015.09.041
McKay Fletcher, D., Ruiz, S., Williams, K., Petroselli, C., Walker, N., Chadwick, D., et al. (2022). Projected increases in precipitation are expected to reduce nitrogen use efficiency and alter optimal fertilization timings in agriculture in the south east of England. ACS EST Eng. 2022, 2, 1414–1424. doi: 10.1021/acsestengg.1c00492
Rodríguez Arredondo, M., Kuntke, P., ter Heijne, A., and Hamelers, H. V. (2017). Load ratio determines the ammonia recovery and energy input of an electrochemical system. Water Res. 111, 330–337. doi: 10.1016/j.watres.2016.12.051
Tarpeh, W. A., Barazesh, J. M., Cath, T. Y., and Nelson, K. L. (2018). Electrochemical stripping to recover nitrogen from source-separated urine. Environ. Sci. Technol. 52, 1453–1460. doi: 10.1021/acs.est.7b05488
Waters, S. E., Thurston, J. R., Armstrong, R. W., Robb, B. H., Marshak, M. P., Reber, D., et al. (2022). Holistic design principles for flow batteries: cation dependent membrane resistance and active species solubility. J. Power Sour. 520, 230877. doi: 10.1016/j.jpowsour.2021.230877
Zamora, P., Georgieva, T., Ter Heijne, A., Sleutels, T. H. J. A., Jeremiasse, A. W., Saakes, M., et al. (2017). Ammonia recovery from urine in a scaled-up microbial electrolysis cell. J. Power Sour. 356, 491–499. doi: 10.1016/j.jpowsour.2017.02.089
Keywords: ammonia, electrochemical concentration, nutrient recovery, cation exchange membrane, upscaled electrochemical cell
Citation: Choi S, Lee W, Kim H, Lee G, Lee C, Cheong D-Y, Son W-K and Kim K (2024) Ammonia concentration and recovery in an up-scaled electrochemical cell through screening of cation exchange membrane. Front. Water 6:1367315. doi: 10.3389/frwa.2024.1367315
Received: 08 January 2024; Accepted: 15 February 2024;
Published: 04 March 2024.
Edited by:
Duoying Zhang, Heilongjiang University, ChinaCopyright © 2024 Choi, Lee, Kim, Lee, Lee, Cheong, Son and Kim. This is an open-access article distributed under the terms of the Creative Commons Attribution License (CC BY). The use, distribution or reproduction in other forums is permitted, provided the original author(s) and the copyright owner(s) are credited and that the original publication in this journal is cited, in accordance with accepted academic practice. No use, distribution or reproduction is permitted which does not comply with these terms.
*Correspondence: Kwiyong Kim, kwiyongk@unist.ac.kr