 Dima Al Atawneh
 Sreekanth Janardhanan
 Nick Cartwright
 Edoardo Bertone
 Rebecca Doble
- 1School of Engineering and Built Environment, Griffith University, Gold Coast, QLD, Australia
- 2Water Security Program, Commonwealth Science and Industrial Research Organisation (CSIRO) Environment, Dutton Park, QLD, Australia
- 3Cities Research Institute, Griffith University, Gold Coast, QLD, Australia
- 4Australian Rivers Institute, Griffith University, Nathan, QLD, Australia
- 5Water Security Program, Commonwealth Science and Industrial Research Organisation (CSIRO) Environment, Urrbrae, SA, Australia
Introduction: Groundwater in the Middle East and North Africa region is a critical component of the water supply budget due to a (semi-)arid climate and hence limited surface water resources. Despite the significance, factors affecting the groundwater balance and overall sustainability of the resource are often poorly understood. This often includes recharge and discharge characteristics, groundwater extraction and impacts of climate change. The present study investigates the groundwater balance in the Dead Sea Basin aquifer in Jordan using a groundwater flow model developed using the MODFLOW.
Methods: The study aimed to simulate groundwater balance components and their effect on estimation of the aquifer's safe yield, and to also undertake a preliminary analysis of the impact of climate change on groundwater levels in the aquifer. Model calibration and predictive analysis was undertaken using a probabilistic modeling workflow. Spatially heterogeneous groundwater recharge for the historical period was estimated as a function of rainfall by simultaneously calibrating the recharge and aquifer hydraulic property parameters.
Results and discussion: The model indicated that annual average recharge constituted 5.1% of the precipitation over a simulation period of 6 years. The effect of groundwater recharge and discharge components were evaluated in the context of estimation of safe yield of the aquifer. The average annual safe yield is estimated as ~8.0 mm corresponding to the 80% of the calibrated recharge value. Simulated groundwater levels matched well with the declining trends in observed water levels which are indicative of unsustainable use. Long-term simulation of groundwater levels indicated that current conditions would result in large drawdown in groundwater levels by the end of the century. Simulation of climate change scenarios using projected estimates of rainfall and evaporation indicates that climate change scenarios would further exacerbate groundwater levels by relatively small amounts. These findings highlight the need to simulate the groundwater balance to better understand the water availability and future sustainability.
1 Introduction
Groundwater is a substantial source of fresh water in most parts of the world. In many arid and semi-arid regions of Africa and the Middle East, communities rely exclusively on groundwater (Pointet, 2022). Both climatic variations and other anthropogenic factors can potentially have negative impacts on groundwater storage and quality (Lee et al., 2023). The effect of changes can have indirect impact on groundwater quality in particular unconfined aquifers, by increasing the penetration rates of dissolved organic matter (DOM) and/or soil organic matter (SOM) through recharge process, due to climate change. Also reduced recharge increases the risk of salinity especially in areas where evapotranspiration is high (Dao et al., 2023). Climate change is expected to undermine the groundwater balance in most regions mainly through a reduction in groundwater recharge, and groundwater levels caused by changes in intensity and patterns of rainfall and evaporation (Guevara-Ochoa et al., 2020). The effect of changes in groundwater recharge on the overall groundwater balance needs to be investigated to understand the future state of groundwater resource. It is crucial for understanding the future sustainability of water resources, assessing groundwater quality, understanding hydrological processes, anticipating climate change impacts, and facilitating management and planning.
Numerical groundwater models are widely being used to assess the impacts of climate change and other anthropogenic drivers on groundwater resource. Modeling workflow and representation of process in such models vary widely depending on the amount and diversity of data available, computational resource and modeling tools available. MODFLOW (Harbaugh, 2005) is a commonly used model code for such purposes. Scibek and Allen (2006) applied MODFLOW to investigate impacts of climate change on groundwater recharge in two unconfined aquifers in USA and Canada. They used GCM predictions and stochastic weather generation for each region to provide inputs for spatio-temporal recharge and groundwater models.
Luoma and Okkonen (2014) utilized Unsaturated-Zone Flow (UZF1) package of MODFLOW-2005 in a low-lying coastal aquifer in Hanko, southern Finland to accurately enhance the simulation of groundwater levels and recharge. Hashemi et al. (2015) employed MODFLOW model to analyze climate change impacts on groundwater in arid southern Iran. Projected climate variables were used to simulate future runoff. The rainfall runoff model was then coupled to groundwater flow and recharge model to simulate changes in future groundwater heads. Impacts of climate change and possible scenarios defined for the drop of water table by MODFLOW (Goodarzi et al., 2016). Groundwater recharge was calculated in zones using Thornthwaite and Mather's method based on monthly temperature and rainfall data, and then fed to MODFLOW model. The behavior of groundwater in the Klela basin has been evaluated in the context of climate change (Toure et al., 2016). In their study, coupling technique between MODFLOW and lumped-sum water balance model was used to compute monthly recharge and simulate the potential future impacts of climate on groundwater levels.
On other hand MODFLOW can be coupled with unsaturated zone surface hydrological models to fully assess the effect of CC and water consumption on water resources by calculation the recharge. The vadose zone hydrological model WetSpass was applied by Dams et al. (2012) and Shrestha et al. (2016) to calculate the recharge, and was then integrated to MODFLOW to simulate groundwater level fluctuations and change in storage. Similarly, a fully-coupling modeling approach SWAT-MODFLOW was employed to calculate the groundwater recharge and predict climate change impacts on groundwater resources in Thailand (Petpongpan et al., 2020). Doble et al. (2022) used WAVES model to emulate groundwater net recharge. The modeled values was used as an input to MODFLOW through the modified ETS package of MODFLOW to subsequently detect changes in groundwater heads.
It may be observed that several past studies used projected climate data to estimate recharge and applied it in numerical groundwater models to estimate changes in groundwater levels and fluxes (Reinecke et al., 2021; Soundala and Saraphirom, 2022). Depending on the complexity of the recharge models, they use computationally complex solution of Richard's equation or simpler approaches like UZF1 or Hydrus 1D coupled to MODFLOW in which 1D solution of Richard's equation was used. In many practical contexts, estimation of recharge using solution of unsaturated zone flow is not feasible because of the absence of observed data to inform unsaturated zone parameters. For the Dead Sea Basin (DSB), heterogeneity of the hydraulic properties of the aquifer layers plays an important role in determining the relative impacts of change in groundwater recharge on groundwater levels. Considering the challenges associated with this uncertainty, the model was calibrated probabilistically using PEST++ and a range of plausible realizations of hydraulic properties to investigate the groundwater levels and safe yield.
A probabilistic methodology was employed for model calibration in this study. Historically, model calibration assumes the existence of one set of model parameters that results in the best match between model simulations and observations. In contrast, probabilistic methods account for the inherent uncertainties in groundwater model parameters and acknowledge the existence of non-unique sets of parameter combinations leading to a similar match with historical observations. Recognizing and quantifying these parameter uncertainties significantly enhances the quantification of uncertainties in model predictions for future climatic conditions, especially when parameters like specific yield can significantly impact predictive variables like groundwater levels.
Jordan ranks second in the world in terms of water scarcity (MWI, 2020) and is characterized by relatively low annual rainfall of ~250 mm falling upon 92% of Jordan's area. Due to limited surface water supply, groundwater constitutes the main source at the local level, and rainfall is the main source of groundwater replenishment (Abdulla and Al-Assa'D, 2006). The country is among the most exposed regions to global climate change (Smiatek et al., 2011). Previous reports from the Intergovernmental Panel on Climate Change (IPCC) revealed that most models agreed on a 15–21% decrease in precipitation and an average temperature increase from 1.5 to 4°C in Jordan by 2100 (MoE, 2021). Groundwater level in the main aquifer are already decreasing by an average of 2 m per year, but some depleted areas are witnessing declines of up to 20 m per year (MWI, 2020).
The majority of previous studies in the region have focused on historical climate trends with a observed warming and drying of the climate between 1970 and 2010 (Al-Mashagbah and Al-Farajat, 2013). Alraggad et al. (2017) and Rodiger et al. (2020) applied the J2000 hydrological model to estimate groundwater recharge in the Mujib Basin (a major part of the Dead Sea Basin) and found a significant decrease in recharge by 10% in 2030 and 30% in 2060. Abu-Allaban et al. (2015) investigated the effect of climate change on the Mujib Basin's water resources, by implementing several scenarios for time period 2012–2033. They found a decrease by 10 and 20% in near-future period (2023–2033) annual rainfall for both wet and dry seasons, respectively, relative to baseline period 1970–1991. Abdulla and Al-Assa'D (2006) built a steady-state groundwater model to predict the aquifer's response to withdrawal rates for the years 2010, 2020, and 2030 relative to the historical period 1996–2002. The scenarios showed the sensitivity of the aquifer to the pumping rates.
In these previous studies, the effect of future climate on water resources was estimated based on projected changes to rainfall only. Simpler approaches were used in the past due to lack of data and its reliability, as well as computational challenges in simulating a complex regional aquifer with structural uncertainties. To the best of our knowledge, probabilistic simulation of groundwater balance changes and its impacts of aquifer safe yield considering projected changes on both precipitation and evapotranspiration has not been undertaken in the past for the Dead Sea Basin. Safe yield values in Jordan have not been calculated since 1988 (Law on the Water Authority, 2001). The present study aims to address these knowledge gaps by developing a transient groundwater model (MODFLOW) to simulate the long-term groundwater balance over the present-day and far-future (end of century) periods under changing (rainfall and evapotranspiration) and non-changing climates. The modeling accounts for predictive uncertainties resulting from complex geology and data sparsity by using a model calibration and uncertainty analysis approach based on an ensemble of plausible model parameters and inputs to assess prediction uncertainty. The study evaluates the estimation of safe yield with the insights gained from water balance analysis and uncertainties in the relevant water balance components.
2 Methodology
Figure 1 provides an overview of the modeling approach adopted in this study. A MODFLOW groundwater flow model was developed for the study site based on the aquifer's hydraulic properties and observed climate data to model the groundwater levels, water balance (e.g., recharge) and recalculate the safe yield. The model was calibrated and validated against observed groundwater levels using the PEST-IES algorithm (White, 2018) accounting for the uncertainty in recharge, hydraulic conductivity, specific yield, specific storage, groundwater pumping and boundary conductance. The calibrated model was then used to explore the potential influence of future projections of rainfall and evapotranspiration on groundwater levels and safe yield compared to multiple scenarios including “No Climate Change” scenario (Figure 12). Further details are provided in the following subsections.
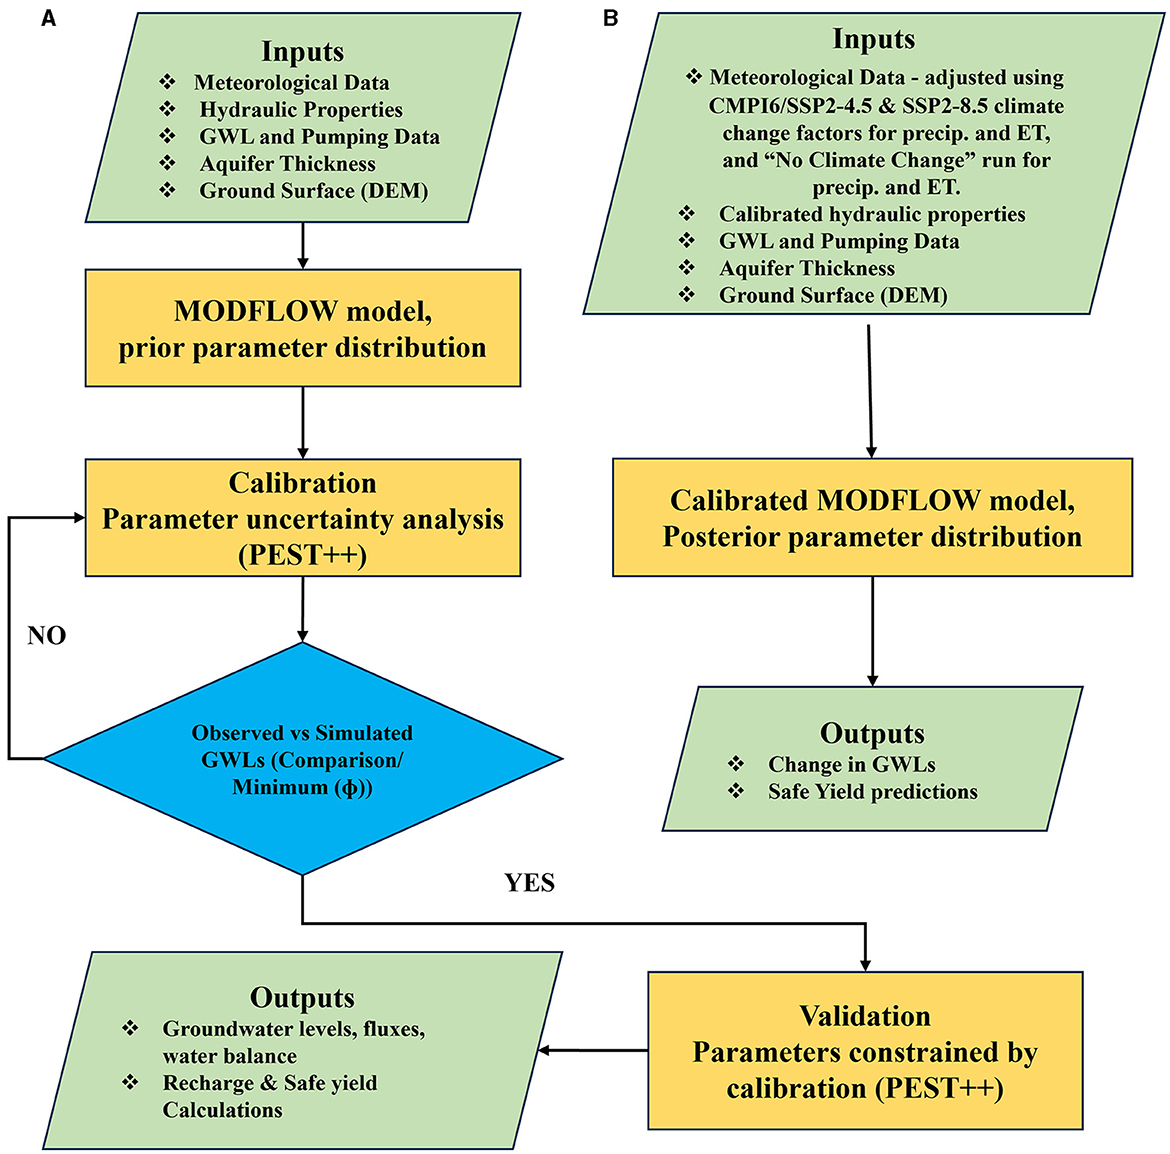
Figure 1. Overview of the modeling methodology, the calibration setup (A), and future predictions (B).
2.1 Study site: Dead Sea Basin aquifer
The Dead Sea Basin (Figure 2) is the main groundwater basin in central Jordan, with a total annual abstraction of 83.85 million cubic meters (mcm). It consists of two major catchments the Wadi Al-Mujib catchment (4,500 km2) and the Wadi Wala catchment of about (2,100 km2; MWI, 2020). The area selected for modeling covers an approximate area of 6,500 km2 in the southeastern part of the basin and was selected due to its exposure to water scarcity. Practices such as high water abstraction and agricultural activities coupled with climate change had placed a burden on the aquifer (Hdoush et al., 2022).
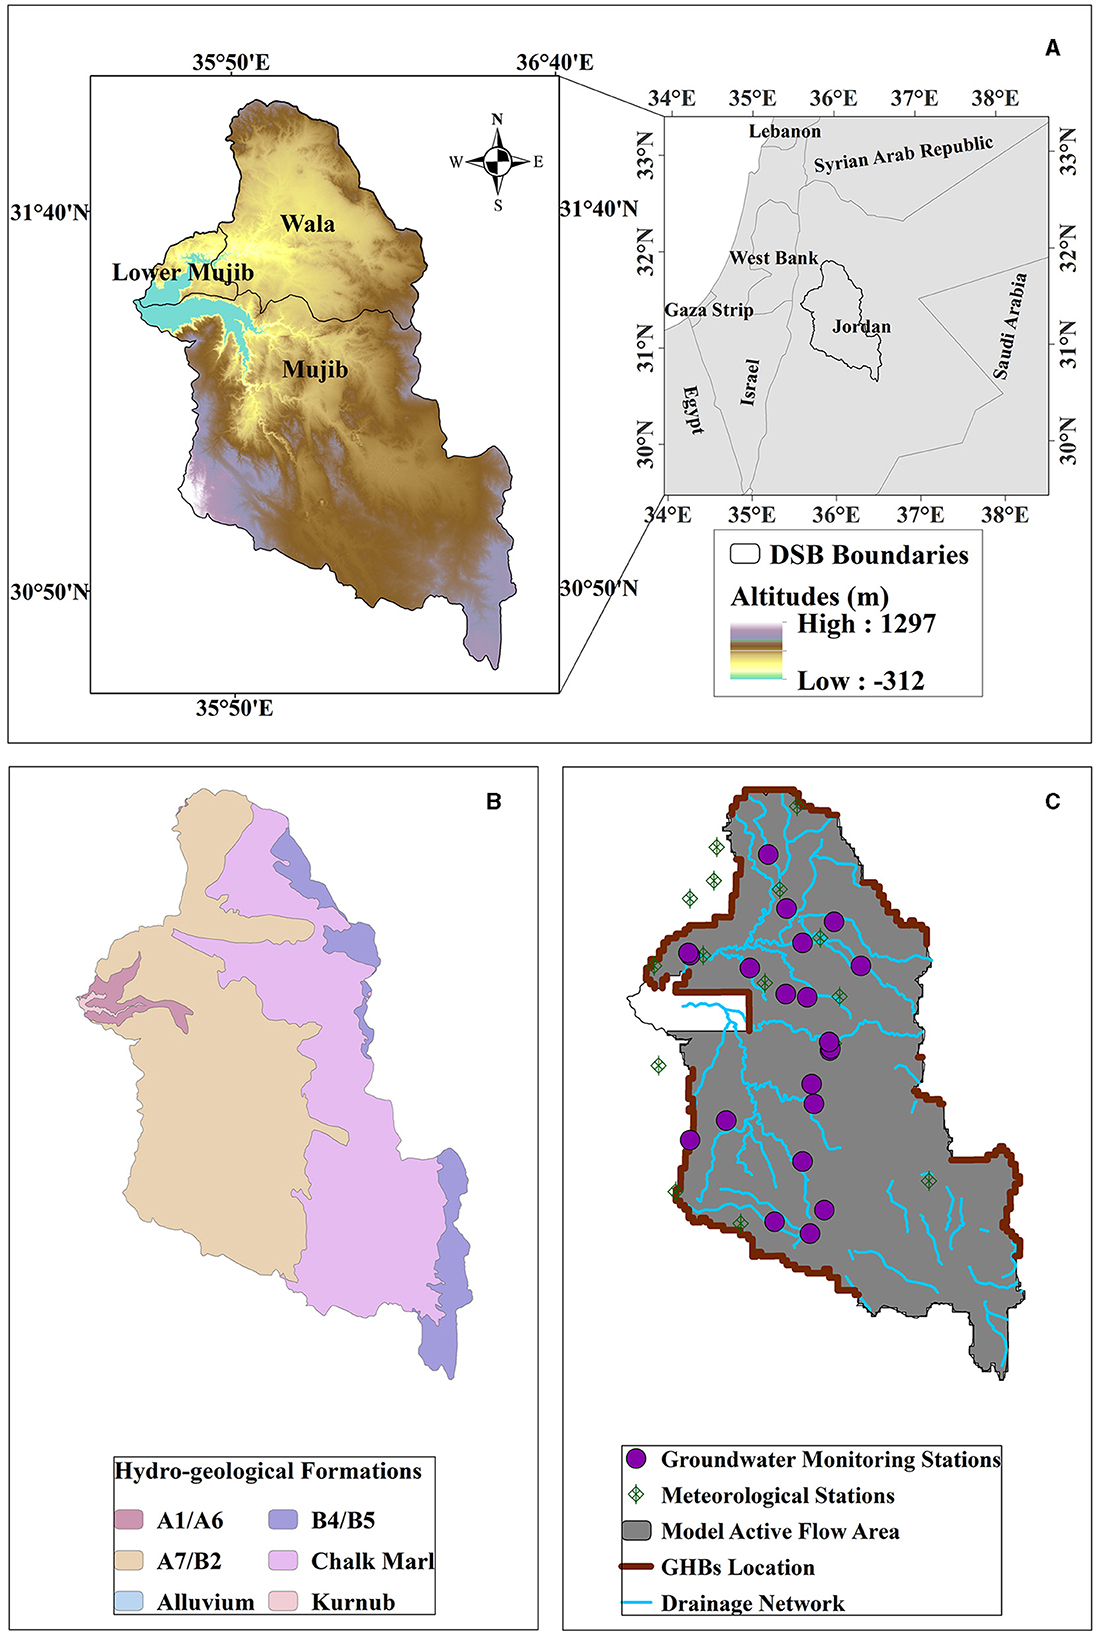
Figure 2. (A) The Dead Sea Basin aquifer including main catchments and surface elevations, Jordan. (B) The hydro-geological units' map. (C) Also shown are the groundwater and climate monitoring locations, the MODFLOW model active area and boundary conditions.
The area is multi-terrain accompanied by steep slopes toward the western side of the model domain, with variant contour elevations ranging from 1,200 m asl to −420 m bsl (MWI, 2020). The location of the DSB aquifer between the Mediterranean climate on the northwestern side and the arid to semi-arid climate in the southern eastern regions, led to climate diversity and great variation in rainfall rate (Abu-Allaban et al., 2015). The mean annual rainfall is <200 mm and the eastern parts are the driest with an annual precipitation not exceeding 70 mm (Abu-Allaban et al., 2015). Figure 3 indicates a declining trend of 0.63 mm/yr for the historical record between 1986 and 2014. Groundwater largely follows the direction of the NW-SE drainage (Lu et al., 2020).
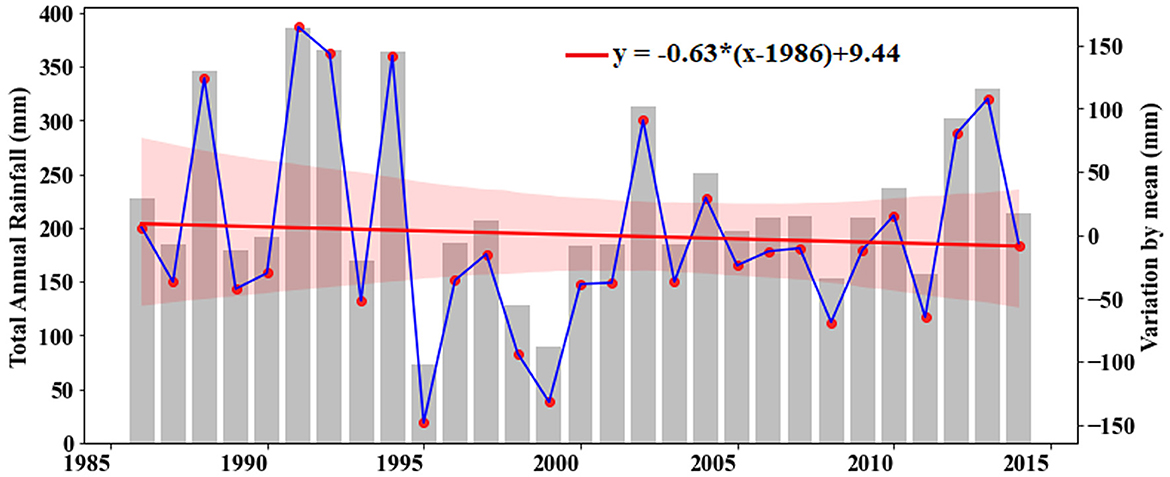
Figure 3. Spatially averaged annual rainfall and variation by mean of annual rainfall (relative to period 1986–2014), for the historical period 1986–2014. The red line indicates the linear trend over the anomaly time period.
The basin supplies water for drinking and agriculture and has a unique ecosystem that contains attractive biodiversity represented by Mujib Reserve, which is the lowest natural reserve in the world at an altitude down to 400 m below sea level. The basin springs form the main source of Zara-Mae'n desalination station, and Mae'n thermal springs. Both the thermal springs and the desalination station are outside the modeled aquifer system without any impact on groundwater density properties and temperature (Schäffer and Sass, 2014). The impact of groundwater over-exploitation and climate change on the spring discharges is therefore a matter of concern. Therefore, sustainability plans and water management schemes are required to sustain this underground resource.
2.2 Hydrogeology of the DSB
In most parts of the Dead Sea Basin, the hydrogeological unit B2/A7 is the prominent aquifer formation sometimes overlain with Quaternary sediments of low thickness (Supplementary Table 3). This geological formation consists of main two groups; The Balqa Group is represented by Al Hisa Phosphorite (B2a) and Amman Silicified Limestone (B2b), and the upper formation of the Ajlun Group is represented by Wadi As Sir Limestone (A7; Abed, 2017). The lithology comprises massive limestone, dolomitic limestone, and dolomite with intercalated beds of sandy limestone, chalk, marl, gypsum, chert, and phosphorite as an aquitard (A1/6) separates the upper aquifer B2/A7 from the lower aquifer Kurnub and B4/B5 formations (Margane et al., 2002a). The basin is highly heterogeneous (see Supplementary Figure 1), as hydraulic properties vary significantly spatially due to the existence of uplift faults, mainly the Siwaqa fault and the E-W fault, with a small dextral sliding motion along them (Abed, 2017). The underlain layers of clay loams at the north are characterized by moderate infiltration rates, and the stony sandy loams at the south have high infiltration rates (Salman et al., 2014).
The groundwater model with appointed boundary conditions was built (Figure 2C) for the upper aquifer system only. The locations of the model boundaries were assigned following Abdulla and Al-Assa'D (2006). The model was influenced by conditions outside the model domain: (1) springs and waterfalls in the western side, (2) the adjacent Azraq Basin, Azraq Wetlands Reserve and Oasis located east of the model domain, and (3) other waterfalls and lakes north of the model boundaries. Generally, the aquifer thickness varies between 100 and 300 m where thickness decreases to the north. The hydrogeological data provided by the Ministry show that the depth to water table vary between 240 m in central southern part to <5 m in northern highlands.
2.3 Model development
A transient groundwater flow model was developed using MODFLOW-NWT (Niswonger et al., 2011) to simulate the groundwater balance in the aquifer system using historical observations from January 2009 to December 2014. PEST++ (White, 2018) was used to calibrate the model and quantify uncertainties in groundwater balance resulting from limited data and uncertainty in aquifer parameters.
2.3.1 Data sources
The data used is summarized in Table 1. Climate and hydrological datasets were sourced from the Jordan Ministry of Water and Irrigation and the Ministry of Agriculture. This included rainfall and evaporation datasets corresponding to the period between January 2009 and December 2014 from 20 meteorological stations covering the entire study area (Figure 2C). Gaps in the evapo-transpiration (ET) data were filled using the Blaney-Criddle equation (Allen and Pruitt, 1986) illustrated in Equation 1.
where p is the mean monthly percentage factor of total annual daytime, as each month has a unique value of (p), based on the latitude coordinates (Supplementary Table 4). The c is an adjustment factor which depends on the daily wind speed, daily minimum relative humidity, and the ratio of daily actual sunshine hours to daily maximum sunshine hours, which is equal 0.65 for arid regions (Allen and Pruitt, 1986).
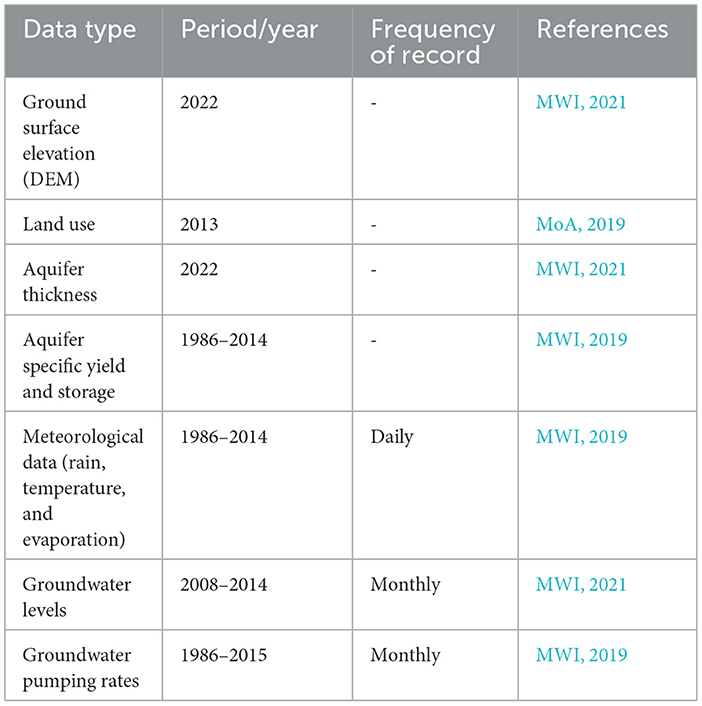
Table 1. Source and details of Dead Sea Basin database.
2.3.2 Model set up, parameterization, and observations
The Newton version of MODFLOW-2005 (MODFLOW-NWT) was used in this study to develop the model due to its improved ability to handle drying and rewetting of cells for unconfined aquifers (Niswonger et al., 2011). The MODFLOW code solves the three-dimensional groundwater flow equation (Equation 2), under non-equilibrium and heterogeneous conditions is,
where, Kx, Ky, and Kz are the hydraulic conductivity in the x, y, and z axes [L/T], h is the hydraulic head [L], W is a volumetric flux per unit volume [T−1], Ss is the specific storage [L−1] and t is the time [T].
Given the focus on aquifer-scale water balance analysis in this study, a single-layer model of the top aquifer was discretized into 154 rows and 110 columns using with 1 km × 1 km cells. Groundwater head-dependent flow into and out of the model along the eastern, western and northern boundaries of the model was represented in the model using a head-dependent flux boundary condition implemented using the MODFLOW GHB package. Given large uncertainty in groundwater flow along these boundaries, the GHB package was calibrated using a factor to adjust the observed initial groundwater head and hydraulic conductance of the boundary cells which assumed to be steady. The uncertainty in the estimation of this parameter was then quantified during model calibration and uncertainty analysis.
The southeastern boundary was designated as a no-flow boundary due to its large elevation gradients and steep slopes. Both the central eastern and northeastern boundaries are major outflows from the model domain and were assumed to be general head boundaries (Al-Assa'd and Abdulla, 2010). Other outflow boundaries include the surface drainage network for the Mujib basin which directly draining to the Jordan Valley Rift (Farhan et al., 2018). This was represented in the model using the drain package of MODFLOW.
Recharge was represented as a fraction of spatially and temporally variable rainfall and was adopted during model calibration. The B2/A7 aquifer outcrops in the western areas and receives considerable recharge. The fraction of rainfall that gets converted into recharge was then estimated during model calibration by calibrating the model to observed groundwater levels. In parts of the western areas of the model, the aquifer is overlain by basaltic units that also contributes to recharge (Al-Kharabsheh and Alatoum, 2013). Uncertainties in the estimation of recharge and correlated parameters like hydraulic properties were quantified during model uncertainty analysis.
Data of groundwater pumping at 531 pumping wells was obtained for this study. Given uncertainties in the groundwater pumping data, modeled extraction was permitted to vary by up to 10% during model calibration by introducing a parameter corresponding to pumping. Pumping rates were assigned to model cells closest to pumping location and groundwater extraction was represented in the model using the MODLOW WEL package. Groundwater contribution to evapotranspiration was represented in the model using the evapotranspiration (EVT) package and assumed to be proportional to AET rates. As vegetation is quite sparse and scattered in this arid region, the groundwater contribution to ET is low. It was assumed that groundwater only contributes to ET when the water table is within 5 m of the ground surface. A parameter was introduced to adjust the ET rate during model calibration and uncertainty analysis.
Groundwater generally flows toward Wadi Mujib in the western side of the model domain, which acts as the main collector of outflows (Al-Kharabsheh and Alatoum, 2013). The outflow boundaries toward the east were represented using a combination of MODFLOW drain cells and as General Head Boundary Cells along parts of the western boundary (Figure 2C).
Spatially variable hydraulic aquifer properties comprising hydraulic conductivity, specific storage and specific yield were represented in the model using pilot points (Doherty, 2015). Each pilot point represents a point in space at which hydraulic conductivity and specific yield and storage were estimated during model calibration. Hydraulic properties at other models' cells are then interpolated from the pilot points. The parameterization adopted in this study is summarized in Table 2.
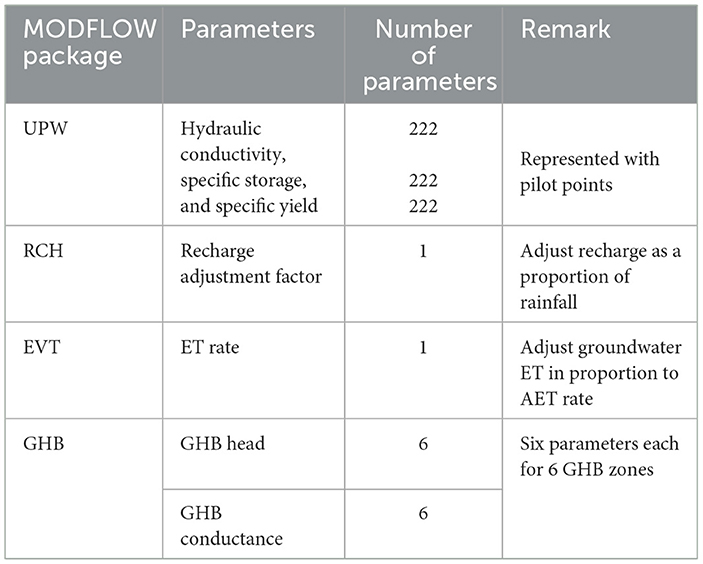
Table 2. Model parameterization of PEST.
2.3.3 Model calibration and validation
The first stress period in the model considered a steady state based on historical data averaged from Jan 2000 to Dec 2008. A transient simulation was applied for the remaining 6 years (Jan 2009 to Dec 2014) using monthly stress periods. Groundwater level observations for this period were available from 18 observation bores in the study area comprising a total of 882 observations. Model parameters were adjusted during the calibration procedure to improve the match between observations and model-generated groundwater levels.
The PEST-IES algorithm introduced by White (2018), was employed to calibrate the model and generate an ensemble of posterior parameters that minimize the error between observed data and model simulations. The algorithm starts with an ensemble of randomly generated parameter fields based on the prior distribution. In this study a prior distribution comprising 100 realizations of model parameters were used for implementing the PEST-IES approach. Through successive iterations, these parameter fields are adjusted to improve model calibration, minimizing the misfit between model simulations and observations. The PEST-IES algorithm minimizes the weighted sum of squared residuals (L2 norm) as the objective function. In this study, only one observation group for groundwater levels was available, and a unit weight was assigned to all observations in the objective function. The PEST++ approach employs a Bayesian approach for identifying a posterior distribution of parameters (White et al., 2020).
PEST-IES uses the simulated equivalents of groundwater levels to compare with the observations to calculate the calibration objective function and its sensitivity to the model parameters encapsulated in a Jacobian matrix. Groundwater level observations from 18 observation well's locations were used in the calibration exercise for this purpose. During the calibrations process PEST-IES progressively improves the match between observations and simulations by adjusting parameters in the ensemble.
The calibrated model was independently validated by using observed data over a 2-year period between Jan 2013 and Dec 2014. The model was run for this 2-year period with updated parameter suite obtained from calibration.
Three performance metrics—the Coefficient of Determination (R2), the Root Mean Squared Error (RMSE) and Bias were used to evaluate model performance. Bias is the average residual or difference between observed and simulated water levels. A threshold of Bias ≤ (12 m) is defined acceptable for transient modeling by Ministry of Water and Irrigation of Jordan & German Federal Institute for Geosciences and Natural Resources guidelines in groundwater modeling (MWI and BGR, 2017).
2.4 Estimation of aquifer safe yield
Safe yield represents the amount of replenishable groundwater that can be sustainably extracted without impacting on the quantity and quality of available reserves. As a standard practice by the Ministry of Water and Irrigation, safe yield is estimated as a fraction of long-term average recharge. In this study we used the water balance estimates from the probabilistic model to investigate the implications of safe yield estimation in comparison with the (1) fraction of recharge approach and a more recently reported, (2) recharge mass curve analysis (Loaiciga, 2017).
Ministry of Water and Irrigation uses 80% of estimated recharge as the safe yield for the Dead Sea Basin Driscoll (2002) also adopted a safe yield value of 80% of rainfall in South Dakota USA. While it provides an easy method for developing groundwater management rule, the method assumes that 20% of recharge would meet other water requirements of the basin including the environmental flow needs. It is noted that this approach is unable to generalize an absolute value for the safe yield as it can't consider temporal variability in groundwater pumping rates and climate parameters.
The mass curve method was therefore used to more accurately estimate the safe yield taking into account the effect of dry years on allowable pumping values based on simulation results from 1995 to 2014. To apply this method, the cumulative recharge is plotted against time, and the aquifer storage (capacity) is plotted vertically at the locations of transition from periods of low recharge representing (the droughts) to wet periods. Then tangential slopes of the highest points of the aquifer capacity were drawn to each period, where the minimal slope of intersect to the mass curve represents the safe yield value. AutoCAD 2023 was used to accurately plot the tangential slopes. In this research, monthly cumulative GWR was used to construct the mass curve enabling estimation of monthly safe yield. Long-term safe yields can then be obtained from the average of the monthly values.
2.5 Climate change projections
Future groundwater level was simulated by applying end-of-century projected trends to the historical record of both rainfall and evapotranspiration. The historical “present-day” period covering 1995 to 2014 was simulated using historical observations as described in section 2.3.1. To simulate the future period from 2015 to 2100, the historical observations were concatenated, and trends were projected for different climate change scenarios for the period 2015 to 2100. That is, in 2015 the adjustment was zero and in 2100 the adjustment was equal to the end-of-century value (Table 3) with a linear trend applied in between. Both annual and seasonal projected adjustment trends were considered with the seasonal trends determined based on an extended boreal winter (ONDJFMA) and summer (MJJAS) seasons. The end-of-century adjustment factors for both annual and seasonal changes were obtained in accordance with Arjdal et al. (2023). The future annual adjustments for temperature were added as reference without inclusion in the modeling process. This study was selected as at the time of writing, it was the only available study with CMIP6 climate change factors for both precipitation and evapotranspiration from the same model ensemble. Their study was based on the bias-corrected projections from a 17-member, CMIP6 GCM ensemble, under emissions scenarios SSP2–4.5 and SSP2–8.5 (see their Figures 1, 3). For reference, a “No Climate Change” projection was run without applying any climate change adjustment factors, i.e., a case assuming the present-day climate remains unchanged into the future.
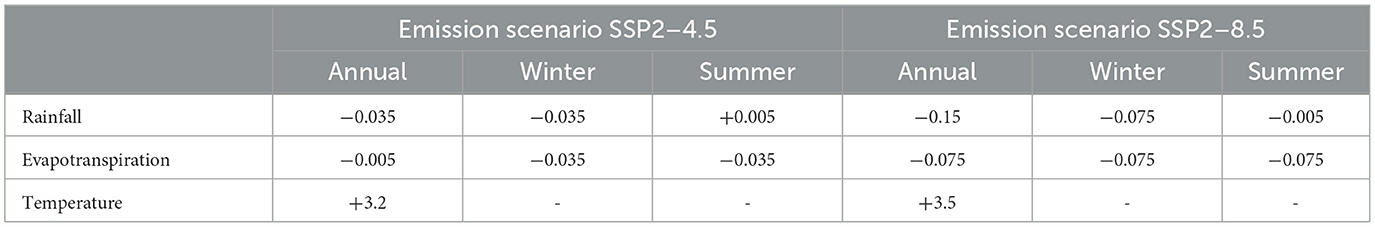
Table 3. End-of-century adjustment factors [mm/day] for rainfall and evapotranspiration, and (°C) for temperature [extracted from Arjdal et al. (2023)].
Future changes in land use and groundwater pumping rates have not been considered in this analysis and it is assumed that groundwater recharge remains the same fraction of rainfall as estimated for the historical period. This is a simplifying assumption, in most realistic contexts reduction in groundwater recharge is likely to be higher than reduction in the amount of rainfall. However, in the absence of more comprehensive approaches for modeling future recharge, this scenario of reduction in recharge proportional to reduction in rainfall provides a conservative estimate to evaluate groundwater balance changes in the region in future.
3 Results
3.1 Model calibration and validation
Figure 4 provides an overview of the performance of the calibrated model in matching observed groundwater levels in 18 monitoring wells located in different parts of the aquifer. Figure 4A shows the distribution of bias of simulated groundwater levels in comparison with the observations. Most biases are within +/−2 m of the observed values, and at the extremes the biases are −7 m and +5 m. The spatial distributions of the other performance metrics are shown in Figures 4B, C. Model calibration using observed groundwater levels resulted in significant reduction in the objective function value (Phi) over 17 PEST-IES iterations. The minimum, mean and maximum value of objective function in each iteration is shown in Supplementary Figure 2. Figure 5 shows the resulting match between observed and simulated groundwater levels.
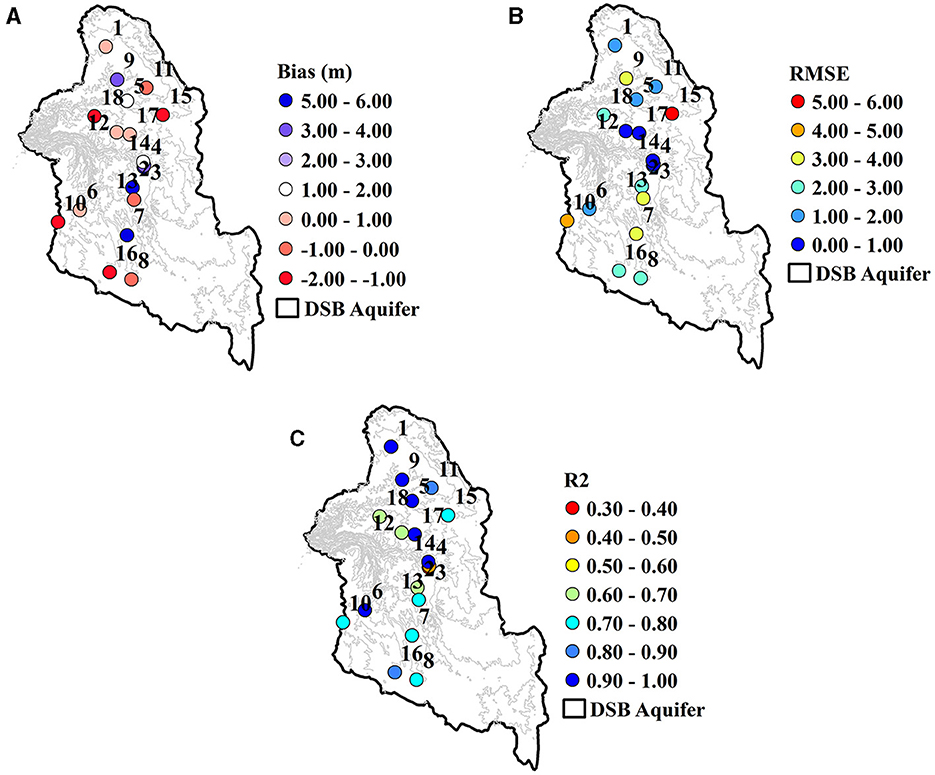
Figure 4. Model performance metrics for the calibration period January 2009–December 2012. (A–C) The spatial distribution of model performance metrics at each of the observation wells for bias, root mean square error and coefficient of determination (R2), respectively.
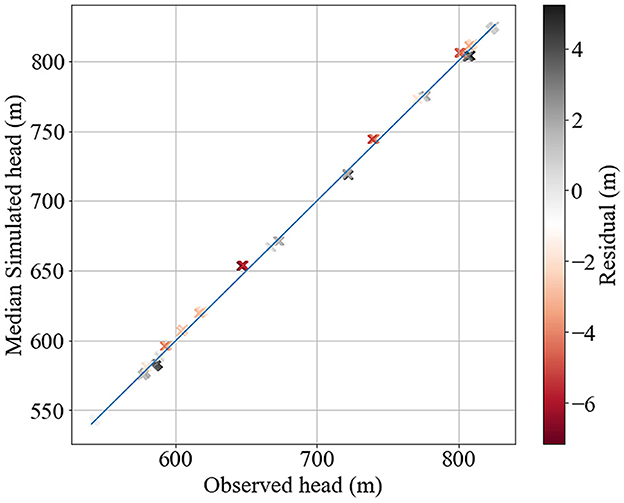
Figure 5. Match between the observed and simulated groundwater head.
At most of the bore locations the model simulates the observed trend of decreasing groundwater levels (Supplementary Figure 4). Uncertainty in geology and assignment of bores to aquifers often result in large residuals in modeling contexts like this where the system is represented as a single layer model. However, it is noteworthy that the purpose of modeling is quantification of relative changes in groundwater levels and water balance corresponding to historical and climate change scenarios. A distribution of residuals with an average residual close to zero is favorable for such purposes.
Model calibration resulted in a posterior parameter distribution with reduced uncertainty in many parameter values. Prior and posterior distribution of a selection of 12 parameters are shown in Figure 6. It can be observed that uncertainty in some parameters is reduced due to the calibration process. This implies that information content in groundwater level observations can reduce uncertainty of those parameters.
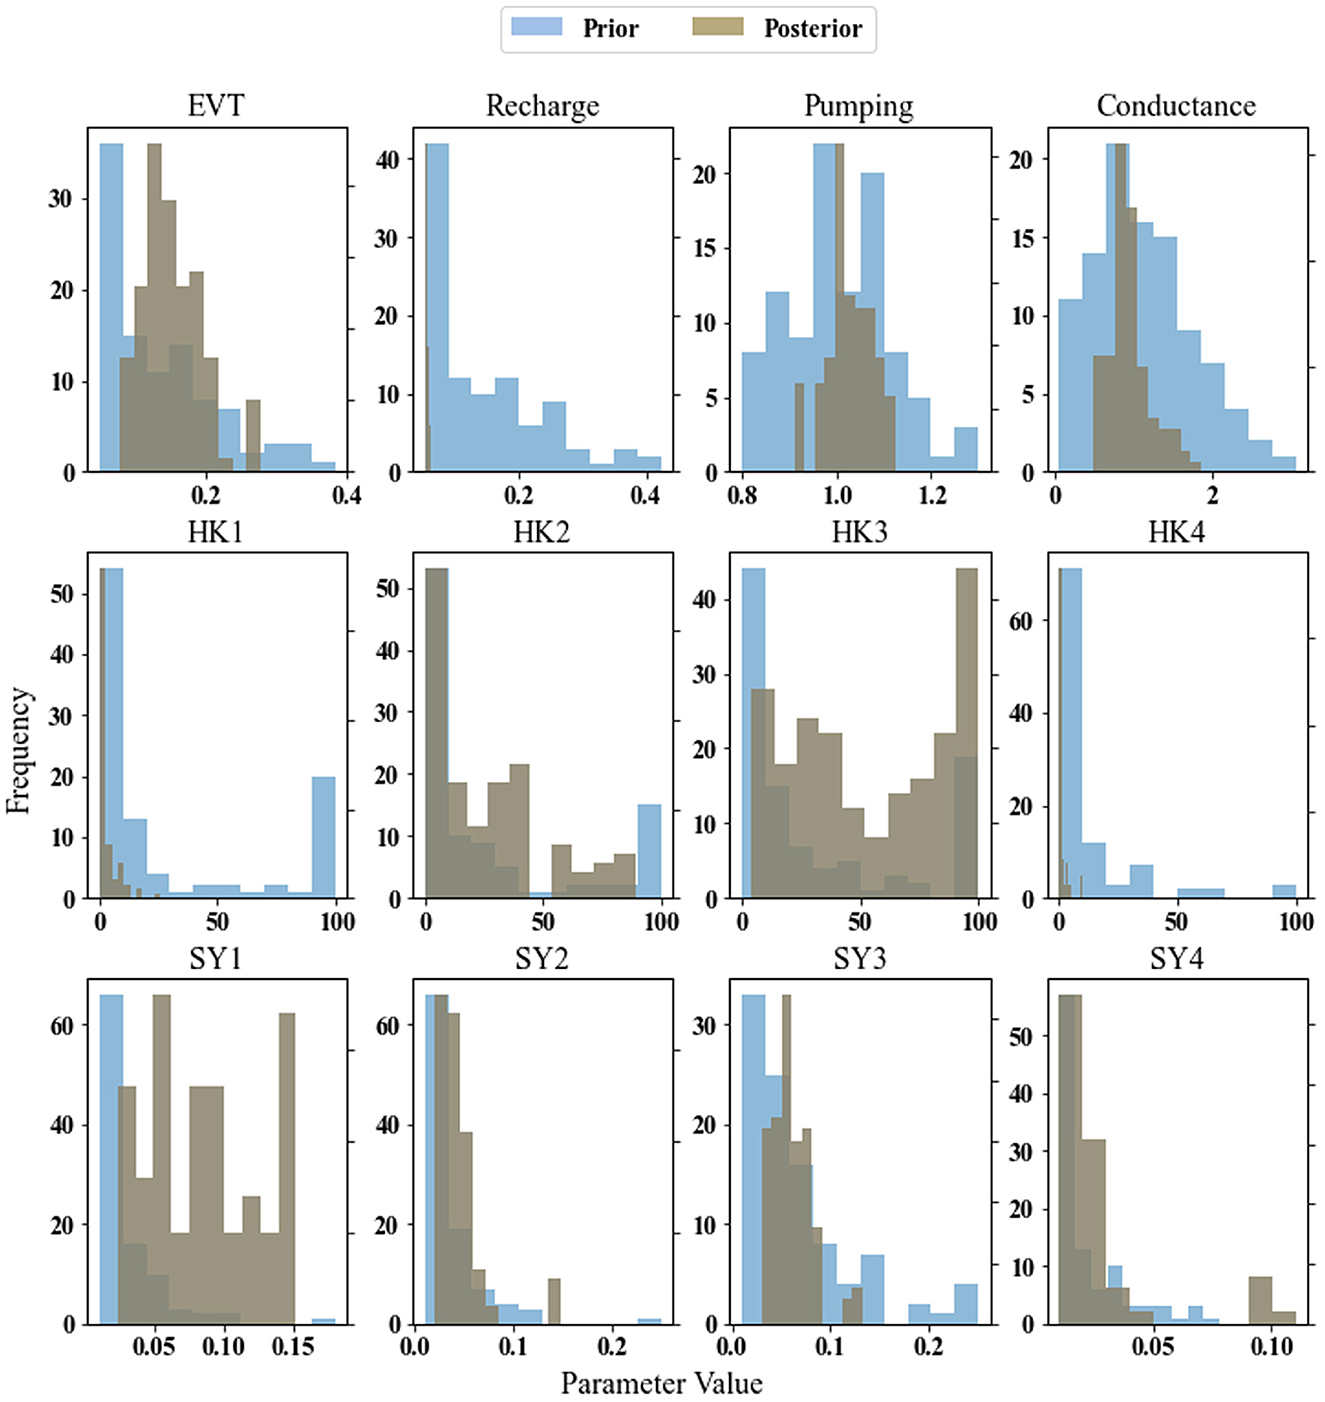
Figure 6. Prior and posterior distribution of 12 parameters corresponding to evapotranspiration, recharge, pumping, GHB conductance, hydraulic conductivity, and specific yield.
The calibrated hydraulic conductivity values vary spatially from 0.059 to 94.9 m/d indicating significant spatial heterogeneity across the 222 pilot point locations. Similarly, the specific yield ranges from 0.011 to 0.22 m−1 and the specific storage values rages from 4.2*10−5 to 7.5*10−3 (see Supplementary Figure 3).
The model was validated against observed groundwater levels from January 2013 to December 2014. The model performance over the validation period is shown in Figure 7. This suggests that the model is performing well and capturing the dynamics of the aquifer system accurately. Figure 7A shows that most model biases are within +/−4 m of the observed values, while extreme values were noticed in the bores around Siwaqa fault. The spatial distribution of other performance metrics is shown in Figures 7B, C.
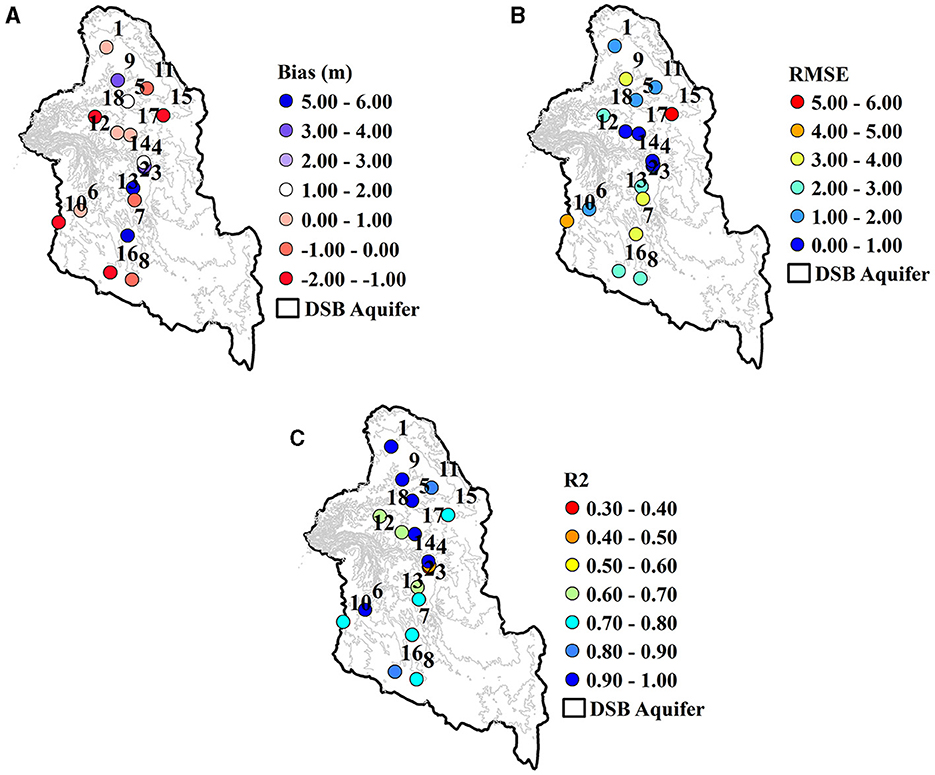
Figure 7. Model performance metrics for the validation period January 2013–December 2014. (A–C) The spatial distribution of model performance metrics at each of the observation wells for bias, root mean square error and coefficient of determination (R2).
The calibration process estimated the mean groundwater recharge as 5.1% of the annual mean rainfall, which is consistent with the results of Alraggad et al. (2017) who found that the recharge over the study area is ~5% of precipitation. The average value of water balance components and their standard deviation from 100 posterior model runs is shown in Figure 8. The annual average recharge over the calibration period was estimated to be 10.6 mm/yr with a standard deviation of 3.2 mm/yr. In addition to this, the lateral inflow (GHB IN) across the boundaries from adjacent aquifers was estimated to be 9.3 mm/yr with a standard deviation of 2.3 mm/yr.
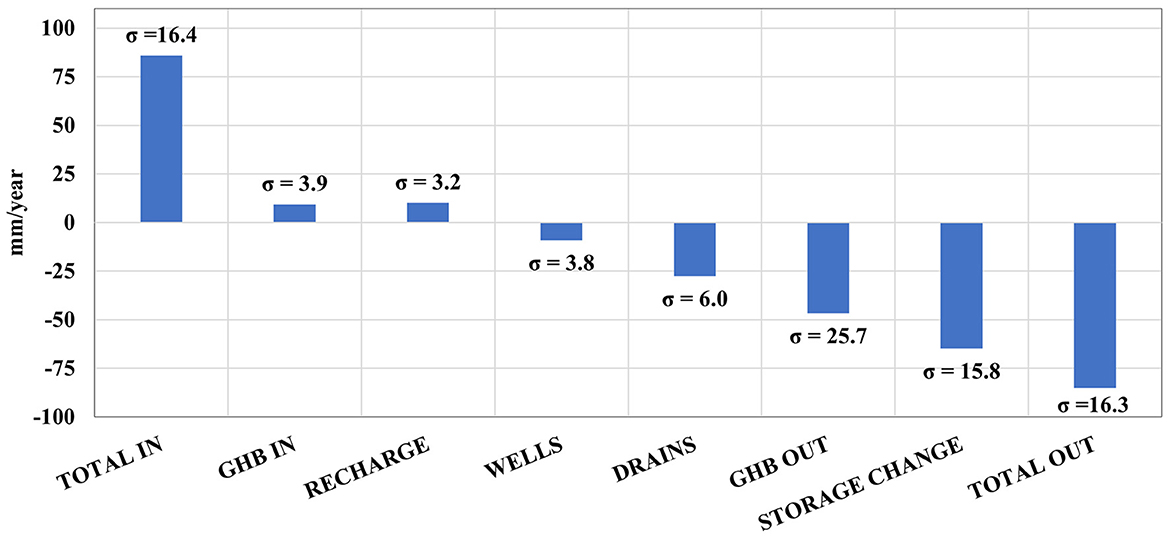
Figure 8. The average water balance of PEST calibration runs.
The largest component of outflow corresponds to the to spring and drain discharges along the western boundary. The drain flows were estimated to have average value of ~27.6 mm/yr with standard deviation of 6.0 mm/yr. This high flow rate indicates that there is a large amount of water flowing out from the aquifer through the springs in areas of aquifer outcrop/sub-crop. It is noteworthy that there is large uncertainty in these estimates. Additional spring and drain discharge volume data would help to reduce uncertainty in these estimates. Annual average pumping was estimated to be 9.2 mm/yr with a standard deviation of 3.8 mm/yr.
The total inflow was found to be double of recharge. Groundwater storage contributes to the discharge that exceeds recharge volumes and results in depletion of storage. It was found that groundwater storage was depleting at an average rate of ~64.8 mm/yr over the calibration period. Considering the average calibrated specific yield of 0.06, this corresponds to a groundwater level decline close to 1 m/yr across the regional aquifer system. Several studies have reported large groundwater declines in the regional B2/A7 aquifer. Past studies (Hobler et al., 2001; Margane et al., 2002b, 2015) reported groundwater level decline of 2.5 m/yr leading to a total groundwater level drop of 45 m over the last 18 years.
3.2 Safe yield estimation
Based on the calibrated model, the mean annual recharge was estimated to be 10.6 mm/yr which corresponds to a safe yield of 8 mm/yr according to the 80% of recharge value recommended by the Ministry of Water and Irrigation (Figure 9). In comparison, the mass-curve method (Figure 10) the average safe yield is estimated to be ~8.6 mm/yr (Table 4). The latter value is less than the mean annual groundwater extraction rate of 9.3 mm/yr (MWI, 2020) suggesting that current exploitation is slightly exceeding the safe yield value and possibly contributing to the observed declining groundwater levels.
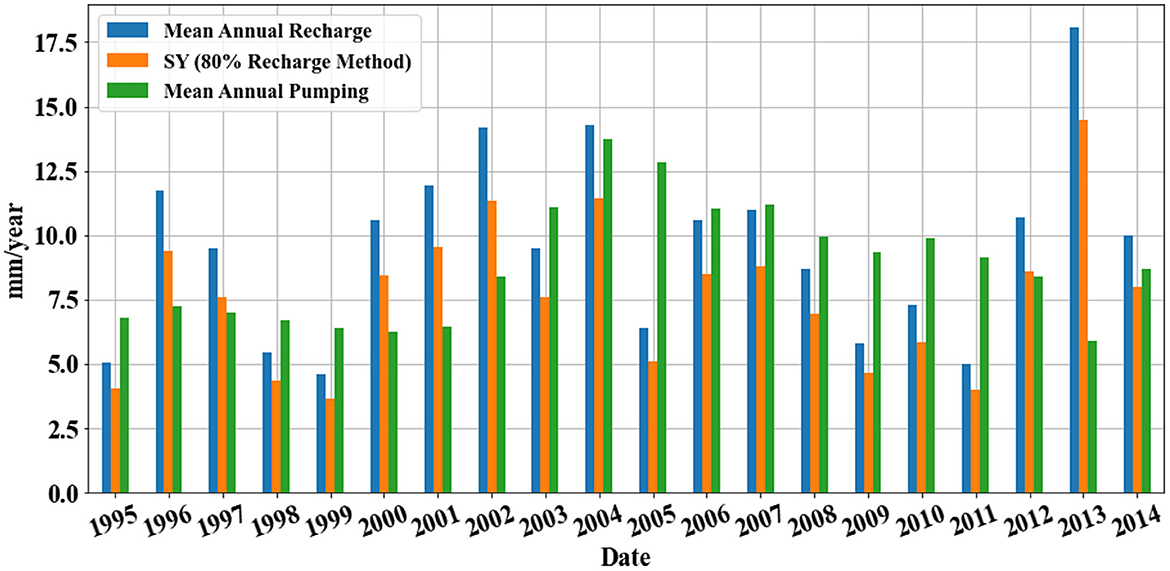
Figure 9. Timeseries of mean annual historical groundwater recharge, current annual pumping, simulated the safe yield based on (%80 of Recharge Method) for period (1995–2014).
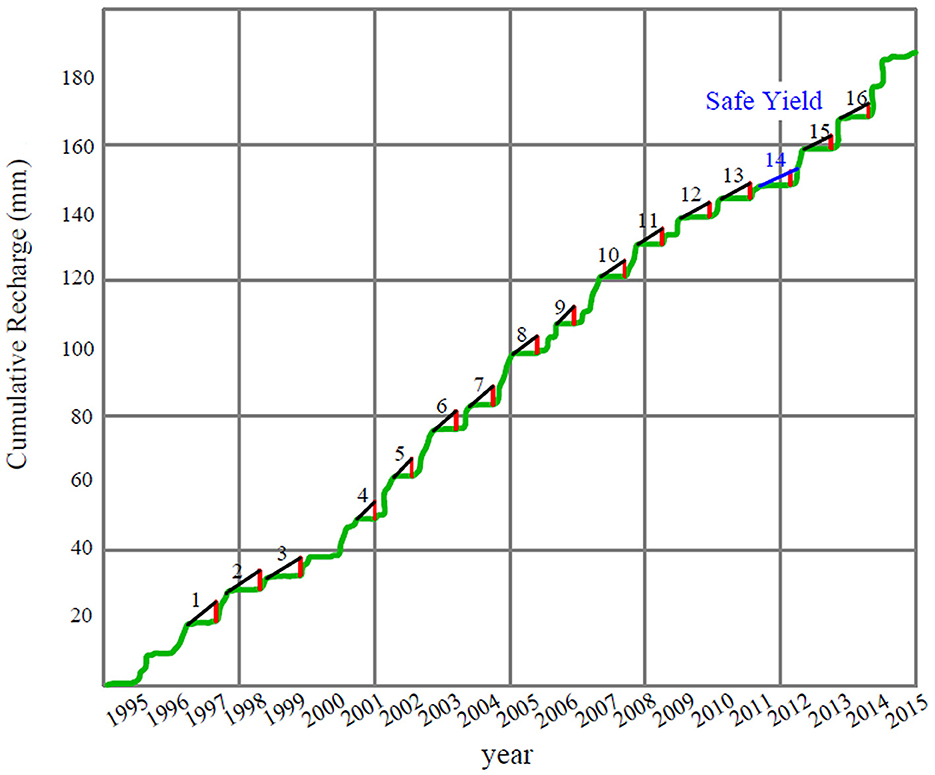
Figure 10. Mass curve plot (green), where vertical lines (red) illustrate the aquifer capacity at points of transition between dry and wet days, inclined lines show the slopes from the above point of the capacity line to the tangent points, and the blue line refers to the minimum slope value (safe yield).
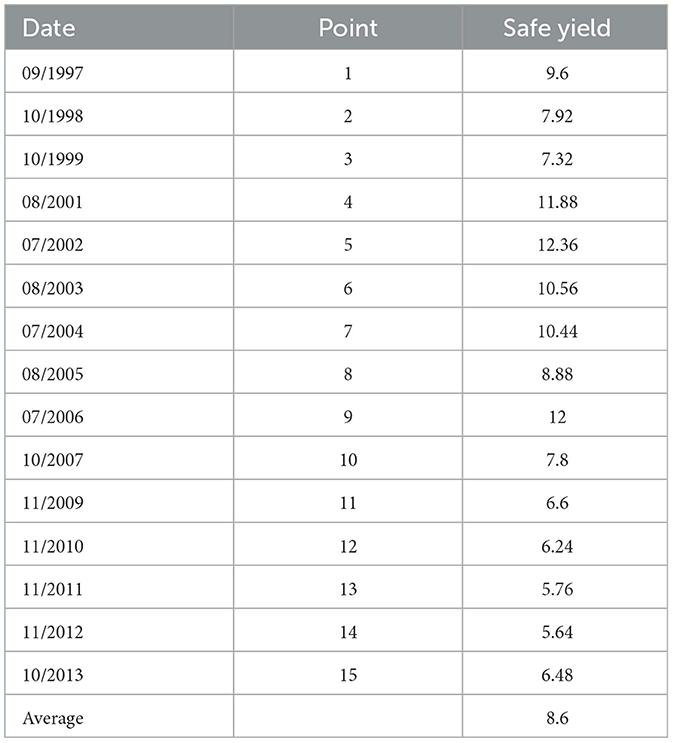
Table 4. Values of estimated safe yield [mm/day] according to mass-curve method, Loaiciga (2017).
Both methods resulted in similar values of safe yield. When long-term average groundwater extraction is close to these safe yield value, the long-term sustainability of the aquifer should be ensured. However, as discussed in the previous section, groundwater level is declining regionally in the system and indicates unsustainable use of groundwater. This is because groundwater discharge is inadequately represented in the safe yield calculations. In the first method we assume that 20% of annual average recharge would meet all other environmental water needs. This is not true for this case study. For example, the simulated median drain discharge volume of 26 mm/yr is much more than the recharge from rainfall and is potentially being met currently by depletion of storage.
This indicates potential shortcomings in the estimation of safe yield as a fraction of long-term recharge without accounting for all the environmental functions of water and natural discharge of groundwater. The Mass-Curve Analysis method should ideally account for the natural groundwater discharge in the calculations to ensure that only net recharge is use for groundwater extractions. However, in practical contexts like that of the Dead Sea Basin, it is difficult to measure/estimate this discharge volume and could have been underestimated in the past calculation of safe yield. In this study we used the probabilistic modeling approach to estimate the discharge while accounting for simulation uncertainties.
Simulation for the historical period of 1995 to 2014 revealed that groundwater discharge into drains has consistently been decreasing over the years. This is potentially due to decrease in groundwater storage and levels over these years. Figure 11 shows the decline in groundwater storage and corresponding decline in groundwater discharge in the drainage network.
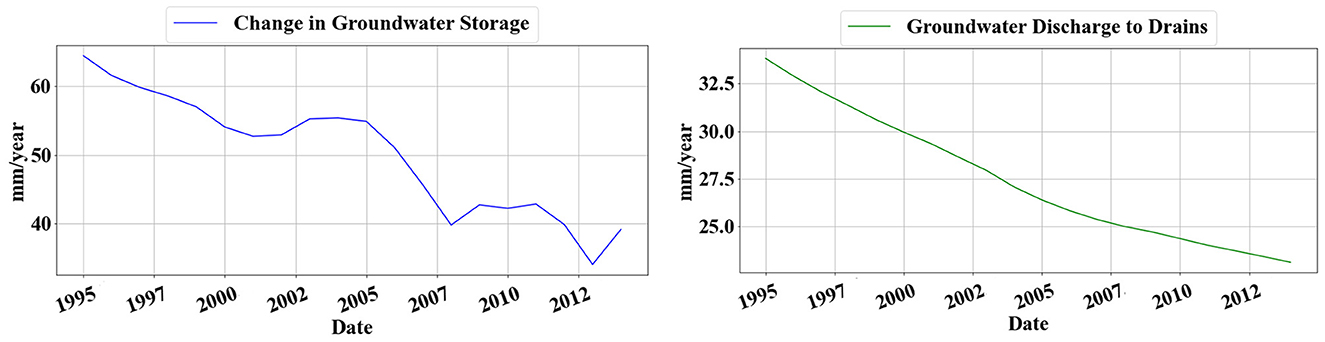
Figure 11. Simulated change in groundwater storage and corresponding change in drainage fluxes between 1995 and 2014.
3.3 Climate change projections
Figure 12 shows the spatially averaged monthly groundwater level projections to the end of the century assuming an unchanging climate and a changing climate under two CMIP6 emissions scenarios SSP2–4.5 and SSP2–8.5, under both annual and seasonal projected trends. Results are presented relative to the trends in historical data to highlight the effect of climate change independent of the existing declining trends. It is noteworthy that the predicted decline in groundwater levels due to climate change scenarios is additional to the large decline in groundwater levels that is already observed (as shown by the “non-changing” climate reference curve). The influence of the projected changes in rainfall and evapotranspiration is relatively low compared to existing groundwater level decline. Climate change scenarios indicate an overall decrease in spatially averaged groundwater levels of ~0.3 to 0.4 m by the year 2100. The difference between the worst-case SSP2–8.5 annual curve (red) and the non-changing climate curve (blue) is ~0.15 m (Figure 12).
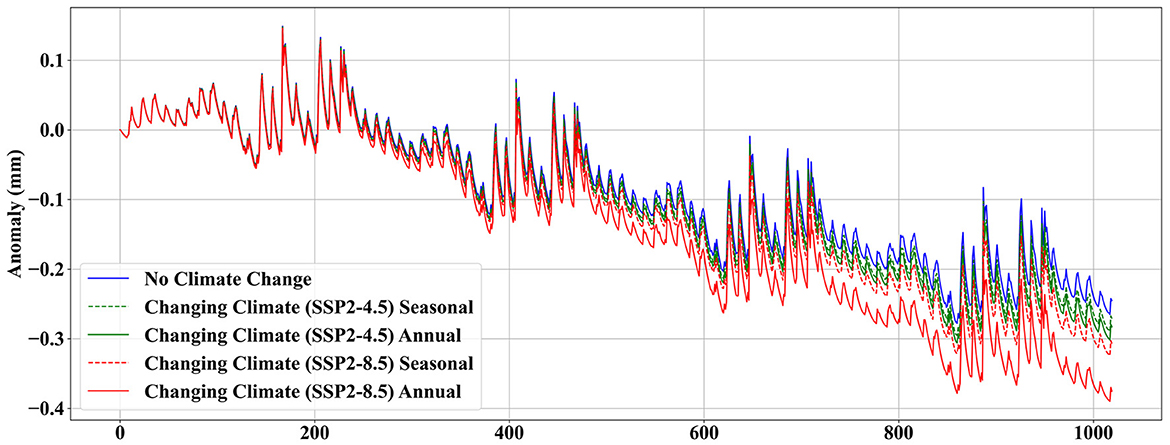
Figure 12. Spatially averaged, monthly groundwater level projections of anomaly relative to 2014 level for a non-changing climate (blue), the seasonal and annual changes for SSP2–4.5 emission scenario (dotted and solid yellow curves, respectively), and the seasonal and annual changes for SSP2–8.5 emission scenario (dotted and solid red curves, respectively).
Also seen in Figure 12, is the fact that projections made using seasonal trends result in a smaller decrease that those using annual trends. The SSP2–4.5 annual and seasonal adjustments show an average anomaly of −0.10 and −0.11 m, respectively, whilst the SSP2–8.5 annual and seasonal adjustments show an average anomaly of −0.10 and −0.13 m, respectively.
Figure 13 shows the spatial distribution of projected changes in groundwater level computed as the percentage difference between the mean of the end of century time slice (2080–2099) and the mean of the historical period (1995–2014). The analysis indicated that groundwater levels would decline by up to 25 m by the end of the century. The largest projected changes from the SSP2–4.5 annual and seasonal climate change factors are respectively −21.53 and −21.51%, whereas the SSP2–8.5 annual and seasonal changes are respectively −21.60 and −21.56%.
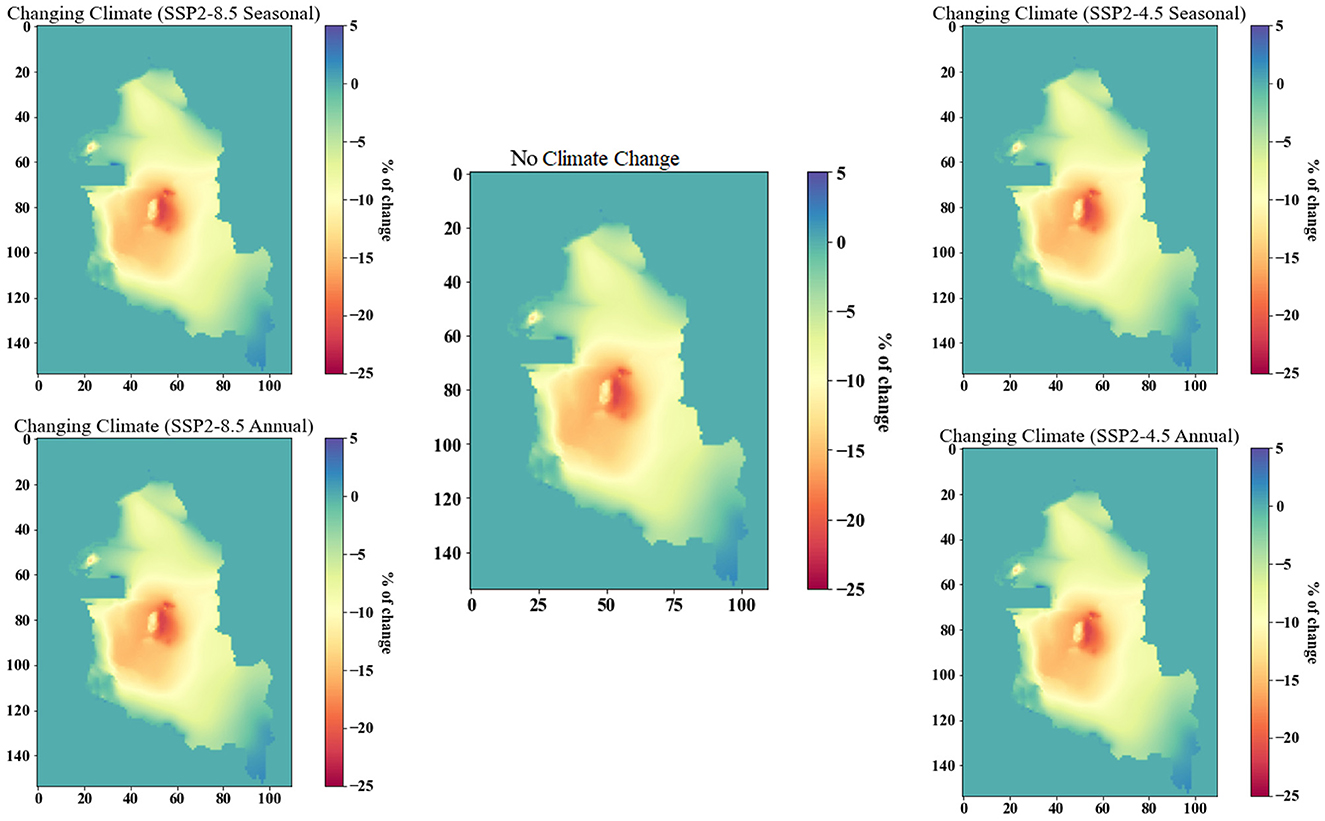
Figure 13. The mean percentage change of GWLs for the No Climate Change scenario, and SSP2–4.5 and SSP2–8.5 emission scenarios (annual and seasonal change) for period (2080–2100), relative to the mean historical GWL (1995–2014).
The western boundary regions and some central regions indicate greater declines in average GWLs due to a combination of shallower GWLs, complex geological structure and slopes and increased water extraction. The average groundwater recharge would decrease by 26.82 and 24.30% respectively under the annual and seasonal adjustments of the SSP2–4.5 scenario, and likewise an expected decrease by 41.22 and 30.60% respectively under the annual and seasonal adjustments of the SSP2–8.5 scenario.
Based on the assumption of the safe yield being 80% of the mean annual recharge,—threshold of EoC simulated rainfall—for SSP2–4.5 and SSP2–8.5 emissions, was applied to estimate the safe yield for period (2080–2099), with respect to historical period (1995–2014). Each date from future run was compared to the equivalent date from historical baseline, for example safe yield of year 2000 is equivalent to the value in year 2080. Details of safe yield calculations are shown in Supplementary Table 2. Accordingly, the average safe yield would decrease by 18.95 and 16.09%, for the annual and seasonal alterations of the SSP2–4.5 scenario respectively, and 25.13 and 24.81% respectively for the annual and seasonal variations for the SSP2–8.5 scenario, during the EoC period (2080–2099) to maintain aquifer sustainability. However, as discussed in the earlier sections, safe yield calculations should ideally consider the effects of natural discharge conditions of groundwater and how they affected by over-exploitation and other factors like climate change.
4 Discussion
The probabilistic modeling study provides valuable insights about groundwater balance in the B2/A7 aquifer in the Dead Sea Basin and how it is affected by changes in recharge and discharge conditions over historical and future climatic conditions. The calibration and validation results indicated an acceptable performance of the MODFLOW model as most groundwater levels biases within ±2 m range. The calculations of water balance results are in agreement with Rodiger et al. (2020) who estimated the recharge and change in water levels across the Dead Sea Basin. In our model, the annual recharge estimated using the calibrated model indicates that ~5% (53 mcm) of the annual average rainfall contributes to groundwater replenishment under historical conditions based on monthly water balance, while it was found to be 52 mcm as per Rodiger et al. (2020). A similar conclusion obtained by Alraggad et al. (2017) who calculated the annual recharge as 5.2% from the rainfall (56 mcm). On other the hand, under SSP4.5 and SSP8.5 scenarios, the groundwater recharge was predicted to experience a decrease by ~30 and ~40%, respectively.
Lateral flow of groundwater from adjacent aquifers also forms a major component of groundwater inflow with an average annual value of 26 mm. Similar results obtained by Rodiger et al. (2020) who indicated that the mean annual outflow boundary (GHB OUT) is 25.6 mm (21.1 mcm). Others, for example Abdulla and Al-Assa'D (2006) and Gropius et al. (2022) calculated the annual outflows with values of 19 and 20.5 mcm, in the given order. Simulation analysis indicated that groundwater discharge into springs and drainage network in the region could potentially be a major component of groundwater discharge (Figure 11). While groundwater extraction is comparable to and less than estimate long-term recharge, total groundwater outflow is in excess of the annual average recharge leading to declining trends in groundwater levels. Declining trends in groundwater storage is also reflected in the declining trend in simulated groundwater discharge into the drainage network.
The analysis indicates that quantification of natural groundwater discharge rates and accounting for that in safe yield estimation is critical for sustainable management of groundwater. Allocating large fractions of annual average recharge for extraction and consumptive use may have potentially led to over exploitation and unsustainable use of this aquifer. The results showed that if the trend of current water pumping remains, groundwater levels would experience a decease by ~21% under “No Climate Change” scenario and ~40% under the annual SSP2-8.5 scenario, Section 3.3.
Groundwater anomalies levels are in decline throughout the aquifer with spatially averaged levels projected to decrease ~0.25 m by the end of the century assuming no change to the climate. Climate change scenarios were found to exacerbate the declining trends by small amounts compared to groundwater depletion caused by extraction. Relatively small impact of climate change on groundwater levels is potentially due to the relatively small amounts of groundwater recharge in this arid region. However, GWL was expected to decline up to 25 m by the end of century, likewise, Rodiger et al. (2020) predicted a drop in GWL between 21 and 25 m by 2081.
Potential impacts of unsustainable use include continued decline in water levels, drying up of wells and springs, land subsidence, and deterioration of water quality. Some of these impacts have already been experienced in parts of the region. It is of utmost importance to safeguard the aquifer and ensure its long-term viability and the urgency of implementing adaptive management strategies to mitigate the potential impacts of current water pumping practices. This requires reconsidering water allocation, pumping rates, and sustainable use of the aquifer. Implementing measures to enhance water conservation and explore alternative water sources may be necessary to ensure the long-term sustainability of groundwater resources in the face of changing climate conditions.
Further research and monitoring are also crucial to refine the understanding of groundwater dynamics in the study area and evaluate the effectiveness of mitigation measures and to strike a balance between their ecological significance and the aquifer's long-term health. The findings of the study points toward the need to measure and monitor groundwater discharge rates and volumes at the springs and drainage network. Additionally, considering the uncertainties associated with climate change projections, it is essential to regularly update and reassess the models and strategies used for groundwater management to adapt to latest information and changing conditions.
The heterogeneity of the aquifer hydraulic properties suggests that different regions within the aquifer may have varying capacities for groundwater flow and recharge (Rodiger et al., 2020). Mapping the zones of high rates of groundwater recharge and protecting these zones is of utmost importance. This leads to identifying areas of high permeability that may serve as preferential pathways for groundwater recharge and areas of low permeability where recharge may be limited. Moreover, the value of the specific storage and yield values helps in determining sustainable pumping rates and designing appropriate management strategies to ensure the long-term viability of the aquifer.
The projected decrease in precipitation and evapotranspiration suggests a future decrease in groundwater recharge which will further impact water availability. Lower recharge rates may lead to reduced groundwater replenishment, potentially impacting the sustainability of aquifer systems. Conversely, the projected increase in evapotranspiration implies higher water demand from the land surface and vegetation. The use of future changes of CMIP6 GCMs and emission scenarios allows for a comprehensive assessment of potential future climate conditions, but these models have inherent limitations and uncertainties. Ongoing research and model improvements are necessary to enhance the accuracy of future climate projections.
There are still some limitations and challenges to acknowledge:
1. Spatial and Temporal Resolution: Climate models on the region operate on coarse grids due to lack of regional climate models over Jordan. However, modeling with a certain spatial resolution, and finer grids often require significant computational resources. Improving spatial resolution can provide more detailed information, but it also increases computational demand.
2. Limited historical data: Limited amount of groundwater level observations was available to do the model calibration and uncertainty analysis in this study. However, it is noteworthy that large uncertainty existed in the prediction groundwater levels and flow volumes, and in addition, the reduction in lateral recharge corresponding to GHB boundaries is not considered. Data from more monitoring wells spread across the region is required for better estimation of aquifer characteristics and flow conditions. Monitoring of groundwater discharge at springs and other outlets are also important to improve groundwater balance and predictive analysis.
3. Human Activities. In this study the effect future water demand was not accounted. Similarly, groundwater extraction data obtained from public sources may not be reflective of unauthorized or illegal use that may be present. Running more complex scenarios combining changes in water supply (i.e., climate projections) and demand would provide a more comprehensive understanding of future groundwater availability.
5 Conclusion
This study investigates the groundwater balance in the Dead Sea Basin aquifer in Jordan using a process-based groundwater flow model developed using the MODFLOW code. Probabilistic simulation of groundwater balance components was undertaken and their effect on estimation of the aquifer's safe yield was investigated. The study also undertook a preliminary analysis of the impact of climate change on groundwater levels in the aquifer. Spatially heterogeneous groundwater recharge for the historical period was estimated as a function of rainfall. Simultaneous calibration the recharge and aquifer hydraulic property parameters enabled quantification of predictive uncertainty in the water balance fluxes. The model indicated that annual average recharge constituted 5.1% of the precipitation. The study revealed that accounting for natural groundwater discharge components like springs and drain flows is important to estimate safe yield. Simulated groundwater levels matched well with the declining trends in observed water levels which are indicative of unsustainable use. Long-term simulation of groundwater levels indicated that current conditions would result in large drawdown in groundwater levels by the end of the century. Simulation of climate change scenarios using projected estimates of rainfall and evaporation indicates that climate change scenarios would further exacerbate groundwater levels by relatively small amounts.
Data availability statement
The data that support the findings of this study are available on request from the corresponding author SJ sreekanth.janardhanan@csiro.au.
Author contributions
DA: Writing – original draft, Writing – review & editing, Conceptualization, Data curation, Formal analysis, Investigation, Methodology, Validation, Visualization. SJ: Conceptualization, Visualization, Formal analysis, Supervision, Writing – review & editing. NC: Supervision, Conceptualization, Formal analysis, Writing – review & editing. EB: Supervision, Writing – review & editing. RD: Supervision, Writing – review & editing.
Funding
The author(s) declare financial support was received for the research, authorship, and/or publication of this article. DA was supported by a Griffith University Postgraduate Research Scholarship and by a top-up scholarship from CSIRO's Postgraduate Scholarship Program.
Acknowledgments
The dataset used in this study were provided by Ministry of Water and Irrigation of Jordan. The authors are grateful to the Ministry for making access to this data possible.
Conflict of interest
The authors declare that the research was conducted in the absence of any commercial or financial relationships that could be construed as a potential conflict of interest.
The author(s) declared that they were an editorial board member of Frontiers, at the time of submission. This had no impact on the peer review process and the final decision.
Publisher's note
All claims expressed in this article are solely those of the authors and do not necessarily represent those of their affiliated organizations, or those of the publisher, the editors and the reviewers. Any product that may be evaluated in this article, or claim that may be made by its manufacturer, is not guaranteed or endorsed by the publisher.
Supplementary material
The Supplementary Material for this article can be found online at: https://www.frontiersin.org/articles/10.3389/frwa.2024.1380877/full#supplementary-material
References
Abdulla, F., and Al-Assa'D, T. (2006). Modeling of groundwater flow for Mujib aquifer, Jordan. J. Earth Syst. Sci. 115, 289–297. doi: 10.1007/BF02702043
Abed, A. M. (2017). An overview of the geology and evolution of Wadi Mujib. Jordan J. Nat. Hist. 4, 6–28.
Abu-Allaban, M., El-Naqa, A., Jaber, M., and Hammouri, N. (2015). Water scarcity impact of climate change in semi-arid regions: a case study in Mujib basin, Jordan. Arab. J. Geosci. 8, 951–959. doi: 10.1007/s12517-014-1266-5
Al-Assa'd, T. A., and Abdulla, F. A. (2010). Artificial groundwater recharge to a semi-arid basin: case study of Mujib aquifer, Jordan. Environ. Earth Sci. 60, 845–859. doi: 10.1007/s12665-009-0222-2
Al-Kharabsheh, A., and Alatoum, M. (2013). Effect of agricultural activities on water quality deterioration of Mujib basin, Jordan. Curr. World Environ. 8:341. doi: 10.12944/CWE.8.3.02
Allen, R. G., and Pruitt, W. O. (1986). Rational use of the FAO Blaney-Criddle formula. J. Irrigat. Drain. Eng. 112, 139–155. doi: 10.1061/(ASCE)0733-9437(1986)112:2(139)
Al-Mashagbah, A., and Al-Farajat, M. (2013). Assessment of spatial and temporal variability of rainfall data using kriging, Mann Kendall test and the Sen's slope estimates in Jordan from 1980 to 2007. Res. J. Environ. Earth Sci. 5, 611–618. doi: 10.19026/rjees.5.5691
Alraggad, M., Johnsen-Harris, B., Shdaifat, A., and Hamaideh, A. (2017). Groundwater resilience to climate change in the Eastern Dead Sea Basin Jordan. Sci. Res. Essays 12, 24–41. doi: 10.5897/SRE2016.6459
Arjdal, K., Driouech, F., Vignon, E., Chéruy, F., Manzanas, R., Drobinski, P., et al. (2023). Future of land surface water availability over the Mediterranean basin and North Africa: analysis and synthesis from the CMIP6 exercise. Atmos. Sci. Lett. 2023:e1180. doi: 10.1002/asl.1180
Dams, J., Salvadore, E., Van Daele, T., Ntegeka, V., Willems, P., and Batelaan, O. (2012). Spatio-temporal impact of climate change on the groundwater system. Hydrol. Earth Syst. Sci. 16, 1517–1531. doi: 10.5194/hess-16-1517-2012
Dao, P. U., Heuzard, A. G., Le, T. X. H., Zhao, J., Yin, R., Shang, C., et al. (2023). The impacts of climate change on groundwater quality: a review. Sci. Tot. Environ. 2023:169241. doi: 10.1016/j.scitotenv.2023.169241
Doble, R., Janardhanan, S., Foran, T., and Pickett, T. (2022). Groundwater in the South East SA Under Climate Change: Scenario Modelling and Stakeholder Perspectives of Impacts, Adaptation and Management. Canberra, ACT: CSIRO.
Doherty, J. (2015). Calibration and Uncertainty Analysis for Complex Environmental Models. Brisbane, QLD: Watermark Numerical Computing.
Driscoll, D. G. (2002). Hydrology of the Black Hills Area, South Dakota. Rapid City: US Department of the Interior, US Geological Survey.
Farhan, Y., Zreqat, D., Anbar, A., Almohammad, H., and Alshawamreh, S. (2018). Prioritization of W. mujib catchment (South Jordan) through morphometric and discriminant analysis, GIS, and RS techniques. J. Geosci. Environ. Protect. 6:141. doi: 10.4236/gep.2018.64009
Goodarzi, M., Abedi-Koupai, J., Heidarpour, M., and Safavi, H. R. (2016). Evaluation of the effects of climate change on groundwater recharge using a hybrid method. Water Resour. Manag. 30, 133–148. doi: 10.1007/s11269-015-1150-4
Gropius, M., Dahabiyeh, M., Al Hyari, M., Brückner, F., Lindenmaier, F., and Vassolo, S. (2022). Estimation of unrecorded groundwater abstractions in Jordan through regional groundwater modelling. Hydrogeol. J. 30, 1769–1787. doi: 10.1007/s10040-022-02523-3
Guevara-Ochoa, C., Medina-Sierra, A., and Vives, L. (2020). Spatio-temporal effect of climate change on water balance and interactions between groundwater and surface water in plains. Sci. Tot. Environ. 722:137886. doi: 10.1016/j.scitotenv.2020.137886
Harbaugh, A. W. (2005). MODFLOW-2005, the US Geological Survey Modular Ground-Water Model: the Ground-Water Flow Process. Reston, VA: US Department of the Interior, US Geological Survey.
Hashemi, H., Uvo, C. B., and Berndtsson, R. (2015). Coupled modeling approach to assess climate change impacts on groundwater recharge and adaptation in arid areas. Hydrol. Earth Syst. Sci. 19, 4165–4181. doi: 10.5194/hess-19-4165-2015
Hdoush, A. A. A., Makhamreh, Z., Al-Weshah, R., and Qutishat, D. (2022). Land suitability evaluation esing FAO approach and spatial analysis for Mujib Basin-Jordan. Jordan J. Earth Environ. Sci. 13.
Hobler, M., Margane, A., Almomani, M., and Subah, A. (2001). Groundwater Resources of Northern Jordan, Vol. 4. Hydrogeological Features of Northern Jordan. Technical Cooperation Project “Advisory Services to the Water Authority of Jordan” (BGR & WAJ, BGR Archive No. 112708), Amman, 84.
Law on the Water Authority (2001). Law on the Water Authority No. 18 of 1988 as Amended by Law No. 62 of 2001. Amman.
Lee, H., Calvin, K., Dasgupta, D., Krinner, G., Mukherji, A., Thorne, P., et al. (2023). AR6 Synthesis Report: Climate Change 2023. Summary for Policymakers. Geneva: IPCC.
Loaiciga, H. A. (2017). The safe yield and climatic variability: implications for groundwater management. Groundwater 55, 334–345. doi: 10.1111/gwat.12481
Lu, Y., Bookman, R., Waldmann, N., and Marco, S. (2020). A 45 kyr laminae record from the Dead Sea: implications for basin erosion and floods recurrence. Q. Sci. Rev. 229:106143. doi: 10.1016/j.quascirev.2019.106143
Luoma, S., and Okkonen, J. (2014). Impacts of future climate change and Baltic Sea level rise on groundwater recharge, groundwater levels, and surface leakage in the Hanko aquifer in southern Finland. Water 6, 3671–3700. doi: 10.3390/w6123671
Margane, A., Al Qadi, M., and El Kurdi, O. (2015). Updating the Groundwater Contour Map of the A7/B2 Aquifer in North Jordan. Amman: Mo. W. a. I. M. Federal Institute for Geosciences and Natural Resources (BGR).
Margane, A., Hobler, M., Almomani, M., and Subah, A. (2002a). Contributions to the groundwater resources of Northern and Central Jordan Jordan. Geol. Jb. C. 68:52.
Margane, A., Hobler, M., Almomani, M., and Subah, A. (2002b). Contributions to the Hydrogeology of Northern and Central-Jordan. Hannover: Schweizerbart Science Publishers.
MoE (2021). Updated Submission of Jordan's 1st Nationally Determined Contribution (NDC). Amman: M. o. Environment.
Niswonger, R. G., Panday, S., and Ibaraki, M. (2011). MODFLOW-NWT, a Newton formulation for MODFLOW-2005. US Geol. Surv. Techniq. Methods 6:44. doi: 10.3133/tm6A37
Petpongpan, C., Ekkawatpanit, C., and Kositgittiwong, D. (2020). Climate change impact on surface water and groundwater recharge in northern Thailand. Water 12:1029. doi: 10.3390/w12041029
Pointet, T. (2022). The United Nations world water development report 2022 on groundwater, a synthesis. LHB 108:2090867. doi: 10.1080/27678490.2022.2090867
Reinecke, R., Müller Schmied, H., Trautmann, T., Andersen, L. S., Burek, P., Flörke, M., et al. (2021). Uncertainty of simulated groundwater recharge at different global warming levels: a global-scale multi-model ensemble study. Hydrol. Earth Syst. Sci. 25, 787–810. doi: 10.5194/hess-25-787-2021
Rodiger, T., Magri, F., Geyer, S., Mallast, U., Odeh, T., and Siebert, C. (2020). Calculating man-made depletion of a stressed multiple aquifer resource on a national scale. Sci. Tot. Environ. 725:138478. doi: 10.1016/j.scitotenv.2020.138478
Salman, A., Al-Qinna, M., and Al Kuisi, M. (2014). Spatial analysis of soil and shallow groundwater physicochemical parameters in El-Mujib Basin-central Jordan. J. Asian Earth Sci. 79, 366–381. doi: 10.1016/j.jseaes.2013.10.008
Schäffer, R., and Sass, I. (2014). The thermal springs of Jordan. Environ. Earth Sci. 72, 171–187. doi: 10.1007/s12665-013-2944-4
Scibek, J., and Allen, D. M. (2006). Modeled impacts of predicted climate change on recharge and groundwater levels. Water Resour Res. 42:4742. doi: 10.1029/2005WR004742
Shrestha, S., Bach, T. V., and Pandey, V. P. (2016). Climate change impacts on groundwater resources in Mekong Delta under representative concentration pathways (RCPs) scenarios. Environ. Sci. Pol. 61, 1–13. doi: 10.1016/j.envsci.2016.03.010
Smiatek, G., Kunstmann, H., and Heckl, A. (2011). High-resolution climate change simulations for the Jordan River area. J. Geophys. Res. 116:15313. doi: 10.1029/2010JD015313
Soundala, P., and Saraphirom, P. (2022). Impact of climate change on groundwater recharge and salinity distribution in the Vientiane basin, Lao PDR. J. Water Clim. Change 13, 3812–3829. doi: 10.2166/wcc.2022.161
Toure, A., Diekkruger, B., and Mariko, A. (2016). Impact of climate change on groundwater resources in the Klela Basin, Southern Mali. Hydrology 3:20017. doi: 10.3390/hydrology3020017
White, J. T. (2018). A model-independent iterative ensemble smoother for efficient history-matching and uncertainty quantification in very high dimensions. Environ. Model. Softw. 109, 191–201. doi: 10.1016/j.envsoft.2018.06.009
White, J. T., Hunt, R. J., Fienen, M. N., and Doherty, J. E. (2020). Approaches to highly parameterized inversion: PEST++ version 5, a software suite for parameter estimation, uncertainty analysis, management optimization and sensitivity analysis. U. S. Geolog. Surv. Techniq. Methods 7C26:52. doi: 10.3133/tm7C26
Keywords: Dead Sea Basin, groundwater, climate change, safe yield, PEST
Citation: Al Atawneh D, Janardhanan S, Cartwright N, Bertone E and Doble R (2024) Predictive analysis of groundwater balance and assessment of safe yield using a probabilistic groundwater model for the Dead Sea Basin. Front. Water 6:1380877. doi: 10.3389/frwa.2024.1380877
Received: 02 February 2024; Accepted: 30 April 2024;
Published: 22 May 2024.
Edited by:
Daniela Ducci, University of Naples Federico II, ItalyReviewed by:
Maurizio Polemio, National Research Council (CNR), ItalyDaniele Pedretti, University of Milan, Italy
Copyright © 2024 Al Atawneh, Janardhanan, Cartwright, Bertone and Doble. This is an open-access article distributed under the terms of the Creative Commons Attribution License (CC BY). The use, distribution or reproduction in other forums is permitted, provided the original author(s) and the copyright owner(s) are credited and that the original publication in this journal is cited, in accordance with accepted academic practice. No use, distribution or reproduction is permitted which does not comply with these terms.
*Correspondence: Sreekanth Janardhanan, sreekanth.janardhanan@csiro.au