 Ibrahim H. Elsebaie
 Atef Q. Kawara*
- Civil Engineering Department, King Saud University, Riyadh, Saudi Arabia
Effective management of groundwater resources is vital in arid and semi-arid regions like the Yalamlam Basin. Identifying appropriate places for groundwater artificial recharge is key to addressing water shortages and guaranteeing the long-term viability of aquifers. By combining the Analytical Hierarchy Process (AHP) approach with GIS technology, this research offers a thorough framework for evaluating the potential for groundwater recharge. Data collection for the study includes lineament density, slope, drainage density, rainfall, Land Use/Land Cover (LU/LC), soil, elevation, and TWI, among other crucial variables. In this study, lineament density, slope, drainage density, rainfall, LULC, soil, elevation and TWI are the most sensitive characteristics with relative weights of 30, 23, 16, 11, 8, 5, 4 and 3%, respectively. According to the study’s findings, there are many zones in the Yalamlam region with varying capacities for groundwater recharging. Based on the locations that may be used for groundwater recharge, the study’s findings were categorized into five groups: very high (12.7%), high (23.3%), moderate (29.6%), poor (24.4%), and very poor (10%). The validation of the groundwater protection zones was conducted by using eight wells in the basin. As part of the validation process, the Total Dissolved Solids (TDS) in the boreholes and the groundwater protection zones (GWPZs) were compared. A strong positive correlation was found between them (0.61). The results of this research can be used for the management of groundwater resources and provide valuable information for the creation of policies that focus on specific actions to boost groundwater recharge. These findings may considerably enhance the effectiveness of efforts aimed at implementing customized methods to encourage groundwater recharge. The results suggest that there are substantial prospects for using artificial recharge in groundwater management and planning to tackle the issue of groundwater availability in the study region.
1 Introduction
Groundwater availability is essential for both living organisms and the economic viability of agriculture-based economy, particularly in desert locations such as Saudi Arabia. Its availability alleviates the domestic water issue and bolsters the agricultural and industrial sectors. Rising population and its impact on water demand for development purposes endanger groundwater supplies. We must also be mindful that the exploitation of groundwater is rising, particularly in regions that are entirely dependent on it.
Modeling and mapping the area distribution of groundwater recharge in water-deficient regions by considering factors like as land use and land cover, soil properties, and precipitation patterns may assist in implementing appropriate methods to restore groundwater levels in the future.
The underground aquifer known as groundwater is one of the world’s most valuable natural resources (Naghibi et al., 2015). It has a major impact on human flourishing, economic growth, and environmental balance (Prentice et al., 2001). Surface water, including that found in lakes, marshes, reservoirs, and rivers, accounts for only 0.3% of the world’s freshwater resources, whereas groundwater stores over 30% (Shiklomanov, 1991). Precipitation and snowmelt seep into the soil and flow through the aquifer via linked soil pores, supplying the majority of groundwater. Groundwater is seen as a safer and more drinkable option than surface water since it is more accessible and less likely to be contaminated (Collin and Melloul, 2003).
Several factors must be mapped and identified to ascertain the geographical distribution of the GWPZ. For this reason, GIS methods may be used to perform spatial analysis via the integration of several datasets (Ding and Fotheringham, 1992). AHP is a common method for evaluating many options (Linkov et al., 2007; Boroushaki and Malczewski, 2008).
Lineament density, slope, rainfall, drainage density, soil, elevation, Topographic Wetness Index (TWI), and Land Use Land Cover (LULC) are some of the elements that affect groundwater recharge (Khan et al., 2023). In order to determine the Area of GWPZ, the aforementioned elements were given weights based on the relative contributions they made to groundwater potentiality. Methods for determining an aquifer’s potential included the use of geographic information systems (GIS) and remote sensing (RS). The use of GIS allowed for the dissemination of hydrogeological, geological, and geo-graphic data. To determine LULC, soil type, and cracks, remote sensing (RS) techniques are used. Moving forward, they started using GIS for analysis and data overlays. According to references (Machiwal et al., 2011; Adiat et al., 2012; Echogdali et al., 2022), the APZ was defined using the AHP. The system does a good job with the outputs and simplifies complex perspectives into comparisons of pairs of series. Allocating weights to thematic layers has become more common place in recent times via the integration of GIS approaches with Multi-Criteria Decision-Making (MCDM) technology, including the AHP (Saranya and Saravanan, 2020). The decision-making process may be improved by including structure, appropriateness, and precision via the employment of these tactics (Machiwal et al., 2011; Kumar and Krishna, 2018). Environmental problem-solving and management have seen a rise in the usage of AHP approaches. In a variety of contexts, including ecological impact assessments (Memarbashi et al., 2017), flood risk mapping (Siddayao et al., 2014; Kazakis et al., 2015; Gigović et al., 2017; Wang et al., 2019; Elsebaie et al., 2023), and solid waste management (Khoshand et al., 2018), the AHP has been used by several researchers. Prospective groundwater resource mapping and recharging site identification is one of the most popular and successfully implemented uses of AHP technology (Prasad et al., 2008; Rajasekhar et al., 2019; Dar et al., 2021; Khan et al., 2021, 2022; Radulović et al., 2022; Arumugam et al., 2023; Ikirri et al., 2023).
Many different types of water, including desalination, processing, and renewable resources, are used to meet Saudi Arabia’s water needs (Rajmohan et al., 2021). The recharge of the shallow aquifer, which benefits from both rainfall and flash floods, is considered an important component in increasing total water availability. In a similar vein, precipitation is a major contributor to the nation’s water storage, accounting for about 2.04 billion cubic meters (Mondal et al., 2012; Masoud et al., 2018; Mondal and Ajaykumar, 2022). The majority of this country’s groundwater, 84% to be exact, goes toward agriculture (Chowdhury and Al-Zahrani, 2015). The quantity of water contained in shallow aquifers has decreased due to over-abstraction of groundwater (Zaidi et al., 2015). Due to over-abstraction, the amount of groundwater stored in the shallow aquifer was diminished (Zaidi et al., 2015).
The primarily aim of the paper is to describe a method and identify GWPZ in the Yalamlam watershed by using the AHP approach and a GIS.
Using integration of the impacts of certain characteristics such as lineament density, slope, drainage density, rainfall, LULC, soil, elevation, and TWI for groundwater potential mapping.
The rest of the paper is structured as follows: Sections 2 and 3 provide details on the research case study and data sets, respectively. The processes are outlined in Section 4. Section 5 contains the results and discussion. The Conclusions are presented in section 6.
2 Study area
Wadi Yalamlam is situated around 100 kilometers to the south of Mecca and 90 kilometers to the north of Al Lith. The geographical coordinates of its position are latitude 20°20′00″ to 21°10′00″ and longitude 39°40′00′′ to 40°36′00′′.
The Yalamlam Wadi basin covers an area of about 1,665 square kilometers. The basin boundary encompasses almost the whole lower level area, situated in the downstream region. Originating in the Al Shafa region, Wadi Yalamlam falls from the elevated terrain of the Hijaz Mountains, in proximity to Taif. The annual precipitation averages 140 mm for the period 1966–2021. The altitudes of the wadi exhibit significant variation, ranging from 25 to 2,600 meters. Figure 1 displays a representation of the height of Wadi Yalamlam, along with a general map indicating its position. The top and lower sections of the basin are characterized by dominant and well defined natural vegetation. On the other hand, deposits, sand dunes, and tiny, dispersed debris have drastically changed the granitoid and metamorphosed basaltic slopes present at the bottom of the wadi.
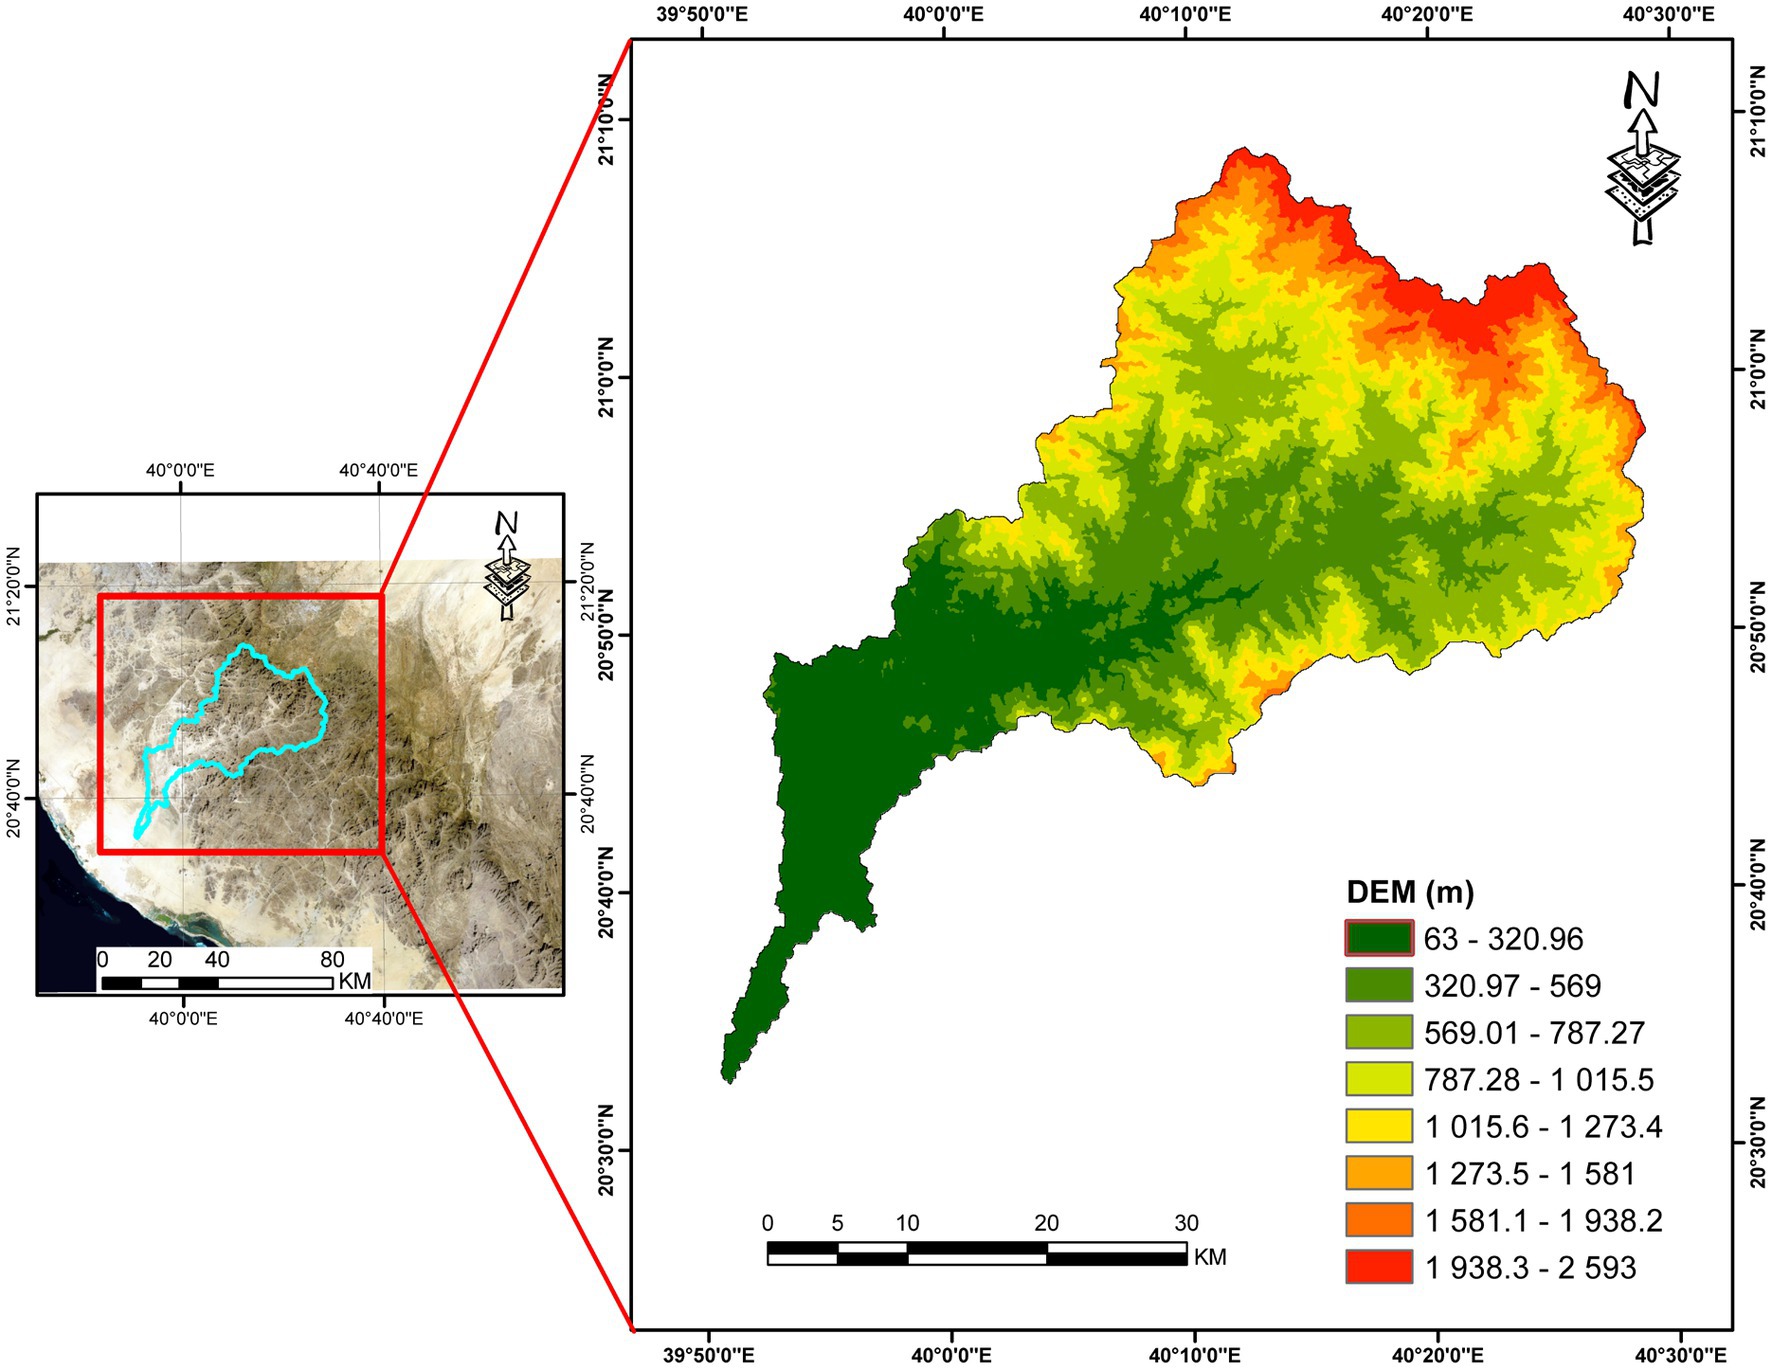
Figure 1. Coordinates and digital elevation model of Wadi Yalamlam (Kawara and Elsebaie, 2022).
3 Methodology
The evaluation of groundwater recharge potential entails the integration and preparation of geospatial data sets from GIS, meteorological, and satellite sources to provide a complete dataset. The AHP is used to ascertain the relative significance and allocate weights to several factors that impact groundwater recharge, such as land use, soil type, plant cover, slope, and others. Afterward, overlay-weighted analysis is used to identify potential areas for recharging. In addition, there are eight wells in the area, and the total dissolved solids (TDS) are examined to confirm the prospective zones that has been found.
The flowchart of the research technique employed for this study is shown in Figure 2. Eight components were determined to be very important to the GWPZ determination. The determination of the GWPZ may be ascribed to these eight factors, which have been recognized to be essential to the process. By using the AHP methodology, we conducted a thorough analysis of several elements, assigned appropriate weights to each component, and constructed a comparison matrix to evaluate their relative significance. The GWPZ map was created using the AHP weightage combination technique after conducting a comprehensive study considering several aspects. Subclasses of each theme were assigned weights from 1 (very low), 2 (low), 3 (moderate), 4 (high), and 5 (very high) GWPZ responses.

Figure 2. Flow chart illustrating the approach used in the current research.
4 Database and results
An important step in creating a map that pinpoints potential zones for groundwater recharge is the data processing procedure. As shown in Figure 2, the study region’s data came from a variety of sources. The King Abdulaziz City for Science and Technology supplied data for the Digital Elevation Model (DEM) with a resolution of 10 meters. See Figures 3, 4 for an example of the numerous layers that resulted from the analysis of DEM using ArcGIS software: lineament density, slope, drainage density, elevation, and TWI. Precipitation information was made available daily via the database of the Ministry of Agriculture, Water, and Environment. The study area’s mean daily maximum rainfall data was interpolated using the Inverse Distance Weighting (IDW) technique. The soil type data was retrieved from a digital soil map of the world that may be accessed at this URL: https://data.apps.fao.org/map/catalog/srv/eng/catalog.search#/metadata/446ed430-8383-11db-b9b2-000d939bc5d8. Earth Explorer satellite pictures were retrieved from the US Geological Survey’s website1 and examined for LULC data. With the use of satellite images, image recognition techniques, and a maximum likelihood algorithm, the LULC map was generated in ArcGIS 10.8. Resampling the geographical layers into a raster format allowed for the creation of a unified database.
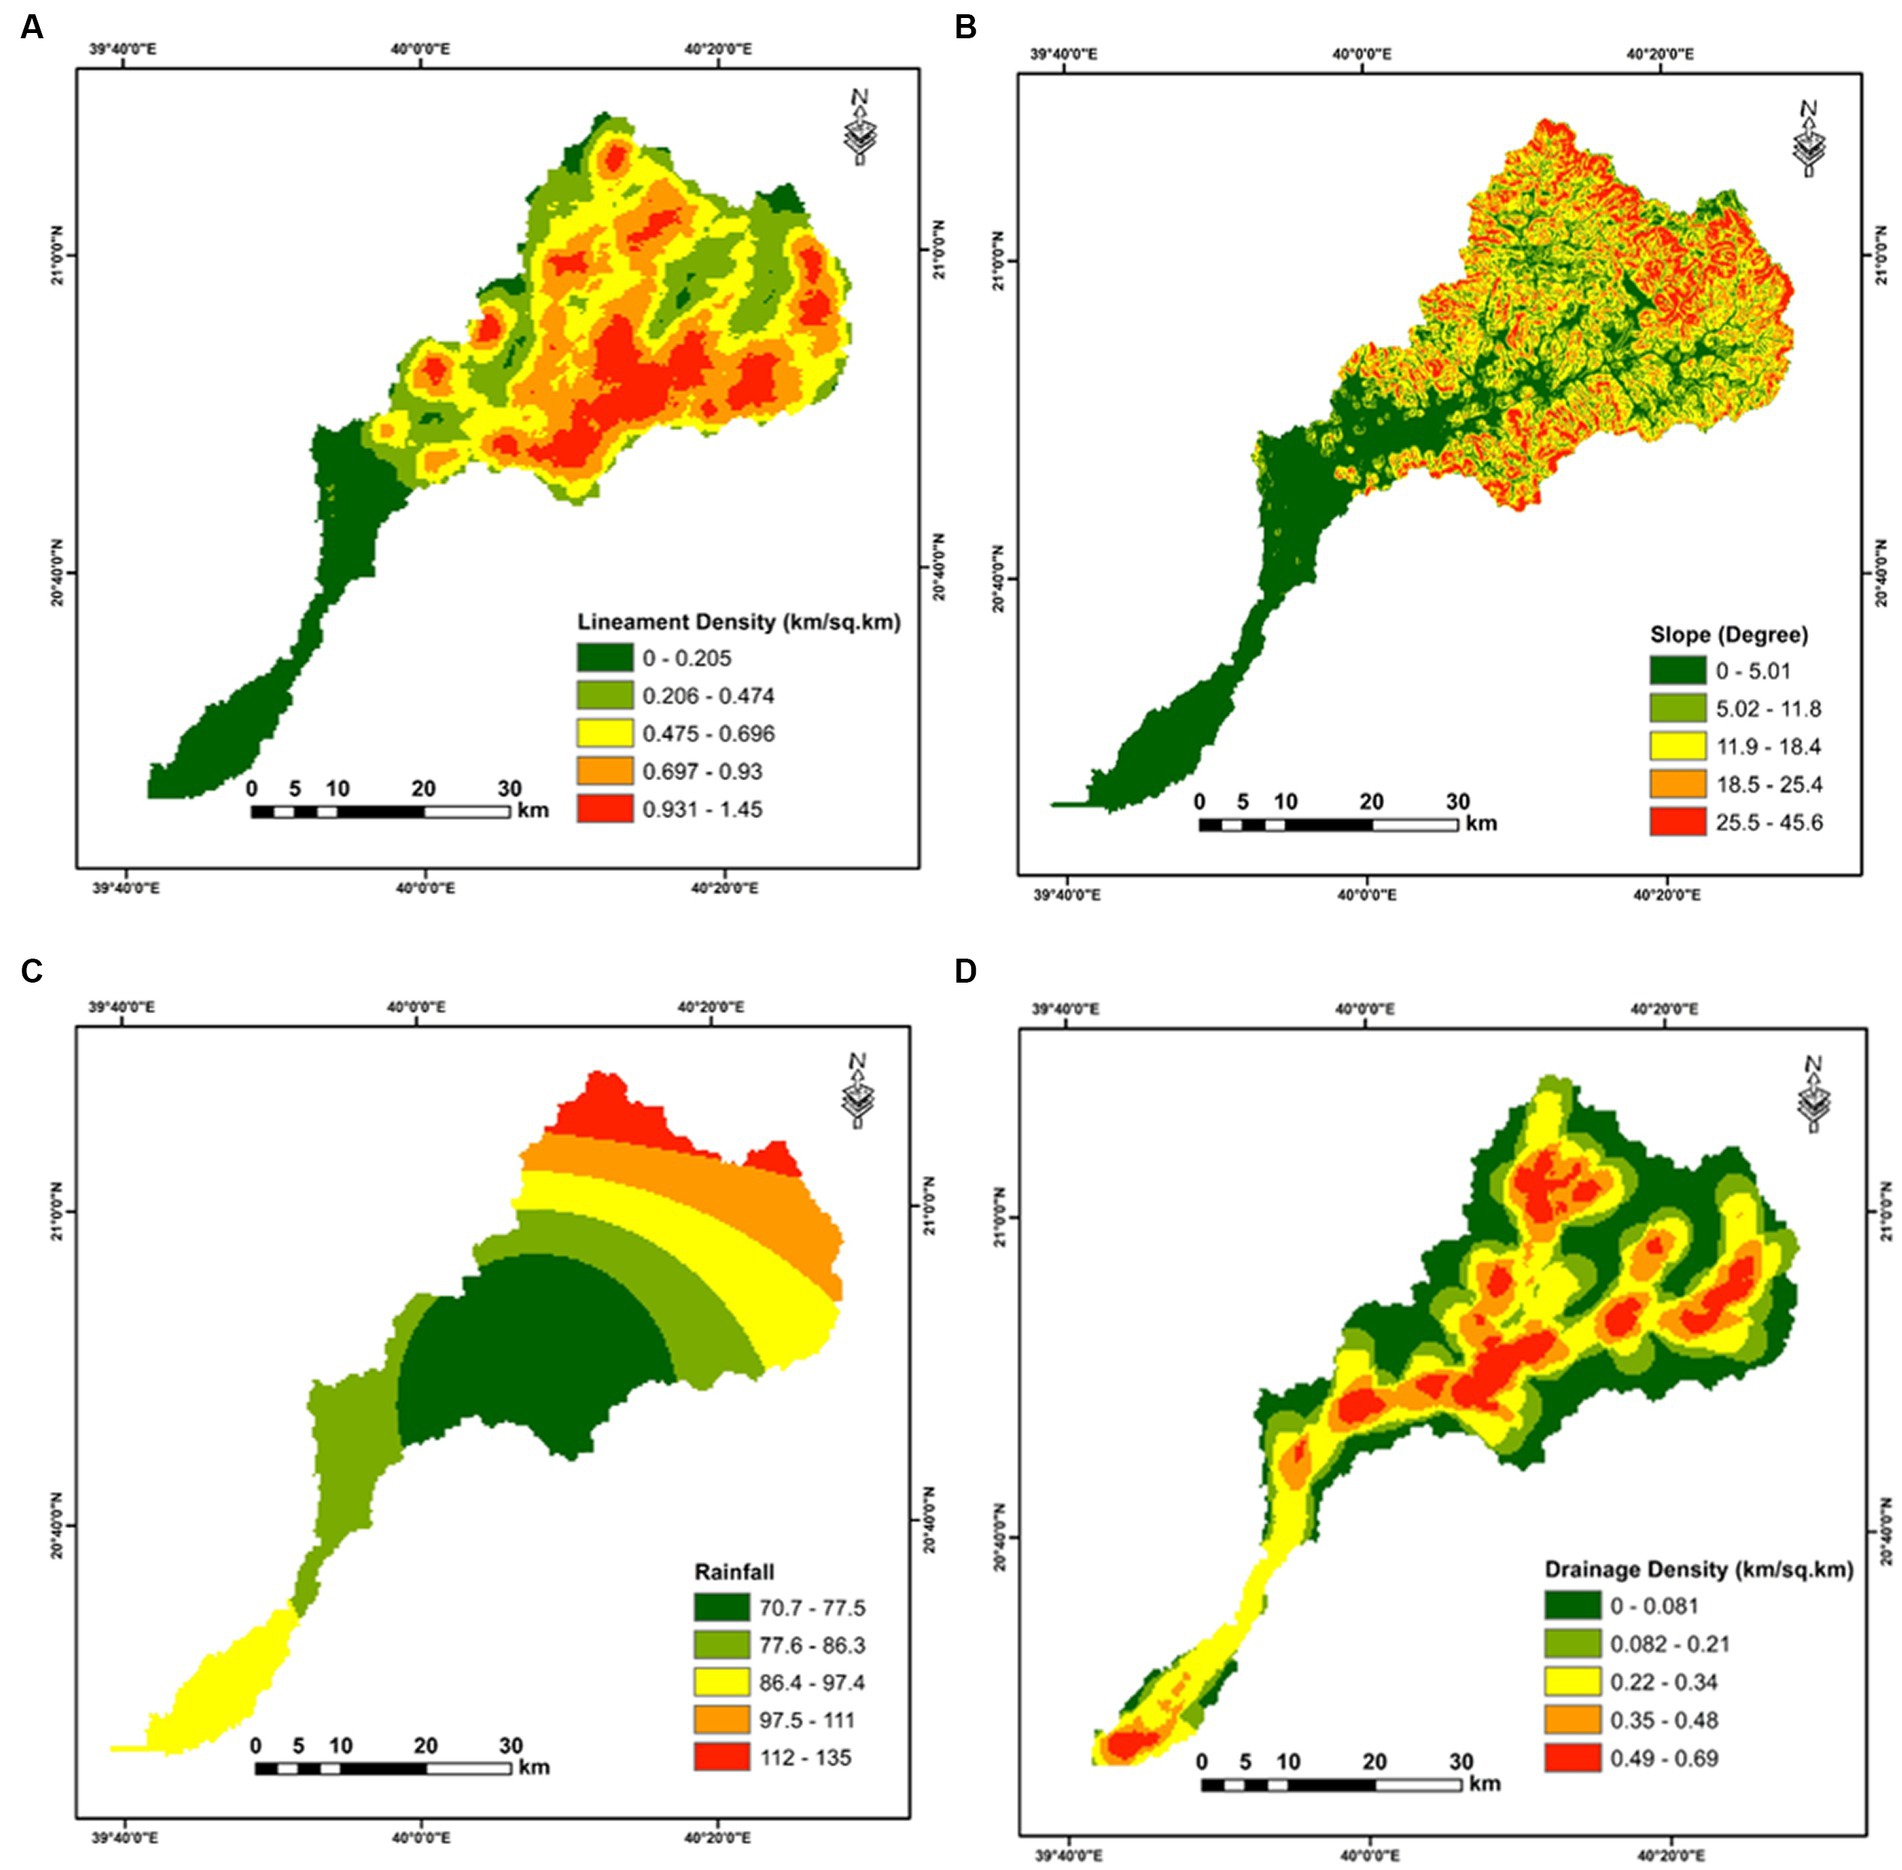
Figure 3. (A) Lineament density; (B) slope; (C) rainfall; (D) drainage density.
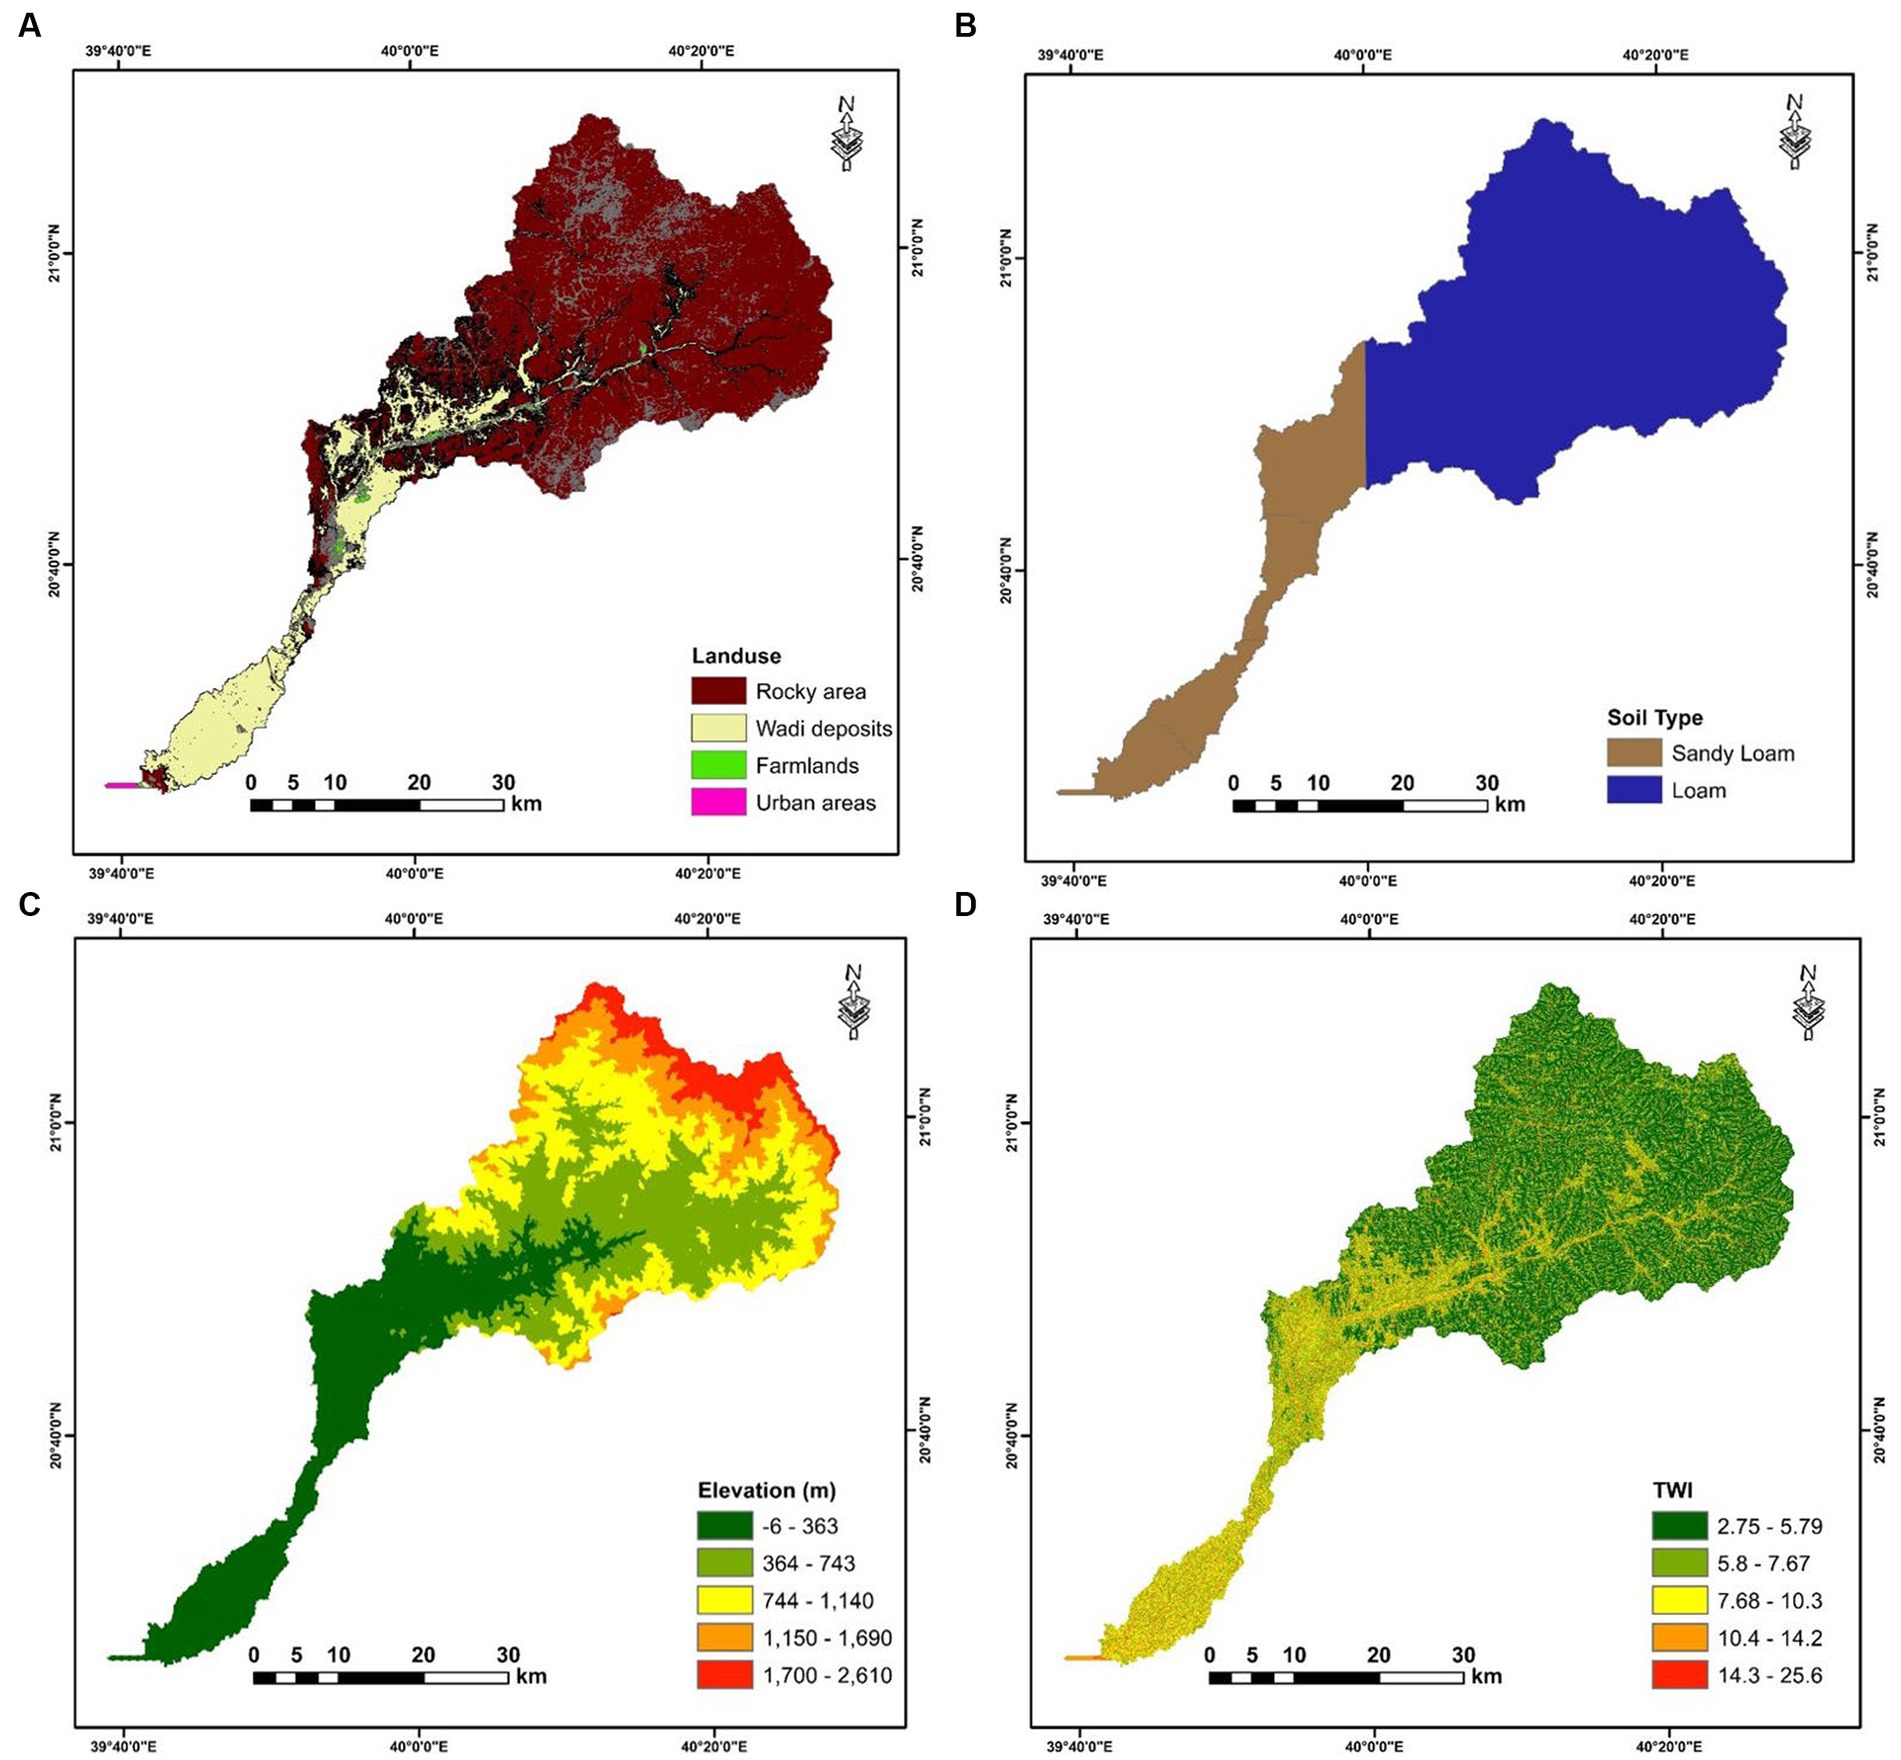
Figure 4. (A) Land use; (B) soil type; (C) elevation; (D) TWI.
4.1 Thematic layers
There are many hydrologic parameters which affect the groundwater in Wadi Yalamlam basin. These factors are:
4.1.1 Lineament factor
Lineaments are surface geological structures that display either straight or curved patterns. Theoretically, these characteristics mirror the faults, fractures, and cleavages present in the underlying lithology. Satellite imagery may be used to study and evaluate them. In order to determine the lineament density, a grid-based technique was used. Lineament density, defined by the authors (Ghosh et al., 2022), is a measure that is computed by dividing the total length of lineaments in a grid by the area of the grid cell:
The equation provided represents the relationship between ΣLi, which denotes the cumulative length of lineaments inside the grid in kilometers, and A, which represents the size of the grid cell in square kilometers. The potential for groundwater development is considerable to very high in areas with dense lineaments. Equation 1 and the GIS toolbox were used to calculate the lineament density, and the results are shown in Figure 4A.
4.1.2 Slope factor
A slope is a numerical measure of an object’s inclination concerning a horizontal plane; it indicates how steep or slanted the object is (Rimba et al., 2017).
There was little water entry into the aquifer and little chance of aquifer recharge in areas with steep slopes, as well as substantial surface runoff (Khan et al., 2023). Less surface runoff, more infiltration, and a higher likelihood of aquifer recharging were characteristics of moderate inclines, on the other hand. With a range from 0–2.46 degrees at the bottom to 27.67–48.31 degrees at the top, the slope map is divided into five categories. As seen in Figure 4B, the slope map was generated from the DEM (10 m resolution) with ArcGIS 10.8’s surface tool.
4.1.3 Rainfall factor
Precipitation often tops up the groundwater table. The infiltration and surface runoff rates are affected by the quantity, duration, and intensity of the rainfall. Significant surface runoff and limited penetration are the results of little precipitation over a prolonged period of time (Senapati and Das, 2022). Groundwater recharge is influenced by annual precipitation. The ArcGIS platform and the IDW spatial interpolation technology were used to create a themed map of precipitation statistics. Figure 4C shows that the research region is classified into five different groups according to the average annual precipitation.
4.1.4 Drainage density factor
As a fundamental principle, the idea of drainage density is very important in hydrology. You may find it by dividing the whole length of the streams divided by the total area of the drainage basin. One important indicator for determining the infiltration rate is the drainage density measurement. Groundwater recharge and drainage density are inversely related to one another. Reduced groundwater recharge due to increased surface runoff and decreased infiltration is the consequence of a greater drainage density. When drainage densities are lower, more precipitation percolates into the ground and helps replenish groundwater supplies more significantly (Bhunia, 2020; Barua et al., 2021; Senapati and Das, 2021).
The determination of drainage density is conducted using the following equation:
According to the provided context, D is the drainage density of the watershed, L is the total length in kilometers of the streams inside the watershed, and A is the total area in square kilometers.
Equation 2, the GIS toolbox was used to calculate the drainage density, as shown in Figure 4D.
4.1.5 Land use/land cover factor
Directly impacting groundwater recharge, LULC governs soil moisture, penetration, and surface runoff rate (Bhunia, 2020; Senapati and Das, 2022). By way of very intricate geological processes taking place on Earth’s surface, this specific LULC category successfully controls groundwater storage. Impermeable cover has increased while forest cover has decreased within urban areas as a result of urban land development. A decrease in the process of infiltration is the result of these charges taken together. In order to create the LULC map, ArcGIS 10.8 was used in conjunction with image classification algorithms and a maximum likelihood algorithm to process satellite data. Figure 3A shows the LULC map, which shows four different kinds. It is important to mention that the urban and green areas are confined with the distribution of groundwater wells in the two basins which they used in the agricultural activities. The waste water from the agricultural activities can also infiltrate and recharge the shallow groundwater acquirers.
4.1.6 Soil factor
Groundwater recharge is affected by the characteristics of various soil types. It is important to study the soil’s ability to allow surface water to seep into the aquifer system. Soils with coarser textures are more porous while soils with finer textures are less porous. Soil with a high porosity allows surface water to quickly seep underground (Mandal et al., 2016). The groundwater recharge in areas with clay formations is relatively low because soils with a high clay content have a restricted infiltration ability. A higher infiltration rate is indicative of the existence of significant groundwater recharge in soils that include a mix of sand particles. The soil type data for the whole area was obtained from a digitized global soil map (Aquaveo, 2013; Harmonized World Soil Database version 2.0, 2023). Two distinct types of soil (sandy loam and loam) were obtained from satellite pictures within the study area. This is shown in Figure 3B.
4.1.7 Elevation factor
Recharging groundwater resources is greatly affected by the terrain’s elevation. Groundwater recharging is more prevalent in low-lying plain areas characterized by longer water retention periods, as shown in other studies (Ajay Kumar et al., 2020; Priya et al., 2022). The capacity for groundwater recharge within a drainage basin varies across different elevations, which is impacted by elevation, which is also affected by the valley stream gradients (Patra et al., 2018; Ghosh et al., 2022). Using ArcGIS 10.8 software, the digital elevation model (DEM) was divided into five separate categories, as shown in Figure 3C.
4.1.8 TWI factor
It is a common practice to employ TWI to assess how topography affects overflow and flow accumulation within a stream watershed (Khosravi et al., 2016; Das, 2018). TWI was previously used in basin modeling to forecast the spatially diverse rapid flow (Beven and Kirkby, 1979; Sivapalan et al., 1990; Famiglietti and Wood, 1991). To examine and evaluate the spatial arrangement of wetness situations within a specific regional topographical context, the approach known as TWI is used. To put it more technically, it specifies the slope’s connection to the given catchment area. The following Eq. 3 was used to derive the a TWI:
As is used to represent the upstream contributing zone, and β is used to indicate the slope gradient. Figure 3D shows the results of the TWI determination utilizing GIS methods, namely DEM analysis.
4.2 Analytical hierarchy process (AHP)
Construction of the decision hierarchy, determination of the relative relevance of features and sub-attributes, evaluation of each option and calculation of its total weight for each attribute, and verification of the coherence of subjective judgments are the four separate processes that make up the AHP approach (Ouma and Tateishi, 2014). The goal of creating parameter layers is to demarcate the locations that show groundwater recharge potential. After that, the weight is determined by reclassifying the classes that match the requirements.
Table 1 shows the weighted parameters organized hierarchically. The AHP was the particular MCDM tool utilized in the development of the GWPZ map. All potential criteria were subjected to a pair-wise comparison as part of the AHP. Eight factors were evaluated using a total of twenty-eight pairwise comparisons. The values of an element that are outside the matrix’s diagonal indicate its relative importance. The comparison of a component with itself is the reason why the diagonal values are equal to one. You can see the normalized matrix in Table 2. All the factor weights and priority vectors have been calculated. When the consistency ratio (CR) is less than the allowable inconsistency threshold (below than 10%), it may be inferred that all pairwise comparisons are considered real. There is a 10% maximum allowable discrepancy under the AHP. To calculate the CR, Equation 4 was used.

Table 1. Watershed groundwater potential pairwise comparison matrix.
Table 2. Weighted comparison.
There are two indices used here: the random consistency index (RI) and the consistency index (CI). According to Table 3, the random consistency index for eight components is 1.41 (Saaty, 1988).

Table 3. Random index (RI) (Saaty, 1988).
Using Eq. 5, the CI was calculated:
λ_max is the total of the weights given to each column in the comparison matrix, and n is the number of factors. The maximum values for the watershed variables needed to determine the GWPZ are obtained from Tables 1, 2, as seen below:
Comparing the CR to the standard of 10%, it is 7.2%. The pairwise matrix’s rating is thus regarded as appropriate.
4.3 Groundwater recharge potential zone
The pairwise contrast matrix and factor map are useful tools for determining the weight and ranking of each component. The priority factor’s weight value is represented as a percentage, with values ranging from 0 to 100%. A detailed list of the items that were specifically chosen for study, together with their corresponding weights and rankings, is shown in Table 4. The rankings used a range of 1 to 5, where 1 represented the least degree of the groundwater recharge and 5 the largest.
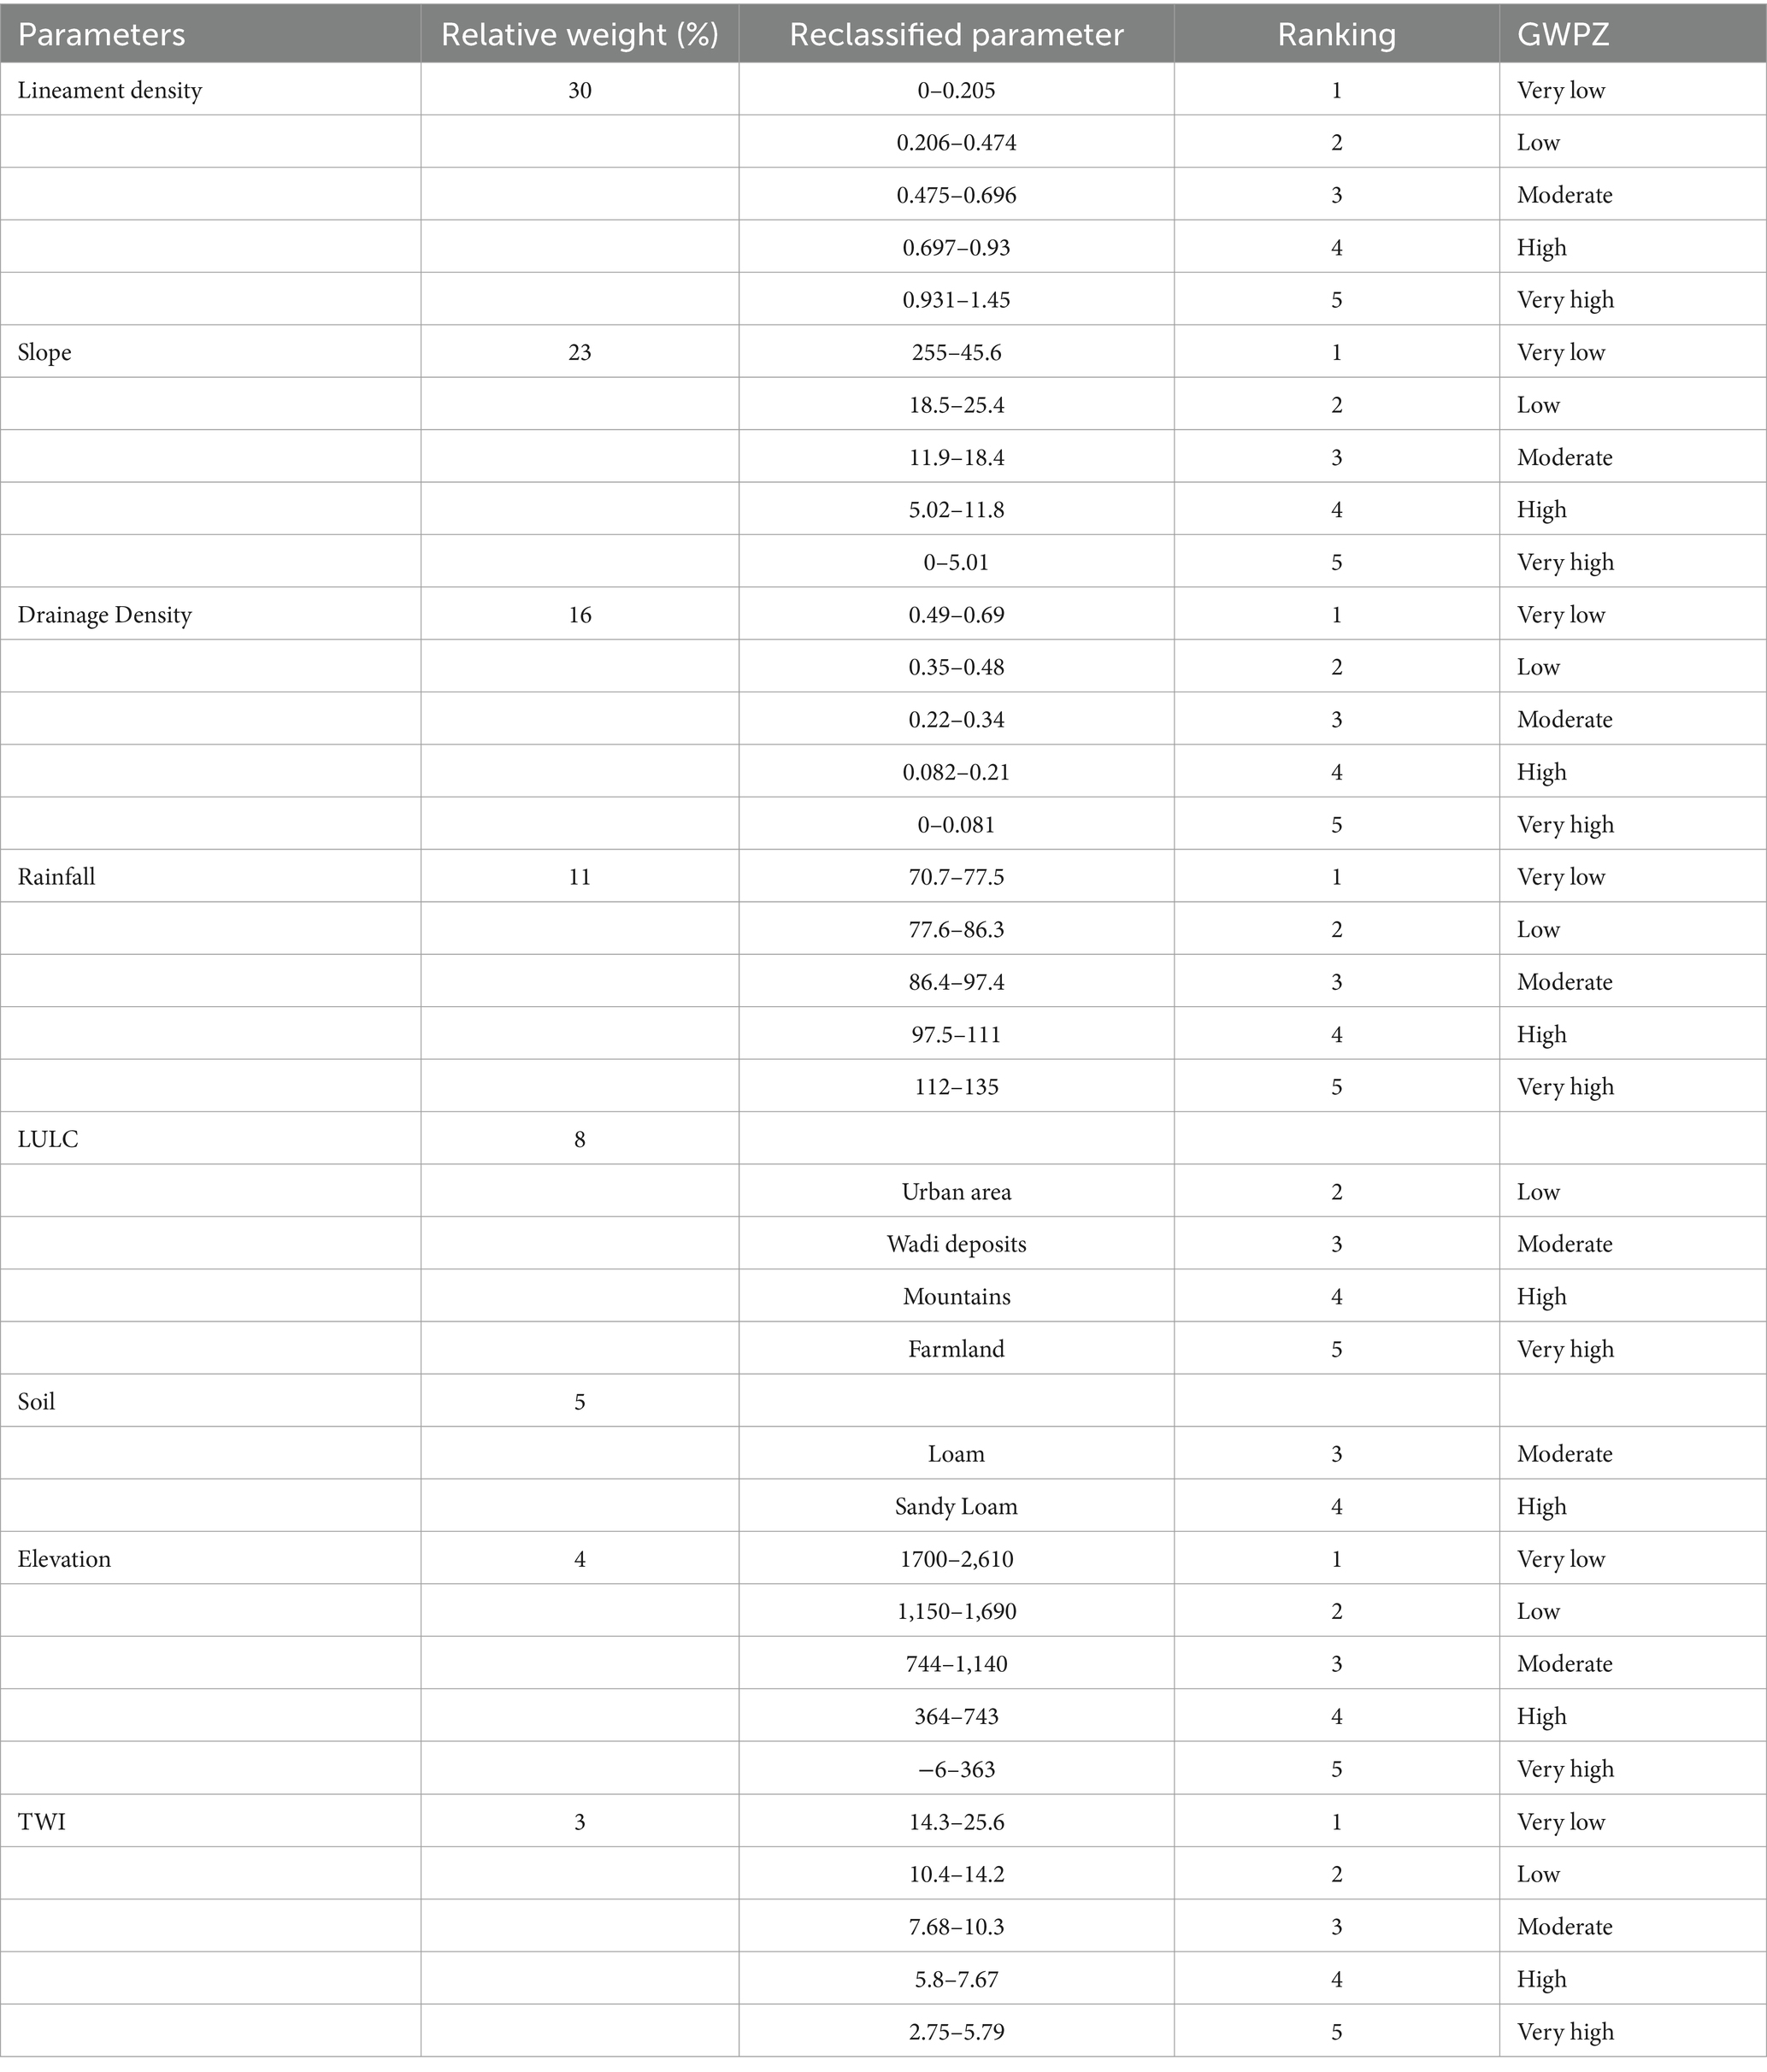
Table 4. Ranking of the weighted GROZ of the catchment.
The data from Table 4 were used to create the map (Figure 5) that shows the study watershed’s potential zone for groundwater recharge.

Figure 5. Yalamlam basin groundwater recharge potential zone map.
5 Discussion and model verification
The present study sought to identify groundwater recharge potential zones in Yalamlam. Previous research has shown the effective use of the AHP in many watersheds (Memarbashi et al., 2017; Khoshand et al., 2018; Mallick et al., 2019; Ajay Kumar et al., 2020; Saranya and Saravanan, 2020; Dar et al., 2021; Senapati and Das, 2021; Echogdali et al., 2022; Ghosh et al., 2022; Khan et al., 2022; Priya et al., 2022; Radulović et al., 2022; Senapati and Das, 2022; Arumugam et al., 2023; Elsebaie et al., 2023; Ikirri et al., 2023; Khan et al., 2023).
Researchers utilize AHP to identify prospective zones for groundwater recharge. Eight important factors—lineament density, slope, drainage density, rainfall, LU/LC, soil type, elevation, and TWI—had an impact on the chosen watershed. AHP was used to provide weights to the various components involved in the process of mapping. The weights were established as follows: 30, 23, 16, 11, 8, 5, 4, and 3%. This implies that the lineament density has the largest weight percentage, while the TWI has the lowest weight % in contrast to the other significant factors.
The existence of flat terrain with a small gradient is connected with a decreased velocity of surface runoff and an improved capacity for holding water, helping the process of groundwater recharge.
The research classified the data into five categories based on the potential areas for groundwater recharge: very high (13%), high (23%), moderate (30%), poor (24%), and very poor (10%).
In general, policymakers and responsible authorities benefit from the GWPZ maps. They are valuable for determining strategies to enhance the quality and availability of groundwater in a watershed. Furthermore, the AHP methodology offers a systematic approach to mitigate urban expansion in recharge areas, guaranteeing the constant selection of optimal choices. Having many development projects and increasing urban areas on the floodplain can cut into recharged groundwater basins. Over the last decade, significant developments have occurred in the field of research. The results indicated that urbanization has a detrimental influence on hydrological processes, resulting in reduced infiltration of groundwater and increased runoff of surface water.
Authorities and property developers may make better use of the study’s findings to recharge groundwater. The GWPZ map may be used to ascertain the optimal sites for constructing new dams, reservoirs, and other forms of infrastructure. One or two concrete gravity dams may be constructed for groundwater recharging at the outlets of the GWPZ, especially at the high groundwater potential zones. The exact location of these dams will be confirmed after considering such factors as topography, geology, etc.
Topography and hydrology are the only elements that limit the high GWP locations. On the other hand, they could exhibit small shifts caused by variables (such as LULC) that have little bearing on the overall efficiency of built-in aquifer systems. Regions with low runoff rates and a longer rainfall percolation propensity tended to have a high GWP. These places included gently sloping, virtually flat, and mountainous terrain. Encircling safe GWP zones are changes in topography, hydrology, and geology, as well as other direct repercussions, including LULC shifts, within their extent. These areas are very delicate and susceptible to change. Significant changes to aquifer productivity occur throughout their installation and decay.
The density of lineaments has a crucial role in the process of groundwater recharge at any given area (Mukherjee et al., 2012; Mallick et al., 2019). The study findings indicate that lineament density has the highest level of importance among the eight criteria examined. This outcome aligns with the results reported by Priya et al. (2022). Priya et al. (2022) discovered that lineament density had the most influence on the results, while Ghanim et al. (2023) determined that lineament density had the second-highest level of significance.
Water recharge is significantly impacted by the slope of the land, as the latter directly determines the manner in which water traverses the surface (Berhanu and Hatiye, 2020). The slope variable has the second greatest degree of significance among the eight variables included in this study, with a relative weight of 23%. This result aligns with the findings of previous studies conducted on comparable watersheds. Mallick et al. (2019) conducted a study in the Aseer Region of Saudi Arabia to identify and describe areas with high groundwater potential. The slope was the second most significant factor in terms of weight among the twelve examined parameters, with rainfall following closely behind. In their research, Ghanim et al. (2023) investigated the Habawnah basin in southern Saudi Arabia and found that slope was the third most important factor in determining the prospective zones for groundwater.
The findings showed that 211.4 km2 (12.7%) and 387.9 km2 (23.3%) were classified as having very high and high groundwater recharge potential, respectively. Approximately 492.8 km2, or 29.6%, were classified as moderate groundwater recharge potential. The results indicate that 406.3 km2 (24.4%) and 166.5 km2 (10%) were classified as poor and very poor in terms of groundwater recharge potential. The majority of the research region was characterized by significant portions of high and moderate groundwater recharge zones.
More than 112 mm of rainfall was recorded in the northeastern section of the research region, which may be used efficiently to replenish groundwater. According to the predictions made Multsch et al. (2011), the evapotranspiration at Makkah Region in Saudi Arabia is 2,100 mm/year. This section of the study region is inherently well-suited for groundwater potential management.
The investigation further confirmed the presence of potential groundwater recharge zones by comparing them with data collected from observational wells. Among the eight wells that were analyzed, none was classified as being in a very poor zone. One well was situated in a zone with low potential, while six wells were positioned in zones with moderate potential. One well was located in a zone with significant potential. The majority of the wells were situated in areas with intermediate potential, which aligned with their close proximity to intensive agricultural practices.
The accuracy of the groundwater potential map was verified by comparing it to the locations of operational wells in the research region. This approach has been often used in others studies (Naghibi et al., 2015; Mallick et al., 2019; Ghanim et al., 2023).
Additionally, correlation between the groundwater protection zones (GWPZs) and the observed Total Dissolved Solids (TDS) in the borehole is part of the validation process. The validation results show that the wells with acceptable water quality are mostly located in regions with high and moderate potential. The range of TDS content fluctuated from 1,378 mg/L to 3,251 mg/L (Table 5). It is considered a good result that the high potential zone had the lowest TDS number, at 1378 mg/L which is very high in comparison to TDS in rainfall water (20–30 mg/L).

Table 5. Locations and TDS values of groundwater wells in case study.
The Ministry of Environment, Water and Agriculture, Saudi Arabia in coordination with Schlumberger Water Servies (2015), performed well development for one of the monitoring wells in the study area by over-pumping for several hours until the discharge became clear. Three step tests were conducted in that well; the duration of the step test was 60 min. The water level before the start of pumping was 9.06 m (below ground surface). The flow rates were 2.78, 417 and 5.56 L/S corresponding to water levels 9.57, 9.85 and 11.71, respectively. The specific capacity was 19.62, 19 and 7.55 m2/h during the step test.
The delineated groundwater potential map was verified using the available well yield data of one pumping well (W7) in the present study area. The well yield data and the results were found to be very congruent. It was discovered that the yield of 4.723 L/S occurred for 8 h corresponding with the moderate to good GWPZ established in this study. The water levels in this well fluctuated between 7.39 and 10.24 below the ground level from 2018 to 2020.
The depth of water levels in the wells is available only in two wells (W7 and W8) which water level are 9.06 and 12.96 meters below the ground level, respectively. This confirms model results where the well (W7) located between high and moderate GWPZ and well (w8) Located between moderate and poor GWPZ as shown in Figure 5.
6 Conclusion
Determining the potential areas for groundwater recharge is essential to identify the optimal management options for conserving groundwater resources. The land suitability for groundwater recharge in the study area was assessed by integrating data from eight parameters. We used the ArcGIS platform to reclassify all of the specified metrics, and then employed the weighted overlay function of the spatial analyst tool to superimpose them.
The primary variables that are thought to be associated with the groundwater storage and potential in the research region are lineament density, slope, drainage density, precipitation, LU/LC, soil type, elevation, and TWI. Loose wadi deposits have high infiltration rates and groundwater potential, whereas large hard-rock areas have low infiltration rates and significant surface runoff.
When it comes to groundwater recharge, structural elements are crucial because of the function they play as conduits. There is a lot of surface runoff and very little infiltration in places with high drainage densities and extracted drainage. Water is more easily able to penetrate gently sloped places with slopes below 5 degrees.
The development of a GWPZ map for the Saudi Arabian Yalamlam basin is detailed in this work. The AHP strategy was used in conjunction with GIS methodology to produce the map. The eight parameters that were considered in this study were topography, climate, soil type, and land use history. After the relative weights were calculated, the final map indicating the possible zones for groundwater recharge was created using the ArcGIS software.
The analysis indicates the need to preserve the safe GWP category. Most of the research region is classified as safe in terms of GWP. 10% of the study zone is assessed as having very low recharge potential, while 24.4% is classified as having low potential, according to the methodology used. 29.6% of the remaining research area is assessed as having moderate potential, 23.3% as high potential, and 12.7% as having extremely high potential.
The final GWPZ map, obtained by the amalgamation of thematic layers, was verified by cross-referencing well locations and TDS values within the study region. The validation results indicated that the AHP approach is very effective for generating groundwater potential maps in the area. However, the findings from GWPZ provide a promising chance to address the issue of inadequate groundwater supplies in regions with a small proportion of suitable lands by using artificial recharge for the purpose of groundwater management and planning.
The results might aid decision-makers, water resource management authorities, and other stakeholders in efficiently using and overseeing the groundwater recharge potential zone in the research region to ensure long-term sustainability. Additionally, it offers superior aquifer resource planning and management to enhance the irrigation sector. The study results can be used to land management, planning and use of aquifer resources. Moreover, to enhance our comprehension of the groundwater recharge capacity in the studied region, it would be advantageous for future research to broaden the range of metrics used and integrate economic and social data. Additionally, doing a more thorough investigation of the bore wells would be useful. Furthermore, it is crucial to acknowledge that this research just considers the geographical variability that might influence the detection of possible groundwater recharge areas. It is advisable to take into account temporal variability for future investigations.
Data availability statement
The raw data supporting the conclusions of this article will be made available by the authors, without undue reservation.
Author contributions
IE: Investigation, Methodology, Visualization, Writing – original draft, Writing – review & editing. AK: Data curation, Methodology, Software, Validation, Visualization, Writing – original draft, Writing – review & editing.
Funding
The author(s) declare financial support was received for the research, authorship, and/or publication of this article. This research was funded by the National Plan for Science, Technology and Innovation (MAARIFAH), King Abdulaziz City for Science and Technology, Kingdom of Saudi Arabia, Award Number (13-WAT1027-02).
Acknowledgments
The authors extend their sincere appreciation to the National Plan for Science, Technology and Innovation (NPST), King Saud University, for funding the research project (13-WAT1027-02).
Conflict of interest
The authors declare that the research was conducted in the absence of any commercial or financial relationships that could be construed as a potential conflict of interest.
Publisher’s note
All claims expressed in this article are solely those of the authors and do not necessarily represent those of their affiliated organizations, or those of the publisher, the editors and the reviewers. Any product that may be evaluated in this article, or claim that may be made by its manufacturer, is not guaranteed or endorsed by the publisher.
Footnotes
References
Adiat, K. A. N., Nawawi, M. N. M., and Abdullah, K. (2012). Assessing the accuracy of GIS-based elementary multi criteria decision analysis as a spatial prediction tool – a case of predicting potential zones of sustainable groundwater resources. J. Hydrol. 440–441, 75–89, Available at: https://www.sciencedirect.com/science/article/pii/S0022169412002375
Ajay Kumar, V., Mondal, N. C., and Ahmed, S. (2020). Identification of groundwater potential zones using RS, GIS and AHP techniques: a case study in a part of Deccan Volcanic Province (DVP), Maharashtra, India. J. Indian Soc. Remote Sens. 48, 497–511. doi: 10.1007/s12524-019-01086-3
Aquaveo, L. L. C. (2013). SMS user manual (v. 12.1): The surface water modeling system : Aquaveo, LLC Provo. Available at: http://www.aquaveo.com/WMS
Arumugam, M., Kulandaisamy, P., Karthikeyan, S., Thangaraj, K., Senapathi, V., Chung, S. Y., et al. (2023). An assessment of geospatial analysis combined with AHP techniques to identify groundwater potential zones in the Pudukkottai District, Tamil Nadu, India. Water 15:1101, Available at: https://www.mdpi.com/2073-4441/15/6/1101
Barua, S., Mukhopadhyay, B. P., and Bera, A. (2021). Integrated assessment of groundwater potential zone under agricultural dominated areas in the western part of Dakshin Dinajpur district, West Bengal, India. Arab. J. Geosci. 14:1043. doi: 10.1007/s12517-021-07312-y
Berhanu, K. G., and Hatiye, S. D. (2020). Identification of groundwater potential zones using proxy data: case study of Megech watershed, Ethiopia. J. Hydrol. Reg. Stud. 28:100676, Available at: https://www.sciencedirect.com/science/article/pii/S2214581819303829
Beven, K. J., and Kirkby, M. J. (1979). A physically based, variable contributing area model of basin hydrology/un modèle à base physique de zone d’appel variable de l’hydrologie du bassin versant. Hydrol. Sci. Bull. 24, 43–69. doi: 10.1080/02626667909491834
Bhunia, G. S. (2020). An approach to demarcate groundwater recharge potential zone using geospatial technology. Appl. Water Sci. 10:138. doi: 10.1007/s13201-020-01231-1
Boroushaki, S., and Malczewski, J. (2008). Implementing an extension of the analytical hierarchy process using ordered weighted averaging operators with fuzzy quantifiers in ArcGIS. Comput. Geosci. 34, 399–410. doi: 10.1016/j.cageo.2007.04.003
Chowdhury, S., and Al-Zahrani, M. (2015). Characterizing water resources and trends of sector wise water consumptions in Saudi Arabia. J. King Saud Univ. Eng. Sci. 27, 68–82. doi: 10.1016/j.jksues.2013.02.002
Collin, M. L., and Melloul, A. J. (2003). Assessing groundwater vulnerability to pollution to promote sustainable urban and rural development. J. Clean. Prod. 11, 727–736, Available at: https://www.sciencedirect.com/science/article/pii/S0959652602001312
Dar, T., Rai, N., and Bhat, A. (2021). Delineation of potential groundwater recharge zones using analytical hierarchy process (AHP). Geol. Ecol. Landsc. 5, 292–307. doi: 10.1080/24749508.2020.1726562
Das, S. (2018). Geographic information system and AHP-based flood hazard zonation of Vaitarna basin, Maharashtra, India. Arab. J. Geosci. 11:576. doi: 10.1007/s12517-018-3933-4
Ding, Y., and Fotheringham, A. S. (1992). The integration of spatial analysis and gis. Comput. Environ. Urban Syst. 16, 3–19. doi: 10.1016/0198-9715(92)90050-2
Echogdali, F. Z., Boutaleb, S., Bendarma, A., Saidi, M. E., Aadraoui, M., Abioui, M., et al. (2022). Application of analytical hierarchy process and geophysical method for groundwater potential mapping in the Tata Basin, Morocco. Water 14:2393, Available at: https://www.mdpi.com/2073-4441/14/15/2393
Elsebaie, I. H., Kawara, A. Q., and Alnahit, A. O. (2023). Mapping and assessment of flood risk in the Wadi Al-Lith Basin, Saudi Arabia. Water 15:902, Available at: https://www.mdpi.com/2073-4441/15/5/902
Famiglietti, J. S., and Wood, E. F. (1991). Evapotranspiration and runoff from large land areas: land surface hydrology for atmospheric general circulation models. Surv. Geophys. 12, 179–204. doi: 10.1007/BF01903418
Ghanim, A. A. J., Al-Areeq, A. M., Benaafi, M., Al-Suwaiyan, M. S., Aghbari, A. A. A., and Alyami, M. (2023). Mapping groundwater potential zones in the Habawnah Basin of southern Saudi Arabia: an AHP-and GIS-based approach. Sustainability 15:10075, Available at: https://www.mdpi.com/2071–1050/15/13/10075
Ghosh, A., Adhikary, P. P., Bera, B., Bhunia, G. S., and Shit, P. K. (2022). Assessment of groundwater potential zone using MCDA and AHP techniques: case study from a tropical river basin of India. Appl. Water Sci. 12:37. doi: 10.1007/s13201-021-01548-5
Gigović, L., Pamučar, D., Bajić, Z., and Drobnjak, S. (2017). Application of GIS-interval rough AHP methodology for flood Hazard mapping in urban areas. Water 9:360, Available at: https://www.mdpi.com/2073-4441/9/6/360
Harmonized World Soil Database version 2.0. FAO; International Institute for Applied Systems Analysis (IIASA) ; (2023). Available at: http://www.fao.org/documents/card/en/c/cc3823en.
Ikirri, M., Boutaleb, S., Ibraheem, I. M., Abioui, M., Echogdali, F. Z., Abdelrahman, K., et al. (2023). Delineation of groundwater potential area using an AHP, remote sensing, and GIS techniques in the Ifni Basin, Western anti-atlas, Morocco. Water 15:1436, Available at: https://www.mdpi.com/2073–4441/15/7/1436
Kawara, A. Q., and Elsebaie, I. H. (2022). Development of rainfall intensity, duration and frequency relationship on a daily and sub-daily basis (case study: Yalamlam area, Saudi Arabia). Water 14:897, Available at: https://www.mdpi.com/2073–4441/14/6/897
Kazakis, N., Kougias, I., and Patsialis, T. (2015). Assessment of flood hazard areas at a regional scale using an index-based approach and analytical hierarchy process: application in Rhodope–Evros region, Greece. Sci. Total Environ. 15, 555–563, Available at: https://www.sciencedirect.com/science/article/pii/S0048969715305581
Khan, M. Y. A., ElKashouty, M., Subyani, A. M., Tian, F., and Gusti, W. (2021). GIS and RS intelligence in delineating the groundwater potential zones in arid regions: a case study of southern Aseer, southwestern Saudi Arabia. Appl. Water Sci. 12:3. doi: 10.1007/s13201-021-01535-w
Khan, M. Y. A., ElKashouty, M., and Tian, F. (2022). Mapping groundwater potential zones using analytical hierarchical process and multicriteria evaluation in the central Eastern Desert, Egypt. Water 14:1041, Available at: https://www.mdpi.com/2073–4441/14/7/1041
Khan, M. Y. A., ElKashouty, M., Zaidi, F. K., and Egbueri, J. C. (2023). Mapping aquifer recharge potential zones (ARPZ) using integrated geospatial and analytic hierarchy process (AHP) in an arid region of Saudi Arabia. Remote Sens. 15:2567, Available at: https://www.mdpi.com/2072-4292/15/10/2567
Khoshand, A., Kamalan, H., and Rezaei, H. (2018). Application of analytical hierarchy process (AHP) to assess options of energy recovery from municipal solid waste: a case study in Tehran, Iran. J. Mater. Cycles Waste Manag. 20, 1689–1700. doi: 10.1007/s10163-018-0736-3
Khosravi, K., Nohani, E., Maroufinia, E., and Pourghasemi, H. R. (2016). A GIS-based flood susceptibility assessment and its mapping in Iran: a comparison between frequency ratio and weights-of-evidence bivariate statistical models with multi-criteria decision-making technique. Nat. Hazards 83, 947–987. doi: 10.1007/s11069-016-2357-2
Kumar, A., and Krishna, A. P. (2018). Assessment of groundwater potential zones in coal mining impacted hard-rock terrain of India by integrating geospatial and analytic hierarchy process (AHP) approach. Geocarto Int. 33, 105–129. doi: 10.1080/10106049.2016.1232314
Linkov, I., Satterstrom, F. K., Steevens, J., Ferguson, E., and Pleus, R. C. (2007). Multi-criteria decision analysis and environmental risk assessment for nanomaterials. J. Nanopart. Res. 9, 543–554. doi: 10.1007/s11051-007-9211-0
Machiwal, D., Jha, M. K., and Mal, B. C. (2011). Assessment of groundwater potential in a semi-arid region of India using remote sensing, GIS and MCDM techniques. Water Resour. Manag. 25, 1359–1386. doi: 10.1007/s11269-010-9749-y
Mallick, J., Khan, R. A., Ahmed, M., Alqadhi, S. D., Alsubih, M., Falqi, I., et al. (2019). Modeling groundwater potential zone in a semi-arid region of Aseer using fuzzy-AHP and Geoinformation techniques. Water 11:2656, Available at: https://www.mdpi.com/2073–4441/11/12/2656
Mandal, U., Sahoo, S., Munusamy, S. B., Dhar, A., Panda, S. N., Kar, A., et al. (2016). Delineation of groundwater potential zones of coastal Groundwater Basin using multi-criteria decision making technique. Water Resour. Manag. 30, 4293–4310. doi: 10.1007/s11269-016-1421-8
Masoud, M. H. Z., Basahi, J. M., and Rajmohan, N. (2018). Impact of flash flood recharge on groundwater quality and its suitability in the Wadi Baysh Basin, Western Saudi Arabia: an integrated approach. Environ. Earth Sci. 77:395. doi: 10.1007/s12665-018-7578-0
Memarbashi, E., Azadi, H., Barati, A. A., Mohajeri, F., Passel, S. V., and Witlox, F. (2017). Land-use suitability in Northeast Iran: application of AHP-GIS hybrid model. ISPRS Int. J. Geo-Inf. 6:396, Available at: https://www.mdpi.com/2220–9964/6/12/396
Mondal, N. C., and Ajaykumar, V. (2022). Assessment of natural groundwater reserve of a morphodynamic system using an information-based model in a part of ganga basin, northern India. Sci. Rep. 12:6191, Available at: https://www.nature.com/articles/s41598-022-10254-4
Mondal, N. C., Singh, V. P., and Ahmed, S. (2012). Entropy-based approach for assessing natural recharge in unconfined aquifers from southern India. Water Resour. Manag. 26, 2715–2732. doi: 10.1007/s11269-012-0042-0
Mukherjee, P., Singh, C. K., and Mukherjee, S. (2012). Delineation of groundwater potential zones in arid region of India—a remote sensing and GIS approach. Water Resour. Manag. 26, 2643–2672. doi: 10.1007/s11269-012-0038-9
Naghibi, S. A., Pourghasemi, H. R., Pourtaghi, Z. S., and Rezaei, A. (2015). Groundwater qanat potential mapping using frequency ratio and Shannon’s entropy models in the Moghan watershed, Iran. Earth Sci. Inform. 8, 171–186. doi: 10.1007/s12145-014-0145-7
Ouma, Y. O., and Tateishi, R. (2014). Urban flood vulnerability and risk mapping using integrated multi-parametric AHP and GIS: methodological overview and case study assessment. Water 6, 1515–1545, Available at: https://www.mdpi.com/2073–4441/6/6/1515
Patra, S., Mishra, P., and Mahapatra, S. C. (2018). Delineation of groundwater potential zone for sustainable development: a case study from ganga alluvial plain covering Hooghly district of India using remote sensing, geographic information system and analytic hierarchy process. J. Clean. Prod. 172, 2485–2502, Available at: https://www.sciencedirect.com/science/article/pii/S0959652617328342
Prasad, R. K., Mondal, N. C., Banerjee, P., Nandakumar, M. V., and Singh, V. S. (2008). Deciphering potential groundwater zone in hard rock through the application of GIS. Environ. Geol. 55, 467–475. doi: 10.1007/s00254-007-0992-3
Prentice, I. C., Heimann, M., and Sitch, S. (2001). Contribution of working group I to the third assessment report of the intergovernmental panel on climate change. Chap. Clim. Change, 183–237. Available at: https://www.ipcc.ch/site/assets/uploads/2018/03/front-1.pdf
Priya, U., Iqbal, M. A., Salam, M. A., Nur-E-Alam, M., Uddin, M. F., Islam, A. R. M. T., et al. (2022). Sustainable groundwater potential zoning with integrating GIS, remote sensing, and AHP model: a case from north-Central Bangladesh. Sustainability 14:5640, Available at: https://www.mdpi.com/2071–1050/14/9/5640
Radulović, M., Brdar, S., Mesaroš, M., Lukić, T., Savić, S., Basarin, B., et al. (2022). Assessment of groundwater potential zones using GIS and fuzzy AHP techniques—a case study of the Titel municipality (northern Serbia). ISPRS Int. J. Geo-Inf. 11:257. doi: 10.3390/ijgi11040257
Rajasekhar, M., Sudarsana Raju, G., Sreenivasulu, Y., and Siddi, R. R. (2019). Delineation of groundwater potential zones in semi-arid region of Jilledubanderu river basin, Anantapur District, Andhra Pradesh, India using fuzzy logic, AHP and integrated fuzzy-AHP approaches. HydroResearch 2, 97–108, Available at: https://www.sciencedirect.com/science/article/pii/S2589757819300204
Rajmohan, N., Masoud, M. H. Z., and Niyazi, B. A. M. (2021). Assessment of groundwater quality and associated health risk in the arid environment, Western Saudi Arabia. Environ. Sci. Pollut. Res. 28, 9628–9646. doi: 10.1007/s11356-020-11383-x
Rimba, A. B., Setiawati, M. D., Sambah, A. B., and Miura, F. (2017). Physical flood vulnerability mapping applying geospatial techniques in Okazaki City, Aichi prefecture, Japan. Urban Sci. 1:7. doi: 10.3390/urbansci1010007
Saaty, T. L. (1988). “What is the analytic hierarchy process?” in Mathematical models for decision support. eds. G. Mitra, H. J. Greenberg, F. A. Lootsma, M. J. Rijkaert, and H. J. Zimmermann (Berlin, Heidelberg: Springer Berlin Heidelberg), 109–121.
Saranya, T., and Saravanan, S. (2020). Groundwater potential zone mapping using analytical hierarchy process (AHP) and GIS for Kancheepuram District, Tamilnadu, India. Model. Earth Syst. Environ. 6, 1105–1122. doi: 10.1007/s40808-020-00744-7
Senapati, U., and Das, T. K. (2021). Assessment of basin-scale groundwater potentiality mapping in drought-prone upper Dwarakeshwar River basin, West Bengal, India, using GIS-based AHP techniques. Arab. J. Geosci. 14:960. doi: 10.1007/s12517-021-07316-8
Senapati, U., and Das, T. K. (2022). GIS-based comparative assessment of groundwater potential zone using MIF and AHP techniques in Cooch Behar district, West Bengal. Appl. Water Sci. 12:43. doi: 10.1007/s13201-021-01509-y
Shiklomanov, I. A. (1991). World water resources: a new appraisal and assessment for the 21st century, vol. 25, 93–126.
Siddayao, G., Valdez, S., and Fernandez, P. (2014). Analytic hierarchy process (AHP) in spatial modeling for floodplain risk assessment. Int. J. Mach. Learn. Comput. 4, 450–457. doi: 10.7763/IJMLC.2014.V4.453
Sivapalan, M., Wood, E. F., and Beven, K. J. (1990). On hydrologic similarity: 3. A dimensionless flood frequency model using a generalized geomorphologic unit hydrograph and partial area runoff generation. Water Resour. Res. 26, 43–58, Available at: https://onlinelibrary.wiley.com/doi/abs/10.1029/WR026i001p00043
Wang, Y., Hong, H., Chen, W., Li, S., Pamučar, D., Gigović, L., et al. (2019). A hybrid GIS multi-criteria decision-making method for flood susceptibility mapping at Shangyou, China. Remote Sens. 11:62, Available at: https://www.mdpi.com/2072-4292/11/1/62
Zaidi, F. K., Nazzal, Y., Jafri, M. K., Naeem, M., and Ahmed, I. (2015). Reverse ion exchange as a major process controlling the groundwater chemistry in an arid environment: a case study from northwestern Saudi Arabia. Environ. Monit. Assess. 187:607. doi: 10.1007/s10661-015-4828-4
Multsch, S., Alrumaikhani, Y., Alharbi, O., Frede, H. G., and Breuer, L. Internal water footprint assessment of Saudi Arabia using the water footprint assessment framework (WAF). (2011). 19th International Congress on Modelling and Simulation, Perth, Australia.
Keywords: AHP, GIS, groundwater recharge, Yalamlam, Saudi Arabia
Citation: Elsebaie IH and Kawara AQ (2024) Modeling groundwater recharge potential zones in the Wadi Yalamlam, Saudi Arabia. Front. Water. 6:1387741. doi: 10.3389/frwa.2024.1387741
Edited by:
Boris Faybishenko, Berkeley Lab (DOE), United StatesReviewed by:
Umit Yildirim, Bayburt University, TürkiyeNepal Chandra Mondal, National Geophysical Research Institute (CSIR), India
Copyright © 2024 Elsebaie and Kawara. This is an open-access article distributed under the terms of the Creative Commons Attribution License (CC BY). The use, distribution or reproduction in other forums is permitted, provided the original author(s) and the copyright owner(s) are credited and that the original publication in this journal is cited, in accordance with accepted academic practice. No use, distribution or reproduction is permitted which does not comply with these terms.
*Correspondence: Atef Q. Kawara, 439106883@student.ksu.edu.sa