 Srividya Hariharan Sudha
 Elisa Ragno
 Oswaldo Morales-Nápoles
- Hydraulic Structures and Flood Risk, Department of Hydraulic Engineering, Faculty of Civil Engineering and Geosciences, Delft University of Technology, Delft, Netherlands
The Netherlands has traditionally focused on managing flood risk. However, the frequent occurrence of droughts in recent years has brought attention to managing both extremes. Transitions between these opposite extremes pose additional challenges to water management, requiring a trade-off between water storage during dry periods and flood control during wet periods. In this study, we develop a framework to define wet and dry meteorological events and study their transitions using timeseries of meteorological data namely, precipitation, temperature and potential evapotranspiration. The magnitudes of event characteristics are retained, which presents a different approach to the normalized climate indices (like the Standardized Precipitation Index) commonly used in literature. We apply this framework to the Dutch part of the Meuse River basin in northwestern Europe using climate observations between 1951 and 2022. Our analysis shows a statistically significant increase in the amount of water lost from potential evapotranspiration compared to water gained from precipitation between April and September of the water year and an increase in the length of this drying period over the past decades. Such trends in the drying period are related to variability in potential evapotranspiration caused by rising temperatures in the region, indicating the potential for increased water shortage in Spring and Summer due to future temperature increases. We also identify abrupt transitions between opposite extreme events where there is a lack of water at the end of the second event as meteorological situations that challenge water management due to overlapping impacts like flash flooding, less time for water storage, and reduced water availability. We see such conditions occur in 6% of the wet-dry transitions and 20% of the dry-wet transitions, highlighting meteorological scenarios to which the hydrological response of the catchment can be simulated to increase our understanding of the combined risk of floods and droughts.
1 Introduction
Hydrological extremes, specifically floods and droughts, are some of the most common natural hazards causing significant humanitarian and socio-economic impacts around the world (Leng et al., 2016; Collet et al., 2018; Kreibich et al., 2019; Freebairn et al., 2020; Brunner et al., 2021; Beevers et al., 2022; Rohde, 2023). In the 20th century, floods and droughts were the most fatal disasters globally, resulting in millions of deaths each year (Our World in Data, 2023). Between 2000 and 2019, they affected at least three billion people worldwide (United Nations Office for Disarmament Affairs, 2020).
Hydrological extremes can occur at the same location consecutively and interact with each other over time (Krysanova et al., 2008; De Luca et al., 2020; He and Sheffield, 2020; Rashid and Wahl, 2022). Such events are commonly known as compound events in literature. For example, the recent 2023 drought that affected several regions across Europe (Toreti et al., 2023) was interrupted by torrential precipitation that led to flooding in several regions, including Zaragoza (Spain) in July, Emilia-Romagna (Italy) in May, Black Sea region (Turkey) between March–July and parts of England and Wales in May.
An increase in the frequency and magnitude of floods and droughts is expected in many parts of the world due to climate change [Krysanova et al., 2008; Mishra and Singh, 2010; IPCC (Intergovernmental Panel on Climate Change), 2021; Rodell and Li, 2023], which in turn can increase the alternations between these two extremes (Krysanova et al., 2008; Pinho et al., 2015; Collet et al., 2018; Visser-Quinn et al., 2019; Chen et al., 2020; Freebairn et al., 2020; Fasihi et al., 2021; Beevers et al., 2022). This raises the question of whether hydrological extremes should be investigated in a common framework to be able to design effective water management strategies. To fully understand and manage the combined risk of multiple hazards (here, floods and droughts), Gill and Malamud (2014) propose a multihazard methodology where a key aspect is the identification of hazard characteristics and interactions in a defined spatial region. Therefore, identifying hazard characteristics and their interactions is the starting point for a combined risk assessment of hydrological extremes.
The definition of hazards adopted during risk assessment influences their estimated combined risk (Leng et al., 2016; Beevers et al., 2022). To understand climate hazards and define their characteristics, it is essential to define and analyze the meteorological conditions generating them (De Michele et al., 2020). This is because wet conditions generated by heavy rainfall and/or low evapotranspiration can trigger floods (Sivapalan et al., 2005; He and Sheffield, 2020). On the other hand, dry conditions caused by prolonged periods of low precipitation and/or high evapotranspiration are often linked to droughts (He and Sheffield, 2020). Therefore, we define meteorologically extreme wet and dry conditions and investigate the transitions between these extremes in this paper. We adopt the terminology wet/dry eventś to indicate the meteorological situation that results in an abundance/lack of water, as a meteorological extreme situation does not necessarily imply observed flooding/drought (i.e. hazard) (Van Der Wiel et al., 2020).
Numerous studies have investigated both wet and dry events (reviewed in Fasihi et al., 2021 and Beevers et al., 2022, including Du et al., 2013; Nkiaka et al., 2017; Quesada-Montano et al., 2018), but only a few analyze them in parallel. Among these studies, some specifically explore a particular flood and drought event of the past (Dong et al., 2011; Seager et al., 2012; Parry et al., 2013; Wang et al., 2017) or focus on future global warming scenarios (Leng et al., 2016; Collet et al., 2018; Swain et al., 2018; Yoon et al., 2018; Madakumbura et al., 2019; Visser-Quinn et al., 2019; Chen et al., 2020). In other studies, a preference is given to exploring the dry-to-wet event transitions over wet-to-dry event transitions (Yan et al., 2013; He and Sheffield, 2020; Chen and Wang, 2022; Rashid and Wahl, 2022; Zhang et al., 2023).
When defining (wet and dry) events, studies that investigate both extremes in parallel often represent the meteorological situation using normalized climate indices. Examples include the Standardized Precipitation Index, SPI (in Du et al., 2013; Nkiaka et al., 2017; He and Sheffield, 2020; Shi et al., 2020, also seen in the review by Fasihi et al., 2021), Standardized Precipitation Evapotranspiration Index, SPEI (Chen et al., 2020; Rashid and Wahl, 2022), and the Palmer Drought Severity Index, PDSI (De Luca et al., 2020; Zhang et al., 2023). These standardized metrics select wet and dry periods based on deviations from the long-term average. This type of information is valuable for detecting and assessing extreme events compared to normal conditions. However, information on actual water availability needed for water management practices is hidden.
When the standardized indices are calculated, meteorological variables are aggregated over different time scales based on the type of (potential) impact investigated, which can vary from meteorological or agricultural risk in the short term to hydrological risk in the long term. The variables are aggregated over a month (Chen et al., 2020; De Luca et al., 2020; He and Sheffield, 2020; Zhang et al., 2023), 3–6 months, (Shi et al., 2020; Rashid and Wahl, 2022) up to a year (Du et al., 2013; Nkiaka et al., 2017). However, studying individual extreme events rather than deviations over such long timescales is more informative from a risk assessment point of view (Raju et al., 2022). These meteorological wet and dry events (with daily time scales) are also more suitable for implementation as climate forcing in hydrological models to simulate catchment response to alternating hydrological extremes.
The Netherlands is internationally renowned for its flood risk management, but drought events between 2018 and 2022 have shed light on the need to manage drought risk as well (Brockhoff et al., 2022; Nunez Sanchez and van Beek, 2022; Bartholomeus et al., 2023). Frequent precipitation during the year feeds the country's freshwater reserves and the Rhine and Meuse rivers that flow through it (Brockhoff et al., 2022). The southern and eastern regions of the Netherlands, like the Meuse River basin region, have a higher dependence on precipitation due to their higher elevation compared to the river level (Philip et al., 2020, see Figure 2B). The high dependence on precipitation makes these regions suitable for investigating meteorological wet and dry events. Therefore, we choose the Meuse catchment in southeastern Netherlands as the study area. Additionally, in the review by Fasihi et al. (2021), the river basin scale was identified as the most common and suitable spatial scale for analyzing combined hydrological extremes for water resource management, as most issues related to floods and droughts are handled locally.
The main objective of this study is to develop a framework to define meteorological wet and dry events and the transitions between them. We apply this framework to the Meuse River basin that lies in the Netherlands as a case study to understand climate-related wet and dry events of the region. Through this assessment, we wish to get perspective on the characteristics and alternations of wet and dry events that can be used to inform water management practices related to hydrological extremes. Here, we investigate wet and dry events in tandem while considering their transitions (both wet-to-dry and dry-to-wet) for the past and present time. The absolute magnitude of events is retained by using meteorological variables as such rather than climate indices to define them. We also individually describe wet and dry events without aggregating over time to determine specific meteorological situations that could lead to flood or drought events.
In the remainder of the paper, we describe the case study region, the climate data used, and the definitions adopted for the wet and dry events and their transitions in Section 2. The results and discussions of this assessment are described in Sections 3, 4 before concluding the analysis in Section 5. Additional information is summarized in the Supplementary material.
2 Materials and methods
The methodological framework applied to investigate meteorological wet and dry event transitions is outlined in Figure 1. We first retrieve and process climate data, namely, precipitation (P), temperature (T) and potential evapotranspiration (ET0) time series for the study area (Sections 2.1, 2.2). Then, we analyze the climate-related wetting and drying behavior of the region over a yearly scale (Section 2.3). We then define the wet and dry meteorological events and determine their timing, duration and magnitude as event characteristics (Section 2.4). For these events, we investigate the transitions between opposite conditions, that is, wet-dry and dry-wet transitions (Section 2.5). Finally, we investigate the recovery of climate after a (wet/dry) event but before its transition to the opposite extreme event to obtain situations which could pose challenges for water management (Section 2.5).
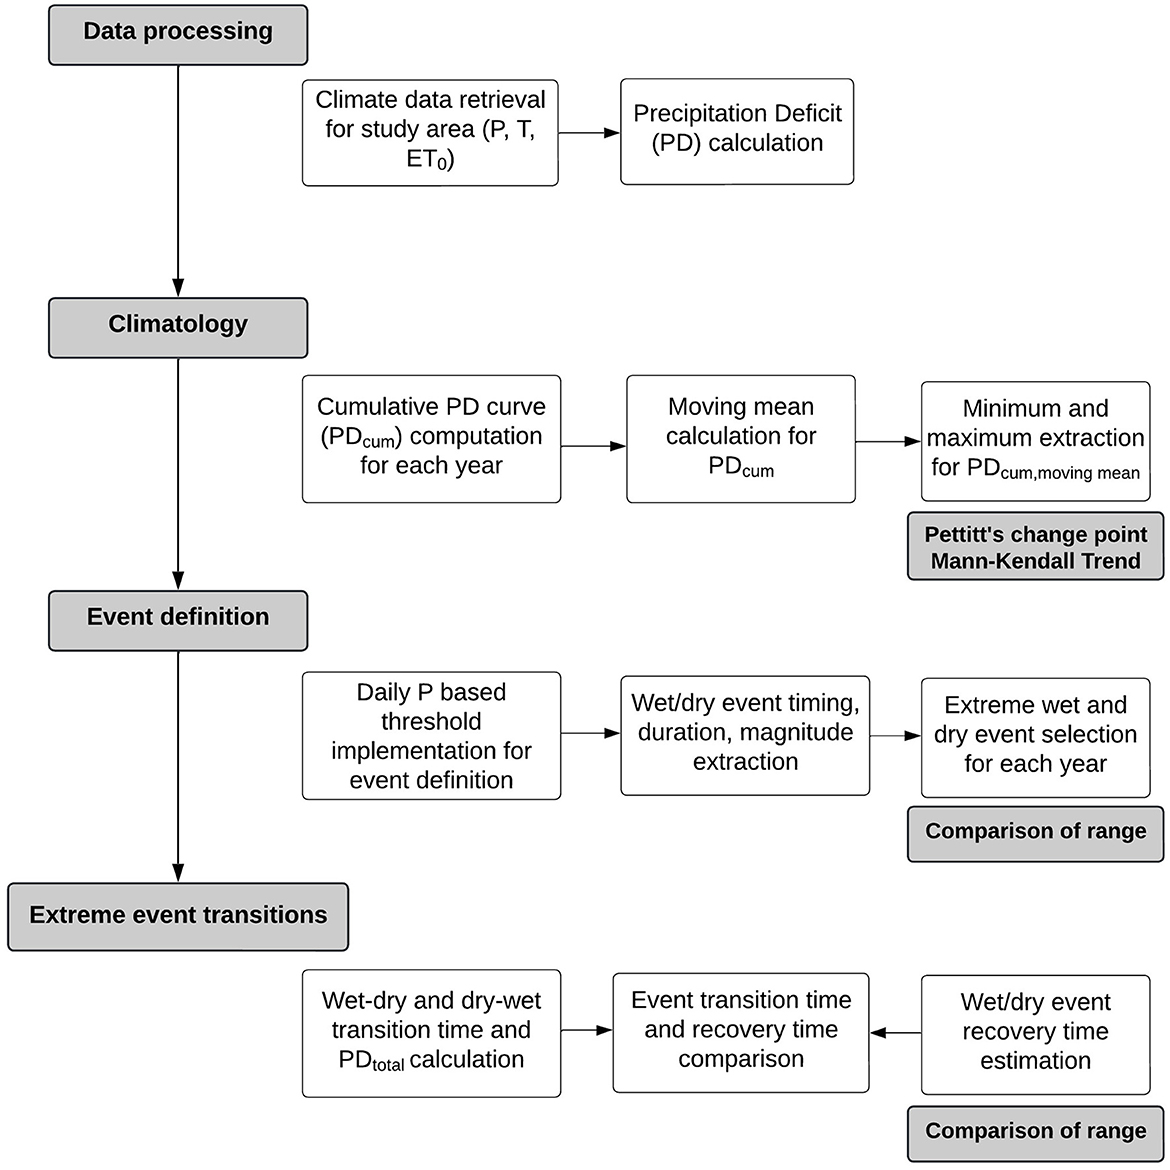
Figure 1. Methodological framework to investigate meteorological wet and dry event transitions.
2.1 Study area
The Meuse is a major European river that originates in northern France and flows through Belgium and the Netherlands before draining into the North Sea (see Figure 2A). We restrict our analysis to the portion of the Meuse flowing through the Netherlands with an area of around 12,400 km2. This region begins in the Belgian city of Liège, flows through Maastricht, and follows the Netherlands-Germany border before turning west at Venlo (Figure 2C). There, it runs parallel to the Waal River and enters the Rhine-Meuse-Scheldt delta before draining into the North Sea. River discharge at the Belgium–Dutch border can range from <10 m3s-1 to >2,500 m3s–1, with average annual discharge of around 265 m3s–1 (van Vliet and Zwolsman, 2008; Brockhoff et al., 2022).
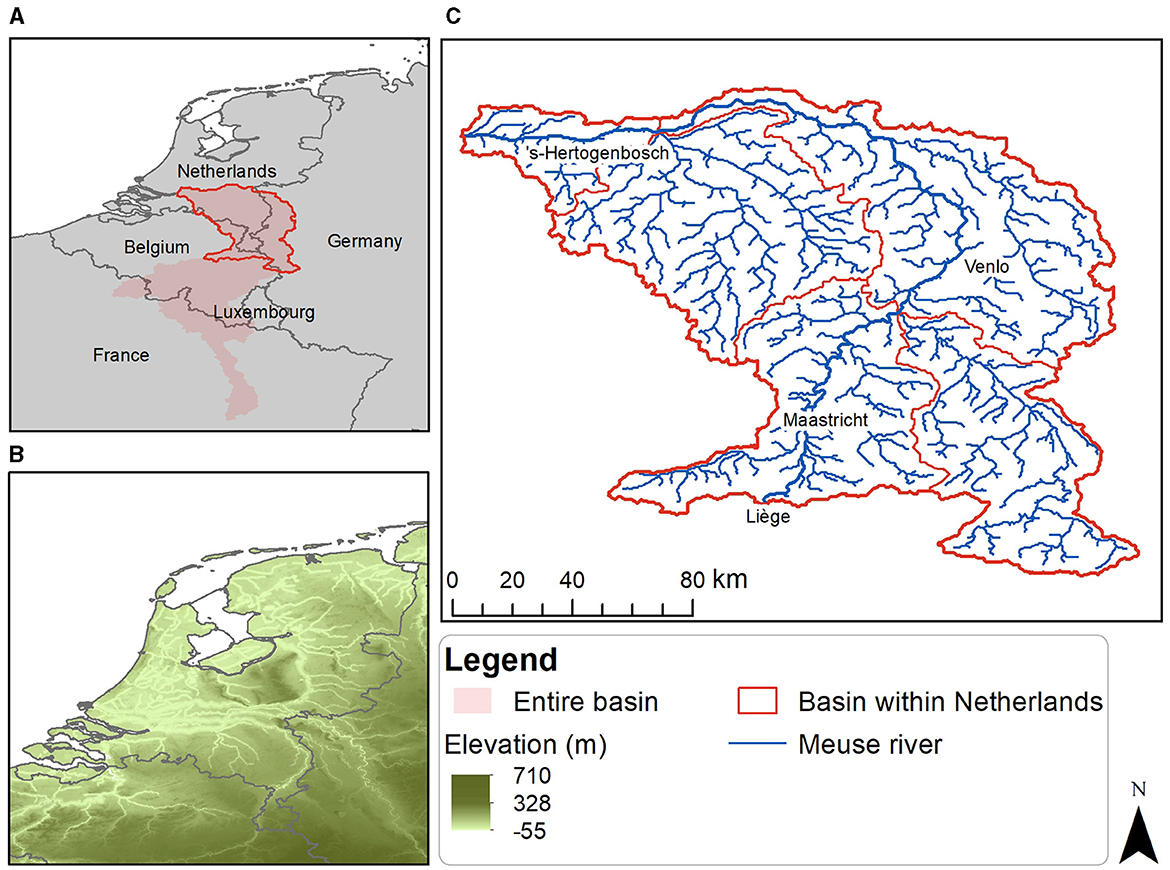
Figure 2. Map of the study area showing the Dutch Meuse River basin. The entire Meuse basin is shown in (A) with the Dutch part of the basin highlighted. The digital elevation map of the Netherlands is shown in (B). The Dutch Meuse River basin, the sub-basins and the river network are shown in (C). The elevation, sub-basin and river network maps are obtained from the HydroSHEDS database (Lehner and Grill, 2013).
The Dutch part of the Meuse catchment (Dutch Meuse River basin) falls under the “Temperate Oceanic (Cfb)” climate as per the Köppen–Geiger climate classification (Peel et al., 2007). Regions in this category experience above 0°C average temperature in their coldest months, below 22°C average temperature in all months and have at least 4 months with average temperature above 10°C. They are also expected to experience no significant precipitation difference between seasons. The basin is characterized by sandy plateaus intersected by sand and peat stream valleys, which are responsive to precipitation (Ritzema and Stuyt, 2015; Brockhoff et al., 2022). Additionally, the Meuse is rain-fed (Bouaziz et al., 2022), and its flow regime is controlled by rainfall-evapotranspiration (van Vliet and Zwolsman, 2008). These characteristics mean that the region is susceptible to both flooding and drought, making it a suitable case study for exploring meteorological wet and dry events.
2.2 Data description and processing
The interest of this paper is in defining wet and dry events from a meteorological perspective. Hence, we used the E-OBS ensemble dataset (https://surfobs.climate.copernicus.eu/), which includes daily gridded observational datasets for precipitation, mean temperature, sea level pressure and global radiation across Europe. The ensemble data is based on the station data collected by the European Climate Assessment & Dataset (ECA&D) initiative (Cornes et al., 2018). We used version 26.0e of the dataset with a spatial resolution of 0.1-degree available from 1950 to 2022.
We estimated potential evapotranspiration by applying the Makkink formula (Hooghart and Lablans, 1988) to the mean temperature, sea level pressure and global radiation datasets. The Makkink equation is adopted as the standard method to estimate reference evapotranspiration by the Royal Netherlands Meteorological Institute (KNMI) in the Netherlands (Hiemstra and Sluiter, 2011). Daily Makkink evapotranspiration (ET0) for grass (the reference crop) that has no shortage of water was obtained using Equation (1) where K↓ is the incoming solar radiation, s is the slope of the saturation water vapor-temperature curve at air temperature, γ is the psychometric constant, and Lv is the latent heat of vaporization. The precipitation, mean temperature, and potential evapotranspiration data were used to analyze the meteorological wet and dry events.
We follow the water year convention, defined as the 12-month period from October 1 of a year to September 30 of the following year (United States Geological Survey, 2022). The water year is designated by the calendar year in which it ends. In hydrology, precipitation totals are commonly measured over water year periods as opposed to the calendar year, as the precipitation that falls toward the end of the calendar year (in Autumn and Winter) usually accumulates as snow and does not impact streamflow until it melts during Spring or Summer of the following year. The idea behind this is to ensure that the runoff of the preceding 12 months is attributable to the precipitation of the same 12 months as much as possible (Johnstone and Cross, 1949). Thus, we use the E-OBS records between October 1950 and September 2022, namely, water years 1951–2022, to analyze wet and dry events.
The catchment boundary was retrieved from the HydroBASINS database (https://www.hydrosheds.org/), which provides polygons of sub-basin boundaries at a global scale (Lehner and Grill, 2013). HydroBASINS is a secondary product of the HydroSHEDS database that provides digital elevation data in support of hydro-ecological research (details on HydroBASINS sub-basin extraction methodology are elaborated in Lehner, 2014, 2022). The catchment boundary for the Dutch Meuse basin (see Figure 2C) was used to extract the precipitation, mean temperature and potential evapotranspiration in the basin. To get a time series of these variables for the region, daily weighed means were calculated using the relative area of the E-OBS grids within the catchment boundary as weights. The daily time series of weighted average meteorological variables between 1951 and 2022 water years are thereby used to investigate opposite hydrological events here.
We also obtained daily precipitation deficit (PD), defined as the difference between daily potential evapotranspiration (ET0) and precipitation (P) (see Equation 2), a variable commonly used in the Netherlands to study drought (Philip et al., 2020; Mens et al., 2022; van Oort et al., 2023). A positive precipitation deficit means a relative excess of potential evapotranspiration over precipitation, that is, a dry condition. A negative precipitation deficit denotes a relative lack of potential evapotranspiration over precipitation, that is, a wet condition.
Based on the catchment average E-OBS data for water years 1951–2022, the annual average mean precipitation is 783.0 mm/year, and the average daily mean temperature is 9.96°C. The annual average precipitation deficit calculated for the period is –229.8 mm/year, the negative value denoting a generally wet condition. All seasons receive similar rainfall except Spring, and Summer experiences higher temperatures (see Table 1). Also, Spring and Summer have relatively dry conditions with more potential evapotranspiration than precipitation (Table 1). We found a difference of around 13 mm/year when comparing the mean annual precipitation obtained from the E-OBS data with the World Bank Climate Change Knowledge Portal (Harris et al., 2020) between 1991–2020. However, this value is only a small percentage (1.6%) compared to the annual average precipitation estimated by E-OBS in that time period. The mean annual temperature estimated using E-OBS data for the region also closely matches the values obtained from the World Bank Climate Change Knowledge Portal, providing confidence in the data.
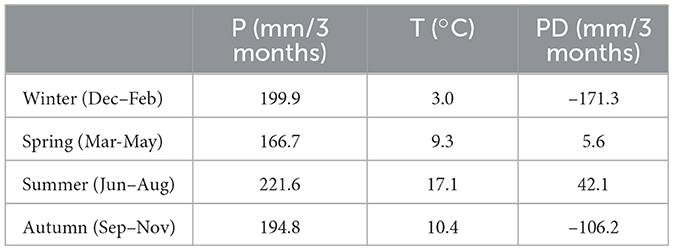
Table 1. Average seasonal precipitation (P), mean temperature (T), and precipitation deficit (PD) for the Dutch Meuse River basin between water year 1951–2022 calculated using E-OBS data.
2.3 Climatological wet and dry periods
Precipitation deficit gives an estimate of the net water in the region, allowing the comparison of the incoming precipitation in relation to the potential outgoing evapotranspiration. The precipitation deficit accumulated over a daily scale since the beginning of the water year on October 1st indicates the cumulative precipitation deficit over that year. The cumulative precipitation deficit during 1951–2022 stays below the 0 mm line (see Figure 3), indicating a general excess of rainfall compared to potential evapotranspiration in the Dutch Meuse Basin. The long-term climate of a river basin can be quantified using the climate aridity index (Ranjbar et al., 2018; Sarker, 2021), defined as the ratio between mean annual potential evaporation and precipitation (Budyko, 1974). Bouaziz et al. (2022) estimated the climate aridity index of the French part of the Meuse basin to be 0.62. The ratio between potential evapotranspiration and precipitation (called the aridity index) is estimated to be 0.62 for the French part of the Meuse basin in Bouaziz et al. (2022). This ratio is <1, showing a relative excess of precipitation in this region, consistent with our observation.
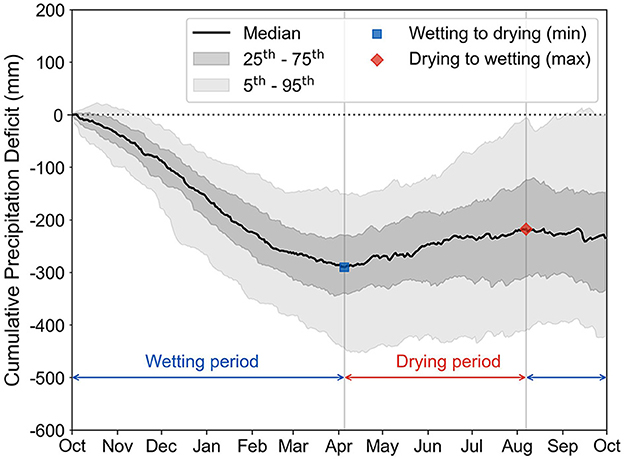
Figure 3. Median and variability (25th–75th percentile range and 5th–95th percentile range) of cumulative precipitation deficit starting from the beginning of the water year on October 1st. The distribution is calculated based on observations between water years 1951 and 2022. The shift between the wetting to drying period is the global minimum, and the shift from drying to wetting period is the local maximum of cumulative precipitation deficit for that year.
Despite the general surplus of water, the water year shows an average wetting period and a drying period (Figure 3). That is, we see a decrease in the cumulative precipitation deficit from the beginning of the water year till mid-Spring followed by an increase which stops when Summer ends and starts decreasing again till the end of the water year (Figure 3). The increase in cumulative precipitation deficit between April and August and the subsequent decrease between August and October is consistent with the trend seen in Philip et al. (2020). At the end of the water year, cumulative precipitation deficit ranges from –421.5 to –2.1 mm at the 5th–95th percentile range. Water years with cumulative precipitation deficit outside this range at the end of the water year are summarized in Supplementary Table S2.
To investigate whether these wetting and drying periods seen between 1951 and 2022 have changed over time, we identify the extremums (minimum and maximum) in the cumulative precipitation deficit curves averaged over the yearly scale. We first calculated the moving means of cumulative precipitation deficit over windows of 30 and 10 years. To obtain these moving mean curves, we calculated the average precipitation deficit over the chosen window for each day within the year and then accumulated the average values to get the cumulative precipitation deficit for that window. We use two window sizes as the longer 30-year means capture multidecadal variability and thus show long-term climatology (World Meteorological Organization, 2019), whereas the shorter 10-year means represent mid-term climate trends. We calculated the minimum and maximum points in the moving mean curves to determine when the wetting and drying periods end. To automatically identify these points, we fit continuous and double-differentiable splines to the moving means and then obtain the minimum and maximum.
We performed this analysis by first fitting a spline of degree 4 to the moving mean curves with a smoothing factor of 90 using the Scipy Interpolation package in Python. We then obtained the global minimum of the spline to mark the shift from wetting to drying seen in the cumulative precipitation deficit and the local maximum after this global minimum to mark the shift from drying to wetting (Figure 3). We obtained the local maximum to the right of the global minimum instead of the global maximum to determine the shift from drying to wetting that happens at the end of Summer in the second half of the water year (Figure 3). The global minimum and local maximum for the 30-year and 10-year moving means of cumulative precipitation deficit hereby obtained give us the exact time the climate shifts between wetting and drying and the precipitation deficit accumulated at that time (see Section 3.1, Figure 6A for illustration of the spline fitted to the moving mean curves and the minimum and maximum obtained from the spline).
Change points and trends in wetting and drying periods over time were first visually investigated to identify potential changes in their timing and net water availability. To identify the exact time when the distribution of data changes (statistically) significantly, we performed Pettitt's test, which is commonly applied to detect a single change point in hydroclimatic data. Pettitt's test (Pettitt, 1979) detects the point in a time series where there is a statistically significant change in the mean before and after that point (Jaiswal et al., 2015; Sadeqi et al., 2024). We used the pyHomogeneity package (Hussain et al., 2023) in Python to perform Pettitt's test for change point detection at a 5% significance level. Here, Pettitt's statistic U(k) is calculated using Equation (3) where rk is the rank of the kth observation xk in the complete sample of n observations. U(k) is calculated for every k = 1, 2, 3, ..., n. The maximum of the absolute value of U(k) is the test statistic Û and refers to the probable change point k (see Equation 4).
We also performed trend analysis to determine the significance of trends seen in the different time periods determined from visual investigation and change point analysis. Mann–Kendall trend test (Mann, 1945; Kendall, 1975) was used to investigate consistently increasing or decreasing trends, that is, monotonic trends in the time series (Jaiswal et al., 2015). We used the pyMannKendall package (Hussain and Mahmud, 2019) in Python to perform the original Mann–Kendall test, which does not consider serial correlation or seasonal effects, to identify trends in the wetting and drying periods at a 5% significance level. Here, the Mann–Kendall score S is computed using Equation (5) where j>i and sign(xj−xi) is obtained using Equation (6). This score estimates the difference between observations obtained later in time and observations made earlier. When S is a large positive number, an increasing trend is indicated. When it is a large negative number, a decreasing trend is indicated. And when the absolute value of S is small, no trend is indicated. The Mann–Kendall test of the pyMannKendall package also estimates the slope of the trend line using Theil–Sen's slope estimator (Sen, 1968; Theil, 1992). In this approach, the magnitude of the monotonic trend is estimated as the median of the set of slopes (xj−xi)/(j−i) joining pairs of points with j>i.
Precipitation deficit depends on precipitation and potential evapotranspiration as per its definition (see Equation 2). The Makkink evapotranspiration (ET0, see Equation 1) used to derive PD is, in turn, mainly dependent on temperature and radiation (Sluijter et al., 2018; Philip et al., 2020). Therefore, the trends in precipitation deficit investigated here can be explained by analyzing trends in precipitation, potential evapotranspiration and temperature. In this respect, we look at change points and trends in total annual precipitation, potential evapotranspiration, and temperature individually and compare them to trends in total annual PD. The trends are calculated over 30-year moving windows as before to capture long-term climate variations.
2.4 Wet and dry event definition
In order to characterize meteorological wet and dry events and their alternations, we first define individual wet and dry events and their absolute magnitudes as an alternative to standardized indices aggregated over time like SPI-3 months, SPEI-6 months, etc. We adopt the threshold level method recommended in the literature review by Brunner et al. (2021) for unifying the definition of hydrological extremes (used in Yan et al., 2013; Madakumbura et al., 2019; De Michele et al., 2020). This method broadly defines wet and dry events as periods with more or less rain than a chosen amount. Specifically, meteorological extreme events were defined by implementing precipitation-based thresholds, called the wet and dry thresholds, to classify each day as wet or dry. A dry event is said to occur when daily precipitation is below the dry threshold, comprising a series of dry days with no gap between them (see Figure 4). Similarly, a wet event occurs when precipitation is above the wet threshold, comprising a series of wet days (Figure 4).
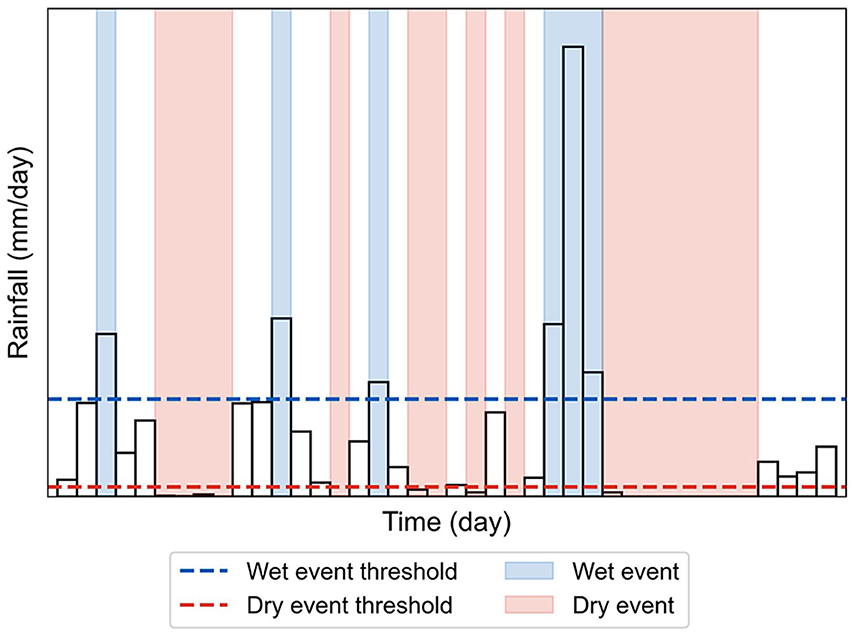
Figure 4. Illustration of meteorological wet and dry events selection using the threshold level method.
To characterize the meteorological situation during the events, we obtain the duration, timing and magnitude of the wet and dry events as event characteristics. The wet/dry event's duration is defined as the consecutive number of days daily precipitation is above/below its corresponding threshold. The timing of an event is determined by the day the event starts, that is, the first wet/dry day of the wet/dry event. The magnitude of a wet event is calculated as the total rainfall accumulated during the event (Ptotal). The magnitude of a dry event is the maximum value of the daily mean temperature recorded during the event (Tmaximum) as dry events, by definition, have negligible rain (<1 mm/day).
The choice of wet and dry event thresholds is motivated by the widely used climate indices developed by the Expert Team on Climate Change Detection and Indices (ETCCDI) (https://www.ecad.eu/indicesextremes/index.php), which allows for the assessment of climate extremes using daily temperature and precipitation data. The ETCCDI indices use 10 mm daily rainfall to categorize “heavy precipitation” days and 1 mm to categorize “dry” days. Additionally, the Royal Netherlands Meteorological Institute (KNMI) defines a wet day as a day with a rain of 10 mm or more within 24 h (Koninklijk Nederlands Meteorologisch Instituut, 2022). Thus, we used 10 mm as the wet event threshold. We selected 1 mm as the dry event threshold to additionally give room for any measurement errors of small rainfall values on days without rain. For each meteorological wet and dry event defined using these thresholds, we obtained the timing (the date the event starts), duration, and magnitude of the event as the event characteristics.
We obtained 973 wet events (around 13 events/year) and 3,993 dry events (around 55 events/year) between 1951 and 2022 through this approach. From this, we selected only the “extreme” wet and dry event each year to determine the sort of extreme meteorological condition that could lead to a flood/drought event in the catchment. We define the extreme wet event of a year as the event with the highest accumulated rainfall and the extreme dry event of a year as the event with the longest duration. This definition of yearly events is based on the typical approach of annual maxima used for defining floods and the period of water deficiency used for defining meteorological drought in literature. This selection allows us to get extreme wet/dry events of comparable intensity (i.e., the worst event of each year) and frequency (i.e., one event per year), allowing for the concurrent assessment of the opposite extremes. The database of extreme wet and dry events obtained (with 72 events each) was used for the remainder of the study.
As an additional analysis, we performed a sensitivity check to examine how event characteristics would change with different values of wet and dry event thresholds (see Section 3.3). For wet events, we compared events selected using the 10 mm threshold with 5 mm and 15 mm thresholds. For dry events, we compared events obtained using the 1 mm threshold with 2 mm and 3 mm thresholds. We also compared different methods of selecting the yearly wet and dry events (see Section 3.3). We did this by comparing yearly wet events selected based on total accumulated rainfall and average rainfall amounts. We compared dry events with the longest duration with events selected based on the maximum temperature recorded during the event.
2.5 Post-event transition and recovery
We are interested in investigating the wet and dry events described in Section 2.4 in parallel to understand alternations between opposite meteorological conditions. For this reason, we defined event transitions as pairs of opposite extreme events occurring one after the other irrespective of the (lag) time between them, i.e., consecutive wet-dry and dry-wet yearly event pairs. Then the time between the first event's beginning and the second event's end in an event transition is defined as the wet-dry/dry-wet transition time, similar to the extreme transition times used in De Luca et al. (2020) (see Figure 5). The beginning of an event is marked by the first wet/dry day of the event. Similarly, the end of an event is the last wet/dry day of the event.
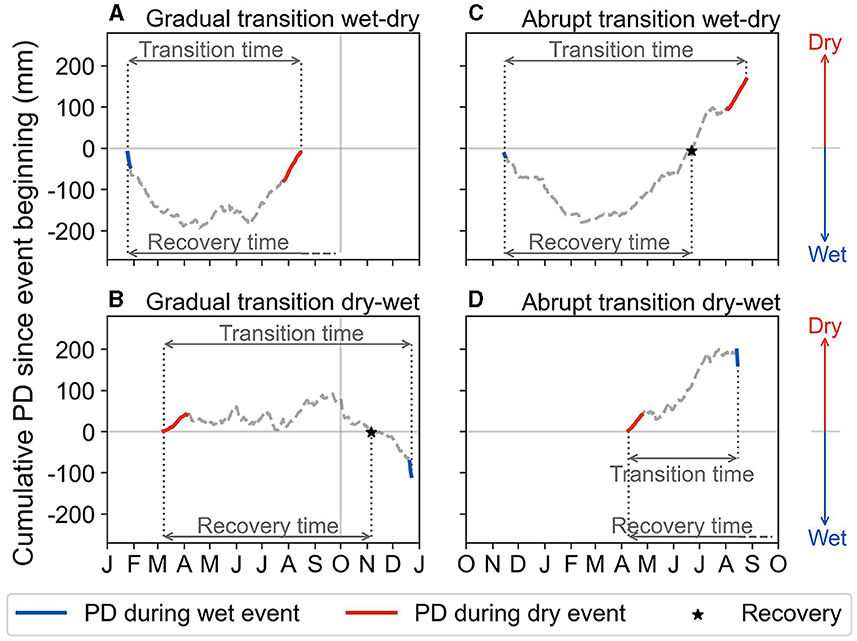
Figure 5. Illustration of transition time and recovery time of opposite events shown along with the cumulative precipitation deficit (PD) calculated since the beginning of the first event. Definitions for wet-dry transitions are shown in (A, C), and dry-wet transitions are shown in (B, D). Cumulative PD at the end of the second event of the transition is defined as the total accumulated precipitation deficit of the transition, PDtotal. The wet-dry transition, where the wet event recovers before the dry event, and the dry-wet transition, where the dry event does not recover before the wet event, show abrupt transitions between opposite events (C, D).
Transition time essentially denotes the time taken to go from one extreme (wet or dry) condition to the other, estimating the time available for societies to respond to the first extreme and prepare for the upcoming opposite extreme. We also calculated the accumulated precipitation deficit during event transitions (PDtotal) to indicate the relative scarcity of precipitation with respect to potential evapotranspiration during transitions (see Figure 5). This gives an estimate of the net water (excess or shortage) available at the end of the transition, which can help determine the impact of the transition on water resources.
Note that if two consecutive wet/dry events occur before the opposite dry/wet event takes place, we consider the first event as the start of the transition and include the second event in the transition time. For example, if two dry events occur consecutively before a wet event, the transition will start from the first dry event and end with the wet event. In this case, the accumulated precipitation deficit calculated for the transition time will include the water depleted during both dry events and help gauge the total water lost during this period. The same logic applies to wet-dry event transitions where the accumulated precipitation deficit will account for the excess water gained during the two consecutive wet events before the subsequent dry event occurs.
Additionally, we define the recovery time of an event as the number of days needed for precipitation deficit that was accumulated since the event's beginning to become equal to 0 mm (see Figures 5B, C). The recovery time estimates the time taken to lose all the water received during a wet event or to gain the water lost during a dry event, i.e., the time taken to go back to the pre-event state. Essentially, it indicates the time period over which the effect of the extreme event is felt in the region, considering only the meteorological situation present during that event. Recovery time is calculated for each wet/dry extreme event described in Section 2.4. To calculate recovery time, the precipitation deficit accumulated right before the beginning of an event is assumed to be 0 mm. The cumulative precipitation deficit is then calculated from the first day of the event till the day it changes sign. For extreme wet events, this is the day cumulative precipitation deficit changes sign from negative to positive, in other words, from a wet condition to a dry condition. For yearly dry events, it is the day it changes from positive to negative, i.e., from dry to wet condition. Such a change in the sign of the accumulated precipitation deficit marks the recovery of the event from the water gained/lost during the wet/dry event.
We compare the recovery time of events with their transition time to identify meteorological situations of opposite event transitions that could pose challenges for water management due to overlapping impacts (compound and cascading impacts). Specifically, we check for the recovery of events in the time period starting from the beginning of a wet/dry event until the following opposite dry/wet event begins. Thereby, we define abrupt wet-dry and dry-transitions, which denote transitions between opposite extreme meteorological events, with less time available to prepare for the succeeding event (see transitions in Figures 5C, D for example of abrupt transitions).
To elaborate further, wet-dry transitions in which the wet event recovers before the transition to the dry event (i.e., recovery time <transition time) are termed abrupt wet-dry transitions (see Figure 5C). This is because, during an abrupt wet-dry transition, a quick recovery from the wet event allows less time for storing the excess water available (through natural and built water storage) before the dry event occurs. On the other hand, dry-wet transitions in which the dry event does not recover before the wet event occurs (i.e., recovery time > transition time) are termed abrupt dry-wet transitions (see Figure 5D). This is because, in the case of abrupt dry-wet transitions, a slow recovery can lead to the persistence of the dry condition and increase the risk of flash flooding when the wet event occurs over the water-scare surface.
3 Results
3.1 Climate-related wetting and drying behavior
Moving means over 30-year and 10-year windows of cumulative precipitation deficit (PD) shows the drying period beginning around April and ending around September between 1951–2022 water years (Dwd and Ddw respectively in Figures 6B, E). This aligns with the period over which water shortage is traditionally measured in the Netherlands for monitoring drought (Philip et al., 2020). However, the 30-year moving means of cumulative PD show the beginning of this drying period shifting from April to March in the past decade (see Figure 6B). In particular, Pettitt's test, which detects the point where there is a change in the mean value of the time series before and after that point (see Section 2.3), was used to determine the change point. Pettitt's test shows a statistically significant change point in the starting date of the drying period in 2014 at 5% significance level (see change point in Figure 6B and test statistics in Table 2). Since each point corresponds to a 30-year window, it should be noted that this change point includes water years between 1985 and 2014.
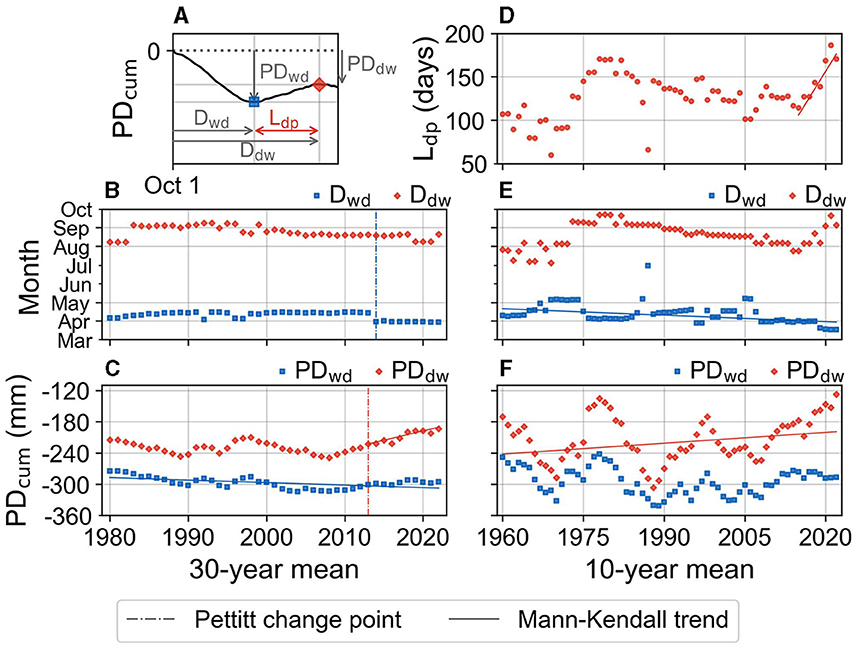
Figure 6. Shift between wetting and drying seen in cumulative precipitation deficit (PDcum) over 30-year (B, C) and 10-year (D, E, F) moving means. The variables obtained to quantify the shift in wetting and drying period of PDcum that was shown in Figure 3 are further described in (A). The day since the beginning of the water year when the wetting to drying shift occurs (Dwd) and the drying to wetting shift occurs Ddw are plotted in (B, E). The cumulative precipitation on these days (PDwd, PDdw) are plotted in (C, F). And the length of the drying period (Ldp) is plotted in (D). Selected change points as per Pettitt's test and trends as per the Mann–Kendall test for variables described in Table 2 are also shown.
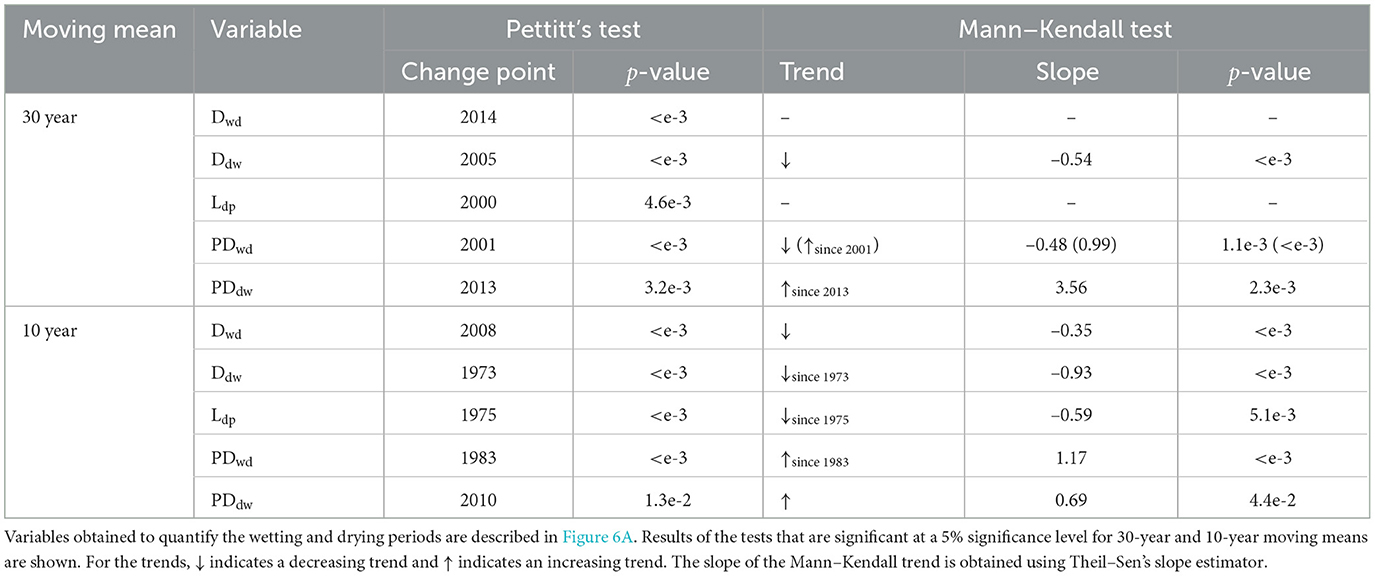
Table 2. Results of Pettitt's test for change point detection and Mann–Kendall trend test summarized for wetting and drying periods seen in cumulative precipitation deficit over the water year.
The earlier onset of the drying season is also seen in the 10-year moving means that show the mid-term climate trends (see Figure 6E). The Mann–Kendall test, which detects the presence of monotonic increasing and decreasing trends in a time series, shows a statistically significant decreasing trend during the study period (see the trend in Figure 6E and test statistics in Table 2). Such a shift in the start of the drying period seen in the long-term climatology (since 2014), as well as the trend in mid-term climatology (since 1960), could indicate the tendency for an earlier onset of the drying season in the catchment. A change in water availability in March caused by this trend can significantly affect the soil moisture available for plants when their growing season begins (Philip et al., 2020) in April (Schuldt et al., 2020).
At the end of the drying season, we see more PD accumulated over the last decade in the 30-year moving means (see PDdw in Figures 6A, C). Pettitt's test shows a significant change in the cumulative precipitation deficit at the end of the drying period in 2013, with a (mean) difference in cumulative PD of –23 mm before and after the change point (see change point in Figure 6C and test statistics in Table 2). Additionally, the Mann–Kendall test shows a statistically significant increasing trend since the change point in 2013 (see Figure 6C and Table 2). This trend indicates the tendency for more water loss (less precipitation compared to potential evapotranspiration) during the drying period. The 30-year mean cumulative PD at the end of the drying period is –223 mm in 2013 (includes 1984–2013) and –194 mm in 2022 (includes 2013–2022), indicating an increase in water loss of 25 mm. The tendency for increased water loss during the drying season is also seen in the 10-year moving means that show the mid-term climate trends (see Figure 6F and Table 2). Such a trend makes it increasingly important to conserve water during the wetting period, which occurs before the drying period, for use during the rest of the water year.
The mid-term climate trends indicate an increase in the length of the drying period over the last two decades (see Figure 6D). The drying period length is the time between the end of the wetting period (i.e., the start of the drying period) and the end of the drying period (see Figure 6A). Mann–Kendall trend test shows a statistically significant increasing trend since 2015, with p-value < 0.05 (see the trend in Figure 6D). It should be noted that 2015 was visually identified as the starting time for testing the trend, and this point is the 10-year mean of water years 2006–2015. The 10-year mean of the length of the drying period is 114 days for 2006–2015 and 171 days in the (last) 2013–2022 window, indicating an increase in length of 57 days. This increasing trend in the length of the drying period seen in the 10-year moving means has not occurred long enough to reflect in the long-term climatology estimated by the 30-year moving means (the 30-year moving means of Ldp are not visualized in Figure 6 but its change point and trend test results are shown in Table 2). However, a continuation of this trend in the length of the drying period, in combination with the previous two trends, can increase water shortages in the catchment during the drying season in the future.
The 10-year moving means (Figures 6E, F) show more variations in wetting and drying period timing and water availability compared to the 30-year moving means that represent the long-term trends (Figures 6B, C). Particularly, the 10-year mean of 1987 (includes 1978–1987) shows a very late ending of the wetting period which also marks the beginning of the drying period compared to the other 10-year means in Figure 6E. This is because 1978–1987 is the first window to include the year 1987, which has a negligible drying period and to exclude the dry year of 1976 (see Supplementary Figure S1), leading to a very long wetting period in the mean precipitation deficit for that window. This shows that even two extreme years can strongly influence the 10-year moving means. However, there is validity in exploring trends in both the 30- and 10-year moving means to investigate both long- and mid-term trends in the wetting and drying periods.
To explain the wetting and drying trends in cumulative PD described above (Figure 6), we compare trends in total annual precipitation deficit with those of total annual precipitation, potential evapotranspiration and temperature over 30-year moving windows (see Supplementary Figure S2). This is because precipitation deficit is a function of these variables, as explained in Section 2.3. Total annual PD shows a statistically significant change point as per Pettitt's test in 2015 (includes 1986–2015), after which it shows a statistically significant increasing trend as per the Mann–Kendall trend test (Supplementary Figure S2D). Total annual precipitation shows a statistically significant change point from 2002 (includes 1973–2002) according to Pettitt's test, indicating an increase in precipitation by 20 mm after the change point (Supplementary Figure S2A). A statistically significant change point also exists in (total annual) potential evapotranspiration in 2007 (1978–2007) (Supplementary Figure S2B). Additionally, the Mann–Kendall trend test shows a significantly increasing trend in potential evapotranspiration since the change point. This trend in ET0 can be explained by mean annual temperature, which shows a statistically significant increasing trend throughout the study period (Supplementary Figure S2C).
From the trends listed above, we can see that both precipitation and potential evapotranspiration increased in the 1970s, compensating for each other. However, potential evapotranspiration continued to increase in the 1980s, whereas precipitation did not, resulting in an increase in precipitation deficit (seen in Supplementary Figure S2D). Based on the Makkink formula for ET0, the trend in potential evapotranspiration can, in turn, be attributed to increases in temperature discussed above as well as to any changes in radiation (not investigated in this study but explored in Philip et al., 2020 for the Netherlands). This analysis of long-term climate trends (over 30-year windows) shows that trends in precipitation deficit over the water year, especially the increasing trend in cumulative precipitation deficit seen at the end of the drying period since the 1984–2013 window in Figure 6C is mainly related to increase in potential evapotranspiration caused by temperature increase since the late 1980s (such a shift in the climate regime in the 1980s has been seen in different parts of the globe as discussed in Chen and Wang, 2022).
3.2 Event timing and characteristics
Although we selected one wet and dry event for each year between 1951 and 2022, the month these events occur varies over the different years. By counting the number of yearly events beginning each month of the year, we see that the months between February and May are more prone to yearly dry events, whereas the wet events are more common between June and January (see Figure 7). The Spring season between March and May has 25 dry events and only seven wet events. In Summer (25 wet events, 16 dry events), Autumn (25 wet events, 19 dry events) and Winter (15 wet events, 12 dry events), wet events are more common than dry events. This aligns with the low rainfall experienced in Spring compared to the other seasons (see Table 1).

Figure 7. Number of yearly wet and dry events starting in each month of the water year counted between 1951–2022.
The yearly wet events which receive precipitation of more than 10 mm/day are only 1–5 days long, whereas the dry events have a range of 12–38 days (see Figures 8A, C). The shorter duration of wet events than dry events results from intermittent rainfall events amidst periods without rain. Also, extreme rainfall events usually last for days, whereas dry periods can persist for a week or more. The wet events in all seasons have a similar duration (Figure 8A), but the Spring season has the shortest dry events (except for two outlying events as seen in Figure 8C) even though it receives the least amount of rain (Table 1). This could mean that short, low-intensity showers interrupt the dry events during Spring, resulting in shorter dry events (Spring experiences the lowest rainfall intensity in the basin as shown in Supplementary Table S1).
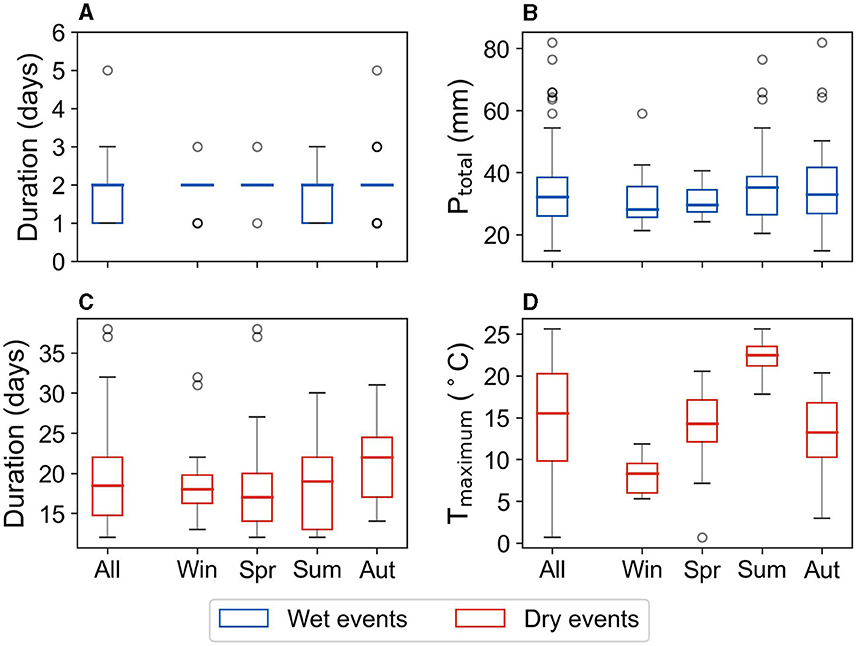
Figure 8. Variability in yearly wet and dry event duration (A, C) and magnitude (B, D) summarized for all events and events grouped according to the season in which they begin. Wet event magnitude is defined by the total rainfall accumulated during the event (Ptotal) and dry event magnitude is defined by the highest daily mean temperature recorded during the event (Tmaximum). Acronyms Win, Spr, Sum, and Aut stand for Winter, Spring, Summer, and Autumn, respectively.
The two longest dry events recorded in Figure 8C took place in the Spring season (in 2007 and 2020) and lasted more than a month (37 and 38 days, respectively). This can be related to the drought that occurred during the Spring season in both 2007 and 2020. However, the longest wet event that lasted 5 days (Figure 8) happened in September 1984. The Meuse River experienced high water levels in 1984 in the Limburg province (Figure 2) due to heavy rainfall. However, this flood occurred in February and, therefore, does not explain this wet event. The selection of the event in September as the yearly event instead of the February event (which led to flooding) can be explained by how yearly events are selected. Since the September event has more accumulated rainfall than the February event, the former is chosen as the extreme event of the year. Changing the yearly event selection method from total accumulated rainfall based to precipitation intensity based changes the event chosen in 1984 to the February event (see Supplementary Figure S7A). The sensitivity of event definition to different methods of selecting yearly events is described further in Section 3.3.
The median value of precipitation accumulated during wet events (Ptotal) is 32 mm among all values ranging from 15 mm (in November 1975) to 82 mm (in July 2021). Median Ptotal during wet events does not vary much from one season to another, but Summer events have a slightly higher value than the other seasons (Figure 8B). This aligns with Summer receiving relatively more rain in this region (Table 1). Similarly, the maximum precipitation accumulated during wet Spring events has the lowest value since Spring is a relatively dry season. The median value of temperature recorded during dry events (Tmaximum) is 15.5°C among all values in the range of 0.7–25.6°C (Figure 8D). Lower temperatures are recorded during Winter events, and the highest temperature is experienced during Summer events, consistent with seasonal temperature variations for the region (Table 1).
3.3 Sensitivity of event definition
We compared the characteristics and timing of events selected using different wet event (15 and 5 mm compared to 10 mm) and dry event (2 and 3 mm compared to 1 mm) thresholds of precipitation to analyze the sensitivity of events to their definition (see Supplementary Figures S3, S4). Specifically, the range of event characteristics (i.e., duration and magnitude) obtained for the different thresholds were compared with each other. For wet events, we found that the higher 15 mm threshold selects only the short, high peaks of rain events, whereas the 5 mm threshold selects longer events that cover more days of rain events in comparison to the 10 mm threshold (Supplementary Figures S3A, B). For dry events, we found that both 2 and 3 mm thresholds choose longer events in comparison to the 1 mm threshold, but all thresholds select events with similar temperatures (Supplementary Figures S3C, D). Therefore, the threshold value chosen influences event characteristics, especially the extremity of events investigated.
We selected extreme years of the past, i.e., years where floods and droughts were experienced in the Dutch Meuse River basin, to compare the event characteristics selected using the different wet/dry event thresholds. Not only does changing the threshold change the duration and magnitude of events, but it can also affect the timing of the yearly event selected (Supplementary Figure S4). For example, in 1976, the 1 and 2 mm thresholds selected the extreme dry event of the year (based on event duration) in August (see Supplementary Figure S4B). However, the 3 mm threshold selected the extreme dry event in February, which is longer than the August events selected in the 1 and 2 mm thresholds but experienced lower temperatures than the latter. It should be noted that both the February and August events coincide with the drought event experienced from February to August in 1976 in the Netherlands (Sykora, 1979).
We also perform a comparison of different methods for selecting the extreme wet and dry events of each water year (see Supplementary Figures S5–S7). For wet events, comparing events selected based on event total and event average rainfall, we found that the selection of yearly events with higher average rainfall leads to shorter events with lesser total rainfall accumulated compared to selection based on the total rainfall (Supplementary Figures S5A, B). There are also fewer events selected in Spring (Supplementary Figures S6A, B) where the rainfall intensity is the lowest in the year (see Supplementary Table S1). For dry events (comparing event duration and average temperature), we found that the selection of yearly events based on average temperature leads to events that are shorter but have higher temperatures recorded during the event compared to selection based on event duration (Supplementary Figures S5C, D). However, due to the seasonality of temperature, these events are selected only between May and September when temperatures are high (Supplementary Figures S6C, D), leading to potential seasonal bias when temperature is used for yearly event selection.
3.4 Transition and recovery of events
We defined transition times as the time between the first event's beginning and the second event's end in wet-dry and dry-wet yearly event pairs. Transition time indicates the time available to respond to and prepare for the shift from one extreme condition to the opposite in the basin. As described in Section 2.5, when two extreme wet events occur consecutively before the next extreme dry event occurs, the wet-dry transition is defined from the beginning of the first wet event and ends at the dry event (for example, Figure 9 years 1990–1991). A comparable definition was also adopted for the dry-wet transitions (for example, Figure 9 years 1983–1984).
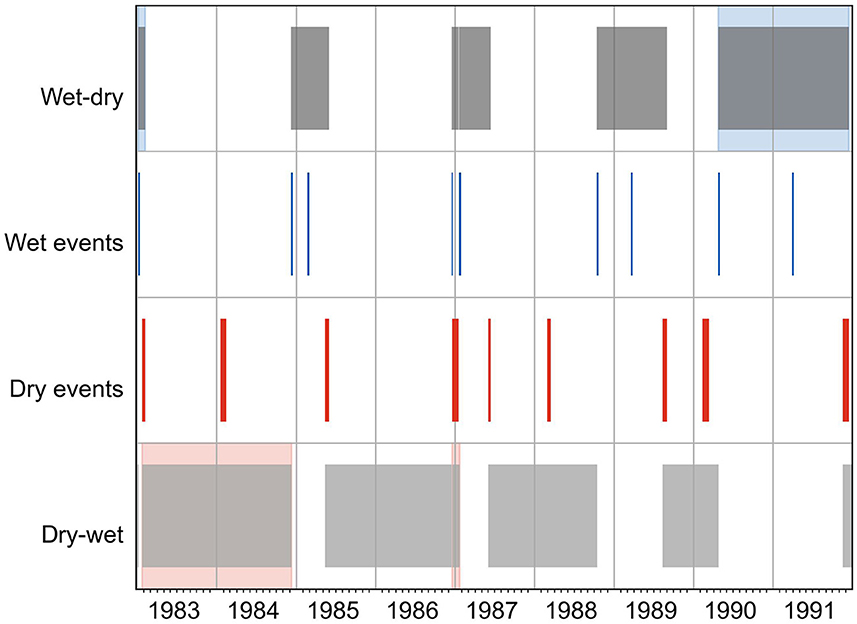
Figure 9. Timeline of yearly wet and dry events and the corresponding wet-dry and dry-wet transitions between 1983–1991 water years. Each bar shows the timing of the event/transition, with the width of the bar denoting the duration of the event/transition. The shaded areas in wet-dry (in blue) and dry-wet (in red) transitions highlight the shortest and longest transitions in the complete records (1951–2022).
For every yearly event between 1951 and 2022, an event transition exists except for the wet event of 2022. This is because the wet event of 2022 occurred in June, and no yearly dry events were recorded after this event until the end of the E-OBS records in September 2022. This leaves no wet-dry event transition that can be paired with this event. Also, 20 consecutive wet-wet and 21 consecutive dry-dry extreme events occurred before the opposite dry/wet yearly event occurred between 1951–2022. Therefore, over these 72 years of E-OBS records, we obtained only 51 wet-dry and dry-wet yearly event transitions.
Wet-dry and dry-wet transition times range from 32 to 688 days, around 1–23 months. That is, the transition between opposite events can occur anywhere over the two consecutive water years (24 months) where the opposite events are selected (the shortest and longest transitions are highlighted in Figure 9). For example, the longest wet-dry transition started with the wet event in January 1990 and ended after 600 days, with the dry event occurring in August 1991 (see Figure 9). This is because the dry event of 1990 (water year) was recorded before the wet event, and the dry event of 1991 (water year) was identified only at the end of that year, resulting in a long transition from the wet to dry period.
The median transition times obtained for the wet-dry and dry-wet event pairs are 246 days and 244 days, respectively, around 8 months. This shows that between 1951 and 2022, opposite extreme meteorological events tend to occur eight months apart, affecting the time available for response to the first event and preparing for the second event. As seen in Figure 7 and Section 2.3, dry events are more frequent in Spring, and wet events are more frequent in Summer and Autumn (early Winter has more wet events, whereas February has more dry events). Based on the median transition time, we can expect dry-wet transitions to occur from Spring to late Autumn. And for wet-dry transitions, we can expect them to occur from Summer to early Spring or Autumn to late Spring (or less often from Winter to Summer).
The transition time between opposite events is sensitive to the timing (seasonality) of the events themselves (see Figures 10A, C). When a wet event occurs in Spring, the successive dry event would most likely occur the following Spring (as dry events are more likely in Spring, as discussed before). Therefore, the median wet-dry transition time for Spring wet events is 12 months (366 days, Figure 10A). Similarly, if a dry event happens in Spring, the successive wet event has a high chance of occurring the following Autumn (as discussed above). This results in a median dry-wet transition time for Spring dry events of almost 7 months (204 days, Figure 10C). The median dry-wet transition time of Spring dry events is similar (40 days shorter) to the median previously estimated based on all seasons due to dry events predominantly occurring in Spring. Comparably, the median wet-dry transition time of Summer and Autumn wet events where they are more frequent are 258 days and 223 days, respectively, similar to the median estimated above based on all seasons (Figure 10A).
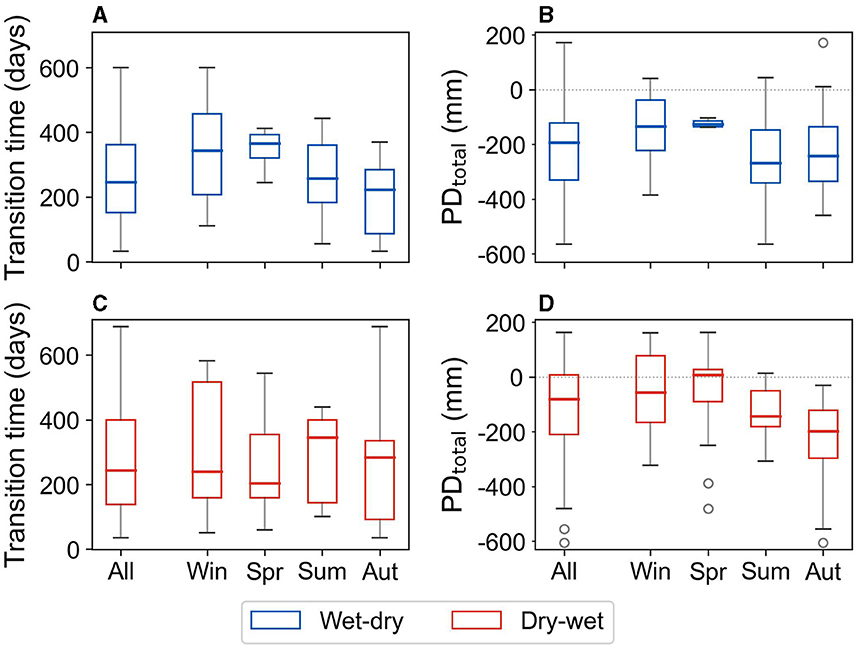
Figure 10. Variability in yearly wet-dry and dry-wet transition time (A, C) and accumulated precipitation deficit during that time (B, D). The variability is summarized for all transitions and transitions grouped according to the season in which they begin. PDtotal denotes the total precipitation deficit accumulated during the transition. Acronyms Win, Spr, Sum, and Aut stand for Winter, Spring, Summer, and Autumn, respectively.
For a transition from a wet to dry extreme, wet events occurring in Summer and Autumn have the shortest transitions (Figure 10A). For example, the shortest wet-dry transitions were around 30 days long and occurred in the Autumn of 1983 and 1986. This allows less time to manage their risk, specifically for disaster response to the wet event and for storing the excess water from the wet event for use during the dry event. On the other hand, the seasonal differences in dry to wet extreme transition times are less pronounced (Figure 10C). For instance, dry-wet transitions shorter than 60 days occurred in Winter (2009), Spring (1955) and Autumn (1986). However, the median dry-wet transition time for dry events occurring in Spring has the shortest duration compared to other seasons, requiring more diligent planning to ensure sufficient water availability and manage flood risk. Conversely, a shorter transition time in Spring can also mean less waiting time after the dry event before water availability is increased (in the form of precipitation).
Despite the similar duration of median wet-dry and dry-wet transition times, the median value of accumulated precipitation deficit (PDtotal) during wet-dry transitions is –194 mm, whereas that of dry-wet transition time is –80 mm. That is, there is a relative scarcity of precipitation with respect to potential evapotranspiration during dry-wet transitions compared to wet-dry transitions. This can be explained by the seasons in which these transitions occur. As described above, wet-dry transitions would most likely occur between Autumn and Spring, where there is an excess of net water (see Figure 3). Similarly, dry-wet transitions would most likely occur from Spring to Autumn, where there is a shortage of net water (Figure 3). In short, from the accumulated precipitation deficit during transitions, we see that wet-dry transitions most often have excess net water compared to dry-wet transitions.
Similar to the duration of transition times, PDtotal of transitions show seasonal variations (Figures 10B, D). Specifically, (wet-dry and dry-wet) transitions beginning in Winter and Spring have less (net) water availability compared to transitions beginning in Summer and Autumn, probably due to the seasonality of precipitation deficit during the transition time (see Table 1). Such a seasonality in PDtotal implies that wet-dry transitions beginning in Winter and Spring have less water available for storage after the wet event in preparation for the following dry event. For the dry-wet transitions occurring in Winter and Spring, a lack of (net) water availability can increase water shortage due to the existence of a dry condition even after the dry event ends.
We defined the recovery of an event to have occurred on the day when the precipitation deficit accumulated since the beginning of the event goes back to pre-event levels (see Section 2.5). The time taken for recovery from extreme meteorological events is of interest since we look at absolute amounts of (meteorological) water in the region. The median recovery time obtained is 50 days for wet events (wet-dry transitions) and 47 days for dry events (dry-wet transitions). Since precipitation deficit varies throughout the water year (Section 2.3), we also see seasonal variations in the length of recovery time, which is based on precipitation deficit, according to the month in which the event occurs (see Figure 11).
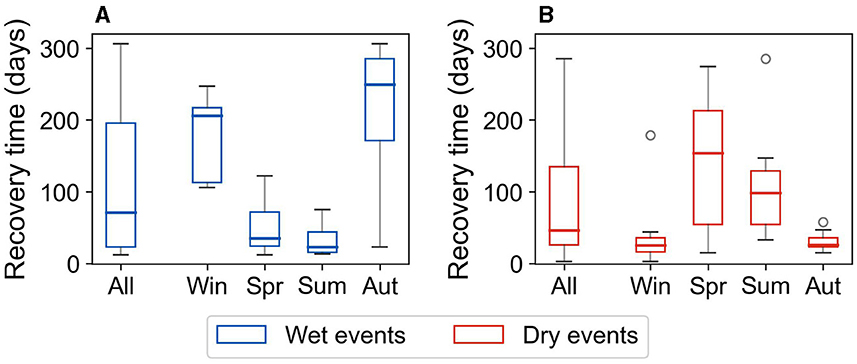
Figure 11. Variability in yearly wet (A) and dry event (B) recovery time summarized for all events and events grouped according to the season in which they begin. Acronyms Win, Spr, Sum, and Aut stand for Winter, Spring, Summer, and Autumn, respectively.
Seasonality in recovery time shows that wet events that occur in Spring and Summer recover much faster than the Winter and Autumn events (Figure 11A). This is because the positive precipitation deficit existing in Spring and Summer (see Table 1) leads to the persistence of a dry condition that helps recover from the wet event. The opposite situation exists in Winter and Autumn (Table 1), where the negative precipitation deficit leads to a wet condition that impedes recovery. This situation is reversed if a dry event happens in Winter or Autumn as the wet condition helps with a quick recovery, and the recovery is delayed if it happens in the Spring or Summer seasons where dry condition prevails (Figure 11B).
3.5 Abrupt transitions
The recovery time of the first event was compared with its transition time to the opposite event to investigate abrupt transitions with less time available to prepare for the latter event (see Section 2.5). Abrupt wet-dry transitions, where recovery from the wet event occurs before the transition time, were seen in 29% of the wet-dry transitions (i.e., 15 transitions). Conversely, abrupt dry-wet transitions where dry events do not recover before the transition time were seen in 25% of the dry-wet transitions (i.e., 13 transitions). Such abrupt transitions between opposite extreme conditions could pose challenges for water management due to their potential to cause compound and cascading impacts (Section 2.5).
Additionally, when the total accumulated precipitation deficit at the end of the second event of an abrupt transition is positive, it indicates a relative lack of water at the end of the transition (see Figure 5 for examples). This is of interest as the Dutch Meuse river basin is more prepared for frequent extreme wet events than extreme dry events (and also because there is usually an excess of net water in the region as seen in Section 2.2). Therefore, abrupt transitions that end with a lack of water (positive precipitation deficit) are further investigated to identify scenarios of opposite extreme event transitions that can cause increased impacts in the region.
For wet-dry transitions, such a situation was seen in 6% of the transitions, that is, three transitions between 1951 and 2022 (summarized in Supplementary Table S3). These transitions indicate instances where the excess water from the wet event was rapidly exhausted during the subsequent dry event, in addition to having less time to store the water from the wet event due to the abrupt transition. For the dry-wet case, abrupt transitions ending with a lack of water were seen 20% of the time (10 transitions as summarized in Supplementary Table S3). In such cases, in addition to the increased risk of flash flooding from the abrupt dry-wet transition, the occurrence of the subsequent wet event did not help replenish the lack of water caused by the dry event. Both these situations, where the abrupt transitions end with a lack of net water, can lead to overlapping impacts of the wet and dry extreme events, making them worse-case scenarios for the combined management of hydrological extremes.
The seasons susceptible to the meteorological scenarios discussed above can be identified by comparing the seasonality of transition times of events, their accumulated precipitation deficit, and their recovery times. For wet events, Summer events tend to have short recovery times (Figure 11A), Autumn events have short transition times (Figure 10A), and Winter events have less water availability (Figure 10B). Thus, these seasons could experience abrupt transitions with a positive accumulated precipitation deficit. In line with this, the three wet-dry transitions previously identified for this situation occurred in Summer (1969), Autumn (1975) and Winter (1958) (see Supplementary Table S3).
For dry events, Spring events usually have long recovery times (Figure 11B) and short transition times with less water availability (Figures 10C, D), making them susceptible to abrupt transitions with a positive accumulated precipitation deficit. This was seen in the 10 transitions previously identified for this scenario, as they all occurred in the Spring season (between March and May, see Supplementary Table S3). That is, dry-wet transitions beginning in Spring could have higher chances of causing compound and cascading impacts due to abrupt transitions with positive accumulated precipitation deficit. For wet-dry transitions, however, the seasonality is not as straightforward as Summer, Autumn, and Winter transitions seem susceptible to such worst-case scenario transitions, requiring preparation throughout the year.
A few of the abrupt transitions identified here are of interest as they coincide with actual flood and drought events in the basin. The calendar year of 1975 has both an abrupt wet-dry and dry-wet transition that ends with a positive PDtotal (see Supplementary Table S3). The dry-wet transition started with a dry event in May 1975 (water year 1975) and ended due to a wet event in November 1975 (water year 1976) with a deficit of net water. This wet event in November 1975 thereby started a wet-dry transition that ended with a deficit of net water after the following dry event in August 1976 (water year 1976). These two transitions (mostly) occurred during the water year of 1976, which is a drought year with a record-high precipitation deficit for the Netherlands (Koninklijk Nederlands Meteorologisch Instituut, 2024), explaining the deficit in net water after the transitions. More recently, the dry-wet transition that began with a dry event in March 2020 only ended with a wet event in July 2021 (see Supplementary Table S3). This coincides with the drought that persisted between Spring–Autumn 2020 and the flood in July 2021 caused by extreme precipitation in the Netherlands (Bartholomeus et al., 2023).
4 Discussion
In this study, we propose a methodology to define wet and dry events and investigate their transitions based on meteorological variables. The resulting event and transition characteristics are influenced by the climatic conditions and seasonal trends of the study area (which can be seen in Figures 7, 8, 10 for the Dutch Meuse River basin). Therefore, the framework proposed here can be applied to any case study region with appropriate changes to the thresholds and methodology to account for regional climate and seasonal trends. To understand the implications of climate change on observed trends, further analysis should be performed to differentiate climate-induced trends from other factors like natural climate variability (Sarker, 2022). The attribution of observed trends to climate change is not within the scope of this study. However, future trends in wet and dry events characteristics and their alternations can be modeled by applying the framework to climate simulations instead of observations. This is because wet and dry extremes of the present may not be recognized as extremes or lead to floods and drought spells in the future due to changes in the hydrological regime in response to climate change [Leng et al., 2016; Tabari, 2020; IPCC (Intergovernmental Panel on Climate Change), 2021].
From the sensitivity analysis of event definition (Section 3.3), we see that the estimated event characteristics and timing depend on the set-up of the proposed framework (also discussed in Collet et al., 2018; He and Sheffield, 2020; Brunner et al., 2021). Therefore, researchers should adapt the thresholds and assumptions of the framework depending on the type and severity of wet and dry events of interest (for examples, see Supplementary Figures S3, S4). Although droughts are caused by the persistence of low precipitation as well as high temperatures, selecting extreme dry events of the year based on event temperatures leads to selection bias due to its seasonality (see Supplementary Figures S5–S7). Therefore, the selection of yearly dry events is made based on consecutive periods with reduced precipitation here (and not temperature). However, the information on event maximum temperatures is retained as the dry event magnitude in order to account for both hydroclimatic variables in the event definition.
For wet events, both the total amount as well as the intensity of precipitation received during an event can affect its risk of flooding. For instance, Tsiokanos et al. (2023) found a combination of prolonged heavy rainfall and extreme precipitation as factors affecting high flows in the Geul River basin, a tributary of the Meuse in the Netherlands. Therefore, we compare extreme wet events (which receive rainfall > 10 mm/day) selected based on total precipitation and average rainfall intensity in the sensitivity analysis of wet events (Section 3.3). Here, total accumulated precipitation is considered a proxy to select prolonged heavy rainfall events and average rainfall intensity is considered a proxy to represent extreme precipitation events, the two factors contributing to flooding. Due to the short duration of the selected wet events (median 1 or 2 days), both average and total precipitation of events are similar to each other resulting in similar event characteristics for both definitions in our case (see Supplementary Figures S5, S6). However, both the event total and event average precipitation-based selection of extreme wet events of the year should be considered when exploring meteorological conditions that could cause flooding when applying this framework to case study regions.
To investigate the time taken to recover from the meteorological conditions present during wet and dry events, we assume no surplus or deficit of water before the beginning of the event (i.e., PD = 0 mm). This isolates the water gained/lost during the event from the antecedent meteorological conditions in the basin. The assumption also helps to separate the negative PD (general excess of precipitation relative to potential evapotranspiration) present in the basin (see Figure 3) from the meteorological situation present during that event. Instead, if the actual meteorological condition present before the event is included in the calculation of recovery time, the definition of recovery time would change from “time taken after a meteorological extreme event to go back to the pre-event state” to “time taken to go back to the normal state.” The “normal state” could then be defined based on the average accumulated precipitation deficit curve calculated for each day of the water year (Figure 3). Such a change will change the recovery times (in Figure 11) that were estimated considering only the meteorological events without the antecedent conditions or the long-term climate of the basin. Nevertheless, the assumption of PD = 0 mm is retained in the calculation of recovery time due to the ease of application of this definition to study meteorological extreme events in different meteorological scenarios (of the past or future climate) where the 'normal' conditions might be different from each other. In addition, this assumption enables the comparison of the recovery time of events occurring in different seasons, which can have different antecedent moisture conditions. However, the antecedent meteorological conditions will be included in the analysis of hydrological extremes in an upcoming study where the hydrological response to the opposite extreme event transitions defined here will be explored.
We investigate opposite event transitions as a proxy for abrupt shifts between hydrological extremes to capture meteorological situations that could pose challenges for water management. However, interpreting our results alone could lead to misestimating impacts (Zhang et al., 2023). This is because meteorological extreme wet and dry conditions do not always translate to floods and droughts as other factors like runoff generation, infiltration, and antecedent conditions affect this process (Brunner et al., 2021; Tramblay et al., 2023). To this end, the meteorological wet and dry scenarios identified here will be used in a future study to investigate the development of floods and droughts through hydrological modeling. Particularly, the hydrological response to the meteorological transitions defined in this paper will be investigated to understand flood-drought (i.e., hazard) interplay at the river basin scale. Therefore, we see the current study as the first step toward a combined risk assessment of floods and droughts.
5 Conclusion
In this study, we propose a methodology to define meteorological wet and dry events and alternations between them as a first step toward the combined assessment of hydrological extremes. The framework uses daily precipitation, temperature, and potential evapotranspiration time series to define the wet and dry events and their transitions. In this approach, the magnitude of event characteristics is retained, deviating from normalized climate indices often used in literature in order to determine specific meteorological situations that could lead to alternating hydrological extremes in the catchment. By applying this framework to the Meuse River basin in the Netherlands, we perform a comprehensive assessment of climate-related opposite extreme transitions in the region between 1951 and 2022.
Our analysis of the Dutch Meuse River basin shows a general excess of precipitation compared to water lost from potential evapotranspiration. Within the water year, this situation is reversed between April to September, when there is a drying period of precipitation deficit. Over the past years, this drying period has been beginning in March instead of April, and (around 25 mm) more water has been lost during that time at statistically significant levels. Since 2015, there has also been a statistically significant increase in the length of the drying period (by about 57 days). These trends in the drying period are mainly related to variability in potential evapotranspiration driven by changes in temperature. Consequently, we can expect them to continue or become stronger in the future due to climate warming. Such changes can lead to increased water shortage in Spring and Summer, affecting water management practices that rely on water availability during the dry period, like agriculture.
Extreme dry events of the year are more common than extreme wet events between February and May due to the low rainfall intensity experienced during the Spring season. Among dry-wet transitions, Spring dry events tend to have long recovery times and short transition times, which also have less (net) water availability. Hence, dry-wet transitions beginning in Spring are more susceptible to experiencing flash flooding due to abrupt transitions and ending with water deficit despite the occurrence of the wet event. Such meteorological situations were seen in 20% of the dry-wet transitions (10 transitions), all of which occurred in the Spring season. For wet-dry transitions, however, the seasonality of abrupt transitions is not as straightforward. This is because wet events occurring in Summer tend to have short recovery times, events in Autumn have short transition times, and Winter events have less (net) water availability during transitions. Thus, abrupt wet-dry transitions where less time is available for water storage and water from the wet event is depleted during the subsequent dry event could occur in the Summer, Autumn or Winter seasons. Accordingly, such meteorological situations were seen in 6% of the wet-dry transitions (three transitions), in Summer (1969), Autumn (1975) and Winter (1958).
Due to their potential to cause overlapping impacts, the transitions between wet and dry periods identified here pose additional risks to water resources, making them worse-case (meteorological) scenarios for the combined management of hydrological extremes. These instances of alternations between wet and dry periods can be used as input into hydrological models to understand the hydrological response of the catchment to such meteorological conditions. In conclusion, the meteorological wet and dry events and their transitions investigated in this study can be useful in showing the potential risks of alternations between flood and drought events. Stakeholders such as governments, farmers, energy producers, transportation industries, and (re)insurance companies could all benefit from a robust understanding of the interactions between these opposite hydrological extremes, especially with the growing number of events in the Dutch Meuse River basin. The climate-based wet and dry periods and their transitions explored here are therefore seen as a first step toward quantifying and managing the combined risk of hydrological extremes.
Data availability statement
The original contributions presented in the study are included in the article/Supplementary material, further inquiries can be directed to the corresponding author.
Author contributions
SH: Conceptualization, Formal analysis, Investigation, Methodology, Software, Visualization, Writing—original draft, Writing—review & editing, Data curation. ER: Conceptualization, Project administration, Supervision, Validation, Writing—review & editing. OM-N: Supervision, Validation, Writing—review & editing. MK: Supervision, Validation, Writing—review & editing.
Funding
The author(s) declare that no financial support was received for the research, authorship, and/or publication of this article.
Acknowledgments
We acknowledge the E-OBS dataset from the EU-FP6 project UERRA (https://www.uerra.eu) and the Copernicus Climate Change Service, and the data providers in the ECA&D project (https://www.ecad.eu). We also thank the reviewers for their valuable suggestions and timely handling of the manuscript.
Conflict of interest
The authors declare that the research was conducted in the absence of any commercial or financial relationships that could be construed as a potential conflict of interest.
Publisher's note
All claims expressed in this article are solely those of the authors and do not necessarily represent those of their affiliated organizations, or those of the publisher, the editors and the reviewers. Any product that may be evaluated in this article, or claim that may be made by its manufacturer, is not guaranteed or endorsed by the publisher.
Supplementary material
The Supplementary Material for this article can be found online at: https://www.frontiersin.org/articles/10.3389/frwa.2024.1394563/full#supplementary-material
References
Bartholomeus, R. P., van der Wiel, K., van Loon, A. F., van Huijgevoort, M. H., van Vliet, M. T. H., Mens, M., et al. (2023). Managing water across the flood-drought spectrum - experiences from and challenges for The Netherlands. Cambridge Prisms: Water 1, 1–22. doi: 10.1017/wat.2023.4
Beevers, L., Popescu, I., Pregnolato, M., Liu, Y., and Wright, N. (2022). Identifying hotspots of hydro-hazards under global change: a worldwide review. Front. Water 4:879536. doi: 10.3389/frwa.2022.879536
Bouaziz, L. J., Aalbers, E. E., Weerts, A. H., Hegnauer, M., Buiteveld, H., Lammersen, R., et al. (2022). Ecosystem adaptation to climate change: the sensitivity of hydrological predictions to time-dynamic model parameters. Hydrol. Earth Syst. Sci. 26, 1295–1318. doi: 10.5194/hess-26-1295-2022
Brockhoff, R. C., Biesbroek, R., and der Bolt, B. V. (2022). Drought governance in transition: a case study of the Meuse River Basin in the Netherlands. Water Resour. Manag. 36, 2623–2638. doi: 10.1007/s11269-022-03164-7
Brunner, M. I., Slater, L., Tallaksen, L. M., and Clark, M. (2021). Challenges in modeling and predicting floods and droughts: a review. Wiley Interdiscip. Rev.: Water 8:e1520. doi: 10.1002/wat2.1520
Budyko, M. I. (1974). Climate and Life. International geophysics series. Cambridge, MA: Academic Press.
Chen, H., and Wang, S. (2022). Accelerated transition between dry and wet periods in a warming climate. Geophys. Res. Lett. 49:e2022GL099766. doi: 10.1029/2022GL099766
Chen, H., Wang, S., Zhu, J., and Zhang, B. (2020). Projected changes in abrupt shifts between dry and wet extremes over China Through an ensemble of regional climate model simulations. J. Geophys. Res. Atmos. 125:e2020JD033894. doi: 10.1029/2020JD033894
Collet, L., Harrigan, S., Prudhomme, C., Formetta, G., and Beevers, L. (2018). Future hot-spots for hydro-hazards in Great Britain: a probabilistic assessment. Hydrol Earth Syst. Sci. 22, 5387–5401. doi: 10.5194/hess-22-5387-2018
Cornes, R. C., van der Schrier, G., van den Besselaar, E. J. M., and Jones, P. D. (2018). An ensemble version of the E-OBS temperature and precipitation data sets. J. Geophys. Res. Atmos. 123, 9391–9409. doi: 10.1029/2017JD028200
De Luca, P., Messori, G., Wilby, R. L., Mazzoleni, M., and Baldassarre, G. D. (2020). Concurrent wet and dry hydrological extremes at the global scale. Earth Syst. Dyna. 11, 251–266. doi: 10.5194/esd-11-251-2020
De Michele, C., Meroni, V., Rahimi, L., Deidda, C., and Ghezzi, A. (2020). Dependence types in a binarized precipitation network. Geophys. Res. Lett. 47:e2020GL090196. doi: 10.1029/2020GL090196
Dong, X., Xi, B., Kennedy, A., Feng, Z., Entin, J. K., Houser, P. R., et al. (2011). Investigation of the 2006 drought and 2007 flood extremes at the Southern Great Plains through an integrative analysis of observations. J. Geophys. Res. Atmos. 116:D03204. doi: 10.1029/2010JD014776
Du, J., Fang, J., Xu, W., and Shi, P. (2013). Analysis of dry/wet conditions using the standardized precipitation index and its potential usefulness for drought/flood monitoring in Hunan Province, China. Stoch. Environ. Rese. Risk Assess. 27, 377–387. doi: 10.1007/s00477-012-0589-6
Fasihi, S., Lim, W. Z., Wu, W., and Proverbs, D. (2021). Systematic review of flood and drought literature based on science mapping and content analysis. Water 13:2788. doi: 10.3390/w13192788
Freebairn, A., Hagon, K., Turmine, V., Pizzini, G., Singh, R., Kelly, T., et al. (2020). World disasters report 2020: Come heat or high water. Geneva: International Federation of Red Cross and Red Crescent Societies. Available online at: https://media.ifrc.org/ifrc/world-disaster-report-2020 (accessed July 20, 2023).
Gill, J. C., and Malamud, B. D. (2014). Reviewing and visualizing the interactions of natural hazards. Rev. Geophys. 52, 680–722. doi: 10.1002/2013RG000445
Harris, I., Osborn, T., Jones, P., and Lister, D. (2020). Version 4 of the CRU TS monthly high-resolution gridded multivariate climate dataset. Sci. Data 7:109. doi: 10.1038/s41597-020-0453-3
He, X., and Sheffield, J. (2020). Lagged compound occurrence of droughts and pluvials globally over the past seven decades. Geophys. Res. Lett. 47:e2020GL087924. doi: 10.1029/2020GL087924
Hiemstra, P., and Sluiter, R. (2011). Interpolation of Makkink evaporation in the Netherlands. De Bilt. Available online at: https://cdn.knmi.nl/knmi/pdf/bibliotheek/knmipubTR/TR327.pdf (accessed April 19, 2024).
Hooghart, J., and Lablans, W. (1988). Van Penman naar Makkink: een nieuwe berekeningswijze voor de klimatologische verdampingsgetallen. De Bilt: Royal Netherlands Meteorological Institute (KNMI). Available online at: https://edepot.wur.nl/182292 (accessed October 23, 2023).
Hussain, M. M., and Mahmud, I. (2019). pyMannKendall: a python package for non parametric Mann Kendall family of trend tests. J. Open Source Softw. 4:1556. doi: 10.21105/joss.01556
Hussain, M. M., Mahmud, I., and Bari, S. H. (2023). pyHomogeneity: a python package for homogeneity test of time series data. J. Open Res. Softw. 11:4. doi: 10.5334/jors.427
IPCC (Intergovernmental Panel on Climate Change) (2021). Climate Change 2021 – The Physical Science Basis: Working Group I Contribution to the Sixth Assessment Report of the Intergovernmental Panel on Climate Change. Cambridge: Cambridge University Press.
Jaiswal, R. K., Lohani, A. K., and Tiwari, H. L. (2015). Statistical analysis for change detection and trend assessment in climatological parameters. Environ. Process. 2, 729–749. doi: 10.1007/s40710-015-0105-3
Johnstone, D., and Cross, W. P. (1949). The Water Year. In Elements of Applied Hydrology, Civil engineering series. New York, NY: Ronald Press Company, 102–103. OCLC: 1150788749.
Koninklijk Nederlands Meteorologisch Instituut (2022). Rain intensity. Available online at: https://www.knmi.nl/kennis-en-datacentrum/zoekresultaten?type=data_center_discover (accessed August 3, 2022).
Koninklijk Nederlands Meteorologisch Instituut (2024). Precipitation Deficit/Drought. Available online at: https://www.knmi.nl/nederland-nu/klimatologie/geografische-overzichten/neerslagtekort_droogte (accessed Febraury 23, 2024).
Kreibich, H., Blauhut, V., Aerts, J. C., Bouwer, L. M., Lanen, H. A. V., Mejia, A., et al. (2019). How to improve attribution of changes in drought and flood impacts. Hydrol. Sci. J. 64, 1–18. doi: 10.1080/02626667.2018.1558367
Krysanova, V., Buiteveld, H., Haase, D., Hattermann, F. F., Niekerk, K. V., Roest, K., et al. (2008). Practices and Lessons Learned in Coping with Climatic Hazards at the River-Basin Scale: Floods and Droughts. Ecology and Society: New Methods for Adaptive Water Management, 13. Available online at: http://www.ecologyandsociety.org/vol13/iss2/art32/ (accessed August 31, 2023).
Lehner, B. (2014). HydroBASINS. Global watershed boundaries and sub-basin delineations derived from HydroSHEDS data at 15 second resolution. Technical Documentation Version 1.c. Available online at: https://data.hydrosheds.org/file/technical-documentation/HydroBASINS_TechDoc_v1c.pdf (accessed April 15, 2024).
Lehner, B. (2022). HydroSHEDS Technical Documentation Data Version 1.1. Available online at: https://data.hydrosheds.org/file/technical-documentation/HydroSHEDS_TechDoc_v1_4.pdf (accessed April 15, 2024).
Lehner, B., and Grill, G. (2013). Global river hydrography and network routing: baseline data and new approaches to study the world's large river systems. Hydrol. Process. 27, 2171–2186. doi: 10.1002/hyp.9740
Leng, G., Tang, Q., Huang, S., Zhang, X., and Cao, J. (2016). Assessments of joint hydrological extreme risks in a warming climate in China. Int. J. Climatol. 36, 1632–1642. doi: 10.1002/joc.4447
Madakumbura, G. D., Kim, H., Utsumi, N., Shiogama, H., Fischer, E. M., Seland, Ø., et al. (2019). Event-to-event intensification of the hydrologic cycle from 1.5°C to a 2°C warmer world. Sci. Rep. 9:3483. doi: 10.1038/s41598-019-39936-2
Mann, H. B. (1945). Nonparametric tests against trend. Econometrica 13, 245–259. doi: 10.2307/1907187
Mens, M. J., van Rhee, G., Schasfoort, F., and Kielen, N. (2022). Integrated drought risk assessment to support adaptive policymaking in the Netherlands. Nat. Hazards Earth Syst. Sci. 22, 1763–1776. doi: 10.5194/nhess-22-1763-2022
Mishra, A. K., and Singh, V. P. (2010). A review of drought concepts. J. Hydrol. 391, 202–216. doi: 10.1016/j.jhydrol.2010.07.012
Nkiaka, E., Nawaz, N. R., and Lovett, J. C. (2017). Using standardized indicators to analyse dry/wet conditions and their application for monitoring drought/floods: a study in the Logone catchment, Lake Chad basin. Hydrol. Sci. J. 62, 2720–2736. doi: 10.1080/02626667.2017.1409427
Nunez Sanchez, A., and van Beek, E. (2022). The combined management of floods &droughts in the Netherlands: An EPIC Response application. Delft.
Our World in Data (2023). Natural Disasters. Available online at: https://ourworldindata.org/natural-disasters (accessed July 20, 2023).
Parry, S., Marsh, T., and Kendon, M. (2013). 2012: from drought to floods in England and Wales. Weather 68, 268–274. doi: 10.1002/wea.2152
Peel, M. C., Finlayson, B. L., and McMahon, T. A. (2007). Updated world map of the Köppen–Geiger climate classification. Hydrol. Earth Syst. Sci. 11, 1633–1644. doi: 10.5194/hess-11-1633-2007
Pettitt, A. N. (1979). A non-parametric approach to the change-point problem. Appl. Stat. 28, 126–135. doi: 10.2307/2346729
Philip, S. Y., Kew, S. F., Wiel, K. V. D., Wanders, N., Oldenborgh, G. J. V., Philip, S. Y., et al. (2020). Regional differentiation in climate change induced drought trends in the Netherlands. Environ. Res. Lett. 15:094081. doi: 10.1088/1748-9326/ab97ca
Pinho, P. F., Marengo, J. A., and Smith, M. S. (2015). Complex socio-ecological dynamics driven by extreme events in the Amazon. Reg. Environ. Change 15, 643–655. doi: 10.1007/s10113-014-0659-z
Quesada-Montano, B., Baldassarre, G. D., Rangecroft, S., and Loon, A. F. V. (2018). Hydrological change: towards a consistent approach to assess changes on both floods and droughts. Adv. Water Resour. 111, 31–35. doi: 10.1016/j.advwatres.2017.10.038
Raju, E., Boyd, E., and Otto, F. (2022). Stop blaming the climate for disasters. Commun. Earth Environ. 3:1. doi: 10.1038/s43247-021-00332-2
Ranjbar, S., Hooshyar, M., Singh, A., and Wang, D. (2018). Quantifying climatic controls on river network branching structure across scales. Water Resour. Res. 54, 7347–7360. doi: 10.1029/2018WR022853
Rashid, M. M., and Wahl, T. (2022). Hydrologic risk from consecutive dry and wet extremes at the global scale. Environ. Res. Commun. 4:071001. doi: 10.1088/2515-7620/ac77de
Ritzema, H., and Stuyt, L. (2015). Land drainage strategies to cope with climate change in the Netherlands. Acta Agric. Scand. B Soil Plant Sci. 65, 80–92. doi: 10.1080/09064710.2014.994557
Rodell, M., and Li, B. (2023). Changing intensity of hydroclimatic extreme events revealed by GRACE and GRACE-FO. Nat. Water 1, 241–248. doi: 10.1038/s44221-023-00040-5
Rohde, M. M. (2023). Floods and droughts are intensifying globally. Nat. Water 1, 226–227. doi: 10.1038/s44221-023-00047-y
Sadeqi, A., Irannezhad, M., Bahmani, S., Jelodarlu, K. A., Varandili, S. A., Pham, Q. B., et al. (2024). Long-term variability and trends in snow depth and cover days throughout iranian mountain ranges. Water Resour. Res. 60:e2023WR035411. doi: 10.1029/2023WR035411
Sarker, S. (2021). Investigating Topologic and Geometric Properties of Synthetic Investigating Topologic and Geometric Properties of Synthetic and Natural River Networks under Changing Climate [PhD Dissertation]. University of Central Florida. Available online at: https://purls.library.ucf.edu/go/DP0026215 (accessed April 17, 2024).
Sarker, S. (2022). Fundamentals of climatology for engineers: lecture note. Eng 3, 573–595. doi: 10.3390/eng3040040
Schuldt, B., Buras, A., Arend, M., Vitasse, Y., Beierkuhnlein, C., Damm, A., et al. (2020). A first assessment of the impact of the extreme 2018 summer drought on Central European forests. Basic Appl. Ecol. 45, 86–103. doi: 10.1016/j.baae.2020.04.003
Seager, R., Pederson, N., Kushnir, Y., Nakamura, J., and Jurburg, S. (2012). The 1960s drought and the subsequent shift to a wetter climate in the Catskill Mountains region of the New York City watershed. J. Clim. 25, 6721–6742. doi: 10.1175/JCLI-D-11-00518.1
Sen, P. K. (1968). Estimates of the regression coefficient based on Kendall's Tau. J. Am. Stat. Assoc. 63, 1379–1389. doi: 10.1080/01621459.1968.10480934
Shi, W., Huang, S., Liu, D., Huang, Q., Leng, G., Wang, H., et al. (2020). Dry and wet combination dynamics and their possible driving forces in a changing environment. J. Hydrol. 589:125211. doi: 10.1016/j.jhydrol.2020.125211
Sivapalan, M., Blöschl, G., Merz, R., and Gutknecht, D. (2005). Linking flood frequency to long-term water balance: Incorporating effects of seasonality. Water Resour. Res. 41, 1–17. doi: 10.1029/2004WR003439
Sluijter, R., Plieger, M., Van Oldenborgh, G. J., Beersma, J., and De Vries, H. (2018). De droogte van 2018 - een analyse op basis van het potentiële neerslagtekort. Technical report, KNMI (Koninklijk Nederlands Meteorologisch Instituut). Available online at: https://cdn.knmi.nl/system/readmore_links/files/000/001/101/original/droogterapport.pdf?1543246174 (accessed February 5, 2024).
Swain, D. L., Langenbrunner, B., Neelin, J. D., and Hall, A. (2018). Increasing precipitation volatility in twenty-first-century California. Nat. Clim. Change 8, 427–433. doi: 10.1038/s41558-018-0140-y
Sykora, K. V. (1979). The effects of the severe drought of 1976 on the vegetation of some moorland pools in The Netherlands. Biol. Conserv. 16, 145–162. doi: 10.1016/0006-3207(79)90062-4
Tabari, H. (2020). Climate change impact on flood and extreme precipitation increases with water availability. Sci. Rep. 10:13768. doi: 10.1038/s41598-020-70816-2
Theil, H. (1992). “A rank-invariant method of linear and polynomial regression analysis,” in Henri Theil's Contributions to Economics and Econometrics: Econometric Theory and Methodology, eds. B. Raj, and J. Koerts (Dordrecht: Springer Netherlands), 345–381. doi: 10.1007/978-94-011-2546-8_20
Toreti, A., Bavera, D., Navarro, J. A., Arias-Muñoz, C., Avanzi, F., Barbosa, P., et al. (2023). Drought in Europe: March 2023. GDO Analytical Report. Luxembourg: Publications Office of the European Union.
Tramblay, Y., Arnaud, P., Artigue, G., Lang, M., Paquet, E., Neppel, L., et al. (2023). Changes in Mediterranean flood processes and seasonality. Hydrol. Earth Syst. Sci. 27, 2973–2987. doi: 10.5194/hess-27-2973-2023
Tsiokanos, A., Rutten, M., van der Ent, R. J., and Uijlenhoet, R. (2023). Flood drivers and trends: a case study of the Geul River Catchment (the Netherlands) over the past half century. Hydrology and Earth System Sciences Discussions. [Preprint]. Available online at: https://hess.copernicus.org/preprints/hess-2023-263/ (accessed February 10, 2024).
United Nations Office for Disarmament Affairs (2020). Human Cost of Disasters: An Overview of the Last 20 Years 2000–2019. United Nations. Available online at: https://www.un-ilibrary.org/content/books/9789210054478 (accessed August 20, 2023).
United States Geological Survey (2022). Water Year. Available online at: https://water.usgs.gov/nwc/explain_data.html (accessed July 1, 2022).
Van Der Wiel, K., Selten, F. M., Bintanja, R., Blackport, R., and Screen, J. A. (2020). Ensemble climate-impact modelling: extreme impacts from moderate meteorological conditions. Environ. Res. Lett. 15:034050. doi: 10.1088/1748-9326/ab7668
van Oort, P. A., Timmermans, B. G., Schils, R. L., and van Eekeren, N. (2023). Recent weather extremes and their impact on crop yields of the Netherlands. Eur. J. Agron. 142:126662. doi: 10.1016/j.eja.2022.126662
van Vliet, M. T., and Zwolsman, J. J. (2008). Impact of summer droughts on the water quality of the Meuse river. J. Hydrol. 353, 1–17. doi: 10.1016/j.jhydrol.2008.01.001
Visser-Quinn, A., Beevers, L., Collet, L., Formetta, G., Smith, K., Wanders, N., et al. (2019). Spatio-temporal analysis of compound hydro-hazard extremes across the UK. Adv. Water Resour. 130, 77–90. doi: 10.1016/j.advwatres.2019.05.019
Wang, S. Y. S., Yoon, J. H., Becker, E., and Gillies, R. (2017). California from drought to deluge. Nat. Clim. Change 7, 465–468. doi: 10.1038/nclimate3330
World Meteorological Organization (2019). Technical regulations, Basic Documents No. 2, Volume I – General Meteorological Standards and Recommended Practices (WMO-No. 49). Geneva: World Meteorological Organization.
Yan, D. H., Wu, D., Huang, R., Wang, L. N., and Yang, G. Y. (2013). Drought evolution characteristics and precipitation intensity changes during alternating dry-wet changes in the Huang-Huai-Hai River basin. Hydrol. Earth Syst. Sci. 17, 2859–2871. doi: 10.5194/hess-17-2859-2013
Yoon, J. H., Wang, S. Y., Lo, M. H., and Wu, W. Y. (2018). Concurrent increases in wet and dry extremes projected in Texas and combined effects on groundwater. Environ. Res. Lett. 13:054002. doi: 10.1088/1748-9326/aab96b
Keywords: wet and dry events, hydrological extremes, flood, drought, multi-hazard risk, Netherlands, Meuse basin
Citation: Hariharan Sudha S, Ragno E, Morales-Nápoles O and Kok M (2024) Investigating meteorological wet and dry transitions in the Dutch Meuse River basin. Front. Water 6:1394563. doi: 10.3389/frwa.2024.1394563
Received: 01 March 2024; Accepted: 29 April 2024;
Published: 15 May 2024.
Edited by:
Shasha Han, University of Birmingham, United KingdomReviewed by:
Shiblu Sarker, Virginia Department of Conservation and Recreation, United StatesAmin Sadeqi, University of Turku, Finland
Copyright © 2024 Hariharan Sudha, Ragno, Morales-Nápoles and Kok. This is an open-access article distributed under the terms of the Creative Commons Attribution License (CC BY). The use, distribution or reproduction in other forums is permitted, provided the original author(s) and the copyright owner(s) are credited and that the original publication in this journal is cited, in accordance with accepted academic practice. No use, distribution or reproduction is permitted which does not comply with these terms.
*Correspondence: Srividya Hariharan Sudha, S.HariharanSudha-1@tudelft.nl