 Kevin Surya
 Jacob D. Gardner
 Chris L. Organ
- 1Department of Mathematical Sciences, Montana State University, Bozeman, MT, United States
- 2School of Biological Sciences, University of Reading, Reading, United Kingdom
The Severe Acute Respiratory Syndrome Coronavirus 2 (SARS-CoV-2) evolved slowly over the first year of the Coronavirus Disease 19 (COVID-19) pandemic with differential mutation rates across lineages. Here, we explore how this variation arose. Whether evolutionary change accumulated gradually within lineages or during viral lineage branching is unclear. Using phylogenetic regression models, we show that ~13% of SARS-CoV-2 genomic divergence up to May 2020 is attributable to lineage branching events (punctuated evolution). The net number of branching events along lineages predicts ~5% of the deviation from the strict molecular clock. We did not detect punctuated evolution in SARS-CoV-1, possibly due to the small sample size, and in sarbecovirus broadly, likely due to a different evolutionary process altogether. Punctuation in SARS-CoV-2 is probably neutral because most mutations were not positively selected and because the strength of the punctuational effect remained constant over time, at least until May 2020, and across continents. However, the small punctuational contribution to SARS-CoV-2 diversity is consistent with the founder effect arising from narrow transmission bottlenecks. Therefore, punctuation in SARS-CoV-2 may represent the macroevolutionary consequence (rate variation) of a microevolutionary process (transmission bottleneck).
1 Introduction
As of October 2022, SARS-CoV-2 has infected ~621 million people and killed ~6.6 million worldwide (1). SARS-CoV-2 spread rapidly, yet it mutated slowly over the first year of the pandemic, with about two mutations per month (2). While slow, the evolutionary rate did vary across lineages (2). Rate variation became more evident by late 2020 when ‘variants of concern’ emerged, such as Alpha/B.1.1.7 (U.K.), Beta/B.1.351 (South Africa), Gamma/P.1 (Brazil), Delta/B.1.617.2 (India), and Omicron/B.1.1.529 (multiple countries) (3). Identified by multiple sets of mutations, these variants have the potential to escape neutralization (4, 5).
Inferring SARS-CoV-2 evolutionary rate (tempo) has been crucial for explaining viral diversity and informing mitigation efforts, including vaccine development (6). Modeling rate variation is fundamental for viral phylodynamics (7, 8). For example, lineage B.1.1.7 underwent 14 amino acid replacements within a single branch, probably due to a chronic infection (4, 9). This rare, single-branch rate acceleration is akin to punctuations in viral antigenicity (10–12).
SARS-CoV-2 may have accumulated mutations steadily, independent of lineage-branching events (null hypothesis: gradual evolution) (13). The speed of gradual evolution within and across lineages depends on factors such as genome architecture, replication rate, and polymerase fidelity (14). In contrast, SARS-CoV-2 may have accrued more mutations during lineage splitting or diversification, which generally occurs as the virus infects new hosts (alternative hypothesis: punctuated evolution). Here, punctuated molecular evolution is a less strict version of the well-known theory of punctuated equilibrium (15), which posits that, over geological time, evolutionary stasis follows bursts of change during speciation events. The difference is that punctuation at the molecular level does not require stasis, just an association between evolutionary rate and speciation (16).
Punctuated evolution may arise through drift or selection (16). Host-to-host transmission is associated with narrow population bottlenecks (17, 18), similar to the founder effect in Ernst Mayr’s speciation model (19). The small founding population is subject to genetic drift, and therefore, rapid evolution. Alternatively, punctuation could also result from positive or diversifying selection associated with moving into new environments (15, 16) or new human hosts for SARS-CoV-2. Regardless of the mechanism, rapid evolution during transmission may have long-term implications. We expect SARS-CoV-2 lineages that have undergone more branching events to have evolved more. The net number of lineage-branching events may predict, in part, the deviation from the strict molecular clock (13). If so, SARS-CoV-2 represents a case where microevolutionary processes at “speciation” events contribute to macroevolutionary patterns.
To test these hypotheses, we analyzed molecular phylogenies to discover the degree of punctuation in SARS-CoV-2 evolution. We tested whether the net number of lineage-branching events or internal nodes along the root-to-tip path predicts the variation in root-to-tip divergence, accounting for genome sampling time. This method generalizes the current model for testing punctuated evolution in contemporary species (16). For context, we also assessed the degree of punctuation among the broader sarbecoviruses and SARS-CoV-1. Characterizing the evolutionary mode, not just the tempo, provides insights into how viral molecular diversity arises.
2 Materials and methods
2.1 SARS-CoV-2
On 2020-05-26, we downloaded from the GISAID EpiCoV database a MAFFT-produced multiple sequence alignment of 29,287 high-quality (<5% NNNNs) SARS-CoV-2 genomes (20, 21). The alignment was manually inspected and trimmed to remove sites without a corresponding base in the 29,903 nt Wuhan-Hu-1 reference genome (MN908947). Using R v.4.0.2 (22), we removed genomes shorter than 29,400 nt, isolated from non-human hosts, lacking a precise sampling date, or those that do not have a matching entry in the GISAID metadata. As recommended, we masked positions likely affected by sequencing artifacts (23). Duplicate sequences were filtered out with CD-HIT v.4.8.1 (24).
We inferred a maximum likelihood phylogenetic tree with IQ-TREE v.1.6.12 (25), allowing the DNA transition and transversion rates, base frequencies, and across-site substitution rates to vary (HKY+F+I+G4). The tree was rooted to the Wuhan-Hu-1 duplicate, Wuhan/WIV04 (MN996528). Twenty-four genomes had long terminal branches, and after inspection, we removed nine that likely contained sequencing artifacts or misalignments (Supplementary Table 1). The final sample size is 15,019 genomes (Supplementary Figure 1).
From the tree, we calculated node count (net number of lineage-branching events) and root-to-tip divergence (genomic mutations accumulated since the SARS-CoV-2 common ancestor). We collected genome sampling times and converted them into the decimal year format. The R packages used to extract these data are ape v.5.4.1 (26), lubridate v.1.7.9 (27), phytools v.0.7.47 (28), and stringr v.1.4.0 (29). Further, we created a 3D scatter plot with htmlwidgets v.1.5.1 (30) and plotly v.4.9.2.1 (31), available in the online supplementary data.
To assess how much punctuational episodes explain the variation in SARS-CoV-2 genetic divergence, we regressed root-to-tip divergence (y) on sampling time (x1) and node count (x2) (Figure 1). This approach combines the model for checking the temporal signal in viral and ancient DNA sequences (32) and the model for testing punctuated evolution in contemporary species (16, 33). We can write the regression equation as y = β0 + β1x1 + β2x2 + ϵ, where β0 is the state at the root of the tree (intercept), β1 is the time effect (or the phylogenetically-corrected mean evolutionary rate), β2 is the lineage-splitting effect, and ϵ is the residual error. To prevent overfitting, we compared the fit of this model against that of a null model without node count (y = β0 + β1x1 + ϵ) using the Bayesian Information Criterion (BIC) (34). Comparing BIC scores helps select among competing models by considering model likelihoods and the number of parameters. A BIC score difference higher than two (ΔBIC > 2) represents positive evidence for the model with the lowest BIC score, the best-fitting one (35). If SARS-CoV-2 evolution is punctuated, we expect an increase in the average molecular divergence for every additional net branching event (β2 > 0), accounting for sampling time. We also calculated the proportion of the total amount of evolution attributable to punctuational effects using the formula , where s is the number of tips and T is the sum of all branch lengths (16). Moreover, we determined how much the punctuational effect explains the deviation from the molecular clock. This quantity is implied by the partial R2 of the node count, which is the amount of residual variance explained by the alternative model that was not accounted for in the null model. The value and partial R2 should be higher than zero, indicating a significant punctuational contribution to molecular divergence.
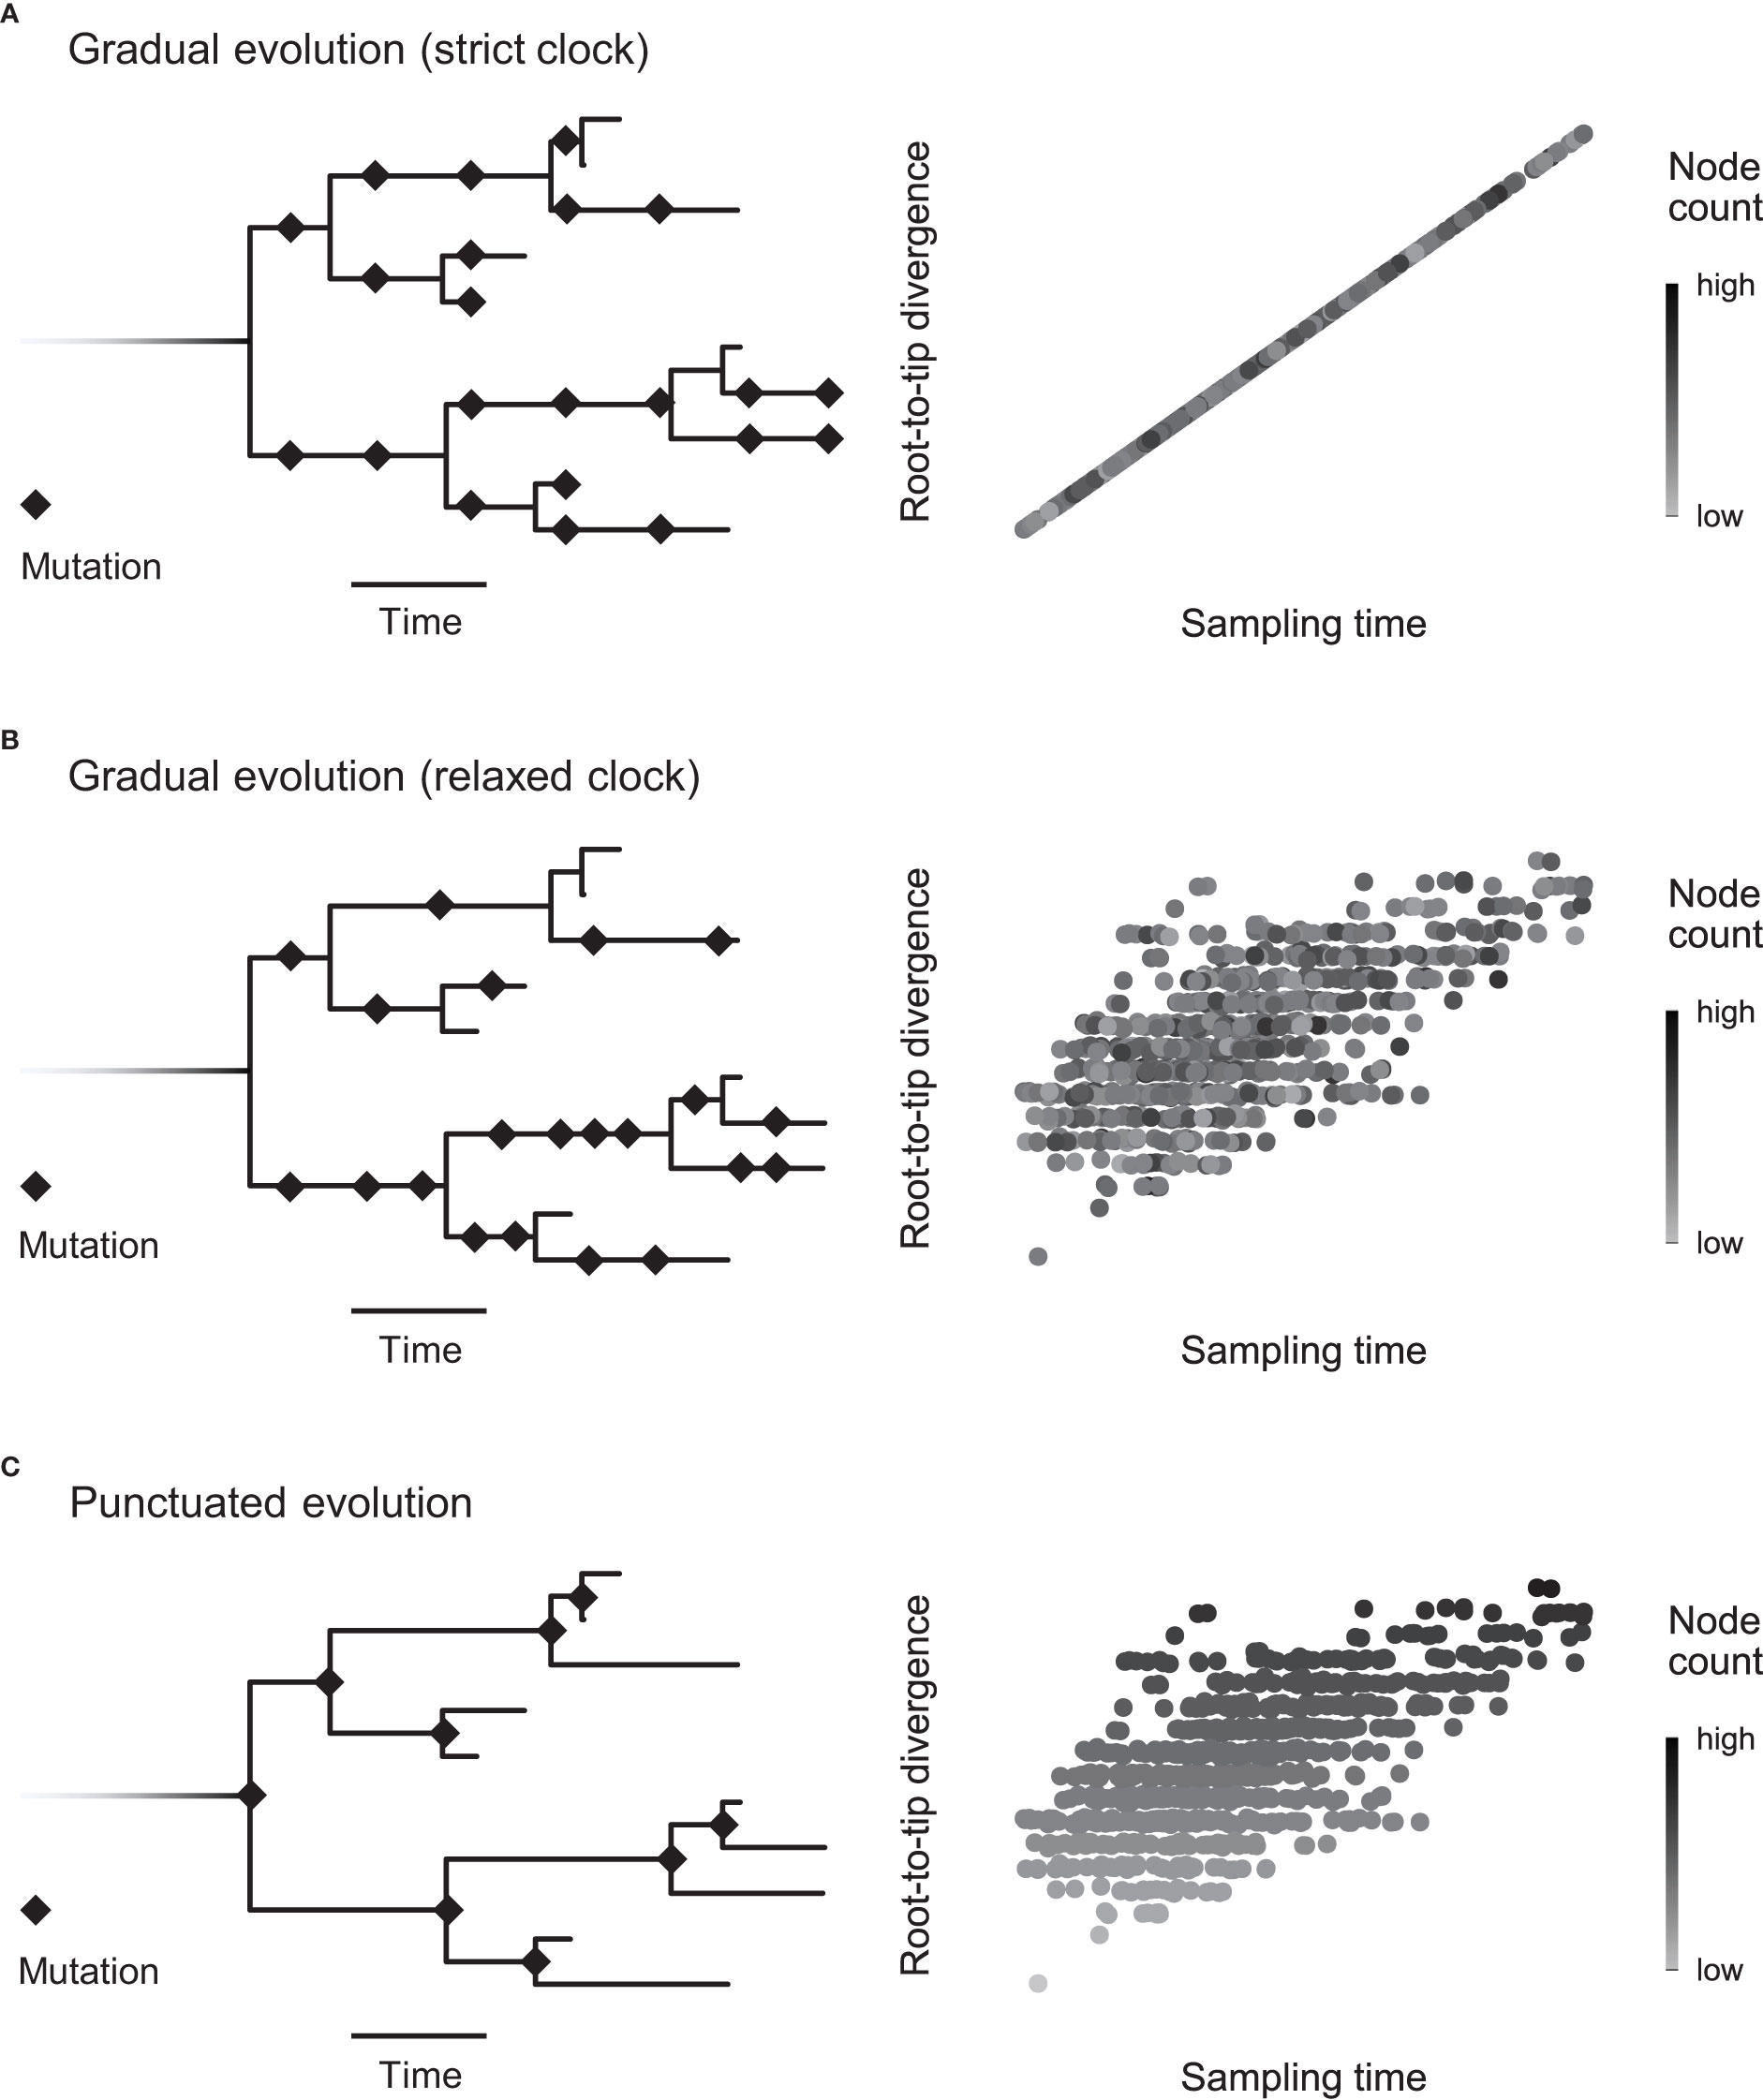
Figure 1 Detecting the mode of evolution in heterochronous sequences. Here we show the two extremes of the evolutionary mode spectrum (gradual and punctuated evolution) when the rate is constant (strict clock) or variable (relaxed clock). (A) Under the strict, gradual scenario, mutations accumulate steadily across the phylogenetic tree. Sampling time explains root-to-tip divergence, leaving no room in the model for node count (net number of branching events). (B) The rate can vary, yet mutations may still accumulate incrementally. Accounting for sampling time, node count is independent of root-to-tip divergence. This scenario is illustrated by the random distribution of points with different node counts (grayscale). (C) Alternatively, when a statistically significant number of mutations accrue during lineage-branching events (punctuated evolution), we expect node count to scale with root-to-tip divergence, as depicted by the top-down gradient. In other words, punctuated evolution implies rate variation associated with lineage splitting.
We ensured that sampling time and node count do not carry similar information in the regression model (i.e., multicollinearity) by checking the variance inflation factors (VIFs) using the R package car v.3.0.9 (36). Regression would fail to detect punctuated evolution if multicollinearity is present.
For estimating model parameters and likelihood, we used a maximum likelihood algorithm under a phylogenetic generalized least squares (PGLS) framework. We fitted the regression model with the R packages ape and nlme v.3.1-148 (37). PGLS accounts for the non-independence of SARS-CoV-2 genomes due to shared ancestry, alleviating the concern raised in Drummond et al. (38). The phylogenetic tree from which we extracted the data should model the data covariance well. Therefore, we fixed Pagel’s λ, a measure of phylogenetic signal (39), to one; Pagel’s λ converged to one when estimated (online supplementary data). After model fitting, we checked the regression assumptions of normality and equal variance using the phylogenetically normalized residuals (40).
The underestimation of branch lengths in tree regions with fewer taxa, called the node-density artifact, can bias the regression estimates. To check for the presence of this artifact, we used the δ test (41), which predicts a curvilinear relationship between node count (n) and root-to-tip divergence (x). The equation is n = βxδ , where β is the rate of change between node count and root-to-tip divergence. We expect δ > 1 when the node-density artifact is present.
SARS-CoV-2 sampling biases may impact results, so we repeated the regression with subsampled datasets. We subsampled the tree 1,000 times, and for each subsample, we randomly selected 1,000 genomes and analyzed the dataset. Then, we calculated a percentile-based 95% confidence interval (CI) for each distribution of 1,000 estimates (node count effect, partial R2, p-value, and the node-density artifact metric δ ). We also used a different variant of the subsampling process where we randomly picked clades comprising 100-10,000 genomes using the R package Treeio v.1.12.0 (42).
We assessed whether the degree of punctuational contribution to SARS-CoV-2 evolution varied across continents and through time. For estimating the continent effect, we added indicator variables to the regression as well as interaction terms to allow the node count effect to differ by continent. The equation is , where β3 through β7 are the intercept differences between the reference continent (Africa) and the specified continent (e.g., x3,Asia=1 for Asia), and β8 through β12 are the slope differences. This model was compared to a simpler model without interaction terms using BIC. To test whether the degree of punctuation declined or increased with time, we added an interaction between node count and sampling time (y = β0 + β1x1 + β2x2 + β3x1x2 + ϵ). Again, we compared this model against one without an interaction term.
Lastly, we tested if punctuation remained detectable later in the pandemic. The number of sequenced genomes increased, but COVID cases worldwide surged faster. Over time, the sample-to-population ratio decreased. This incomplete sampling could bias the estimation of punctuational effects (16), rendering us less confident with the results of the following analyses. We downloaded from GISAID two SARS-CoV-2 trees: one released on 2020-12-09 containing 177,962 genomes sampled pre-vaccination worldwide (43) and another on 2021-03-02 (n = 458,255 genomes) when the lineage B.1.1.7 was spreading rapidly (9). Genomes from non-human hosts and those lacking a precise sampling date were discarded. To analyze these two large datasets, we subsampled from each tree 15,000 genomes once (Supplementary Figures 2, 3) and 5,000 genomes 100 times. Duplicates were removed each time, so the final sample sizes varied. We were unable to screen for duplicates in the full trees due to computational limitations. For the March 2021 analysis, we added models that account for the jump in the number of mutations among B.1.1.7 genomes (y = β0 + β1x1 + β2x2 + β3x3,B.1.1.7=1 + ϵ) and more complex models where B.1.1.7 genomes have a different evolutionary rate and or degree of punctuational effect. Also, we tested for changes in the node count effect over time and across continents, but only with the December 2020 tree to avoid overparameterization.
2.2 Sarbecovirus
We downloaded Boni et al.’s (44) sarbecovirus alignment of 63 genomes. This alignment is the concatenation of what Boni et al. called non-recombining regions 1 (NRR1). Then, we built a tree using W-IQ-TREE (45) and the model specification we used for SARS-CoV-2 (HKY+F+I+G4). The tree was rooted to the Kenyan coronavirus BtKy72 (KY352407), which we removed afterward. Three duplicates were dropped, leaving 59 genomes (Supplementary Figure 4). Root-to-tip divergence, sampling time, and node count were extracted as before. However, whenever the sampling time is only available in the year (YYYY) or month-of-the-year format (YYYY-MM), we arbitrarily fixed the sampling time to the middle of the year or the month. We kept genomes without a precise date because the sarbecovirus sample size is relatively small. Fixing the time as aforementioned should not introduce significant bias, given that the sampling time ranges from 2004 to 2020. For processing the sampling time data, we used the R packages lubridate and zoo v.1.8.8 (46).
To test if punctuated evolution is present among the broader sarbecoviruses, we repeated the previous regression analysis (y = β0 + β1x1 + β2x2 + ϵ). The likelihood of this model was compared to that without node count using BIC. We checked for the node-density artifact. And we fitted the regression on a dataset without nine multivariate outliers, which we detected using the minimum covariance determinant method implemented in the R package MASS v.7.3.51.6 (47, 48). This detection method, when using the suggested cutoff α = 0.01, is quite conservative. All nine outliers are sarbecoviruses on the lineage leading to SARS-CoV-2 plus a representative SARS-CoV-1 genome (Supplementary Table 1).
2.3 SARS-CoV-1
We downloaded an alignment of 69 SARS-CoV-1 genomes from Boni et al. (44) (58 from humans and 11 from civets and raccoon dogs). Potentially recombining regions had already been deleted. As an outgroup, the bat SARS-like CoV Rp3 genome (DQ071615) (49) was added to the alignment using the MAFFT online service (50). Insertions at the bat SARS-like CoV Rp3 genome were removed, keeping the original alignment length. Then, we inferred a tree, dropped duplicate and non-human sequences (Supplementary Figure 5), and analyzed the dataset the same way as in the sarbecovirus case (final n = 53). We also ran the analyses without 11 outliers (Supplementary Table 1). To assess how the small sample size affects the detection of the punctuational effect, we subsampled the SARS-CoV-2 tree released on May 2020 1,000 times as before. For each subsample, we vary the size (42 genomes to match the SARS-CoV-1 sample size) and the continental distribution of the genomes, matching that of SARS-CoV-1.
3 Results
3.1 SARS-CoV-2
We found strong evidence for punctuated evolution in SARS-CoV-2 up to May 2020 (, p-value < 0.001; Figure 2). The phylogenetic regression model with node count as a predictor has a higher likelihood than the null model with only sampling time (ΔBIC = 837.5; Supplementary Table 2). The practical interpretation of β2 is as follows: a lineage is expected to accumulate about one mutation for every 15 branching events (∼1 expected mutation per 15 nodes = 2.3 × 10⁻⁶ expected mutations per site per node × 29,903 sites × 15 nodes). Because the rate of net lineage branching ranges from 0 events/month (Wuhan/WIV04 or EPI_ISL_402124) to ~173 events/month (EPI_ISL_443087 and EPI_ISL_443685), punctuated evolution results in variable evolutionary rates across lineages.
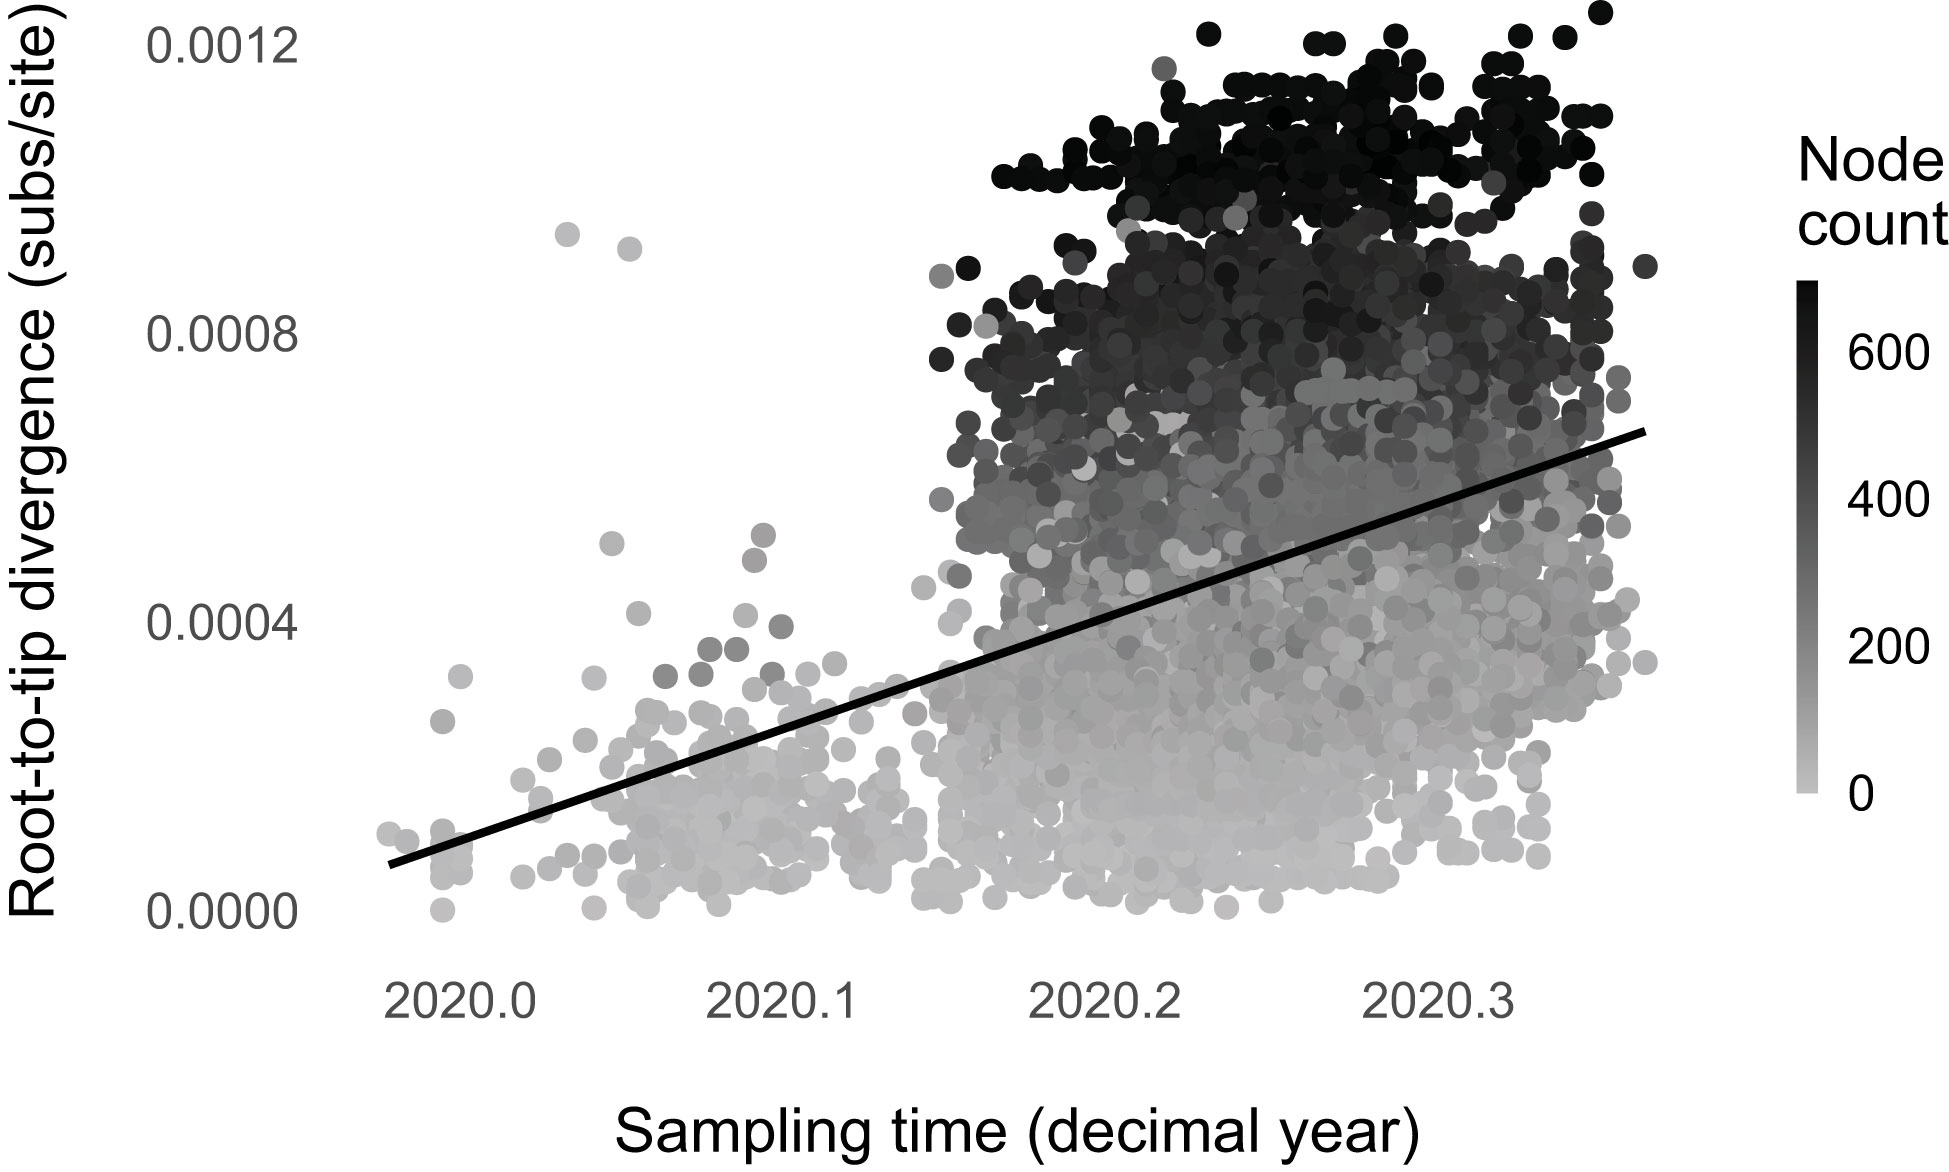
Figure 2 SARS-CoV-2 evolution was punctuated up to May 2020. Higher node count (net lineage-branching events) corresponds with higher root-to-tip divergence (), accounting for genome sampling time. We plotted the non-phylogenetic fit line for simplicity.
About 13% of the total SARS-CoV-2 molecular evolution is attributable to the detected punctuational effect (). This number is similar to those found for plants, fungi, and animals, 16% ± 5.4% (16). Additionally, punctuational episodes explain ~5% of the deviation from the molecular clock (partial R2 of the node count = 0.05; full R2 = 0.07), comparable to the estimates for other evolving entities (16).
Regression diagnostics indicate no modeling violations (Supplementary Figure 6). The node-density artifact (33, 41), an underestimation of branch lengths in parts of the tree with fewer taxa, is absent (Supplementary Figure 7). Node count and sampling time are not multicollinear as their variance inflation factors are lower than ten (VIFsampling time = 1.00; VIFnode count = 1.00) (51). We still found the signature of punctuated evolution when we repeated the regression with subsampled datasets (Supplementary Figures 8, 9). Moreover, we found that the degree of punctuational effect remained constant over time (until May 2020) and across continents (Supplementary Figures 10, 11).
Analyses of SARS-CoV-2 trees released on December 2020 and March 2021 also yield evidence for punctuated evolution (Supplementary Table 3; Supplementary Figures 12–15). Including parameters that allowed for the degree of punctuation to vary over time, across continents, or for lineage B.1.1.7 did not increase the model likelihood enough, bolstering the constancy of punctuation. Punctuational effects remained detectable until later in the pandemic, but the estimates are much lower. Subsampling 42 genomes from the SARS-CoV-2 May 2020 tree 1,000 times shows that undersampling, as is the case for SARS-CoV-2 in December 2020 and March 2021, does not always mask punctuational signals (Supplementary Figure 20). Therefore, sparser sampling later in the pandemic, where the number of COVID cases soared faster than the number of sequenced genomes, may not be the best explanation. Possibly, the lower estimates could be due to an actual decrease in the punctuational level (undetected by our regression models due to heterogeneity in the evolutionary process) or differences in phylogenetic tree inference methods.
3.2 Sarbecovirus
In contrast with SARS-CoV-2, we found that the best-fitting model lacked node count and sampling time (ΔBIC, for the intercept-only model = 3.70; Figure 3; Supplementary Table 4; Supplementary Figures 16, 17). The lack of root-to-tip temporal signal, when normalizing for phylogeny, replicates Boni et al.’s (44) finding. Re-analyzing the data without nine outliers did not change the result, consistent with the hypothesis that, broadly speaking, sarbecoviruses evolved gradually. Sarbecovirus genomes broadly are sequenced at a much lower rate than SARS-CoV-2. However, undersampling may not necessarily suppress signals of punctuated evolution (Supplementary Figure 20).
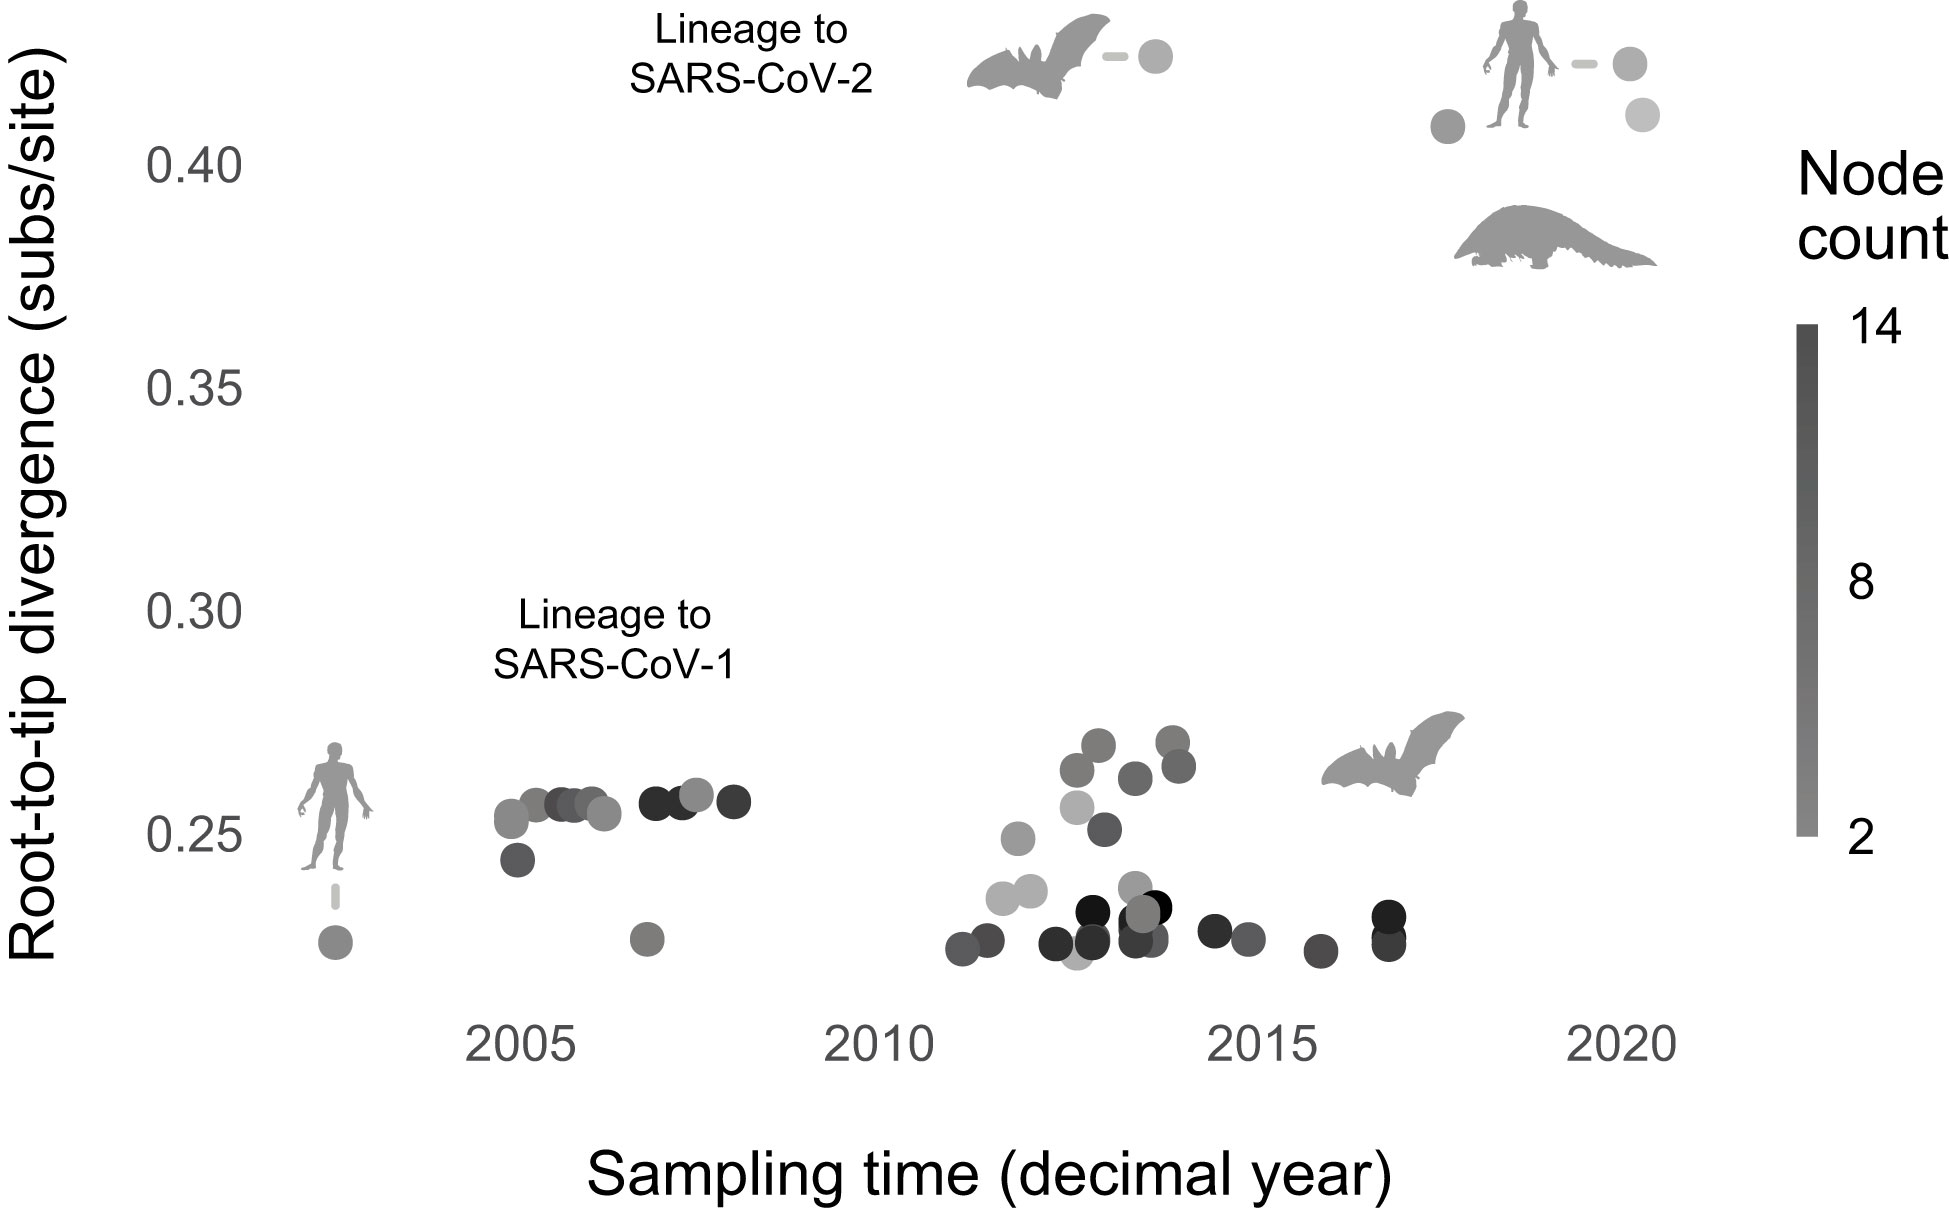
Figure 3 Sarbecoviruses evolved gradually. The best-fitting model lacks predictors (node count and sampling time). Phylopic silhouettes (public domain) represent the hosts (bat by Yan Wong; human by Mali’o Kudis; pangolin by Steven Traver).
3.3 SARS-CoV-1
We found no evidence that SARS-CoV-1 evolution was punctuated (Figure 4; Supplementary Table 5; Supplementary Figures 18–20). The regression model with an interaction between sampling time and node count is the best-fitting one, but likely because of outliers. Without 11 outliers, the model without predictors has the lowest BIC score. SARS-CoV-1 could have evolved gradually like the broader sarbecoviruses. However, the BIC score is only slightly lower than the model with node count (ΔBIC, for the intercept-only model = 1.00). Possibly, we lacked the statistical power to detect punctuation because of the small sample size compared to the SARS-CoV-2 dataset. This notion is supported by the SARS-CoV-2 subsampling analyses, where the sampling scheme was designed to match that of SARS-CoV-1 (Supplementary Figure 20). A small sample size does not result in a downward bias of the punctuational effect. However, it increases uncertainty and, thereby, statistical power.
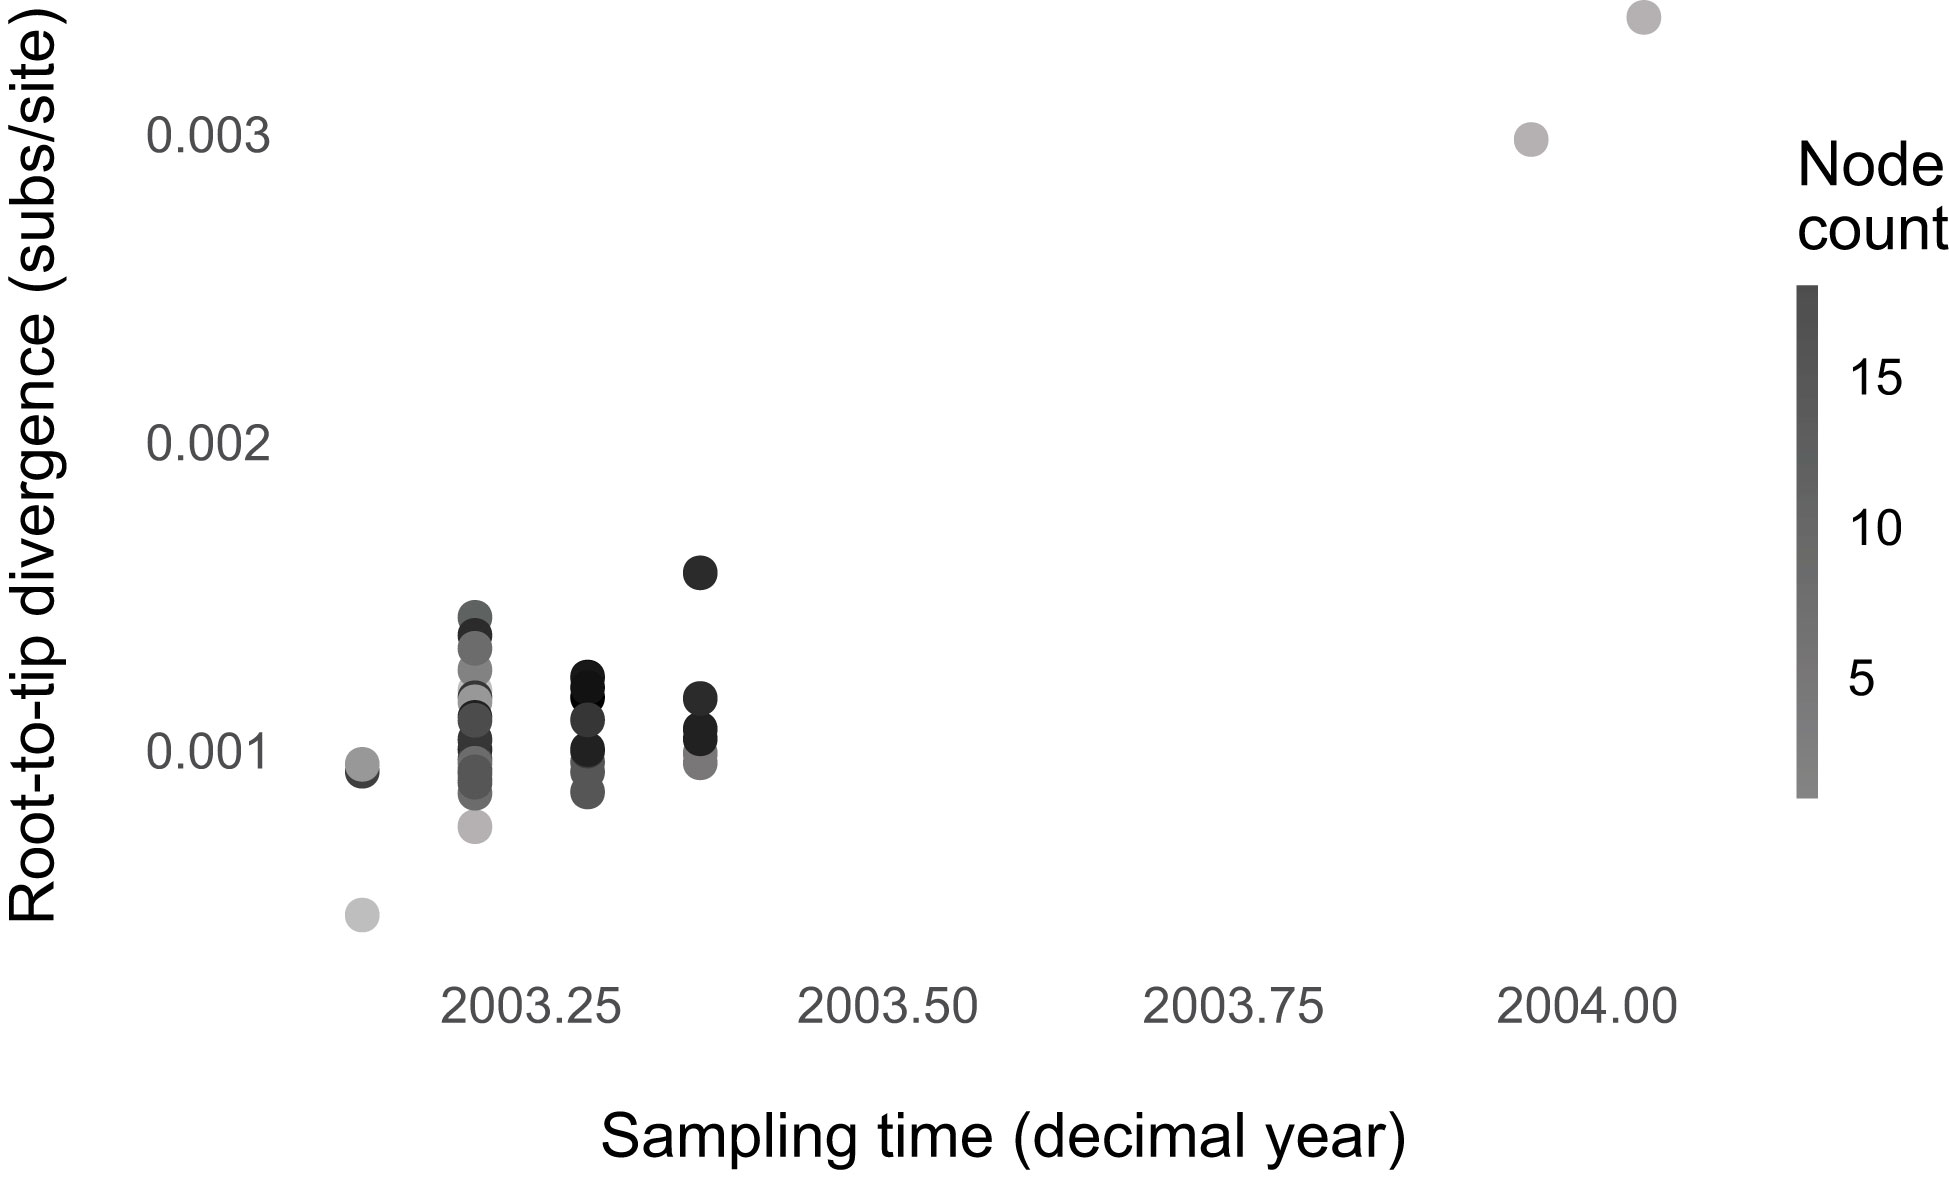
Figure 4 No evidence for punctuated evolution in SARS-CoV-1. The best-fitting model is the model without predictors (node count and sampling time).
4 Discussion
About 13% of the total evolution in SARS-CoV-2 is coupled to viral diversification. That is, lineages that branched more frequently have higher evolutionary rates. Indeed, ~5% of the deviation from the strict molecular clock can be explained by lineage splitting. Independent work does not support the inverse of our hypothesis (52) that mutations drove viral lineage branching events (53).
As mentioned above, punctuated evolution in SARS-CoV-2 could have arisen through either natural selection or founder effects associated with human-to-human transmission. If punctuation resulted from selection, we would expect punctuation to decline following the spillover event, as SARS-CoV-2 continued to adapt to humans. We would further predict that the degree of punctuation varied across continents following variation in selective pressures (e.g., COVID-19 interventions and host demographics). Most mutations throughout the pandemic should also exhibit signatures of positive selection. However, we found no indication that the punctuational effect decreased over time, at least until May 2020, or differed across continents. And the evidence for pervasive positive selection in SARS-CoV-2 is lacking (4, 6, 18, 54). The punctuational effect estimates are lower for the analyses of SARS-CoV-2 December 2020 and March 2021 trees, which could be due to methodological differences in inferring the trees or a true decrease that our models could not capture due to the heterogeneity of the evolutionary process. If the latter is true, it is possible that SARS-CoV-2 punctuated evolution is associated with the initial global spread of the virus and that the punctuation diminished later, reaching a “steady state.” This speculation requires phylogenetic modeling methods scalable for the unprecedented SARS-CoV-2 dataset size. Altogether, punctuated evolution in SARS-CoV-2 probably did not emerge through selection.
Conversely, SARS-CoV-2 punctuated evolution is consistent with the founder effect. For viruses (and microbes), this effect is associated with narrow transmission bottlenecks (17, 18). With a bottleneck size of one to eight viruses, the diversity of the transmitted SARS-CoV-2 population is substantially lower than the within-host diversity (18). Most often, the transmitted subpopulation is composed of the majority variant. However, when minor variants are transmitted, the resulting consensus sequence would change, and a mutation or substitution would be detected (18). These rarer instances may explain why a small yet statistically significant proportion of SARS-CoV-2 evolution accrued during human-to-human transmission.
We did not detect punctuational effects in sarbecoviruses broadly and SARS-CoV-1. This result is consistent with the hypothesis that the broader sarbecoviruses evolved gradually because their long-term reservoir, bats, have adapted to tolerate them (55, 56). Strong purifying selection acting on bat sarbecoviruses (54, 57) could negate founder effects. Minor variants in transmitted subpopulations that did not fit the new host environment might have been selectively removed. For SARS-CoV-1, the result is likely due to the lack of statistical power arising from the small number of sequenced genomes relative to SARS-CoV-2, consistent with a previous study reporting a lack of evidence for variation in the evolutionary rate (44). So, we cannot confidently conclude that SARS-CoV-1 evolution was punctuated.
The punctuation we detected in SARS-CoV-2 differs from those previously reported in the vesicular stomatitis virus (58), influenza virus (10–12), and myxovirus (59). These studies equate punctuation with tachytelic (rapid) evolution along single branches of a phylogenetic tree (60), akin to the originations of variants of concern (4, 9, 61, 62). These variants did not arise through punctuation but through accelerated evolution associated with chronic infection (63). As far as we know, our study is the first to detect punctuated evolution in viruses in the same sense as Eldredge and Gould’s punctuated equilibrium (15): evolutionary change concentrated at speciation events (i.e., lineage-branching events).
With this research, we have expanded the toolbox for investigating the evolutionary dynamics of serially sampled viruses at pandemic scales. Punctuational evolution is different from variable rate (heterotachy) or accelerated (tachytely) evolution, which are not necessarily correlated with speciation. This has important implications for how viruses evolve and spread among human populations. For example, dating of lineages is crucial for studying how viruses spread geographically across the globe. Our findings suggest that punctuational evolution should be considered when reconstructing routes of transmission as well as ancestral sequences. Our findings also help clarify how processes at the level of transmission give rise to larger-scale macroevolutionary rates and diversification. SARS-CoV-2 evolution may represent the macroevolutionary consequence of a microevolutionary process, which helps us connect individual infection with larger population-level dynamics of infectious disease.
Data availability statement
We collected part of the raw data(SARS-CoV-2 multiple sequence alignments) from GISAID, whichrequires a verified membership for access. GISAID prohibits storingthese raw data on a public platform. The rest of the data, codes, andanalysis outputs are available at the figshare repository: https://doi.org/10.6084/m9.figshare.21300972.
Author contributions
All authors contributed to the article and approved the submitted version.
Funding
KS was supported by the Montana State University Molecular Biosciences Fellowship Program. JDG was supported by a Postgraduate Research Studentship from the University of Reading (award GS21-122). The publication fee was paid by the Montana State University Library Open Access Author Fund.
Acknowledgments
We thank Blake Wiedenheft and Tanner Wiegand for the discussion and recommendations, and Tanner, specifically, for the early SARS-CoV-2 phylogenetic tree. We thank Mark Pagel, William Freimuth, and the Deep Time Biology Lab for their constructive comments on earlier drafts. Finally, we thank all authors who have kindly shared genome data on GISAID.
Conflict of interest
The authors declare that the research was conducted in the absence of any commercial or financial relationships that could be construed as a potential conflict of interest.
Publisher’s note
All claims expressed in this article are solely those of the authors and do not necessarily represent those of their affiliated organizations, or those of the publisher, the editors and the reviewers. Any product that may be evaluated in this article, or claim that may be made by its manufacturer, is not guaranteed or endorsed by the publisher.
Supplementary material
The Supplementary Material for this article can be found online at: https://www.frontiersin.org/articles/10.3389/fviro.2023.1066147/full#supplementary-material
References
1. Johns Hopkins University & Medicine. Coronavirus resource center. (2022). https://coronavirus.jhu.edu/ (9 October 2022)
2. Duchene S, Featherstone L, Haritopoulou-Sinanidou M, Rambaut A, Lemey P, Baele G. Temporal signal and the phylodynamic threshold of SARS-CoV-2. Virus Evol (2020) 6(2):veaa061. doi: 10.1093/ve/veaa061
4. Harvey WT, Carabelli AM, Jackson B, Gupta RK, Thomson EC, Harrison EM, et al. SARS-CoV-2 variants, spike mutations and immune escape. Nat Rev Microbiol (2021) 19(7):409–24. doi: 10.1038/s41579-021-00573-0
5. Cao Y, Wang J, Jian F, Xiao T, Song W, Yisimayi A, et al. Omicron escapes the majority of existing SARS-CoV-2 neutralizing antibodies. Nature (2022) 602(7898):657–63. doi: 10.1038/s41586-021-04385-3
6. Dearlove B, Lewitus E, Bai H, Li Y, Reeves DB, Joyce MG, et al. A SARS-CoV-2 vaccine candidate would likely match all currently circulating variants. Proc Natl Acad Sci U S A. (2020) 117(38):23652–62. doi: 10.1073/pnas.2008281117
7. Drummond AJ, Ho SYW, Phillips MJ, Rambaut A. Relaxed phylogenetics and dating with confidence. PloS Biol (2006) 4(5):e88. doi: 10.1371/journal.pbio.0040088
8. Suchard MA, Lemey P, Baele G, Ayres DL, Drummond AJ, Rambaut A. Bayesian Phylogenetic and phylodynamic data integration using BEAST 1.10. Virus Evol (2018) 4(1):vey016. doi: 10.1093/ve/vey016
9. Hill V, Du Plessis L, Peacock TP, Aggarwal D, Colquhoun R, Carabelli AM, et al. The origins and molecular evolution of SARS-CoV-2 lineage B.1.1.7 in the UK. Virus Evol (2022) 8(2):veac080. doi: 10.1093/ve/veac080
10. Smith DJ, Lapedes AS, Jong JC de, Bestebroer TM, Rimmelzwaan GF, Osterhaus ADME, et al. Mapping the antigenic and genetic evolution of influenza virus. Science (2004) 305(5682):371–6. doi: 10.1126/science.1097211
11. Wolf YI, Viboud C, Holmes EC, Koonin EV, Lipman DJ. Long intervals of stasis punctuated by bursts of positive selection in the seasonal evolution of influenza A virus. Biol Direct. (2006) 1(1):34. doi: 10.1186/1745-6150-1-34
12. Petrova VN, Russell CA. The evolution of seasonal influenza viruses. Nat Rev Microbiol (2018) 16(1):47–60. doi: 10.1038/nrmicro.2017.118
13. Zuckerkandl E, Pauling L. Evolutionary divergence and convergence in proteins. In: Bryson V, Vogel HJ, editors. Evolving genes and proteins. New York, NY: Academic Press (1965). p. 97–166.
14. Duffy S, Shackelton LA, Holmes EC. Rates of evolutionary change in viruses: Patterns and determinants. Nat Rev Genet (2008) 9(4):267–76. doi: 10.1038/nrg2323
15. Eldredge N, Gould SJ. Punctuated equilibria: An alternative to phyletic gradualism. In: Schopf TJM, editor. Models in paleobiology. San Francisco, CA: Freeman, Cooper (1972). p. 82–115.
16. Pagel M, Venditti C, Meade A. Large Punctuational contribution of speciation to evolutionary divergence at the molecular level. Science (2006) 314(5796):119–21. doi: 10.1126/science.1129647
17. Zwart MP, Elena SF. Matters of size: Genetic bottlenecks in virus infection and their potential impact on evolution. Annu Rev Virol (2015) 2(1):161–79. doi: 10.1146/annurev-virology-100114-055135
18. Lythgoe KA, Hall M, Ferretti L, Cesare M, MacIntyre-Cockett G, Trebes A, et al. SARS-CoV-2 within-host diversity and transmission. Science (2021) 372(6539):eabg0821. doi: 10.1126/science.abg0821
19. Mayr E. Change of genetic environment and evolution. In: Huxley J, Hardy AC, Ford EB, editors. Evolution as a process. London, U.K: Allan & Unwin (1954). p. 157–80.
20. Katoh K, Standley DM. MAFFT multiple sequence alignment software version 7: Improvements in performance and usability. Mol Biol Evol (2013) 30(4):772–80. doi: 10.1093/molbev/mst010
21. Shu Y, McCauley J. GISAID: Global initiative on sharing all influenza data – from vision to reality. Eurosurveillance (2017) 22(13):30494. doi: 10.2807/1560-7917.ES.2017.22.13.30494
22. R Core Team. R: A language and environment for statistical computing. Vienna, Austria: R Foundation for Statistical Computing (2020).
23. De Maio N, Walker C, Borges R, Weilguny L, Slodkowicz G, Goldman N. Issues with SARS-CoV-2 sequencing data. Virological (2020). https://virological.org/t/issues-with-sars-cov-2-sequencing-data/473. (5 May 2020)
24. Fu L, Niu B, Zhu Z, Wu S, Li W. CD-HIT: Accelerated for clustering the next-generation sequencing data. Bioinformatics (2012) 28(23):3150–2. doi: 10.1093/bioinformatics/bts565
25. Nguyen LT, Schmidt HA, von Haeseler A, Minh BQ. IQ-TREE: A fast and effective stochastic algorithm for estimating maximum-likelihood phylogenies. Mol Biol Evol (2015) 32(1):268–74. doi: 10.1093/molbev/msu300
26. Paradis E, Schliep K. ape 5.0: An environment for modern phylogenetics and evolutionary analyses in R. Bioinformatics (2019) 35(3):526–8. doi: 10.1093/bioinformatics/bty633
27. Grolemund G, Wickham H. Dates and times made easy with lubridate. J Stat Software (2011) 40(1):1–25. doi: 10.1093/bioinformatics/bty633
28. Revell LJ. phytools: An R package for phylogenetic comparative biology (and other things). Methods Ecol Evol (2012) 3(2):217–23. doi: 10.1111/j.2041-210X.2011.00169.x
29. Wickham H. stringr: Simple, consistent wrappers for common string operations. (2019), R package.
30. Vaidyanathan R, Xie Y, Allaire JJ, Chang J, Russell K. htmlwidgets: HTML widgets for R. (2019), R package. https://CRAN.R-project.org/package=htmlwidgets
31. Sievert C. Interactive web-based data visualization with r, plotly, and shiny. New York, NY: Chapman and Hall/CRC (2020).
32. Rambaut A, Lam TT, Max Carvalho L, Pybus OG. Exploring the temporal structure of heterochronous sequences using TempEst (formerly path-O-Gen). Virus Evol (2016) 2(1:vew007. doi: 10.1093/ve/vew007
33. Webster AJ, Payne RJH, Pagel M. Molecular phylogenies link rates of evolution and speciation. Science (2003) 301(5632):478–8. doi: 10.1126/science.1083202
34. Schwarz G. Estimating the dimension of a model. Ann Stat (1978) 6(2):461–4. doi: 10.1214/aos/1176344136
35. Raftery AE. Bayesian Model selection in social research. Sociol Methodol (1995) 25:111–63. doi: 10.2307/271063
36. Fox J, Weisberg S. An R companion to applied regression. 3rd ed. Thousand Oaks, CA: SAGE Publications (2019). p. 608.
37. Pinheiro J, Bates D, DebRoy S, Sarkar D., R Core Team. nlme: Linear and nonlinear mixed effects models. (2019), R package.
38. Drummond AJ, Pybus OG, Rambaut A, Forsberg R, Rodrigo AG. Measurably evolving populations. Trends Ecol Evol (2003) 18(9):481–8. doi: 10.1016/S0169-5347(03)00216-7
39. Pagel M. Inferring the historical patterns of biological evolution. Nature (1999) 401(6756):877–84. doi: 10.1038/44766
40. Freckleton RP. The seven deadly sins of comparative analysis. J Evol Biol (2009) 22(7):1367–75. doi: 10.1111/j.1420-9101.2009.01757.x
41. Venditti C, Meade A, Pagel M. Detecting the node-density artifact in phylogeny reconstruction. Syst Biol (2006) 55(4):637–43. doi: 10.1080/10635150600865567
42. Wang LG, Lam TTY, Xu S, Dai Z, Zhou L, Feng T, et al. Treeio: An R package for phylogenetic tree input and output with richly annotated and associated data. Mol Biol Evol (2020) 37(2):599–603. doi: 10.1093/molbev/msz240
43. Our World in Data. Coronavirus (COVID-19) vaccinations. (2021). https://ourworldindata.org/covid-vaccinations. (6 July 2021)
44. Boni MF, Lemey P, Jiang X, Lam TTY, Perry BW, Castoe TA, et al. Evolutionary origins of the SARS-CoV-2 sarbecovirus lineage responsible for the COVID-19 pandemic. Nat Microbiol (2020) 5(11):1408–17. doi: 10.1038/s41564-020-0771-4
45. Trifinopoulos J, Nguyen LT, von Haeseler A, Minh BQ. W-IQ-TREE: A fast online phylogenetic tool for maximum likelihood analysis. Nucleic Acids Res (2016) 44(W1):W232–5. doi: 10.1093/nar/gkw256
46. Zeileis A, Grothendieck G. zoo: S3 infrastructure for regular and irregular time series. J Stat Software (2005) 14(1):1–27. doi: 10.18637/jss.v014.i06
47. Venables WN, Ripley BD. Modern applied statistics with S (2002). New York: Springer-Verlag (Accessed 2021 Jul 5).
48. Leys C, Klein O, Dominicy Y, Ley C. Detecting multivariate outliers: Use a robust variant of the mahalanobis distance. J Exp Soc Psychol (2018) 74:150–6. doi: 10.1016/j.jesp.2017.09.011
49. Hon CC, Lam TY, Shi ZL, Drummond AJ, Yip CW, Zeng F, et al. Evidence of the recombinant origin of a bat severe acute respiratory syndrome (SARS)-like coronavirus and its implications on the direct ancestor of SARS coronavirus. J Virol (2008) 82(4):1819–26. doi: 10.1128/JVI.01926-07
50. Katoh K, Rozewicki J, Yamada KD. MAFFT online service: Multiple sequence alignment, interactive sequence choice and visualization. Brief Bioinform (2019) 20(4):1160–6. doi: 10.1093/bib/bbx108
51. Vittinghoff E, Glidden DV, Shiboski SC, McCulloch CE. Regression methods in biostatistics: Linear, logistic, survival, and repeated measures models. 2nd ed. New York: Springer-Verlag (2012). p. 512.
52. Pennell MW, Harmon LJ, Uyeda JC. Is there room for punctuated equilibrium in macroevolution? Trends Ecol Evol (2014) 29(1):23–32. doi: 10.1016/j.tree.2013.07.004
53. van Dorp L, Richard D, Tan CCS, Shaw LP, Acman M, Balloux F. No evidence for increased transmissibility from recurrent mutations in SARS-CoV-2. Nat Commun (2020) 11(1):5986. doi: 10.18637/jss.v014.i06
54. MacLean OA, Lytras S, Weaver S, Singer JB, Boni MF, Lemey P, et al. Natural selection in the evolution of SARS-CoV-2 in bats created a generalist virus and highly capable human pathogen. PloS Biol (2021) 19(3):e3001115. doi: 10.1371/journal.pbio.3001115
55. Banerjee A, Baker ML, Kulcsar K, Misra V, Plowright R, Mossman K. Novel insights into immune systems of bats. Front Immunol (2020) 2411:26. doi: 10.3389/fimmu.2020.00026
56. Irving AT, Ahn M, Goh G, Anderson DE, Wang LF. Lessons from the host defences of bats, a unique viral reservoir. Nature (2021) 589(7842):363–70. doi: 10.1038/s41586-020-03128-0
57. Tang X, Li G, Vasilakis N, Zhang Y, Shi Z, Zhong Y, et al. Differential stepwise evolution of SARS coronavirus functional proteins in different host species. BMC Evol Biol (2009) 9(1):52. doi: 10.1186/1471-2148-9-52
58. Nichol ST, Rowe JE, Fitch WM. Punctuated equilibrium and positive Darwinian evolution in vesicular stomatitis virus. Proc Natl Acad Sci (1993) 90(22):10424–8. doi: 10.1073/pnas.90.22.10424
59. Kerr PJ, Eden JS, Di Giallonardo F, Peacock D, Liu J, Strive T, et al. Punctuated evolution of myxoma virus: Rapid and disjunct evolution of a recent viral lineage in Australia. J Virol (2019) 93(8):e01994–18. doi: 10.1128/JVI.01994-18
60. Simpson GG. Tempo and mode in evolution. New York, NY: Hafner Publishing Company (1944). p. 237.
61. Tay JH, Porter AF, Wirth W, Duchene S. The emergence of SARS-CoV-2 variants of concern is driven by acceleration of the substitution rate. Mol Biol Evol (2022) 39(2):msac013. doi: 10.1093/molbev/msac013
62. Lythgoe KA, Golubchik T, Hall M, House T, MacIntyre-Cockett G, Fryer H, et al. Lineage replacement and evolution captured by the united kingdom covid infection survey. medRxiv (2022). doi: 10.1101/2022.01.05.21268323v1. 2022.01.05.21268323.
Keywords: SARS-CoV-2, sarbecovirus, SARS-CoV-1, punctuated evolution, molecular evolution
Citation: Surya K, Gardner JD and Organ CL (2023) Detecting punctuated evolution in SARS-CoV-2 over the first year of the pandemic. Front. Virol. 3:1066147. doi: 10.3389/fviro.2023.1066147
Received: 10 October 2022; Accepted: 07 February 2023;
Published: 23 February 2023.
Edited by:
Chris Illingworth, University of Cambridge, United KingdomReviewed by:
Ville N. Pimenoff, Karolinska Institutet (KI), SwedenAndreu Comas-Garcia, Autonomous University of San Luis Potosí, Mexico
Sebastian Duchene, The University of Melbourne, Australia
Copyright © 2023 Surya, Gardner and Organ. This is an open-access article distributed under the terms of the Creative Commons Attribution License (CC BY). The use, distribution or reproduction in other forums is permitted, provided the original author(s) and the copyright owner(s) are credited and that the original publication in this journal is cited, in accordance with accepted academic practice. No use, distribution or reproduction is permitted which does not comply with these terms.
*Correspondence: Kevin Surya, a2V2aW5zdXJ5YUBtb250YW5hLmVkdQ==; Chris L. Organ, Yy5sLm9yZ2FuQHJlYWRpbmcuYWMudWs=