 Michael A. Zeller
 Zebulun W. Arendsee
 Gavin J.D. Smith
 Tavis K. Anderson
- 1Programme in Emerging Infectious Diseases, Duke - National University of Singapore Medical School, Singapore, Singapore
- 2Iowa State University Veterinary Diagnostic Laboratory, Iowa State University, Ames, IA, United States
- 3Virus and Prion Research Unit, National Animal Disease Center, USDA-ARS, Ames, IA, United States
- 4Centre for Outbreak Preparedness, Duke - National University of Singapore Medical School, Singapore, Singapore
Introduction: Sequencing and phylogenetic classification have become a common task in human and animal diagnostic laboratories. It is routine to sequence pathogens to identify genetic variations of diagnostic significance and to use these data in realtime genomic contact tracing and surveillance. Under this paradigm, unprecedented volumes of data are generated that require rapid analysis to provide meaningful inference.
Methods: We present a machine learning logistic regression pipeline that can assign classifications to genetic sequence data. The pipeline implements an intuitive and customizable approach to developing a trained prediction model that runs in linear time complexity, generating accurate output rapidly, even with incomplete data. Our approach was benchmarked against porcine respiratory and reproductive syndrome virus (PRRSv) and swine H1 influenza A virus (IAV) datasets. Trained classifiers were tested against sequences and simulated datasets that artificially degraded sequence quality at 0, 10, 20, 30, and 40%.
Results: When applied to a poor-quality sequence data, the classifier achieved between >85% to 95% accuracy for the PRRSv and the swine H1 IAV HA dataset and this increased to near perfect accuracy when using the full dataset. The model also identifies amino acid positions used to determine genetic clade identity through a feature selection ranking within the model. These positions can be mapped onto a maximum-likelihood phylogenetic tree, allowing for the inference of clade defining mutations.
Discussion: Our approach is implemented as a python package with code available at https://github.com/flu-crew/classLog.
1 Introduction
Classification of pathogens has become a routine task in modern veterinary diagnostics (1). Classification of the infectious agent is a critical diagnostic step that allows for an informed decision on vaccination regimens and biosecurity measures that may be considered to clear a pathogen outbreak (2–4). Currently genetic classification is performed using phylogenetic methods such as maximum-likelihood and neighbor joining (2, 5, 6). These methods are effective at classifying sequences and inferring relationships between taxa, but the time and skill required to execute and interpret analyses may impact their application in routine high-throughput activities. While diagnosticians are interested in the transmission and history of disease, the most pressing need is to provide a classification of data. Consequently, methods that do not conduct computationally intensive phylogenetic inference for inferring ancestry and genomic epidemiology are required.
Phylogenetic placement (PP) methods are one solution to the problem of accurately assigning lineage designations to taxa. PP places a given taxa onto a reference tree without recomputing the topology and lineage designations are subsequently inferred based on the proximity to annotated taxa in the tree. PP methods are advantageous in that they can interpolate lineage within a broad context (between species) and narrow context (specific clades within a subtype). Multiple phylogenetic placement software are available such as the pplacer suite (7), RAPPAS (8), EPA-ng (9), and Nextclade (10). While PP methods are invaluable for research, there is still room for other methodologies to provide fast and accurate lineage assignments without the requirement for a robust reference tree topology.
Machine learning has been recognized as a viable method for classifying sequences (4, 11). Differing from PP methods, machine learning approaches do not need a reference tree for classification. Genetic divergence over time leads to distinguishable genetic patterns within monophyletic clades that are linearly separable across aligned amino acid positions. This linear separability lends itself well to supervised machine learning methods such as logistic regression and random forest classification. Logistic regression based on aligned sequences is used as the primary means of automated classification for influenza A viruses (IAV) in swine that are processed within the FLUture database (12). Similarly, porcine reproductive and respiratory syndrome virus (PRRSV) amino acid sequence data have been classified to genetic lineage using random forest, k-nearest neighbor, support vector machines, and multilayer perceptron methods (4). Decision tree machine learning approaches have been introduced to classify avian IAV sequences and SARS-CoV-2 sequences successfully at multiple taxonomical levels (13, 14). PangoLEARN, a random forest model, currently supplements the pangolin classification system for SARS-CoV-2 (11). However, despite machine learning appearing to be an effective approach for classification, few of these algorithms are user-friendly with intuitive generalized software that has been publicly released.
This manuscript introduces a general-purpose software application, classLog, that can train sequence classifiers based on user-labelled training data for use in classification of unknown sequences. The method used by the program leverages logistic regression, a parametric method of classification that runs in linear time complexity. Application of classLog provides a routine and robust way to integrate classification into pipelines where speed is necessary and there is no interest in inferring historical context of the sequences. Through decoupling the classification step from the inference of the history of the virus, this manuscript presents a method of classification that is rapid, accurate, and suitable for high-throughput pipelines.
2 Methods
2.1 Curation of swine H1 IAV and PRRSv North America datasets
We compiled two datasets to test the utility of our classification pipeline: porcine reproductive and respiratory syndrome virus (PRRSV) and influenza A virus (IAV) in swine. We restricted the swine IAV to H1 subtype hemagglutinin (HA) genes from the United States collected between 2015 to 2021: these data were curated and annotated by genetic clade by the Influenza Research Database (2, 15). These lineages were delineated based on a rule system applied to a maximum-likelihood phylogeny. Briefly, lineages were designated as statistically supported phylogenetic clusters when they contained more than 10 taxa, had statistical support > 70%, and the average pairwise distance between and within clades was >7% and< 7% respectively. Sequences sampled between 2015-2019 were used as a training set (n=3510), while 2020 and later sequences were extracted as a test set (n=163) (Figure 1B). For PRRSV sequences, we extracted the curated ORF5 gene sequence data provided by (3), and extracted and assigned the genetic clade for each sequence from the GenBank accession’s feature information. The genetic lineage delineations for PRRSV were also based on a maximum-likelihood phylogeny, with monophyletic lineages identified as those with strong statistical support and were designated using ClusterPicker (16). The dataset was further refined by removing all “Type 1” European sequences, sequences that were not the full coding region, i.e., not equal to 603 or 606 nucleotides in length, and the remaining sequences were translated. The final dataset of 3047 annotated sequences were randomly split into training and test sets, using 80% (n=2,483) and 20% (n=609) of the sequences respectively (Figure 1A).
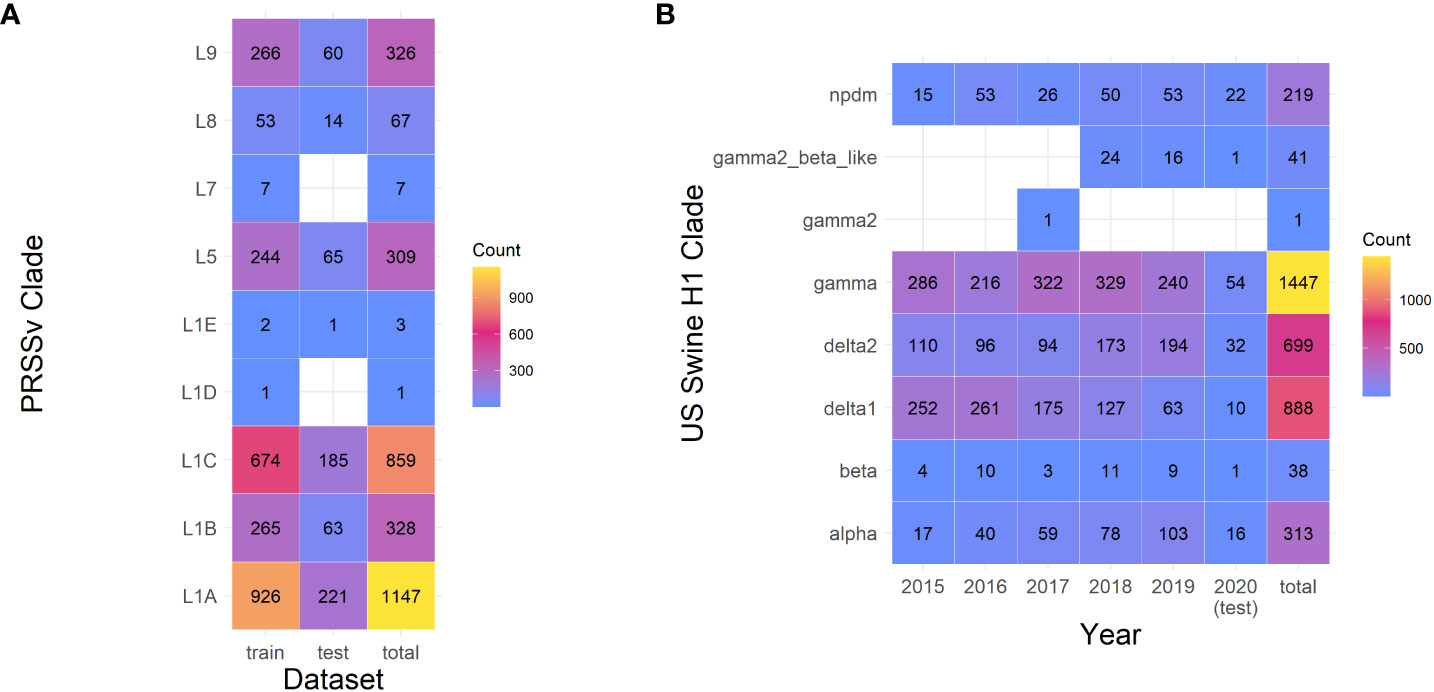
Figure 1 Number of samples in training and test sets for Porcine Respiratory and Reproductive Syndrome virus (PRRSv) and Swine H1 Influenza A virus (IAV). (A) In the PRRSv dataset, number of samples were divided in a training set (80%) and a test set (20%). (B) Samples in the IAV dataset per year. Samples collected in 2015-2019 were used as the training set, samples collected in 2020 were taken as the test set.
The datasets were split differently to simulate two distinct uses of the classifier. IAV data was split temporally to simulate classifying new data, while PRRSV sequences were split randomly to simulate filling in classifications from a mixed set.
2.2 Simulated Sequencing Errors and Removing Informative Features
Gene sequences retrieved from Sanger sequencing, next generation, and third generation sequencing methods are not always complete, and there may be ambiguities and gaps in the data (17–19). These errors impact the estimation of the multiple sequence alignment that may subsequently decrease the accuracy of classification (20, 21). To mimic decreasing quality of sequences, a python script was created to randomly generate a number of indices for replacement with an ambiguous ‘X’. Subsequently, the X’s were removed from the sequence to generate incomplete, unaligned sequences. Test set sequences were degraded at 0%, 10%, 20%, 30%, and 40% prior to classification. While more robust simulations of sequence degradation exist (22), the replication and implication of these methods is beyond the scope of this manuscript.
2.3 Constructing classLog: the general sequence classifier
Sequence classification was implemented as a one-versus-rest logistic regression classifier, with a general outline provided (Supplemental Figure 1). Input for classification requires an aligned nucleotide or amino acid FASTA file, with definition lines specifying the classification classes using character delimiters, e.g., A/swine/Iowa/A02636475/2022|1B.2.2.1, where ‘|’ delimits the phylogenetic clade from the strain name. The binary features of this model are the presence or absence of an amino acid at a specific position within the alignment. An optional feature selection process, which selects the most relevant sequence positions for classification, was implemented using a tree classifier that ranks binary features by GINI importance so that the user may restrict the prediction model to the most important features (23). To facilitate the reusability of the classification scheme, the first sequence, feature labels, trained model, and class names are exported using a standard python pickle file format. The first sequence in the pickle file is used for pairwise alignment of unknown sequences to ensure there is consistency between query sequence alignment positions and the model feature positions. During prediction, a matrix of the presence or absence of nucleotides or amino acids at specific alignment positions is created, which is then fed to the model for prediction. For user submitted query sequences, the predicted classification is assigned and reported using classification names derived from the user-annotated classification fasta file used in training.
A prediction threshold option was included within the classifier to provide support for predicted classes on unknown data. Classifications with a score less than the threshold are rejected, and classified into an ‘unknown’ category (default value of 85%). The threshold criteria can have a direct effect on the performance of classification.
For validation, the general classifier was trained using 100%, 20%, 10%, 5%, 1%, and 0.5% of the available features within the H1 IAV and the PRRSv training datasets. For the H1 IAV sequence dataset, this resulted in 2439, 487, 243, 121, 24, and 12 features respectively. For the PRRSV dataset, this resulted in 686, 137, 68, 34, 6, and 3 features. Each classifier was used classify the 0%, 10%, 20%, 30%, and 40% test set sequences that had been generated to reflect sequencing errors and misalignment.
2.4 Simplifying feature identification in query sequences using a Needleman-Wunsch pairwise alignment algorithm
An intrinsic challenge to the implementation of the machine learning classification process was correctly assigning the positions to new genetic sequences. To overcome this challenge without keeping the original alignment, a heuristic was applied such that the first sequence from the training set was saved and stored, and subsequent classification attempts would be pairwise aligned to recover the positions. To increase the speed and keep calculations within a tractable time for computation, a Needleman-Wunsch dynamic programming alignment algorithm (24) with affine gap penalties and a BLOSUM90 substitution matrix (25) was implemented in C++ and exported as a python library using python bindings.
2.5 Measuring the performance of the classifier on swine H1 IAV and PRRSv North America dataset classification
The performance of the classifiers was measured under the metrics of accuracy, macro precision, macro recall, and macro F1 (26–28). From a confusion matrix M where true classification is assigned along the y-axis and the predicted class is assigned along the x-axis, the precision and recall equations can be generalized as follows:
These metrics were taken for each classifier applied to the 0%, 10%, 20%, 30%, and 40% test set sequences with the results plotted using ggplot2 (29) in R v3.959 (30).
Runtime performance was benchmarked using the Linux `usr/bin/time` program provided from Ubuntu v20.04LTS running within the Windows Subsystem Linux v2 (Supplemental Table 1). A second non-comparable benchmark approach that used existing phylogenetic placement approaches was run using pplacer and RAPPAS with the same test sets described above (Supplemental Table 2). The reference trees provided to the phylogenetic placement programs were paraphyletically pruned to 200 taxa using smot v1.0.0 (31) to more realistically simulate a phylogenetic placement scenario. Accuracy from either PP method was not tested as sufficient validation has been given in the originating and subsequent publication (7, 8).
2.6 Visualization of swine H1 IAV and PRRSv North America dataset using ordination and phylogenetic analysis
Sequences from both datasets were aligned using MAFFT v7.487 (32). The pairwise number of differences between each sequence were extracted from the alignment using Geneious Prime 2022 (33). These distances were ordinated into two-dimensional space using metric multidimensional scaling. Each ordination was colored first by the designated genetic clade, and then by a genetic motif consisting of the amino acids of the top two ranking amino acid positions. Amino acid position rank was calculated as the sum of GINI importance given by the extra tree classifier for each amino acid position, i.e., the two most important amino acids in determining the classification of the query sequence.
To identify the biological basis of the H1 swine IAV and PRRSv classifications, maximum likelihood trees were inferred for each dataset. Sequences were aligned using MAFFT v7.487 (32), and trees were inferred using IQ-TREE v1.6.12 (34). The PRRSv dataset was analyzed using a BLOSUM62 amino acid substitution model, while the IAV dataset was analyzed using the FLU amino acid substitution model (35). Statistical support was determined using the rapid bootstrap algorithm with 1,000 bootstraps, and the support was displayed on the branch of the resultant trees. Each tree was colored along the backbone by the phylogenetic clade, while the tips were annotated and colored by the top two ranking amino acid positions determined using GINI importance.
3 Results
3.1 classLog performance on H1 swine IAV and PRRSv observed and simulated data
A classLog classifier was trained on PRRSv ORF5 sequences collected and classified to lineage (3), dividing the dataset into 80% training and 20% testing. The classifier performed perfectly correct when trained with 10% of features (n=68) of the total features with no sequence degradation (Figure 2A). At 10% sequence degradation (20aa), 10% of the features were able to achieve an accuracy of 97%. At 20% sequence degradation (40aa), 10% of the features were sufficient to achieve 88% accuracy, though increasing the number of features did not improve accuracy. Accuracy rapidly decreased at 30% sequence degradation (60aa), with 10% of the features achieving 69% correct classifications. At 40% sequence degradation (80aa) the greatest accuracy achieved was 42%.
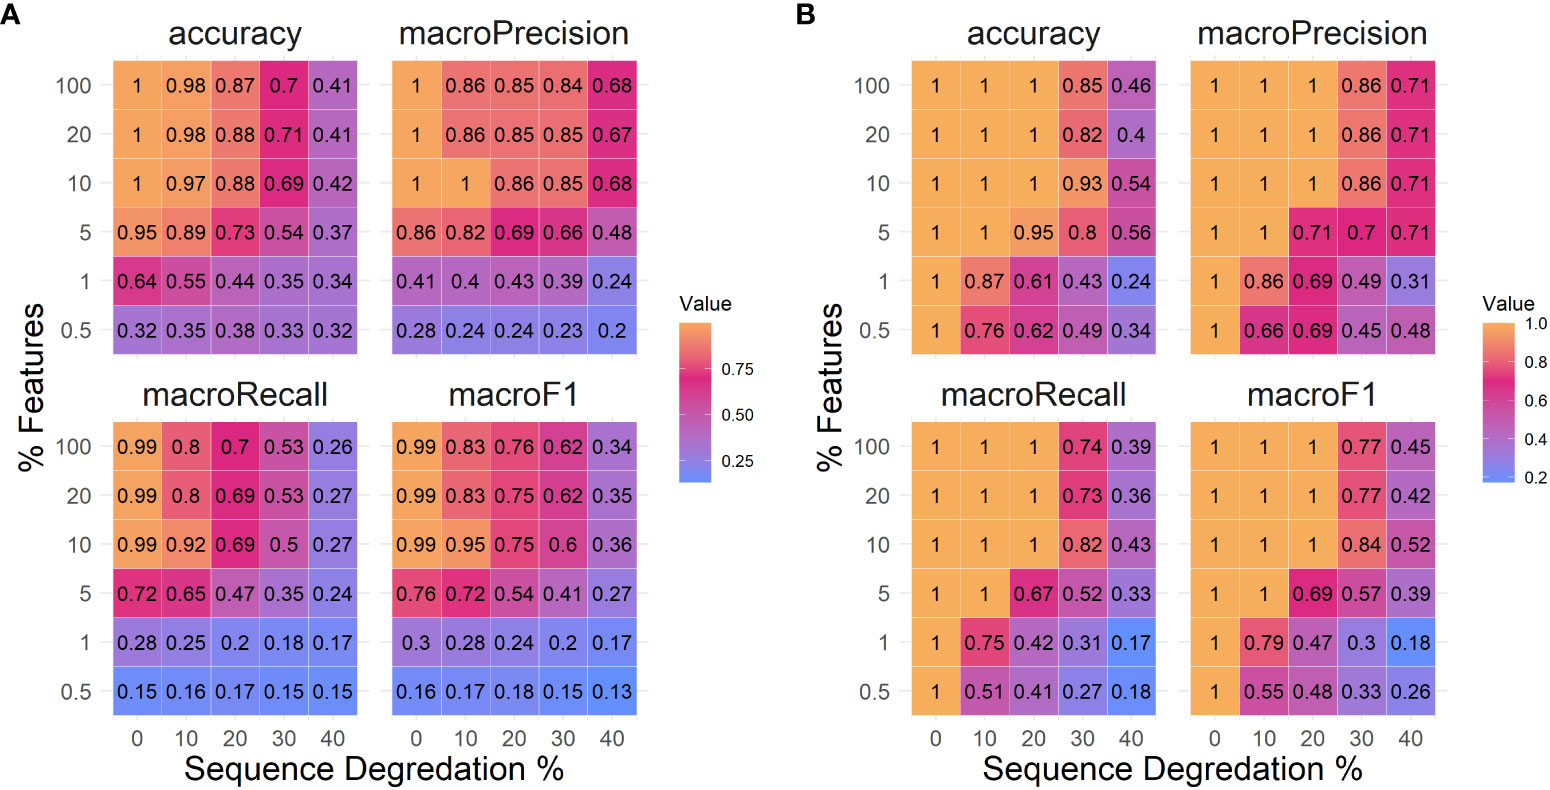
Figure 2 Measures of logistic regression classifier performance in the metrics of accuracy, precision, recall, and F1 scoring. (A) Porcine Respiratory and Reproductive Syndrome virus and (B) Swine H1 Influenza A virus datasets. Each metric was measured over simulated sequence degradation of 0%, 10%, 20%, 30% and 40%, as well as with classifiers using 0.5%, 1%, 5%, 10%, 20%, and 100% of the available features for classification.
A classLog classifier was trained on H1 swine sequences present in IRD collected between 2015 to 2019 and was tested on 136 test sequences from 2020. The classifier performed perfectly correct when trained with as few as 12 features (0.5%) when there was no sequence degradation (Figure 2B). At 10% sequence degradation (56 aa), 5% of the features (121 features) were needed to achieve perfect accuracy. At 20% sequence degradation (112 aa), 10% of the features (243 features) were sufficient to achieve perfect accuracy. At 30% sequence degradation (170aa), 10% of the features were sufficient to achieve 93% correct classifications, although 20% of features (487 features) only achieved 82% correct classification. At 40% sequence degradation (227aa), there was a steep decline in the accuracy, falling below 60% across the board.
For both datasets, precision was consistently higher than recall (Figure 2). This is a consequence of rejecting classifications below the 85% scoring threshold and classifying them as ‘unknown,’ i.e., the number of false positives decreased while increasing false negatives.
3.2 Using classLog to identify genetic features of biological relevance
The pairwise differences between the test set sequences were used to ordinate points in two-dimensional space (Figure 3). The ordination of both the PRRSv ORF5 and swine H1 IAV datasets were colored by their original designated clades, and by the motif formed by the amino acids present at the top two features ranked by GINI importance (Supplemental Figures 2, 3). This manuscript uses the top two features as the number of amino acid combinations above two exceeds the number of distinct colors available on the pallet; but lower ranked features are important to discriminate between phylogenetic clades. Qualitatively, the ordination demonstrated separation between distant genetic lineages such as the H1 1A classical swine lineage versus the H1 1B human seasonal lineage (Figure 2C; 2). However, sequences within some closely related genetic clades within the same lineage appeared to have overlap when assessed in a two-dimensional ordination. Within the PRRSv data (Figure 2B), the top two ranked amino acid positions (170, 172) corresponded well with the classified genetic clades suggesting that these positions may be clade defining mutations. For example, L1A has primarily the EE motif, L1B has EN, and L1C has DG. These divisions were not exclusive as L5, L8, L9 also have the EE motif that was exclusively within the L1A, and more features may need to be accounted for to discriminate between these clades. The top two positions of the swine H1 IAV dataset were 159 and 158 (H1 numbering, 17AA signal peptide removed) (Figure 2D), with a relatively high number of amino acid polymorphisms between those two positions. While some clades were well matched to one or two motifs, some clades such as the 1A alpha were highly varied in the motifs they carried, suggesting that other features position with a lower rank may better segregate this clade from the other clades. These data can be generated by extracting the features and their rankings using the classLog algorithm.
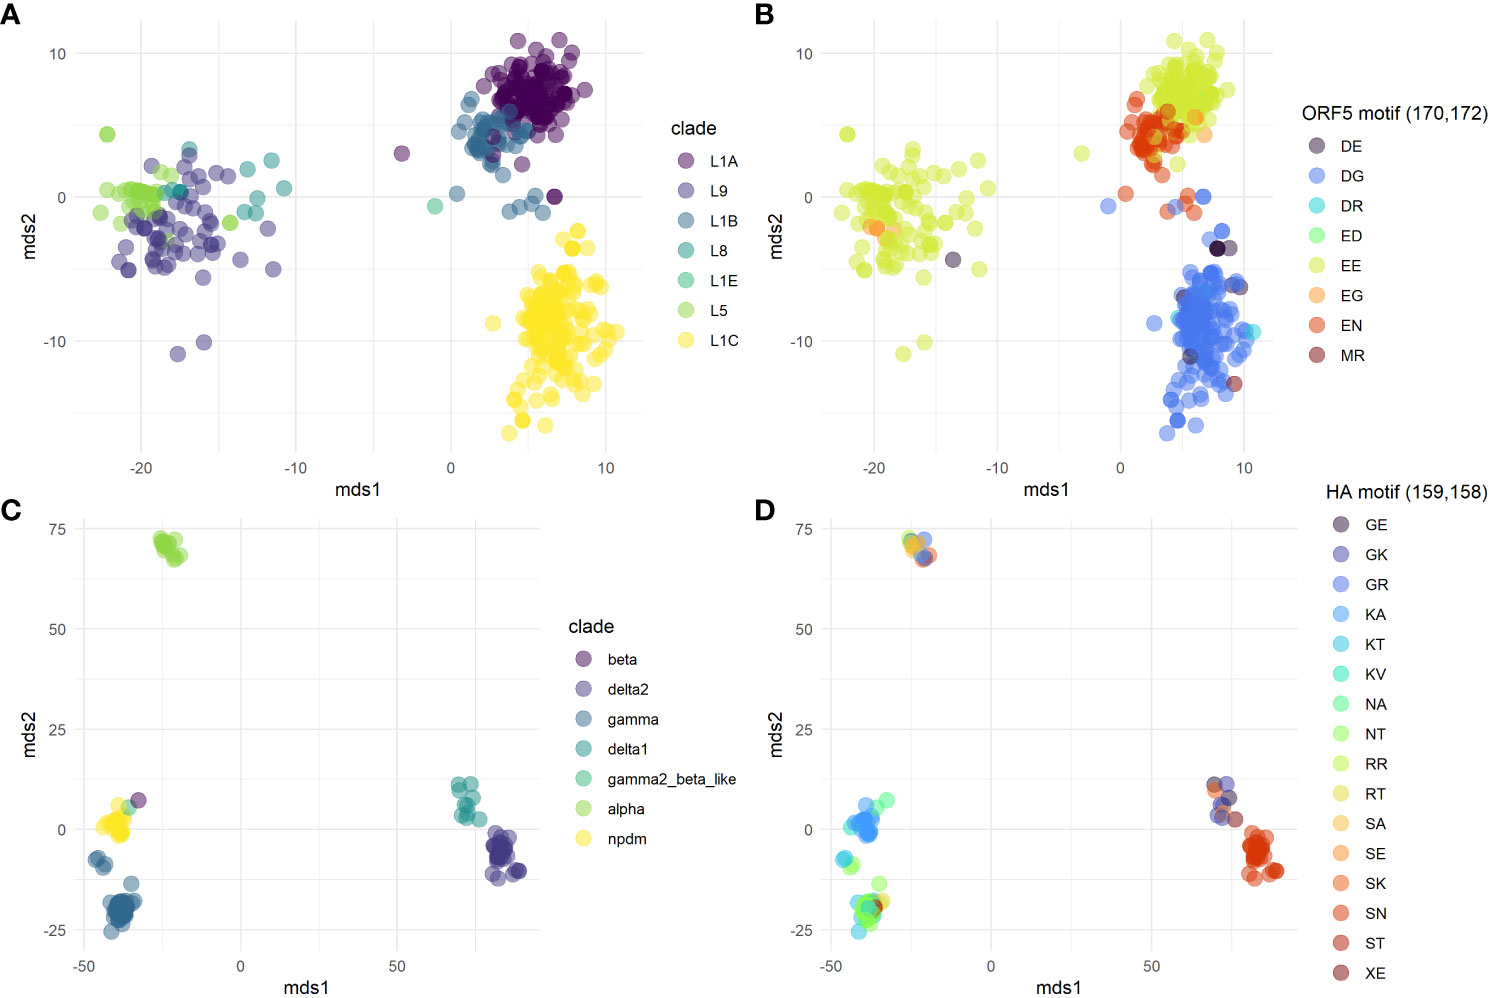
Figure 3 Metric multidimensional scaling in two dimensions of the number of pairwise differences between sequences of Porcine Respiratory and Reproductive Syndrome virus (PRRSv) ORF5 protein (A, B) and Swine H1 Influenza A virus datasets (IAV) (C, D). Plots were colored by genetic clade (A, C), and by the motif formed by the top two important positions inferred by decision tree (B, D). For PRRSv the top ranking features were positions 170 and 172. For IAV, the top ranking features were positions 159 and 158.
3.3 Congruency between phylogenetic classification, classLog predictions, and model features
Maximum-likelihood trees were inferred for the PRRSv ORF5 and swine H1 IAV HA test datasets. The backbones of the phylogenetic trees were colored by the assigned genetic lineage, while the tips were labeled and colored by the motif formed by the two amino acid positions that had the highest cumulative GINI importance. For the PRRSv ORF5 dataset (Figure 4A: positions 170 and 172), the majority of L1B motifs were represented by an EN and L1C by DG. L1A, L5, L8, and L9 were also represented by EE at 170 and 172, suggesting that despite good concordance between the inferred phylogeny and the classLog predicted clade, this was being driven by features outside of these two positions.
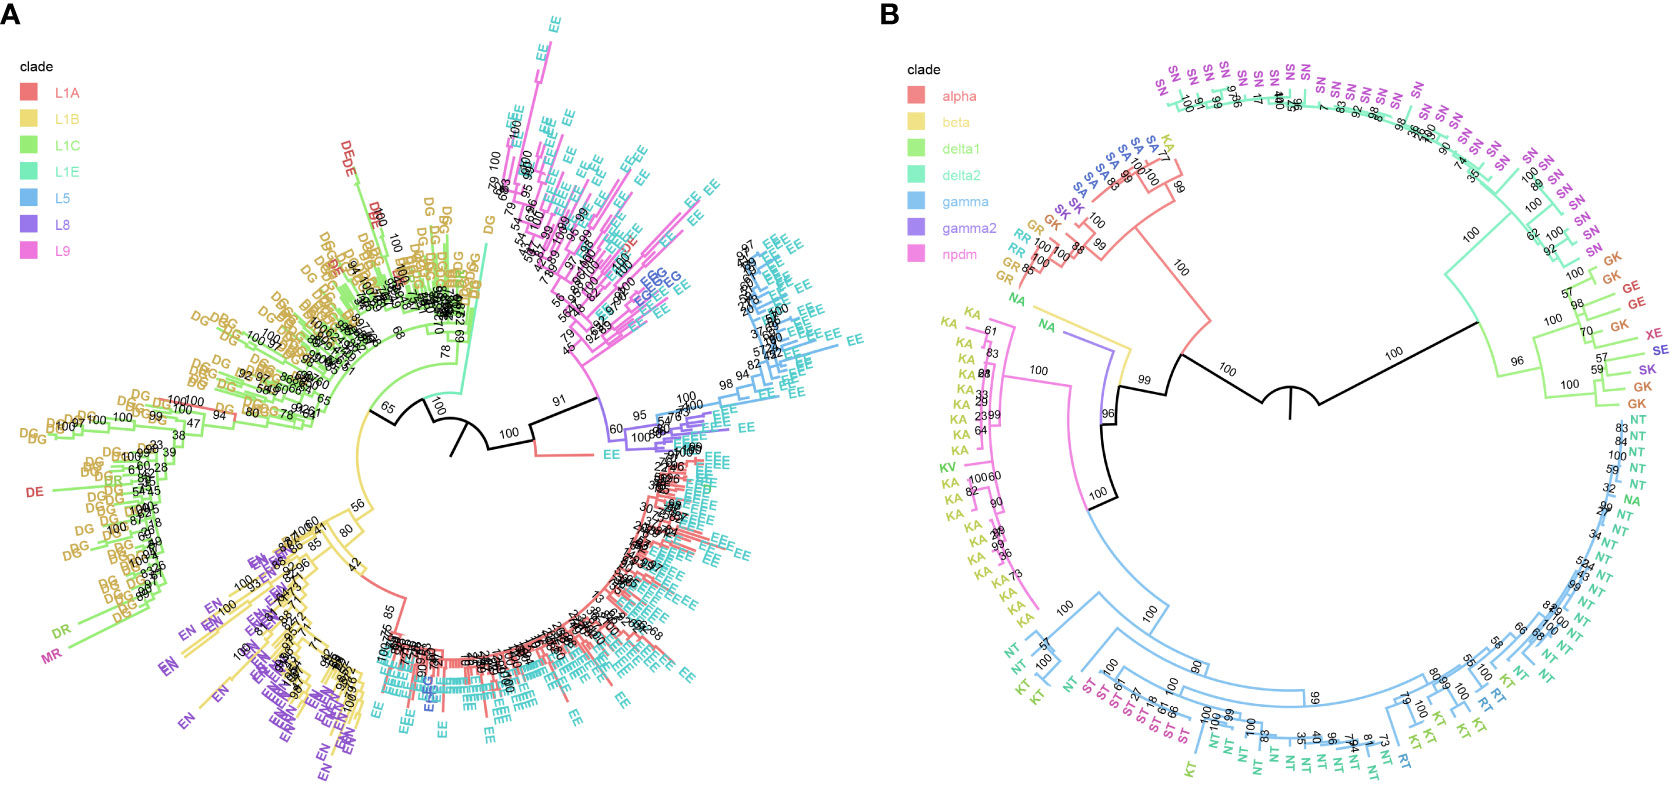
Figure 4 Phylogenetic maximum likelihood trees. (A) Porcine Respiratory and Reproductive Syndrome virus (PRRSv) ORF 5 protein and (B) Swine H1 Influenza A virus (IAV) test sequences, inferred by IQ-TREE v1.6.12 with 1,000 fast bootstraps. Tree backbones are colored by the prior assigned genetic lineage, where tip labels are colored by the motif formed by the top two ranking positions inferred by decision tree, positions 170 and 172 for PRRSv, and positions 159 and 158 for IAV. Bootstrap support is annotated on the branches.
For the swine H1 HA dataset (Figure 4B), the two most important features identified by classLog were positions 159 and 158. The majority of the 1B delta1a clade was primarily represented by GK, the 1B delta2 by SN, and 1A pandemic09 by KA. Three distinct motifs were identified within the 1A gamma clade, KT, NT, and ST, with RT interspersed. The 158T at was distinct enough to serve as a general rule to separate diversity within the 1A gamma clade. The remaining major H1 clade, 1A alpha, was associated with a significant amount of motif diversity, exhibiting GK, GR, KA, SA, SK and RR. The high amount of motif diversity is suggestive that another set of features may be used by the classifier for identifying this clade.
4 Discussion
Applications of machine learning present computationally efficient ways of classifying genetic sequences without relying on traditional phylogenetic methods. The direct utility of machine learning methods is in high-throughput diagnostic processes, where the primary objective is to assign classification and there is not an immediate interest in inferring the evolutionary history of the sequence in question. By decoupling the classification process from phylogenetic method, complexity and computational time are reduced. Machine learning methods have the additional benefit of being highly portable and reproducible with minimal effort once an initial prediction model is trained. Our command line interface, classLog, represents a user-friendly and validated tool that can ingest annotated genetic sequences, train a classification model, and generate predictions and associated confidence scores without extensive computational and machine learning training.
Logistic regression was chosen to ensure scalability with linear time complexity, fast computational runtime, and for simple model interpretability. These factors allow classLog to function as a lightweight component in classification pipelines. Moreover, many genetic lineage classification schemes frequently depend on phylogenetic relationships to delineate lineages, which is effectively a form of clustering by similarity. Consequently, linear separability emerges when significant genetic divergence exists between designated lineages. Although other machine learning methods such as neural networks can learn complex relationships and patterns, within the narrow context of lineage classification, logistic regression is generally sufficient. Taxonomic classification of virus sequence data is typically performed via either phylogenetic methods or through similarity-based approaches such as BLAST. Phylogenetic methods can be computationally complex: simple techniques such as neighbor joining have a cubic time complexity, but more statistically robust techniques have a higher range of complexity and runtime. BLAST overcomes these complexity issues, but there is a necessity for a curated database of sequences, and large databases can be difficult to update and share. In general, machine learning models can overcome both limitations as they offer both reasonable time complexity and space complexity for classification; and if an adequate dataset is used to generalize a model during training, the subsequent model may be reused without maintaining or training input reference datasets. In recognition of these strengths, machine learning approaches are being used (11, 14), but a generalized application has not yet been created.
classLog can be applied for rapid classification of genomic data either on site or in field settings. The advent of rapid and portable sequencing such as minION Nanopore technologies has resulted in the generation of thousands of sequences with a critical need to identify what they are, and whether the sample represents an “unknown.” The classLog program can be easily adopted as part of a light-weight pipeline that can be used to do classification on the fly in the field (36). The execution of classLog does not require significant computational resources, and our testing was conducted on regular Windows and MacOS laptops. Consequently, it can easily be integrated within mobile diagnostic stations that are functional within remote locations that may have minimal access to extensive computational resources or trained personnel (37, 38).
A consequence of field genomic epidemiology and the integration of Nanopore technology has been an increase in sequence error rate relative to traditional Sanger sequencing (39, 40). Our testing with classLog on simulated datasets, where we introduced sequence errors, suggested that the inaccuracies do not dramatically reduce the accuracy of classification using this machine learning method. It was noted that the classification failure within the H1 sequence dataset occurred proportionally to the number of samples present in the training dataset. As the sequence errors increased, misclassifications began to occur first in the sequences that had the least clade representation in the training set. It is likely that if there are more samples present in the training data to represent a specific clade, then the prediction model was better able to generalize the clade. This indicates one potential drawback of classLog, and that user-curated training datasets must remain large enough for optimal classifier performance. classLog performs within the narrow context of classification, assigning clades within a species, although it can quickly segregate unrelated sequences by specifying them as “unknown”. An alternate approach to generating large, curated datasets when attempting to classify multiple species could be the application of phylogenetic placement algorithms or using advanced machine learning models beyond logistic regression. Logistic regression is a parametric model that performs well on linearly separable classifications. In cases where the data are not linearly separable and that have limited training data, non-parametric models like random forest or neural networks may perform significantly better, potentially provide easy to understand biological context to feature rankings (41, 42), but require more computational time and effort.
Benchmarks of classLog runtime demonstrate that the combined training and classification time is fast, with each test case presenting a combined time under a minute (Supplementary Table 1). While the conditions of the test are not directly comparable to the testing of pplacer and RAPPAS, it can be noted that the total runtime of classLog is less than both PP methods when finding a solution to the same classification problem. It is notable that once the RAPPAS database is built, the placement of taxa onto a tree is very rapid, although the memory usage is higher. However, it is important to note that the use-cases of classLog compared to PP methods differs: classLog is designed specifically to assign lineages within a narrow scope of genetic diversity within a single species. Comparatively, both pplacer and RAPPAS can function with multiple species and additionally infer topology. The difference in the use-cases for the tools makes comparison only valid for the subset of problems where the tools overlap.
classLog is a method of creating light weight classifiers that can assign taxonomic classifications rapidly with minimal user curation and training. The implementation of this classification methodology can benefit diagnostic labs by saving computational run time associated with current phylogenetic classification approaches and can be easily customized to work for different pathogens. An additional benefit is the identification of critical genetic features associated with clade classifications: these features are likely clade defining mutations and can be used to form hypotheses to investigate the gene to phenotype link (43–45) and other functional studies. A benefit of machine learning approaches is that the results are also more directly interpretable as they are given as an assignment, rather than needing to be inferred from a tree. The culmination of these benefits offers a more streamlined approach to taxonomic assignment in a diagnostic setting.
Data availability statement
Publicly available datasets were analyzed in this study. This data can be found here: https://github.com/flu-crew/classLog.
Author contributions
MZ conceived the study. MZ, ZA, and TKA programmed the code. MZ, GS and TKA conceptualized the framework for testing. All authors tested the program. MZ and TA wrote the manuscript. All authors contributed to the article and approved the submitted version.
Funding
The author(s) declare financial support was received for the research, authorship, and/or publication of this article. This work was supported in part by: the U.S. Department of Agriculture (USDA) Agricultural Research Service [ARS project number 5030-32000-231-000-D]; the National Institute of Allergy and Infectious Diseases, National Institutes of Health, Department of Health and Human Services [contract numbers 75N93021C00015 and 75N93021C00016]; the USDA Agricultural Research Service Research Participation Program of the Oak Ridge Institute for Science and Education (ORISE) through an interagency agreement between the U.S. Department of Energy (DOE) and USDA Agricultural Research Service [contract number DE-AC05- 06OR23100]; the SCINet project of the USDA Agricultural Research Service [ARS project number 0500-00093-001-00-D]; and the Duke-NUS Signature Research Program funded by the Ministry of Health, Singapore. The funders had no role in study design, data collection and interpretation, or the decision to submit the work for publication. Mention of trade names or commercial products in this article is solely for the purpose of providing specific information and does not imply recommendation or endorsement by the USDA, DOE, or ORISE. USDA is an equal opportunity provider and employer.
Acknowledgments
We gratefully acknowledge pork producers, swine veterinarians, and laboratories for participating in the USDA Influenza A Virus in Swine Surveillance System and publicly sharing sequences.
Conflict of interest
The authors TKA declared that they were an editorial board member of Frontiers, at the time of submission. This had no impact on the peer review process and the final decision.
The remaining authors declare that the research was conducted in the absence of any commercial or financial relationships that could be constructed as a potential conflict of interest.
Publisher’s note
All claims expressed in this article are solely those of the authors and do not necessarily represent those of their affiliated organizations, or those of the publisher, the editors and the reviewers. Any product that may be evaluated in this article, or claim that may be made by its manufacturer, is not guaranteed or endorsed by the publisher.
Supplementary material
The Supplementary Material for this article can be found online at: https://www.frontiersin.org/articles/10.3389/fviro.2023.1215012/full#supplementary-material
References
1. Shi M, Lam TT-Y, Hon C-C, Hui RK-H, Faaberg KS, Wennblom T, et al. Molecular epidemiology of PRRSV: a phylogenetic perspective. Virus Res (2010) 154:7–17. doi: 10.1016/j.virusres.2010.08.014
2. Anderson TK, Macken CA, Lewis NS, Scheuermann RH, Van Reeth K, Brown IH, et al. A phylogeny-based global nomenclature system and automated annotation tool for H1 hemagglutinin genes from swine influenza A viruses. mSphere (2016) 1:e00275–00216. doi: 10.1128/mSphere.00275-16
3. Paploski I, Corzo C, Rovira A, Murtaugh MP, Sanhueza JM, Vilalta C, et al. Temporal dynamics of co-circulating lineages of porcine reproductive and respiratory syndrome virus. Front Microbiol (2019) 10:2486. doi: 10.3389/fmicb.2019.02486
4. Kim J, Lee K, Rupasinghe R, Rezaei S, Martínez-López B, Liu X. Applications of machine learning for the classification of porcine reproductive and respiratory syndrome virus sublineages using amino acid scores of ORF5 gene. Front Veterinary Sci (2021) 813. doi: 10.3389/fvets.2021.683134
5. Chang J, Anderson TK, Zeller MA, Gauger PC, Vincent AL. octoFLU: automated classification for the evolutionary origin of influenza A virus gene sequences detected in US swine. Microbiol resource announcements (2019) 8:e00673–00619. doi: 10.1128/MRA.00673-19
6. Turakhia Y, Thornlow B, Hinrichs AS, De Maio N, Gozashti L, Lanfear R, et al. Ultrafast Sample placement on Existing tRees (UShER) enables real-time phylogenetics for the SARS-CoV-2 pandemic. Nat Genet (2021) 53:809–16. doi: 10.1038/s41588-021-00862-7
7. Matsen FA, Kodner RB, Armbrust E. pplacer: linear time maximum-likelihood and Bayesian phylogenetic placement of sequences onto a fixed reference tree. BMC Bioinf (2010) 11:1–16. doi: 10.1186/1471-2105-11-538
8. Linard B, Swenson K, Pardi F. Rapid alignment-free phylogenetic identification of metagenomic sequences. Bioinformatics (2019) 35:3303–12. doi: 10.1093/bioinformatics/btz068
9. Barbera P, Kozlov AM, Czech L, Morel B, Darriba D, Flouri T, et al. EPA-ng: massively parallel evolutionary placement of genetic sequences. Systematic Biol (2019) 68:365–9. doi: 10.1093/sysbio/syy054
10. Aksamentov I, Roemer C, Hodcroft EB, Neher RA. Nextclade: clade assignment, mutation calling and quality control for viral genomes. J Open Source software (2021) 6:3773. doi: 10.21105/joss.03773
11. O’toole Á, Scher E, Underwood A, Jackson B, Hill V, Mccrone JT, et al. Assignment of epidemiological lineages in an emerging pandemic using the pangolin tool. Virus Evol (2021) 7:veab064. doi: 10.1093/ve/veab064
12. Zeller MA, Anderson TK, Walia RW, Vincent AL, Gauger PC. ISU FLU ture: a veterinary diagnostic laboratory web-based platform to monitor the temporal genetic patterns of Influenza A virus in swine. BMC Bioinf (2018) 19:397. doi: 10.1186/s12859-018-2408-7
13. Randhawa GS, Soltysiak MP, El Roz H, De Souza CP, Hill KA, Kari L. Machine learning using intrinsic genomic signatures for rapid classification of novel pathogens: COVID-19 case study. PloS One (2020) 15:e0232391. doi: 10.1371/journal.pone.0232391
14. Humayun F, Khan F, Fawad N, Shamas S, Fazal S, Khan A, et al. Computational method for classification of avian influenza A virus using DNA sequence information and physicochemical properties. Front Genet (2021) 12:10. doi: 10.3389/fgene.2021.599321
15. Zhang Y, Aevermann BD, Anderson TK, Burke DF, Dauphin G, Gu Z, et al. Influenza Research Database: An integrated bioinformatics resource for influenza virus research. Nucleic Acids Res (2017) 45:D466–74. doi: 10.1093/nar/gkw857
16. Ragonnet-Cronin M, Hodcroft E, Hue S, Fearnhill E, Delpech V, Brown AJ, et al. Automated analysis of phylogenetic clusters. BMC Bioinf (2013) 14:317. doi: 10.1186/1471-2105-14-317
17. Shendure J, Ji H. Next-generation DNA sequencing. Nat Biotechnol (2008) 26:1135–45. doi: 10.1038/nbt1486
18. Schirmer M, D’amore R, Ijaz UZ, Hall N, Quince C. Illumina error profiles: resolving fine-scale variation in metagenomic sequencing data. BMC Bioinf (2016) 17:1–15. doi: 10.1186/s12859-016-0976-y
19. Pfeiffer F, Gröber C, Blank M, Händler K, Beyer M, Schultze JL, et al. Systematic evaluation of error rates and causes in short samples in next-generation sequencing. Sci Rep (2018) 8:1–14. doi: 10.1038/s41598-018-29325-6
20. Wang L-S, Leebens-Mack J, Wall PK, Beckmann K, Depamphilis CW, Warnow T. The impact of multiple protein sequence alignment on phylogenetic estimation. IEEE/ACM Trans Comput Biol Bioinf (2009) 8:1108–19. doi: 10.1109/TCBB.2009.68
21. Smirnov V, Warnow T. Phylogeny estimation given sequence length heterogeneity. Systematic Biol (2021) 70(2):268–82. doi: 10.1093/sysbio/syaa058
22. MaChado DJ, Castroviejo-Fisher S, Grant T. Evidence of absence treated as absence of evidence: The effects of variation in the number and distribution of gaps treated as missing data on the results of standard maximum likelihood analysis. Mol Phylogenet Evol (2021) 154:106966. doi: 10.1016/j.ympev.2020.106966
23. Breiman L, Friedman J, Stone CJ, Olshen RA. Classification and regression trees. Boca Raton, FL: CRC press (1984).
24. Needleman SB, Wunsch CD. A general method applicable to the search for similarities in the amino acid sequence of two proteins. J Mol Biol (1970) 48:443–53. doi: 10.1016/0022-2836(70)90057-4
25. Henikoff S, Henikoff JG. Amino acid substitution matrices from protein blocks. Proc Natl Acad Sci (1992) 89:10915–9. doi: 10.1073/pnas.89.22.10915
26. Yang Y, Liu X. A re-examination of text categorization methods, in: SIGIR '99: proceedings of the 22nd annual international ACM SIGIR conference on research and development in information retrieval. New York, NY, United States: Association for Computing Machinery (1999) pp. 42–9. Available at: https://dl.acm.org/doi/proceedings/10.1145/312624.
27. Jiao Y, Du P. Performance measures in evaluating machine learning based bioinformatics predictors for classifications. Quantitative Biol (2016) 4:320–30. doi: 10.1007/s40484-016-0081-2
28. Opitz J, Burst S. Macro f1 and macro f1. arXiv preprint arXiv:1911.03347. (2019). doi: 10.48550/arXiv.1911.03347
30. R Core Team. R: A language and environment for statistical computing. Oxford, UK: Oxford Academic (systemic biology) (2015).
31. Arendsee ZW, Vincent AL, Anderson TK. smot: A python package and CLI tool for contextual phylogenetic subsampling. J Open Source Softw (2020) 7(80):4193. doi: 10.21105/joss.04193
32. Katoh K, Standley DM. MAFFT multiple sequence alignment software version 7: improvements in performance and usability. Mol Biol Evol (2013) 30:772–80. doi: 10.1093/molbev/mst010
33. Kearse M, Moir R, Wilson A, Stones-Havas S, Cheung M, Sturrock S, et al. Geneious Basic: an integrated and extendable desktop software platform for the organization and analysis of sequence data. Bioinformatics (2012) 28:1647–9. doi: 10.1093/bioinformatics/bts199
34. Nguyen L-T, Schmidt HA, Von Haeseler A, Minh BQ. IQ-TREE: a fast and effective stochastic algorithm for estimating maximum-likelihood phylogenies. Mol Biol Evol (2015) 32:268–74. doi: 10.1093/molbev/msu300
35. Dang CC, Le QS, Gascuel O, Le VS. FLU, an amino acid substitution model for influenza proteins. BMC evolutionary Biol (2010) 10:1–11. doi: 10.1186/1471-2148-10-99
36. Rambo-Martin BL, Keller MW, Wilson MM, Nolting JM, Anderson TK, Vincent AL, et al. Influenza A virus field surveillance at a swine-human interface. MSphere (2020) 5:e00822–00819. doi: 10.1128/mSphere.00822-19
37. Hoenen T, Groseth A, Rosenke K, Fischer RJ, Hoenen A, Judson SD, et al. Nanopore sequencing as a rapidly deployable Ebola outbreak tool. Emerging Infect Dis (2016) 22:331. doi: 10.3201/eid2202.151796
38. Quick J, Loman NJ, Duraffour S, Simpson JT, Severi E, Cowley L, et al. Real-time, portable genome sequencing for Ebola surveillance. Nature (2016) 530:228–32. doi: 10.1038/nature16996
39. Laver T, Harrison J, O’neill P, Moore K, Farbos A, Paszkiewicz K, et al. Assessing the performance of the oxford nanopore technologies minion. Biomolecular detection quantification (2015) 3:1–8. doi: 10.1016/j.bdq.2015.02.001
40. Delahaye C, Nicolas J. Sequencing DNA with nanopores: Troubles and biases. PloS One (2021) 16:e0257521. doi: 10.1371/journal.pone.0257521
41. Sun H, Yang J, Zhang T, Long L-P, Jia K, Yang G, et al. Using sequence data to infer the antigenicity of influenza virus. MBio (2013) 4:e00230–00213. doi: 10.1128/mBio.00230-13
42. Zeller MA, Gauger PC, Arendsee ZW, Souza CK, Vincent AL, Anderson TK. Machine learning prediction and experimental validation of antigenic drift in H3 influenza A viruses in swine. Msphere (2021) 6:e00920–00920. doi: 10.1128/mSphere.00920-20
43. Koel BF, Burke DF, Bestebroer TM, van der Vliet S, Zondag GC, Vervaet G, et al. Substitutions near the receptor binding site determine major antigenic change during influenza virus evolution. Science (2013) 342:976–9. doi: 10.1126/science.1244730
44. Lewis NS, Anderson TK, Kitikoon P, Skepner E, Burke DF, Vincent AL. Substitutions near the hemagglutinin receptor-binding site determine the antigenic evolution of influenza A H3N2 viruses in US swine. J Virol (2014) 88:4752–63. doi: 10.1128/JVI.03805-13
Keywords: classification, machine learning, logistic regression, taxonomy, automation
Citation: Zeller MA, Arendsee ZW, Smith GJD and Anderson TK (2023) classLog: Logistic regression for the classification of genetic sequences. Front. Virol. 3:1215012. doi: 10.3389/fviro.2023.1215012
Received: 09 May 2023; Accepted: 06 November 2023;
Published: 04 December 2023.
Edited by:
Sophie Gryseels, University of Antwerp, BelgiumReviewed by:
Francesco Cerutti, Ospedale Amedeo di Savoia, ItalySatya Ranjan Dash, KIIT University, India
Copyright © 2023 Zeller, Arendsee, Smith and Anderson. This is an open-access article distributed under the terms of the Creative Commons Attribution License (CC BY). The use, distribution or reproduction in other forums is permitted, provided the original author(s) and the copyright owner(s) are credited and that the original publication in this journal is cited, in accordance with accepted academic practice. No use, distribution or reproduction is permitted which does not comply with these terms.
*Correspondence: Tavis K. Anderson, dGF2aXMuYW5kZXJzb25AdXNkYS5nb3Y=