


- 1 Laboratory for Neuroinformatics, RIKEN Brain Science Institute, Japan
- 2 Department of Informatics, Nicolaus Copernicus University, Poland
- 3 NTT Communication Science Laboratories, Kyoto, Japan
- 4 IVIS, Inc., Tokyo, Japan
A new interactive visualization tool is proposed for mining text data from various fields of neuroscience. Applications to several text datasets are presented to demonstrate the capability of the proposed interactive tool to visualize complex relationships between pairs of lexical entities (with some semantic contents) such as terms, keywords, posters, or papers' abstracts. Implemented as a Java applet, this tool is based on the spherical embedding (SE) algorithm, which was designed for the visualization of bipartite graphs. Items such as words and documents are linked on the basis of occurrence relationships, which can be represented in a bipartite graph. These items are visualized by embedding the vertices of the bipartite graph on spheres in a three-dimensional (3-D) space. The main advantage of the proposed visualization tool is that 3-D layouts can convey more information than planar or linear displays of items or graphs. Different kinds of information extracted from texts, such as keywords, indexing terms, or topics are visualized, allowing interactive browsing of various fields of research featured by keywords, topics, or research teams. A typical use of the 3D-SE viewer is quick browsing of topics displayed on a sphere, then selecting one or several item(s) displays links to related terms on another sphere representing, e.g., documents or abstracts, and provides direct online access to the document source in a database, such as the Visiome Platform or the SfN Annual Meeting. Developed as a Java applet, it operates as a tool on top of existing resources.
Introduction
Very often when dealing with textual data, people are interested in the relationships between entities belonging to two distinct categories: e.g., relationships between words and documents, between topics and documents or between authors and documents. The widely used approach in natural language processing is the vector space model (Salton et al., 1975 ). In this model, a set of terms T is first built by extracting words from a collection of documents D followed by stop words removal and stemming (Porter, 1980 ). The numbers of occurrences of each term in each document (usually called document frequency) are counted and denoted fij). A matrix F is built, with one row for each term and one column for each document, and with the frequencies fij as entries. When the number of documents N in the collection is in the range of a few thousands (as it is in the examples presented below), the number of terms extracted is often larger than a few tens of thousands, leading to very high dimensional space for the documents. In order to enable further processing of matrix F, we reduce its size by selecting a number M of terms using a ranking scheme. This is done by ranking the terms according to a term weighting scheme and retaining the top M terms (M ∼ 1000). Several term weighting schemes have been defined in the information retrieval literature, catching different desired properties for the terms, see (Gibson Kolda, 1997 ) for a review and comparison of term weighting schemes. The most popular one is probably TF.IDF (term frequency inverse document frequency), which has been used in this work. The first part TF is the local part: the weight of a word within a document taken here as the term frequency (its number of occurrences in the document). The second part is global and weights the term with respect to the entire corpus, it is the inverse document frequency (IDF = log(N∕DF)) reducing the over emphasized importance of terms occurring many time in long documents. The matrix of frequencies F is usually sparse because most of the terms occur only in a few documents. In this case, it is convenient to regard the data as a graph which vertices represent both terms and documents, and each edge connects one term to one document if the term occurs at least once in the document. The frequencies in matrix F are then converted to binary entries to build a second occurrence matrix O (oij = sgn(fij)), from which a bipartite graph is defined. In such a graph, each term is connected to all the documents in which it occurs, and each document is connected to all the terms from set T it contains, but there are no connections between terms, nor between documents.
Bipartite Graph Visualization
The purpose of bipartite graph visualization is to display simultaneously two types of relationships: the similarities existing between items within each of two subsets, on the basis of the relationships defined by the graph edges. In the terms and documents application introduced above, we are interested in seeing the similarities between terms, as well as similarities between documents, based on the occurrences of terms in the documents. In each of the applications presented in section Applications, the most important information is the configuration of the graph's vertices. The edges of the graph are not of primary interest here, they are not visualized by default, although the 3D-SE viewer allows displaying them.
Formal definition of a bipartite graph
A graph G is defined as G: = {V, E}, where V is the set of vertices or nodes and E is the set of edges. The graph G is undirected if the pairs in E are unordered. An undirected graph G is called a bipartite graph if there exist a partition of the vertex set V = VA ∪ VB, so that there is no edge in E connecting VA to VB.
The spherical embedding (SE) algorithm
The SE algorithm (Saito et al., 2004 ) was primarily designed for the visualization of bipartite graphs. The items of the two subsets VA and VB are represented as nodes positioned on two concentric spheres in a three-dimensional (3-D) Euclidean space. The number of dimensions of the embedding space was set to 3 because more information can be visualized in 3-D than in 2-D. Items from subset VA are mapped on the inner sphere θA (with radius rA = 1), whereas items from VB are mapped on the outer sphere θB (with radius rB = 2). Items positions are defined in such a way that similar items in VA are close to each other on θA, and similar items in VB are close to each other on θB. Figure 1 illustrates the process of bipartite graph construction and visualization in a 2-D space using the SE algorithm.
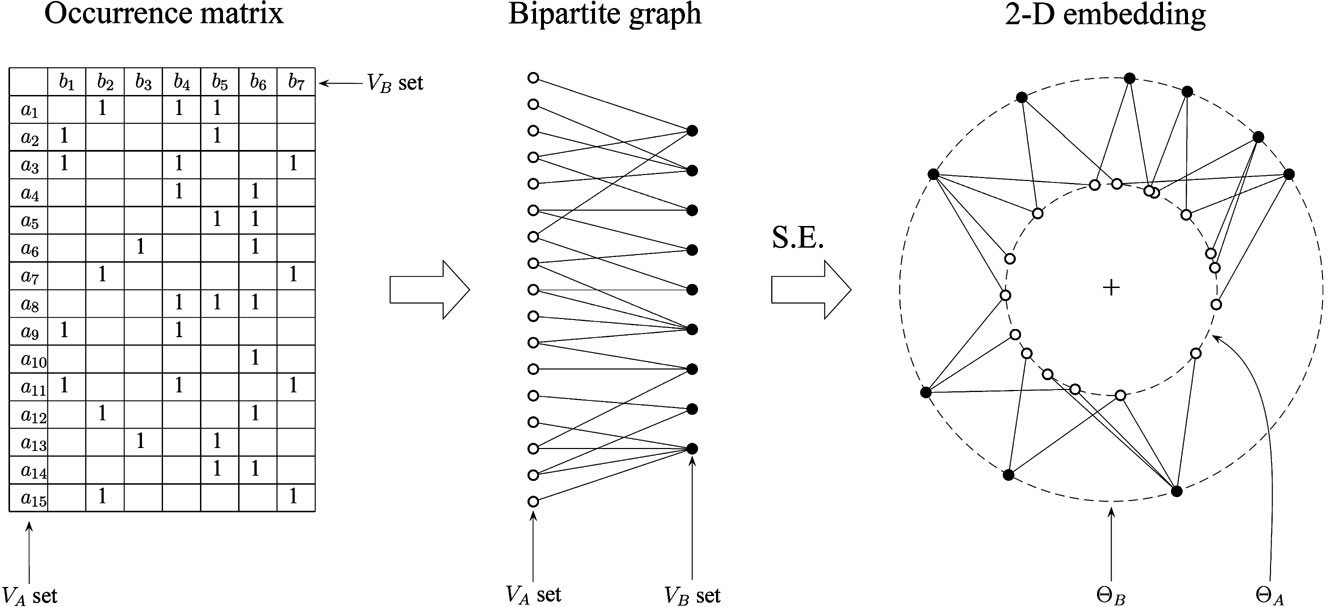
Figure 1. Visualization process: from the binary occurrence matrix O to the bipartite graph and its visualization using the SE algorithm.
To achieve this goal, we search for the coordinates of the graph nodes  that minimize a sum E over all the pairs of nodes in the embedding 2-D or 3-D space, such that the sum of Euclidean distances between pairs of points along all the edges in E is minimized. The minimization is performed through a gradient descent procedure, under the requirement that the points lie on the two spheres, that is
  . This constrained optimization problem is converted to an unconstrained one using some sufficient statistics results (Lagrange multipliers, for further details see Golub and van Loan, Matrix computation, 1996, section on LSQI problem). The double sum E is defined as
where ri = rA (respectively rB) for nodes from subset VA (respectively VB), and the {wij} are positive weights that can be used to give more emphasis on pairs of nodes belonging to E. The {aij} take values in {+1,−1}, depending on whether the pairs of nodes {i,j} are in E or not. In order to clarify the effect of the {aij}, let us denote as θij the angle between the points representing nodes i and j, we have hence  and we rewrite expression (1) as
When minimizing E, each term is (aij − cos θij) minimized. We can see that if two nodes i and j are connected in E, we must set aij = +1 in order to force the representing points to be close to each other  and conversely, when nodes i and j are not connected in E, their points should be far apart, which means that we must set
Related approaches
Although graph drawing is a very active field of research, very few work exist on the visualization of bipartite graphs. An interesting method called anchor maps (Misue, 2006
) has been proposed recently. It provides a visualization of the graph in a 2-D space, proceeding in two steps: the items of the first subset of vertices VA are plotted on a circle at equal intervals, after which the vertices of the second subset VB are added to the plot by allocating them with respect to the vertices of VA using a spring embedding with restrictions technique, which ensures a minimization of the total length of edges and the number of crossings. A different approach is proposed by Zheng et al. (2005)
, in which a layout of points on two parallel planes is sought for, such that a view in three dimensions from which the number of observed crossings will be minimal. Drawing the vertices on planar curves, as proposed by Di Giacomo et al. (2006)
, is another interesting approach. Hong et al. proposed (Hong, 2005
) a layered drawing of bipartite graphs in  dimensions, that is the vertices are allocated on two surfaces embedded in a 3-D Euclidean space. In all these approaches, the ultimate goal is the visualization of the graph itself, that is, nodes are displayed together with lines representing the edges. In our approach, the focus is set primarily on the visualization of the vertices of the graph; although edges can be interactively displayed on user's request by selecting the corresponding node(s).
The 3D-SE viewer visualization tool
The 3D-SE viewer 1 visualization tool has been designed and developed for the general purpose of bipartite graphs visualization. In order to build an interactive tool available on Web pages, it has been implemented as a Java applet. The visualized items are represented as colored nodes with labels, embedded in a 3-D Euclidean space. Their positions are first calculated by the SE algorithm, and then they are viewed on a pseudo 3-D layout implemented using the standard Java graphics context Java.awt.graphics. Interactively, the viewpoint can be modified by the user (rotation of the spheres around their center, zooming in or out, translation of the center). The nodes of subset VA (respectively VB) are displayed on the inner sphere θA (respectively θB) and they are listed in the list panel on the right (respectively left) side of the central view. A node can be selected by clicking it directly in the central view or in the side panel (several nodes can be selected by pressing the shift or controls key while clicking nodes). When a node is selected, all the edges connected to it are displayed, and the nodes from these edges second end are also selected. Finally, one can search a node by entering a search phrase matching its name in one of the two search text fields on top of the listing panels displayed on both sides of the central view.
Applications
Three different datasets have been used to test visually the performance of the 3D-SE viewer tool. These datasets are all based on relationships between words and other entities (research teams, documents, or conference sessions), expressed in a bipartite graph. The datasets differ in size (numbers of nodes in each subset) that is, |VA| and |VB| and also in their sparseness ratio (percentage of empty cells in occurrence matrix) defined as S = − |E| (|VA|| VB|). Table 1 below summarizes the three datasets visualized in this section. Due to the local nature of the gradient descent minimization process, the computation of the graph's layout has to be iterated (typically about 20-30 times) in order to reach a good local minimum, i.e., approaching the global minimum. The calculation of one iteration for a dataset with |VA| =100 and |VB| =1000 takes about 1 minute on a Centrino 2 GHz CPU. This limits practically the use of the SE algorithm in its present form to datasets sized up to |VA| + |VB| <5000.
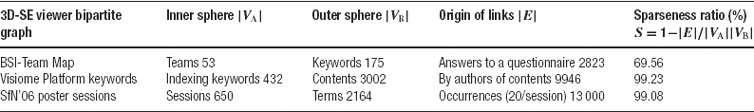
Table 1. Basic figures of the three datasets used in the applicatin of the 3D-SE viewer.
The Brain Science Institute (BSI)-Team Map
The first application of 3D-SE viewer was the visualization of the structure of a research center: the Brain Science Institute (BSI) in RIKEN (Wako, Japan). The purpose of this visualization was to exhibit the relationships and similarities of interests between laboratories and research units in BSI. The resulting interactive exploration tool was named BSI-Team Map 2 and it is accessible on the internet on RIKEN BSI's main Web page (http://www.brain.riken.go.jp/en/teammap/index.html ). This tool allows visitors to see at a glance all the teams of BSI as well as search facilities and provides direct access to a chosen team. Since its public accessibility in December 2006, we received many positive comments about this tool's capability to show how people interact. This tool is an effort to make the structure of a research structure more accessible and understandable to the international community, although a lack of international visibility of scientists' Web pages in Japan has been recently reproached (Ito and Wiesel, 2006 ). We agree that visibility could be improved by visualizing topics, for instance extracted from the teams' Web pages where research activities are described; a topic-oriented structure being more generally accessible than a people-oriented one. The proposed representation conveys more information on inter-team similarities than a simple list of names or a planar graph would do: In three dimensions, there is one more degree of freedom to position the teams in a way that reflects similarities of interests between entities. In order to feature research interests of the different research units in BSI, a questionnaire has been sent to the 53 research team leaders. Based on their answers, a common list of 175 keywords has been established for the whole institute. This list was then sent back to team leaders who were asked to select the keywords that best correspond to their team's research interests, and to distinguish between keywords of primary and secondary interest. After collecting all the final answers, a table was formed with the keywords on rows, teams on columns and numbers in entries: 1 or 2 whether the keyword was selected as of primary or secondary interest and 0 otherwise. From this “interest” sparse matrix, a binary occurrence matrix was derived (replacing the twos by ones); the corresponding bipartite graph was build and visualized using the 3D-SE viewer. The inner sphere represents the keywords and the outer sphere contains research teams, represented by the team leader's name. Figure 2 illustrates an example of team search: the team leader's name Amari was entered in the search field on top of left panel. The found name is selected in the list of team names, the view was automatically centered on this node and the links to the keywords of research interests for this team are displayed. Then a single click on the team's name will display the Web page of this team. Similarly, when entering a keyword in the search field of the right panel, the view will be centered on the found node(s) and the links from the keyword(s) to all the teams having some research interest it will be shown.
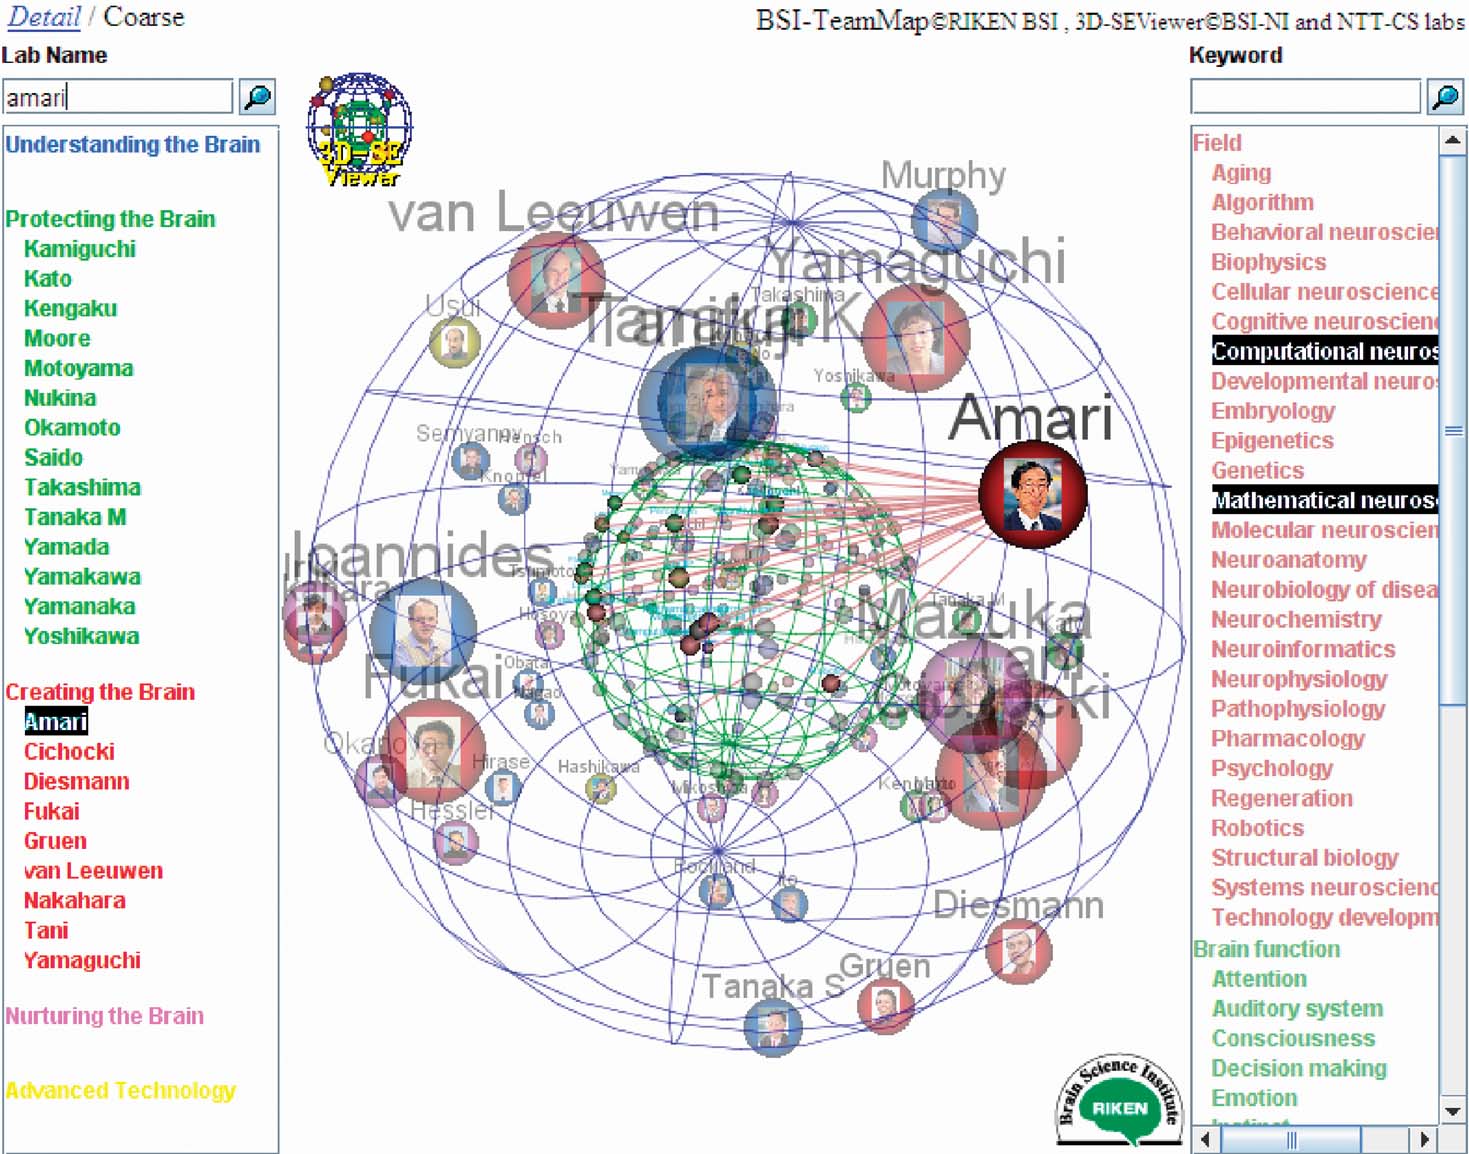
Figure 2. BSI-Team Map: 3D-SE viewer-based visualization of RIKEN BSI research teams. The nodes are colored according to the five team units listed in the left panel. It can be seen that nodes with the same color appear in the neighboring regions on the outer sphere.
The Visiome Platform index keywords
Understanding the brain as a system requires worldwide collaboration of scientists specializing in different areas of brain science. This issue confronting many areas of research and much more compounded in the fields of brain research, prompted for the development of a field called neuroinformatics (NI). Its main goal is to help brain scientists handle the analysis, modeling, simulation, and management of the information resource before, during, and after the conduction of research. The NI platforms such as Visiome (http://platform.visiome.neuroinf.jp/ ) (Usui, 2003 ) aim to address these issues by providing portal sites to different fields of brain research, such as in Neuroinformatics Japan Center (NIJC). One vital component of the NI platform is the index tree which is used to organize the electronic materials (digital contents) submitted by the contributors. Automating the keyword index extraction is necessary to support the evolution of the platform in operation and for the establishment of new platforms (Usui et al., 2007 ). The 3D-SE viewer was used here to visualize both the indexing keywords and the documents of different types contained in the database called contents. In a first application, a manually established list of indexing terms was used. A selection of keywords for each content was also performed by human experts in the field of vision science. The resulting bipartite graph is made of 3434 vertices split into a set of 3002 contents and a set of 432 index terms, connected by a total of 9946 edges. In the Visiome Platform, the contents are filed into eight main categories: Visual System, Visual Stimulus, Basic Neuroscience, Tools and Techniques, Models and Theory, Applications, Links, Binders, these categories are used to color the nodes on the display. Besides the selection and search possibilities that were described earlier, the 3D-SE viewer allows to access directly other documents by following hyperlinks. When the node of an index term on the outer sphere is clicked by the user, the corresponding page of Visiome database is displayed. This page lists all the registered contents linked to this index keyword, allowing then to access each individual document related to this term. Similarly, if a content node is clicked on the inner sphere, then the Visiome page of this content is shown, providing access to the details of the corresponding document. Figure 3 illustrates a view zoomed into the area of searched term retina. As can be seen, the node of the found index keyword retina is connected to a large number of documents sketched by the red links, which is an indication that the position of this node on the outer sphere is quite reliable. Experts in this field can evaluate how close from a semantic point of view the neighboring nodes are to this keyword.
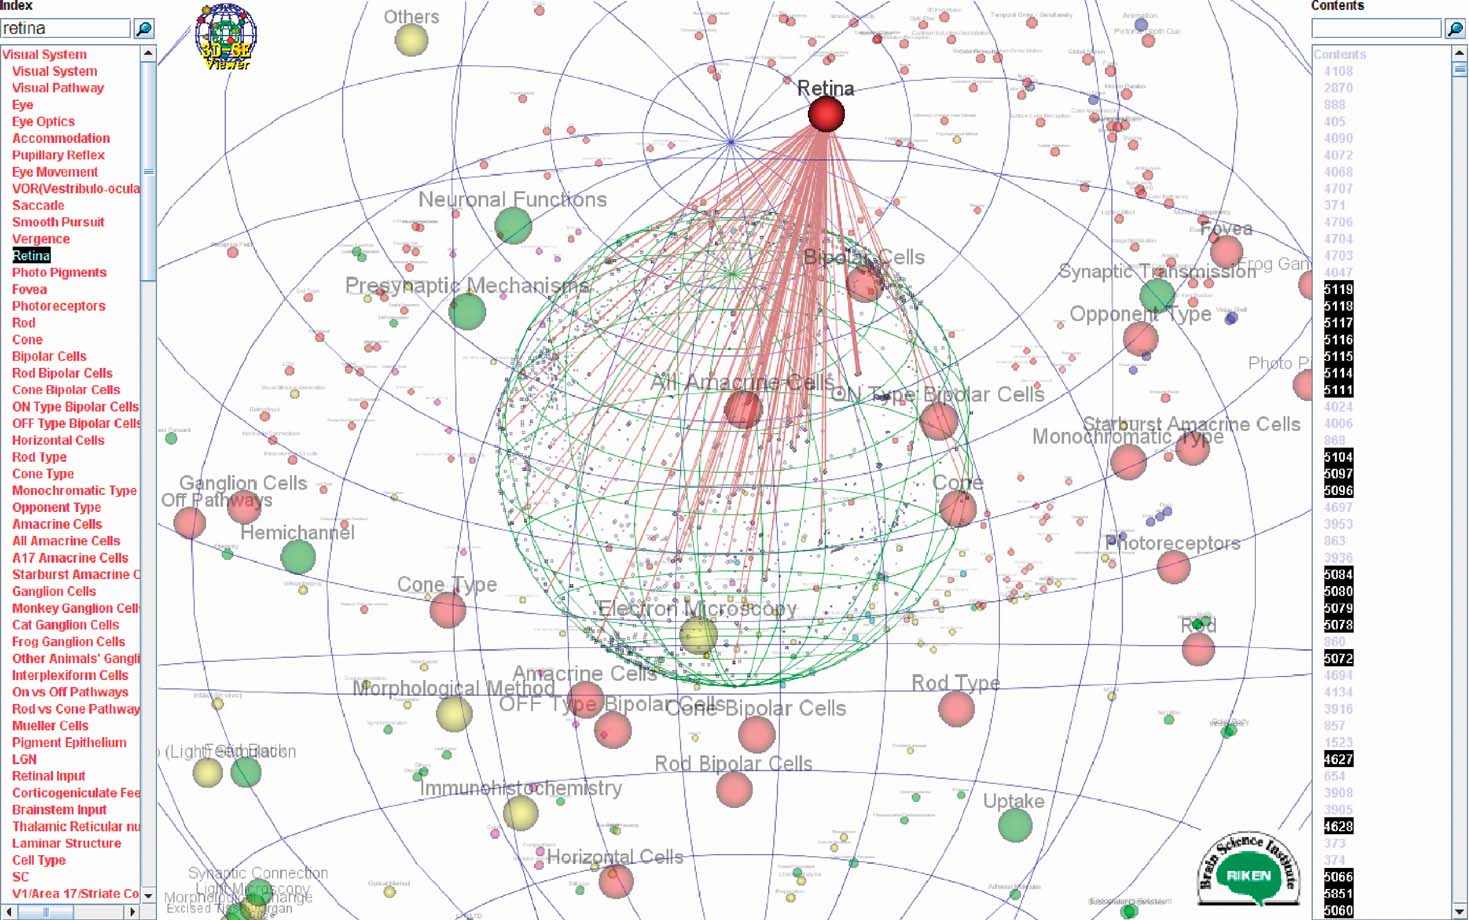
Figure 3. Visualization of Visiome Platform index keywords and contents. The searched term retina found in the index keywords list is selected, showing simultaneously all the links to related contents.
Society for Neuroscience Annual Meeting abstracts
The Society for Neuroscience (SfN) is, with more than 37500 members, the world's largest organization of scientists devoted to the study of the brain. Its Annual Meeting is the largest event in neuroscience, which gathered in 2005 nearly 35000 scientific and nonscientific attendees. Among other scientific events, 650 poster sessions allow researchers to communicate results of their last research. Since the year 2000, abstracts of all posters presented at the Annual Meeting are available online at the SfN Website (http://www.sfn.org ) as well as on a CD distributed to participants. The data presented here were extracted from an XML file that is created on disk during installation of the 2006 Neuroscience Meeting Planner software. Several types of sessions such as poster sessions, slide sessions, etc. are defined and each session is assigned to one theme among the following eight main themes in neuroscience: (A) Development, (B) Neural Excitability Synapses and Glia: Cellular Mechanisms, (C) Sensory and Motor Systems, (D) Homeostatic and Neuroendocrine Systems, (E) Cognition and Behavior, (F) Disorders of the Nervous System, (G) Techniques in Neuroscience, (H) History and Teaching of Neuroscience. Each theme is subdivided into subthemes, and each subtheme is divided into topics. In this preliminary analysis, we focused on poster sessions only, extracting information from posters titles and abstracts. Altogether, there were 12844 posters for which a title and an abstract were available. These posters were presented in 650 poster sessions, and assigned to one among 415 topics, 71 subthemes, and 7 themes. The purpose of this application of the 3D-SE viewer is the visualization of the different poster sessions, in order to see how they organize on the basis of the similarities of the posters they listed. Such a display could be usable in future SfN Meetings for attendees to help them plan an itinerary as a path connecting items on the sphere where themes, subthemes, and topics would be represented. In this preliminary work, we wanted to visualize only the poster sessions on the basis of their relationships to posters abstracts and titles. In this purpose, for each session, words were extracted from titles and abstracts of the session's posters (from 15 to 30 posters per session) in the same manner as described in section Introduction and ranked according to their TF.IDF values. The top 20 words for each session were selected, and gathered into one set of all words for all sessions (many words were common to several sessions, so the final set has 2164 words). Finally, a [sessions × words] occurrence matrix was build and the ensuing bipartite graph connecting words to sessions was visualized using the 3D-SE viewer applet. Figure 4 represents the 650 poster sessions visualized on the basis of the terms extracted from posters abstracts and titles.
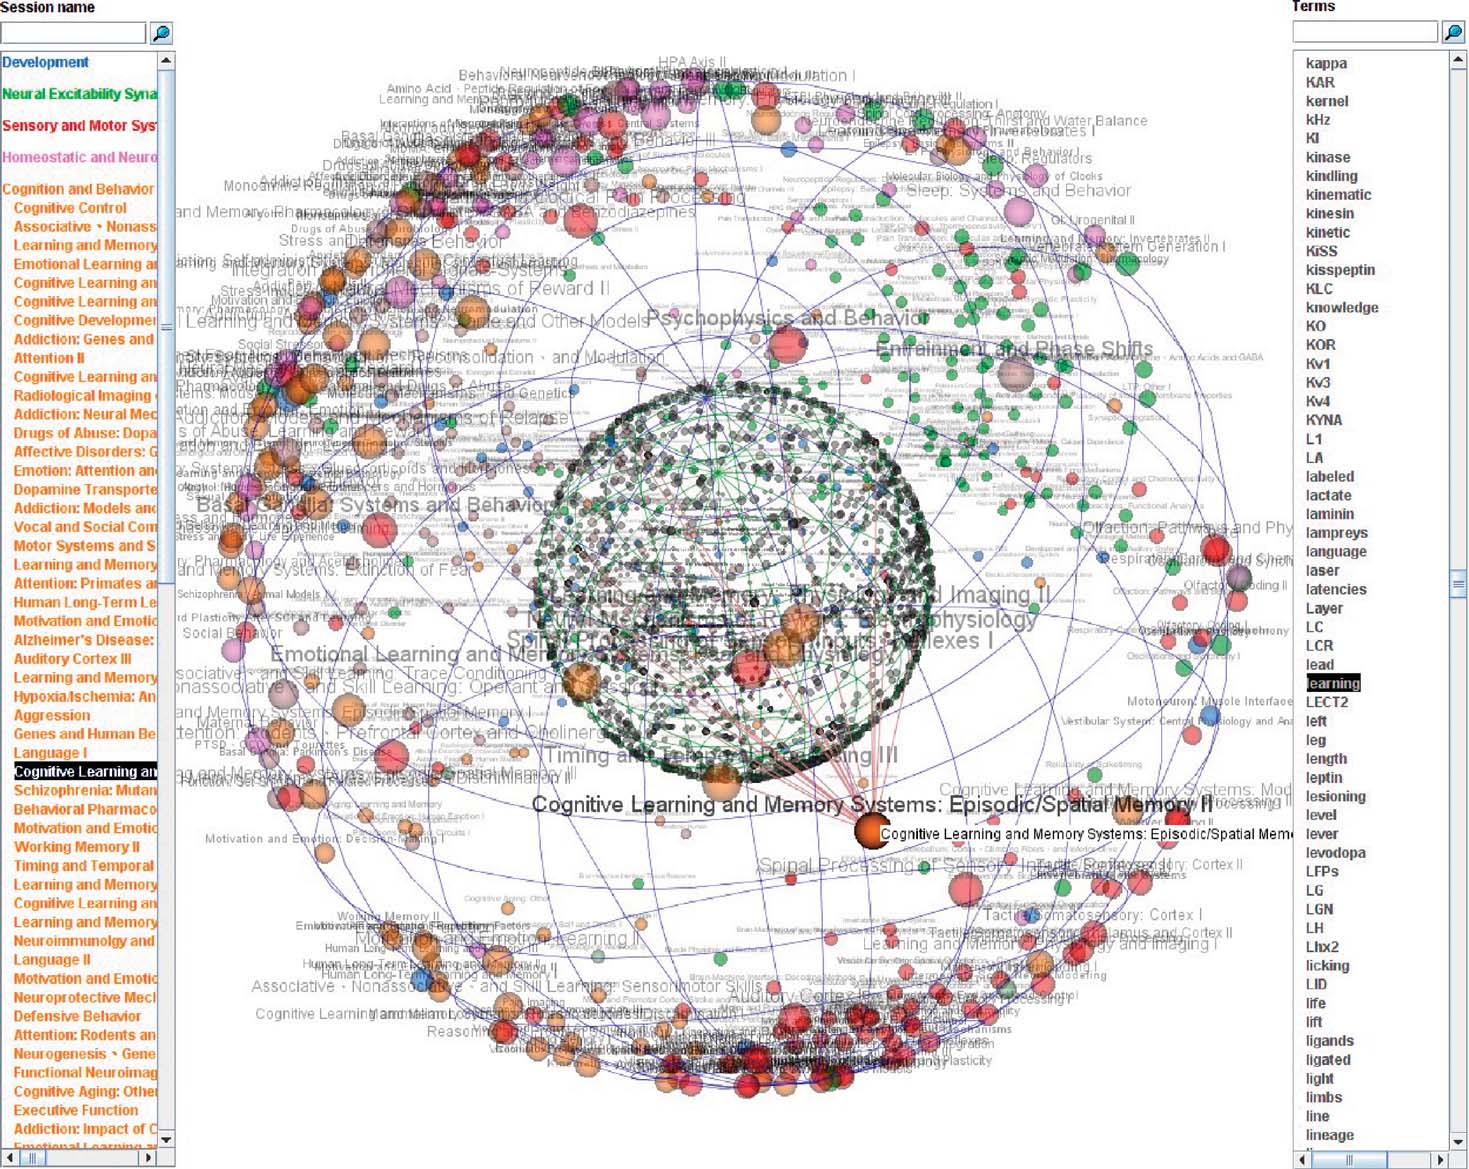
Figure 4. Society for Neuroscience 2006 Annual Meeting: a view of 650 poster sessions (outer sphere) and 2164 extracted terms (inner sphere). The nodes on the outer sphere are colored according to the sessionquotidns dominant theme. It can be seen that the nodes form some clusters according to their theme.
Discussion and Perspectives
The 3D-SE viewer is a very attractive tool visualizing bipartite graphs on two spheres. The presented applications of 3D-SE viewer show that it is a useful tool for the visualization of data such as research teams of a large research institution, terms indexing documents in a neuroscience database or poster sessions from the neuroscience knowledge domain. Another advantage of the 3D-SE viewer is its fairly competitive time complexity, which allows obtaining the visualization of several thousands of nodes in a few seconds. An online update of the layouts, needed as documents and keywords will increase in time, should be possible by optimizing further the SE algorithm. From our numerous experiments conducted with various datasets, it has been observed that best visual effects are obtained when the bipartite graph is balanced, that is the numbers of items in each of the two subsets is of the same range. We also observed sometimes that the nodes are more uniformly allocated on the two spheres in cases when the graph's edges are themselves more uniformly distributed over the graph's vertices. This means that the degree of each vertex (the number of edges connected to it) should not vary too importantly among the different vertices; otherwise we may observe some empty areas on both spheres. This “hole effect” is probably related to the graph density properties, and it is under analysis. These results of the application of 3D-SE viewer to such data are very preliminary and further research in this area will be conducted in the near future. The results are encouraging and applications to larger datasets can be considered, although in such cases the interactivity can be slowed down by the Java applet technology. The 3D-SE viewer can be used, e.g., for larger research institutes, showing for example a higher level of the organizational structure of RIKEN. Applications to the visualization of n-partite graphs for n > 2 can also be implemented as layouts of n concentric spheres.
Conflict of Interest Statement
This research was conducted in the absence of any commercial or financial relationships that could be construed as a potential conflict of interest.
Acknowledgements
The authors would like to thank W. Duch for helpful comments and discussions. The NeuroInformatics Committee of the Society for Neuroscience is gratefully acknowledged for providing and granting the use of the abstracts visualized in section Society for Neuroscience Annual Meeting Abstracts.
Footnotes
- ^ 3D-SE viewer ©BSI-NI and NTT-CS Laboratories. The viewer has been implemented as a Java applet, however, it is not a commercial product. It is publicly available at the time of publication only via the BSI-Team Map.
- ^ BSI-Team Map © RIKEN Brain Science Institute.
References
Di Giacomo, E., Grilli, L., and Liotta, G. (2006). Drawing Bipartite Graphs on Two Curves, 14th International Symposium on Graph Drawing, Universität Karlsruhe.
Gibson Kolda, T. (1997). Limited-memory matrix methods with applications, PhD thesis, Department of Computer Science, University of Maryland.
Hong, S., and Nikolov, N. (2005). Layered Drawings of Directed Graphs in Three Dimensions, Proceedings of the Asia-Pacific Symposium on Information Visualization, CRPIT, vol. 45, pp. 69–74.
Ito, M., and Wiesel, T. (2006). Cultural differences reduce Japanese researchers' visibility on the Web. Nature 444, p. 817.
Misue, K. (2006). Drawing bipartite graphs as anchored maps, In Proceedings of Asia Pacific Symposium on Information Visualisation (APVIS2006), Tokyo, Japan. CRPIT, 60. K. Misue, K. Sugiyama, and J. Tanaka, eds., ACS, pp. 169–177.
Saito, K., Iwata, T., and Ueda, N. (2004). Visualization of Bipartite Graph by Spherical Embedding, JNNS.
Salton, G., Wong, A., and Yang, C. S. (1975). A Vector Space Model for Automatic Indexing, Communications of the ACM, vol. 18, nr. 11, 613–620.
Keywords: neuroinformatics, data visualization, bipartite graph, 3D-SE viewer, text mining, keyword extraction
Citation: Antoine Naud, Shiro Usui, Naonori Ueda,and Tatsuki Taniguchi (2007). Visualization of documents and concepts in neuroinformatics with the 3D-SE viewer. Front. neuroinform. 1:7. doi: 10.3389/neuro.11/007.2007
Received: 15 September 2007;
Paper pending published: 9 October 2007;
Accepted: 16 October 2007;
Published online: 2 November 2007
Edited by:
Jan G. Bjaalie, International Neuroinformatics Coordination Facility, Karolinska Institutet, Sweden; University of Oslo, NorwayReviewed by:
Robert C. Cannon, Textensor Limited, Edinburgh, United KingdomGully A. Burns, USC Information Sciences Institute, Los Angeles, USA
Copyright: © 2007 Naud, Usui, Ueda, Taniguchi. This is an open-access article subject to an exclusive license agreement between the authors and the Frontiers Research Foundation, which permits unrestricted use, distribution, and reproduction in any medium, provided the original authors and source are credited.
*Correspondence: Shiro Usui, Laboratory for Neuroinformatics, RIKEN Brain Science Institute, 2-1 Hirosawa, Wako City, Saitama 351-0198, Japan. e-mail:dXN1aXNoaXJvQHJpa2VuLmpw