Department of Psychology, York NeuroImaging Centre, University of York, UK
Integration and display of results from multiple neuroimaging modalities [e.g. magnetic resonance imaging (MRI), magnetoencephalography, EEG] relies on display of a diverse range of data within a common, defined coordinate frame. DataViewer3D (DV3D) is a multi-modal imaging data visualization tool offering a cross-platform, open-source solution to simultaneous data overlay visualization requirements of imaging studies. While DV3D is primarily a visualization tool, the package allows an analysis approach where results from one imaging modality can guide comparative analysis of another modality in a single coordinate space. DV3D is built on Python, a dynamic object-oriented programming language with support for integration of modular toolkits, and development of cross-platform software for neuroimaging. DV3D harnesses the power of the Visualization Toolkit (VTK) for two-dimensional (2D) and 3D rendering, calling VTK’s low level C++ functions from Python. Users interact with data via an intuitive interface that uses Python to bind wxWidgets, which in turn calls the user’s operating system dialogs and graphical user interface tools. DV3D currently supports NIfTI-1, ANALYZE™ and DICOM formats for MRI data display (including statistical data overlay). Formats for other data types are supported. The modularity of DV3D and ease of use of Python allows rapid integration of additional format support and user development. DV3D has been tested on Mac OSX, RedHat Linux and Microsoft Windows XP. DV3D is offered for free download with an extensive set of tutorial resources and example data.
This paper describes DataViewer3D (DV3D), a software package built with Python
1
and designed and optimized to address many of the issues encountered when visualizing multi-modal neuroimaging data.
The combination of analyses from multiple imaging modalities is an important and growing trend in neuroimaging (e.g. McDonald, 2008
; Stufflebeam and Rosen, 2007
). Researchers are conscious of the limitations of individual imaging techniques and their associated analysis methods (e.g. Coltheart, 2006
). With sites having access to more than one data acquisition technology, the neuroimaging community has the opportunity to compare and contrast results from different modalities and analysis approaches. Multi-modal techniques are used to exploit differences in results obtained from different techniques (e.g. Liu et al., 2006
) and potentially provide converging evidence concerning researchers’ hypotheses.
A variety of neuroimaging analysis packages are available to researchers, facilitating analysis of data from a complex and diverse range of data acquisition techniques. The Neuroimaging Informatics Tools and Resources Clearinghouse
2
list many of these tools. Commercial analysis software packages include ANALYZE™
3
and BrainVoyager
4
. Widely used open-source analysis toolboxes for MATLAB
5
are exemplified by Statistical Parametric Mapping (Frackowiak et al., 1997
), Fieldtrip
6
, EEGLAB (Delorme and Makeig, 2004
), mrVista (Teo et al., 1997
; Wandell et al., 2000
) and NUTMEG
7
. Stand-alone, cross-platform analysis packages include FSL
8
and FreeSurfer
9
. In addition to analysis packages, a number of stand-alone visualization packages have been developed, some to complement particular analysis packages (e.g. FSL’s FSLView
10
) and others independently of analysis packages (MRICron
11
; 3D Slicer
12
).
Both analysis and stand-alone visualization packages are often customized solutions developed by a site to address their specific requirements. Many software packages are later extended to provide analysis frameworks for a more diverse range of hardware platforms, data types and analysis methods. Sharing and distribution of platform independent software with unified data formats allows the neuroimaging community increased access to analysis methods. Researchers may have to compare the visual outputs of two or more different packages side by side, often comparing two-dimensional (2D) outputs from one to 3D outputs of another. The lack of a like-for-like comparison of results in a uniform coordinate space can increase the potential for misinterpretation of results. Reproducibility of results and consistency in analysis, interpretation, and display of results may be compromised when comparing results from different analyses and visualization software (e.g. Mackenzie-Graham et al., 2008
).
DV3D does not attempt to compete with existing analyses packages in terms of analysis routines but rather acts as a support tool for neuroimaging analysis packages. DV3D allows users to integrate results from a number of different analysis packages, in a variety of formats and in an open-source, platform independent implementation. DV3D is designed to offer 2D and 3D visualization support for results from a number of neuroimaging acquisition modes and analysis techniques including magnetic resonance imaging (MRI), magnetoencephalography (MEG), positron emission tomography, computed axial tomography and diffuse optical imaging. DV3D has a highly modular, transparent design and is optimized for integration of additional display routines and file format support. DV3D provides export routines for high-resolution images, movies and objects created by the program for data sharing.
FSLView, 3D Slicer and MRICron are three of the most widely used stand-alone packages for visualizing neuroimaging data, and thus DV3D’s functionality will be most closely compared and contrasted to them. None of these packages (and no other single stand-alone package to the best of our knowledge) offer support for all of the multiple analysis outputs of the aforementioned imaging technologies. DV3D is designed to fill this gap.
DV3D is built on Python, a cross-platform interpreted programming language. In DV3D, Python is used to wrap familiar, system-native Graphical User Interface (GUI) functionality using wxWidgets
13
and powerful graphics rendering using the Visualization Toolkit
14
(VTK). DV3D’s code base is completely platform independent allowing code to run on any system with Python, VTK and wxWidgets installed. This minimizes code translation time and system-dependent error handling, increasing the efficiency of software development and new process integration.
First we outline the design objectives for DV3D. Following this we will discuss the value of using an open-source, platform independent framework for developing such a package, focusing on Python as the programming language to facilitate cross-platform software development. We will then outline the current functionality of the release package of DV3D and how it achieves our design objectives. We will conclude by comparing DV3D’s functionality to similar existing tools, highlighting how DV3D currently provides more comprehensive functionality in a single package, as well as an accessible framework for future development by the neuroimaging community.
While the exact requirements of every neuroimaging research environment are different, we note that many researchers regularly use a number of core functions when either exploring their data visually or reporting results to their peers. The key requirements that we have tried to address in the development of DV3D are discussed below. They are:
• Dealing with different data types
• A common space for data
• Co-registration with atlases
• Export routines for sharing and publication
• An efficient working environment.
• A flexible, scalable and accessible open-source framework
Dealing with Different Data Types
Considering the number of different data sources in neuroimaging, many different ways to display the results of neuroimaging data have been adopted.
Due to the nature of their individual underlying analysis methods, many existing software packages are optimized for displaying results in their own preferred way. Figure 1
summarizes some of these conventions using FSL, SPM, DTI-Studio
15
, FreeSurfer, mrVista and EEGLab as examples. Most packages are, understandably, optimized for the display of imaging results from a limited number of technologies, protocols, analysis methods and file formats. DV3D provides a platform in which the user can display a wider range of data in a number of different formats, be they 2D or 3D.
When considering the data types that a multi-modal neuroimaging visualization tool may be required to handle, there are at least four levels of abstraction we need to consider. An example of the complexity of the data structures that require consideration for neuroimaging data processing streams is shown in Figure 2
. Analyzing and presenting data from MRI protocol subtypes alone requires a support for a broad range of data formats. A software package capable of supporting multi-modal data thus needs to consider: (a) the technology being used to acquire the different data types, (b) the acquisition settings (or protocol) being used to acquire the data, (c) the analysis techniques used to analyze the acquired data, and (d) the format in which the data and results are stored.
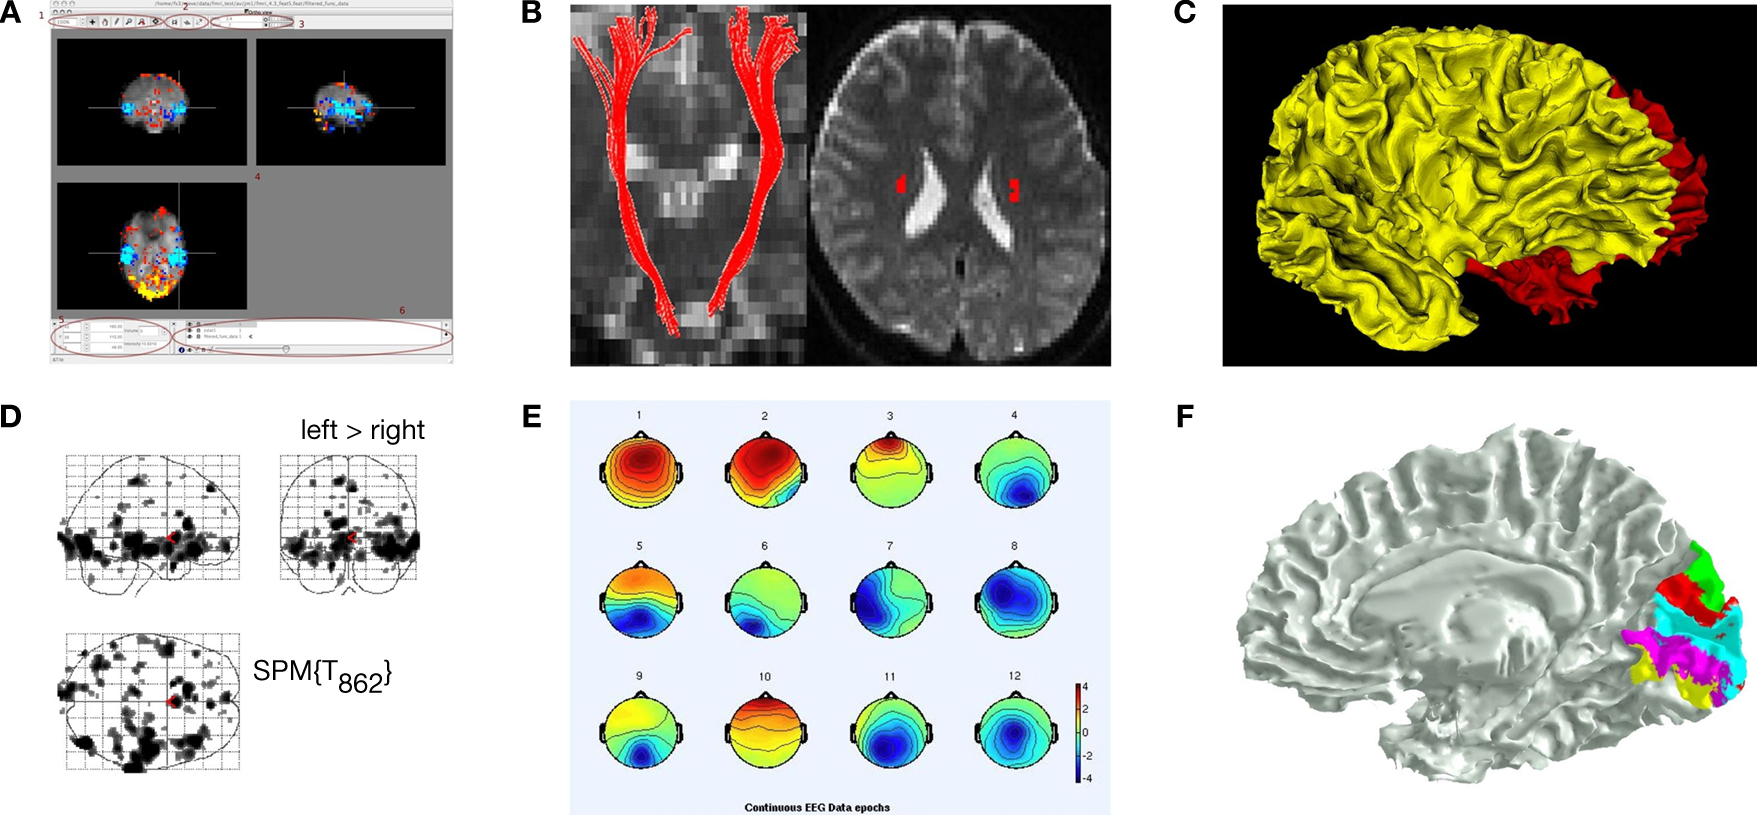
Figure 1. Some common display conventions for neuroimaging data. Examples of some of the methods commonly used to display neuroimaging data. (A) FSL’s FSLView is used in this example to show the overlay of fMRI data onto three orthogonal planes generated for a 3D MRI volume. (B) DTIStudio can display DTI-fiber paths as streamlines mapped onto orthogonal planes generated from 3D MRI Volumes. (C) FreeSurfer can be used to display surfaces extracted from MRI data. In this example the grey matter to white matter boundary is displayed in 3D, with separate surfaces for the left (red) and right (yellow) hemispheres of the brain. (D) SPM can be used to output 2D projections of regions of statistical significance to a ‘glass brain’ view. (E) EEGLab can be used to show iso-contour patterns of changing electrical fields over the scalp in 2D. (F) mrVista can be used to map scalar values (here different visual areas are represented by different colors) to a cortical surface.
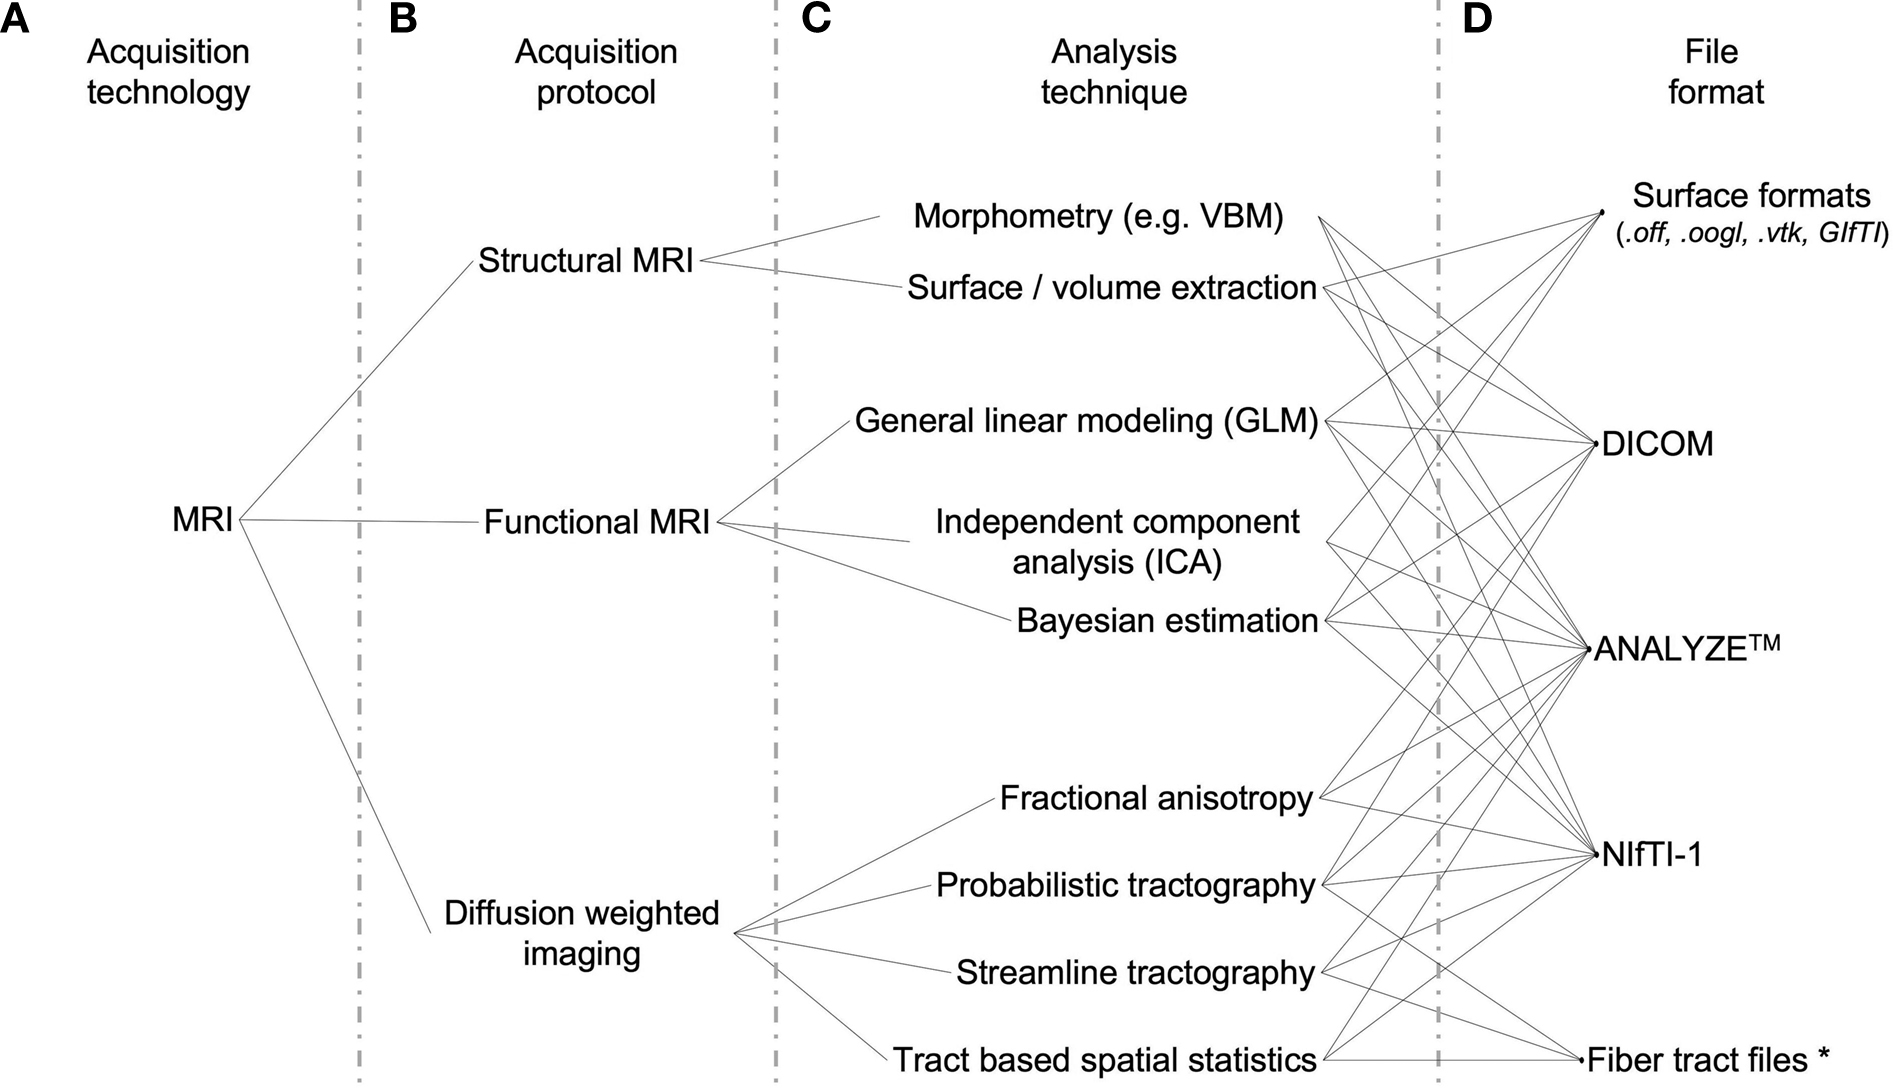
Figure 2. Data handling complexity in MRI analysis streams. A schematic representation of the some of the levels of abstraction considered when preparing software capable of handling multi-modal neuroimaging data. (A) The technology type used: Here we use MRI as an example. (B) Some MRI acquisition protocols or sub-types: a researcher using a combination of protocols may, for example, be looking for changes in blood oxygenation using functional MRI, localizing the regions of activation to specific brain regions using structural MRI, and then looking for anatomical connections between these regions using Diffusion weighted MRI. They may then wish to overlay the results from each modality to explore spatial relationships. (C) Examples of the types of different analysis algorithms and routines for any given protocol. (D) Examples of data formats: although researchers may use the same technology, the same protocol, and even the same analysis technique/algorithm, they may save their results in different file formats not immediately accessible to software utilized at other sites. *In the case of Fiber tract files, few standard file formats have been developed specifically for DTI data, and even fewer for saving the results of fiber tracking algorithm output. The.nrrd file format (http://www.na-mic.org/Wiki/index.php/NAMIC_Wiki:DTI:Nrrd_format
) is used by 3D Slicer to load DTI values and parameters into memory. Fibers are subsequently calculated and can be saved to a vtk file format, unspecific for DTI fibers but useful for import and conversion by any VTK based programs, including DV3D.
The first key objective of DV3D is to ensure flexibility in design that will enable users to integrate neuroimaging data whether it comes from different technologies, from different acquisition protocols, from different analysis approaches and independently of which data format they are saved in.
A Common Space for Data
In order to sensibly overlay data for visualization of multi-modal analyses, we need to display the data in a common reference frame. An MEG data set, for example, will typically have a coordinate space defining the sensor positions, the participant’s head shape and head position relative to the sensors. To overlay this data onto, for example, a surface extracted from an MRI scan, we need to align the coordinate space of the MRI scanner to that of the MEG scanner. Many analysis packages already have algorithms and processes for computing these alignments. Affine 3D transformation matrices are used to describe linear transformations as in FLIRT (Jenkinson et al., 2002
). Non-linear coregistration routines, as used in SPM (Ashburner et al., 1999
) and FNIRT
16
, provide nonlinear, one-to-one coordinate mapping between data sets.
Data overlay in some existing packages is also limited by the resolution of the inputs. In FSL’s current FSLView, for example, MRI data with a voxel resolution of 2 × 2 × 2 mm3 cannot be overlaid onto a data set with a 1 × 1 × 1 mm3 resolution, even if the data sets are defined in the same coordinate space.
The second key objective of DV3D is to enable users to align different data sets into a common reference space. As DV3D is not an analytical tool, we will refrain from calculating alignments on the fly. The alternative is to facilitate alignment by providing tools to load previously calculated transformations from other software packages. Additionally, once data sets are aligned, the resolution of the data sets should already have been interpreted and processed accordingly to allow sensible overlay and corresponding scaling.
Co-Registration with Atlases
Neuroimaging analysis results often describe spatial distributions of significant activity in the brain. These maps are typically overlaid in 2D onto an individual or group brain data, as in Figure 1
A, so that this spatial distribution can be seen.
In addition to viewing data in an individual or across a group, it is common practice in many neuroimaging data modalities to compare these spatial distributions to equivalent positions, and thus brain structures, in some reference brain space. These reference brains, or atlases, include the MNI brain (Mazziotta et al., 2001
), the Talairach brain (Talairach and Tournoux, 1988
), the Harvard-Oxford cortical and sub-cortical structural atlases
17
and the ICBM-DTI-81 white-matter labels atlas (Wakana et al., 2004
). At the time of this submission, the current version of FSLView cross-references and reports information for the equivalent structures in all of the above atlases if the data set loaded has been transformed into the MNI coordinate space. An alternative for users not using FSLView would be to transform their data into the MNI coordinate space and then use the online MNI-Talairach daemon
18
to manually check every point of interest – a more time-consuming process.
Incorporation of functionality to allow cross-referencing with other standardized brain volume data is thus the third key objective of DV3D. The ability to do this in real-time, without any additional software dependencies is also preferable.
Export Routines for Sharing and Publication
The production of informative, high-resolution images for communication of results in publications, presentations and educational material is a fundamental requirement in neuroimaging. Many neuroimaging data analysis packages have export routines to capture screen contents to static reports, individual frames to high-resolution images and even short movies of rotating 3D objects or time-series data. Researchers using a specific analysis package can also share data sets with each other. By providing another user with a data set and a set of instructions, the secondary user can reproduce the same analysis or visualization result.
As a fourth objective, DV3D should facilitate the export of data from the visualization screen to a number of formats with options for control of resolution. Movie export options should allow users more freedom in terms of temporal and spatial interaction with data visible on the screen. DV3D should also provide a functionality for users to share results, even without having to provide raw data sets from which the results have been produced.
An Efficient Working Environment
Analysis of neuroimaging data can be a very labor-intensive process. Visualization and interpretation of obtained results adds significantly to this workload. Any functionality that saves the user a significant amount of time and effort is valuable. Many approaches can be taken to increase the efficiency of processing pipelines in software. Perhaps the most obvious is to ensure that, at the design stage, the processing pipeline for a software package is optimized for the hardware and software framework it is built on.
Current computing gives researchers access to multiple processors that can handle computations independently or in parallel. Many computing facilities extend this model to computing clusters with multiple nodes across which processes can be distributed or parallelized. Access to parallel processing is already a feature of a few of the existing neuroimaging software packages. FSL’s Bayesian Estimation of Diffusion Parameters Obtained using Sampling Techniques (BEDPOST) toolbox
19
, for example, can be easily configured to run over Sun Grid Engine
20
, or even simply distributed across any additional local processors.
While parallel processing in the context of BEDPOST is utilized to reduce the amount of processing time required to generate results, the principle can be applied to computationally expensive visualization routines when viewing results. Loading surfaces with millions of vertices and rendering them is an example; a user wanting to load multiple surfaces into memory may still have to wait in the order of minutes for them to load and render. While computers have increasingly large amounts of memory, allocation and management of memory is still a problem that any software designer needs to take into account. This is especially poignant when handling neuroimaging data where data sets can be very large. It is common for MEG data sets acquired at high sampling rates to exceed 1 GB in size. Memory allocation errors are often terminal, causing a computer program to crash if allocation fails. This can be both frustrating and inefficient.
Many of the analysis routines applied to neuroimaging data are repetitive; analysis of data from each individual in a group is an example. Automation of processing streams for similar data sets is an increasing feature in neuroimaging data analysis. Users often use scripts to pass list of arguments and settings into a program that can be accessed via a command line. This can help to reduce the overheads associated with repetitive GUI interaction. In this way, a researcher can apply the same processing, thresholding, and result export routines for each individual in a large group with a single file and a single button press, even if they then do have to wait several hours for the process to complete. This principle can be a useful feature for the visualization of results. A user may want to, for example, provide an instruction list to a program to load a particular surface, overlay a statistical result file, threshold to a specified value, export a high-resolution image from a top-down view and save a movie. The user would then have a template to process different statistical results, different thresholds, or simply different participants without having to manually run each individual through a GUI.
Some software packages help to increase user productivity by saving metadata files that describe the current status of the workspace the user is working in. The MATLAB toolbox, mrVista, is a good example. In this package users have a session file for each individual. Many settings, file paths, and associated analysis outputs are automatically loaded for the user the next time they load a previously processed participant’s data. Evidently, a metadata file describing the processes applied to a data set, its overlays, and dependent thresholds is potentially time-saving when dealing with the visualization of neuroimaging data sets. Furthermore, such a file could easily be shared with another researcher to ensure a consistent result when viewing the same input data.
Saving of processing metadata and automated processing scripts both provide a reference which describes the processes and routines used to produce a set of results. The use of scripts to drive analysis and visualization routines decreases the chances of inconsistencies due to user error. Provenance, the description of the history of a set of data, is important with the recent increases in cross-site collaboration and data sharing (e.g. Mackenzie-Graham et al., 2008
). The LONI Inspector
21
, an application for examining medical image files, is an example of a tool developed for the comparison of the metadata stored with and between different file types. Metadata is particularly informative when files are converted from one format to another. Assumptions about default orientations, for example, can cause left-right flipping of the data during the conversion process and can cause errors in subsequent visualization and interpretation.
Access to parallel processing, command line scripting, session or workspace metadata and efficient memory management are all ways in which a neuroimaging visualization tool can increase user productivity. As such, the fifth objective in the development of DV3D is to utilize a software and hardware framework that encompasses as many of these features as possible.
A Flexible, Scalable and Accessible Open-Source Framework
An open-source software package with a self-supporting user community can be a viable solution for scientific software development. With a community contributing to code development and maintenance, costs can be minimized. Other factors need to be considered when developing useful, sustainable open-source software packages.
Transparency is a factor that concerns many researchers, although this is more often related to the implementation of analysis algorithms. While there is very little analysis per se in stand-alone visualization packages, researchers should have access to processing routines that generate the visual output (e.g. the color lookup tables applied to thresholded statistical overlay data and interpolation routines applied to loaded data).
Accessibility of the code base can be an issue that restricts interested users from understanding and developing programs. At least three factors can be considered to affect the accessibility of software:
• Educational resources are crucial to aid users in learning how to use a package. Documentation and tutorial routines are often lacking in software packages restricting the range of potential users.
• Platform independence is an increasingly common feature in neuroimaging software packages. Software that runs on any hardware platform is not only more accessible to any individual site, but aids collaboration across different sites with potentially different hardware infrastructures.
• Coding language. Some coding languages are more complex and / or less intuitive than others. While it is impossible to provide a coding language that every programmer would like, it may be sensible to settle for a compromise between a language that is simple to read and use, and one that is very powerful and efficient.
Extendibility and flexibility of software is a measure of how easily the software can be expanded to incorporate additional processing routines. Since the authors have not set out to predict every possible permutation of input-to-output requirement of potential users, it is crucial that the software framework is designed to facilitate incorporation of additional routines with minimal effort. A modular software framework not only facilitates such independent development, but allows for incorporation of appropriate tools and routines often developed for completely different purposes. We could, for example, choose to incorporate an implementation of an algorithm for decimating surfaces, borrowing the code from an external mathematics toolbox. Once imported into the package as an independent module one could simply pass a brain surface to this module as a set of vertices and run the module to down-sample the number of vertices for increased rendering speed.
DV3D has been designed with an open-source, user community developed model in mind. As such it is imperative that the package is built on a software framework that is accessible to a wide variety of users on a wide range of hardware platforms, extendible by non-specialist developers, intuitive to use, and well documented.
Having outlined the key objectives for a new multi-modal neuroimaging data visualization tool, we can now consider the implementation of the project. The software package can be considered to consist of three main components:
1. The visualization engine: this is the lowest level of the program, i.e., the functions that actually do the rendering of the images to the screen.
2. A user interaction interface: this is the component of the program that allows users to control the rendering routines of the visualization engine in an interactive and intuitive manner.
3. A master control program: the component of the program that binds or wraps the functionality of the underlying components and allows them to run on the operating system.
We will discuss each of these components in turn, highlighting the requirements and implemented solution for each.
The Visualization Engine: VTK
The Visualization ToolKit (VTK) is a widely used, free, open-source software package for data visualization and image processing, with support for 2D and 3D graphics rendering. With an active and vast international development community, VTK is a model for open-source software development.
VTK has an extensive set of implemented visualization algorithms. Routines for processing scalar, vector, tensor, texture, and volumetric methods exist. VTK offers a large variety of complex algorithms as part of the standard toolkit, many of which are directly useful for visualizing neuroimaging data. Contouring, surface decimation and triangulation, re-sampling, cutting, and interception detection are just a few examples. Many of these algorithms are directly integrated into widgets allowing users to interactively interrogate combinations of 2D and 3D data in real time. VTK is licensed under the BSD license. VTK is reported to have been installed and tested on nearly every Unix-based platform, Windows PC, and Mac OSX Jaguar or later. VTK is an efficient and fast toolkit consisting of an extensive C++ class library, access to which is available via several interpreted interface layers including Tcl/Tk, Java, and Python.
User Interface: wxWidgets
Learning to use a new software package can be challenging. In a program with a number of complicated functions, the provision of a highly interactive GUI and familiar workspace environment should benefit the user. wxWidgets is a free, open-source toolkit that provides developers with an API (application programming interface) for writing GUI applications on multiple platforms. wxWidgets is licensed under the wxWindows license, essentially the L-GPL (Library General Public License), with an exception stating that derived works in binary form may be distributed on the user’s own terms. By using each platform’s own native controls rather than emulating them, wxWidgets applications look and feel familiar to the operating system’s, and should thus be immediately more familiar to the user. The list of widgets and features offered is extensive and the code base is very mature. wxWidgets can be called via interface layers for a variety of languages including C++, Python, and Perl.
Either C++ code or Python could be used to produce a program with a GUI in wxWidgets containing a VTK window for rendering. The relative ease of use of Python over C++, combined with the large array of readily accessible functionality offered by Python, makes this the preferred choice for our application.
The Master Environment: Python
Python is a dynamic, object-oriented programming language that is reported to run successfully on Linux, Windows, FreeBSD, Macintosh, Solaris, and other operating systems. Since Python is an interpreted language, it internally converts and translates source code into the native language of the computer and then runs it. Once Python has been installed on a system, users do not have to compile a Python program or worry about library linkage and loading. Python programs are portable: copying the source code from one operating system onto another (which has Python installed) will allow the software to run.
The Python-specific Python license is compatible with GPL licensing. Python is distributed with extensive standard libraries. The list of functions implemented in Python is extensive. Additional modules for Python include a number of mathematical, numerical methods and plotting toolboxes that are useful for manipulating numerical lists and arrays, before passing data into VTK for rendering. Some Python modules support parallel processing and threading often with as few as three lines of additional code (an example is provided in Figure 10
). Modules allowing access to system command calls and environmental variables are abundant, allowing the user to spawn and even control external processes and applications from within the Python environment application. Python supports integration with other languages and tools (including wxWidgets and VTK), which are often loaded by nothing more than using the import command.
Python and individually distributed toolboxes can be built from source and installed independently. At the time of this submission an increasing number of developers are producing binary installers for entire Python distributions with many core modules including VTK. Using the academic download of the Enthought Python Distribution
22
, users on Windows, Mac OSX, or RedHat Linux have access to a ‘one click installation’ of the Python framework required to run DV3D.
In short Python was chosen over C++ for the development of DV3D because of its relative ease of use, the vast array of additional functionality available, and because it allows access to the core underlying components (wxWidgets and VTK) in a single programming language.
Dependencies and Installation
Dependencies
For the reasons we have already discussed in detail above, DV3D is designed to be as platform independent as possible.
DV3D has few software or hardware dependencies and requires only the following to run:
• Python 2.4.1 or later
• wxPython 2.6 or later
• VTK 5.0.3 or later
• The Numpy module for the appropriate version of Python installed
• A Windows, Mac OSX, or Linux platform.
Installation
We have already outlined that Enthought provide a binary installer for Microsoft Windows, Mac OSX, and RedHat Linux. Use of these installers provides a comprehensive build of the core components and additional modules required to run DV3D. Use of the Enthought installers is currently free for academic use. Users with platforms not supported by these installers can often find binary installers for the individual components on operating specific support sites. All modules can be built from source on platforms by users wanting additional installation options and control.
Data Import
Supported Formats
DV3D currently supports the following formats:
• DICOM. Digital Imaging and Communications in Medicine is a standard for handling, storing, printing, and transmitting information in medical imaging
23
. Many MRI scanners now export their data directly to this format. The DICOM format provides private header fields that can be utilized to store additional scan information. Unfortunately many sites now use these fields in a non-uniform manner (according to the DICOM standard). Different DICOM readers do not always correctly interpret metadata describing data acquisition and storage protocols in the file. DV3D addresses inconsistencies in DICOM headers by adjusting the DICOM reading routines provided by Python to specific scan protocols and scanner types.
• ANALYZE™ (.hdr and.img) is an image processing program developed by The Biomedical Imaging Resource at the Mayo Foundation. This program uses the ANALYZE™ format (www.mayo.edu/bir/PDF/ANALYZE75.pdf) which is currently widely used in neuroimaging. Many programs (including FSL, SPM, AFNI, Cox, 1996
, FreeSurfer and MRICron) are able to read and write the format. The files typically store voxel-based volumes in two files: the binary data itself is stored with a filename extension.img; another file acts as a header (.hdr) describing information about the data such as voxel size, slice numbers and data origin. As with DICOM, some software packages use the ANALYZE™ format header in different ways. Some software packages interpret ANALYZE™ volumes differently due to differences in header writing conventions across sites. DV3D addresses inconsistencies in ANALYZE™ headers by adjusting the reading routines to detect which program was used to produce the file (where possible).
• NIfTI-1 (.nii or.nii.gz) is an adaptation of the ANALYZE™ 7.5 file format
24
. NIfTI-1 uses unassigned spaces in the ANALYZE 7.5 header to add several new features. Since it is possible to compress data stored in NIfTI-1 files the nii.gz file format is often utilized. DV3D supports the.nii or.nii.gz file formats.
• GIfTI (.gii). Support for the unified XML-based GIfTI file format
25
is provided.
• VTK polydata files(.vtk). VTK provides routines for exporting objects in memory to its own native polygon data files. Additional routines allow these objects to be read into VTK applications at a later date. This offers an incredibly useful tool for users wanting to save objects created in a VTK session for sharing or later access without the need for regeneration. DV3D offers visualization routines for.vtk files in binary or ascii format.
• OFF (.off). The Object File Format is described by the Geomview package
26
. It is used to represent collections of planar polygons with possibly shared vertices. This is a useful format used to describe surfaces by programs including SurfRelax (Larsson, 2001
). DV3D offers visualization routines for.off files in binary or ascii format.
• FREESURFER surfaces (lh.* and rh.* are examples). Surfaces generated by typical default processing in FreeSurfer include left and right hemisphere cortices representing the white matter and grey matter surfaces, with anatomically correct and inflated versions. DV3D offers support for these standard surfaces and additional surfaces generated by post-processing routines (an extracted scalp for example). DV3D is also capable of handling additional scalar descriptors for these files, including curvature values. DV3D offers visualization routines for FreeSurfer files in binary or ascii format.
• 4-D Neuroimaging (4DNI) MEG data (.m4d). Creation of a.m4d file using the pdf2set program allows direct reading of 4DNI MEG data. DV3D currently supports the 4DNI output format, but could easily be extended to support other MEG and EEG time-series formats.
Although many of the formats discussed above have a standard description, i.e., a set of instructions for file creation designed to maintain conformity across sites, not all packages use these formats to read and write files in the standardized way. There will always be corner-cases where the readers used to import data into DV3D may fail. Fortunately, the previously discussed power of Python allows developers to easily amend existing readers or write new ones to handle these inconsistencies. Users are actively invited to submit failing data sets with descriptions of acquisition parameters and header formats so that current readers can be amended or new readers developed.
Supported Software Packages
Since DV3D currently supports all the data formats outlined above, it should, in theory, support at least some of the formats from a wide range of existing neuroimaging analysis packages. Any package capable of writing these formats could be used. This is not so simple in practice, as we have alluded to in the Section ‘Supported Formats’ of this paper. There are complications when different sites and packages adopt varying standards for data export to specific formats. We look forward to collaborating with sites with additional data sets in order to resolve as many of these disparities as possible.
Program Processing Pipeline
On startup, the user can choose to launch DV3D in one of two modes.
• MRI-overlay mode. This mode is traditionally used where a ‘base’ MRI volume is initially loaded. Other objects aligned to the coordinate space of this volume can then be loaded and overlaid onto the base volume. The ‘base’ MRI volume thus defines the coordinate space into which additional objects are loaded.
• Non-overlay mode. The user can choose to not load a base volume. In this case the program will launch with an empty renderer and pre-created 2D or 3D objects can be loaded by the user.
A graphical representation outlining DV3D’s processing pipeline is shown in Figure 3
.
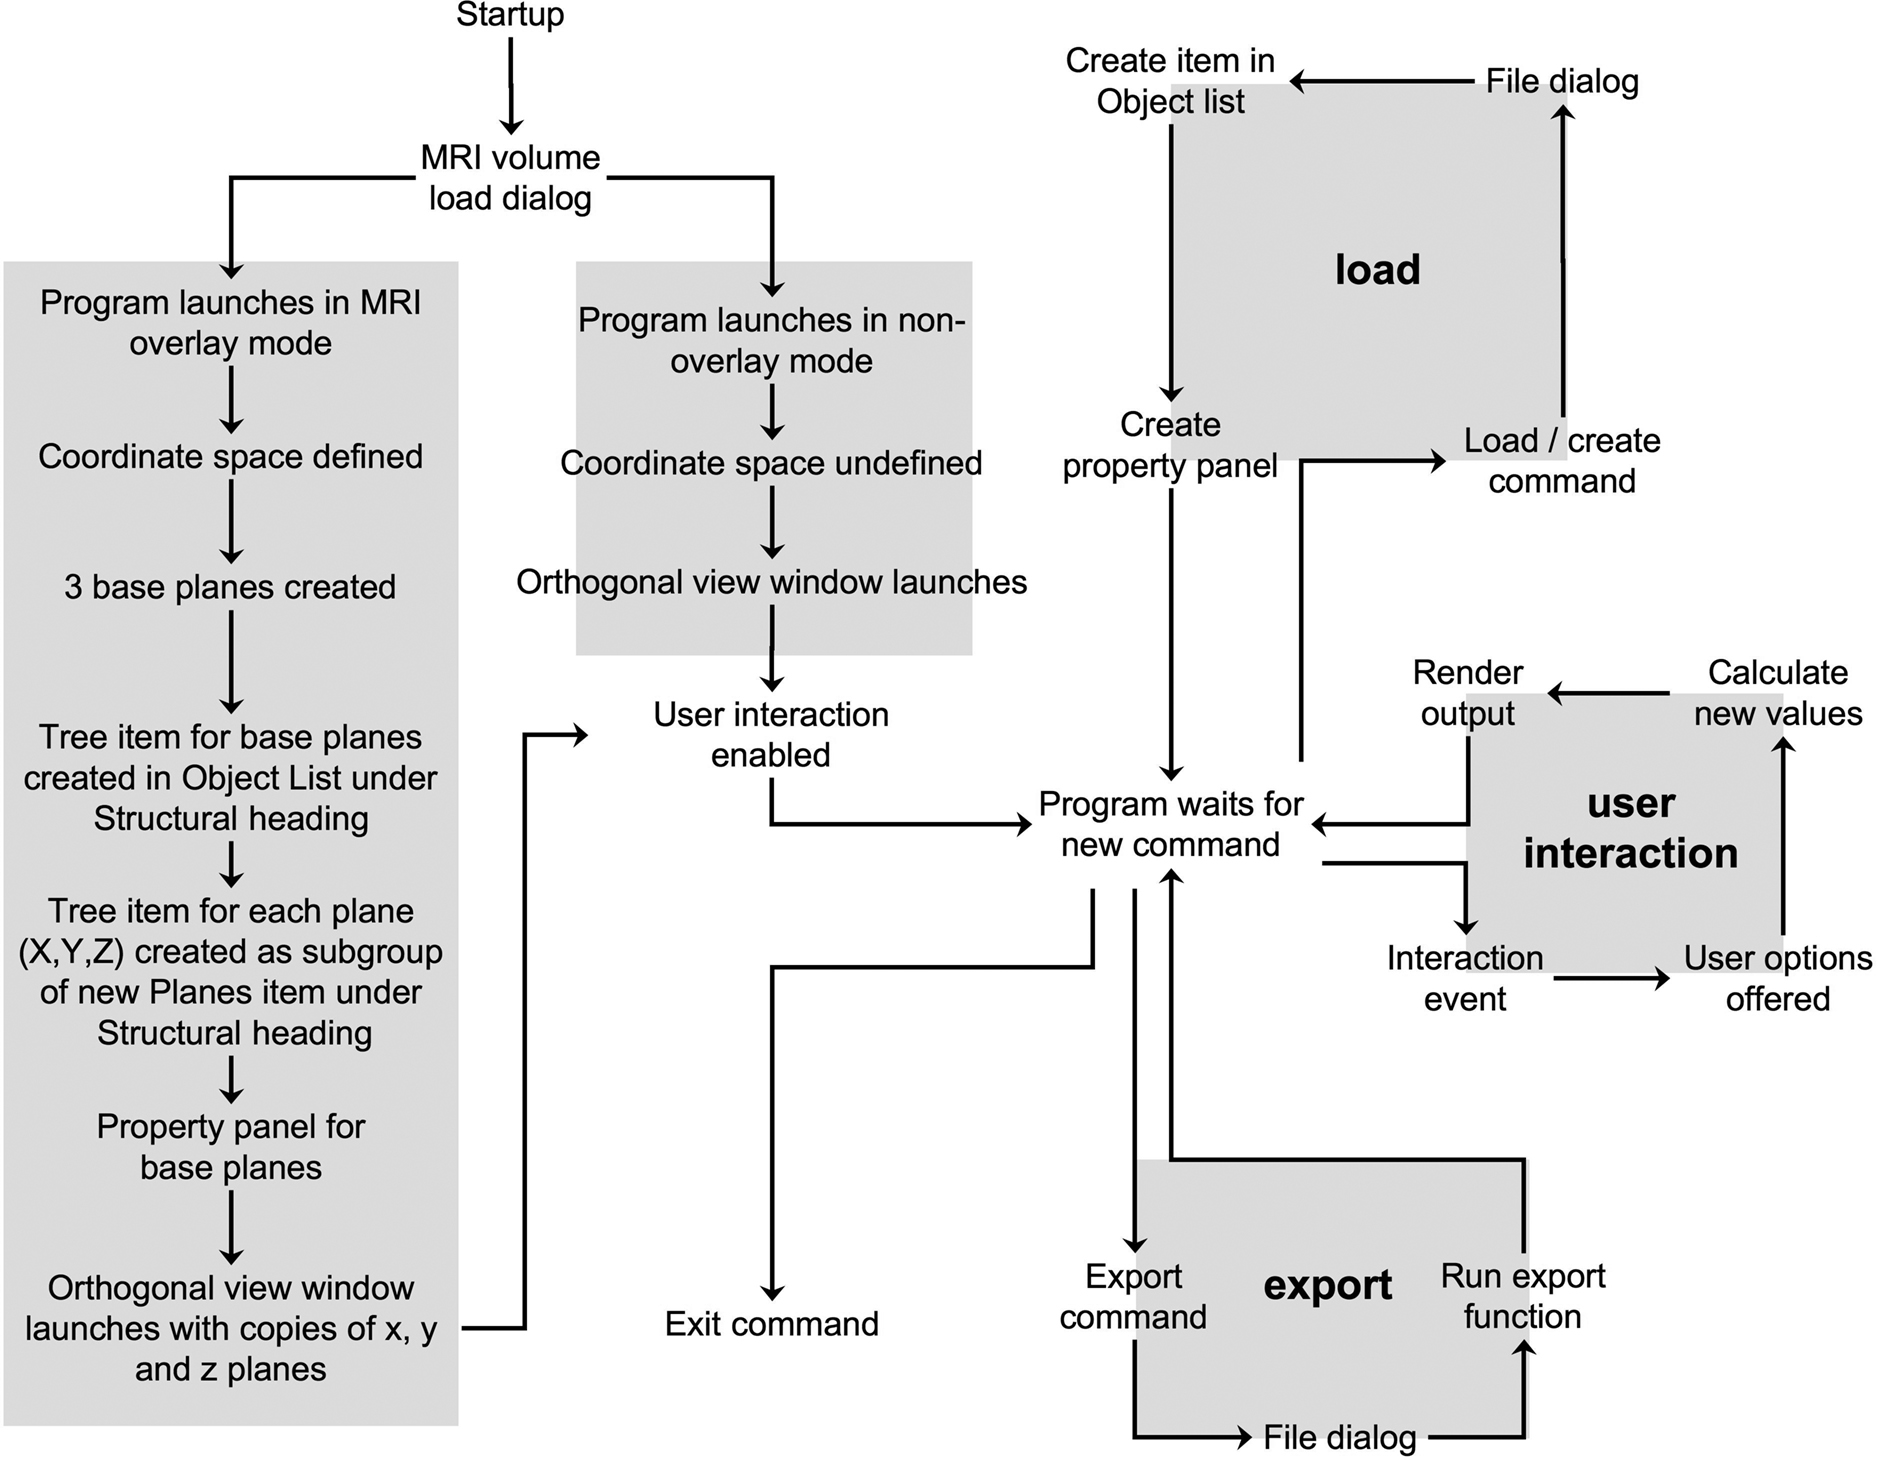
Figure 3. DV3D processing pipeline. A schematic representation of the processing pipeline of program startup, data loading and export user events in DV3D.
DV3D is accompanied by user documentation, example data sets and tutorial videos. Links to this information are provided in the Supplementary Material section of this paper. The fine detail describing interaction with the application is described in these documents and tutorials. Here instead we will discuss the broad concepts and functions of the program, and how they satisfy our design objectives.
Design Objective: A Common Space for Multiple Data Types
DV3D’s Workspace
DV3D provides a single, common workspace for viewing neuroimaging data, simultaneously in 2D and 3D. The main workspace environment of DV3D consists of two windows:
Main application window (Figure 4
). This window is divided into quadrants:
• VTK window. The bottom-right quadrant holds the wxVTKRenderWindowInteractor, the VTK class that allows a functional VTK session to be embedded in a wxPython program. We will refer to this as the VTK window. When data objects are loaded into or created by DV3D they are added to this window. The VTK window is the core tool allowing us to provide a common space for simultaneous multi-modal data overlay.
• Button Panel. The top-right quadrant is constructed from a wxNotebook object that we will refer to as the Button Panel. It consists of a number of pages which each contain a panel of buttons and widgets which allow the user to interact with the VTK window. A tab labeled with the title of the panel denotes each page. Each page is brought to the front by clicking on its tab. Pages group functions of similar types together for ease of navigation. The Button Panel can be extended to have many more pages, allowing for a multitude of additional functions to be added to DV3D at a later date without excessively cluttering an individual button page. Potential developers will also be interested to note that each page here is derived from a separate class allowing easy parallel development and integration.
• Object List. The bottom-left panel holds a wxTreeCtrl that we will refer to as the Object List. It displays its items in a tree like structure similar to many operating systems’ file browsing dialogs. An item may be either collapsed (meaning that its children are not visible) or expanded (meaning that its children are shown). Whenever a new object is loaded into the program or generated by one of DV3D’s routines, a tree item is added to this list. In addition to this, a property panel is created for each new object. This panel has a number of different buttons and tools used to manipulate the display properties of the objects in the VTK window. Since a unique item identifier identifies each item in the tree, it can be linked to the object in the VTK window. This allows us to manipulate some of the properties of the object in the VTK window associated with a specific item in the Object List simply by clicking on the object in the list. Each item has its own (optional) icon and a label. Users can simply rename the item in the tree to a more meaningful string without losing the interaction with the associated object in the VTK window. The Object List offers an intuitive and efficient tool for managing the content of the VTK window.
• Message Dialog. The top-left quadrant, which we will refer to as the Message Dialog, holds a wxTextCtrl. This object is effectively a text box that is updated with information for the user as the program is used. Interaction coordinates from the VTK window (bottom right quadrant) are displayed in the Message Dialog if a base MRI volume is loaded.
• Sizers. A vertical and horizontal sizer bar define the boundaries of the quadrants. Clicking and dragging these sizers allows the user to alter the relative sizes of the quadrants of the Main application window.
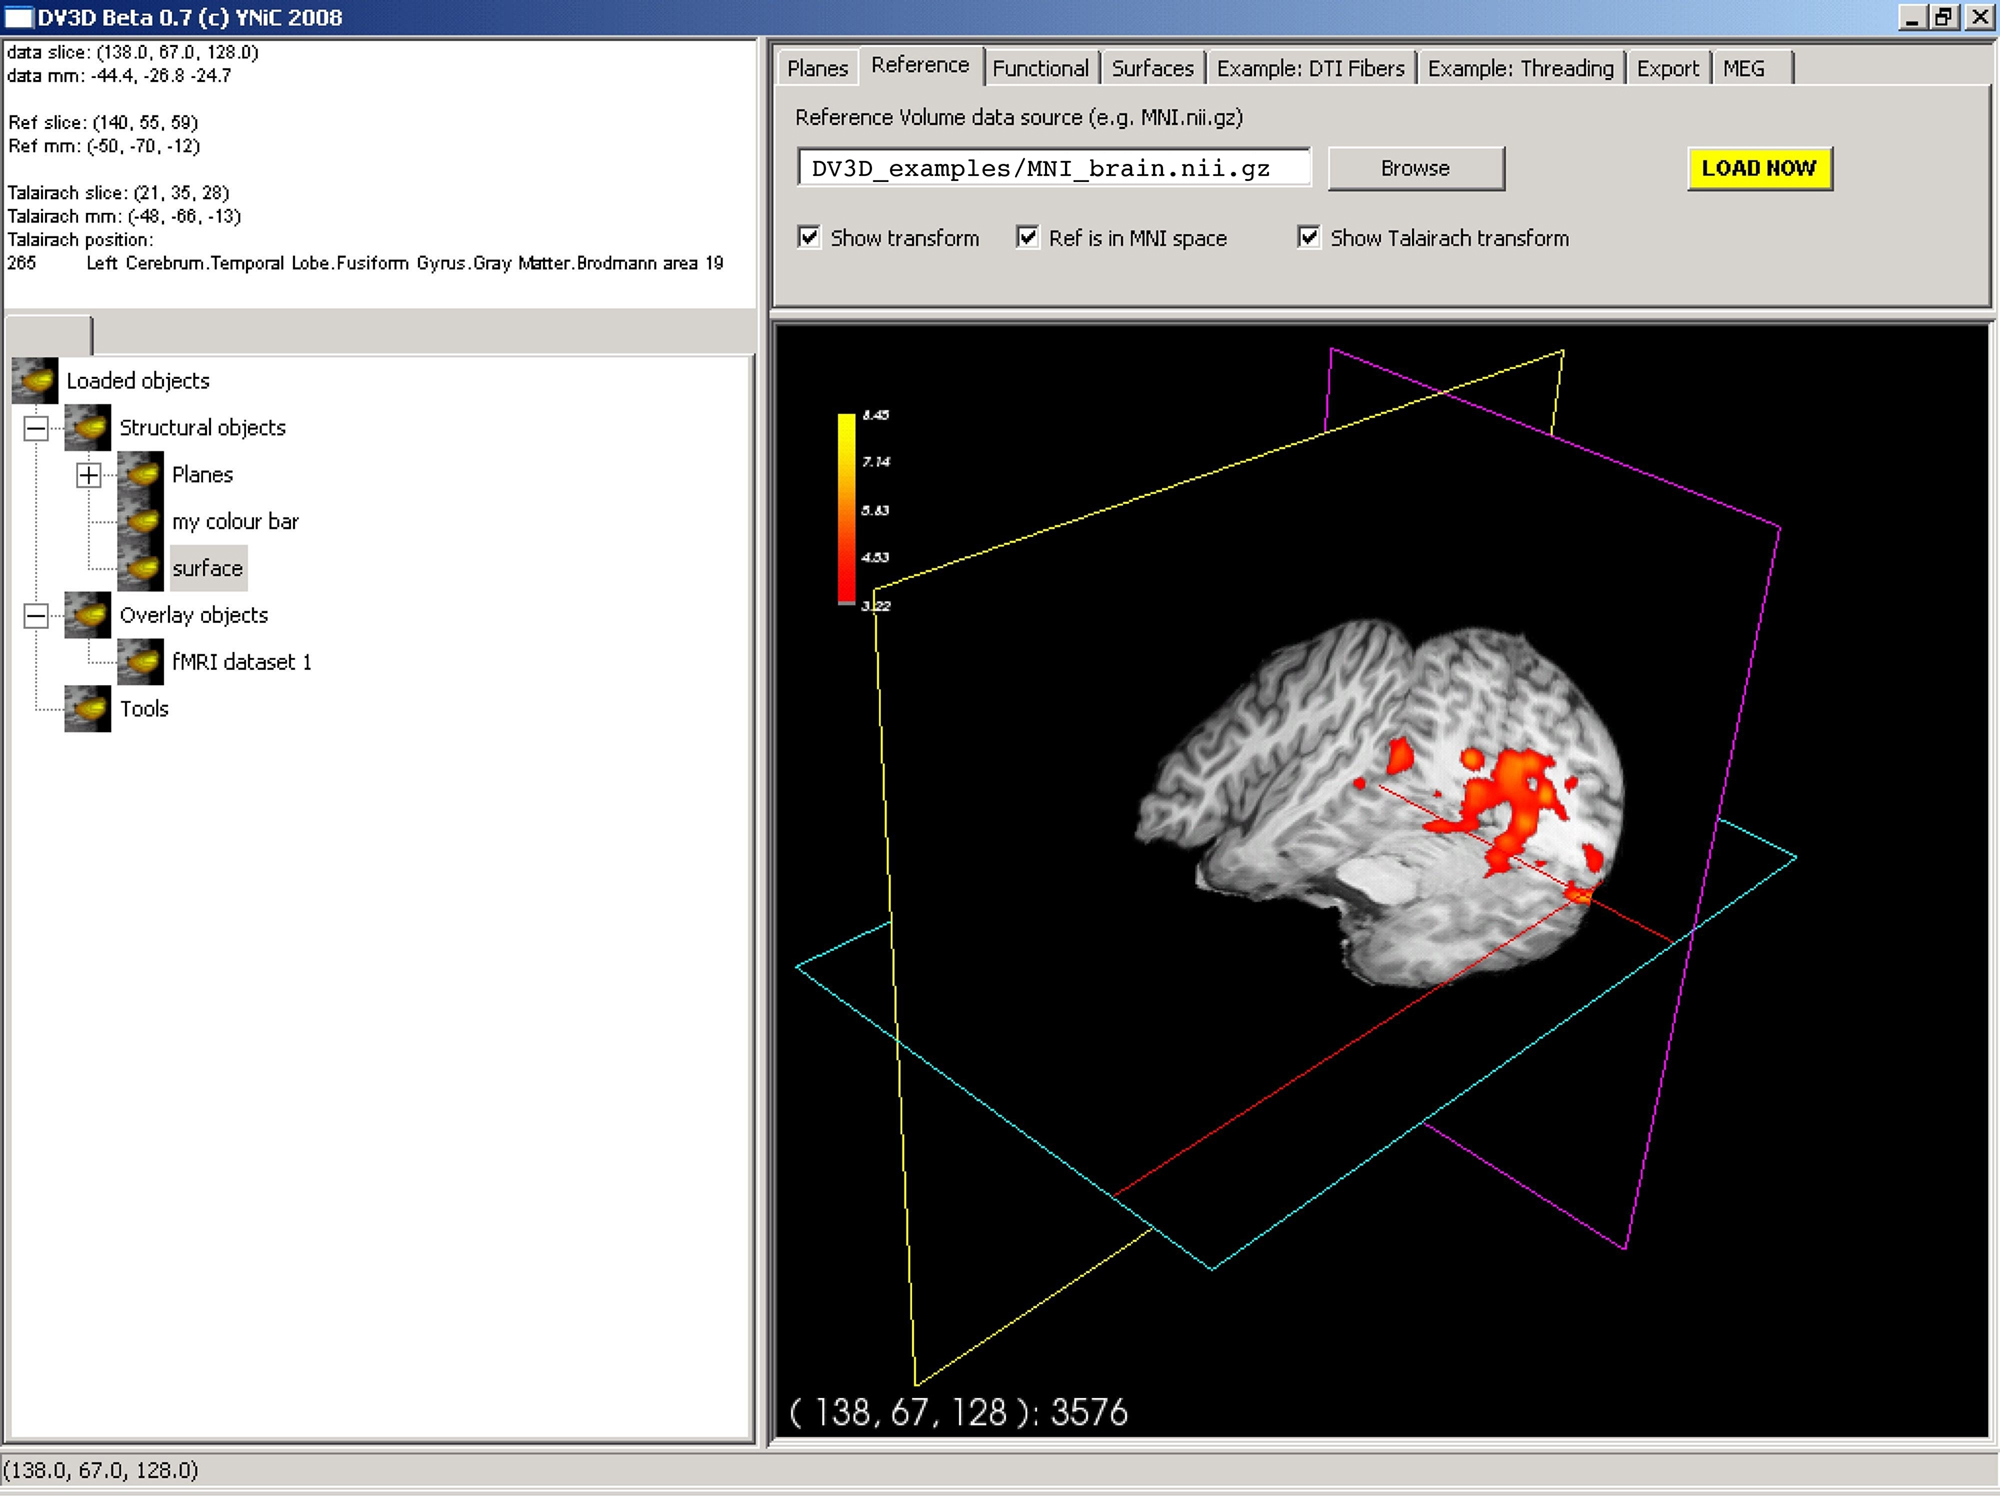
Figure 4. DV3D’s main application window. The main window for data interaction in DV3D. The bottom-right quadrant holds the VTK window where all 3D rendering takes place. The top-right holds the Button Panel, which consists of multiple sub-pages allowing a large array of user interaction functions. The top-left quadrant holds the Message dialog which displays the current coordinates of the interaction cross hair in the VTK window. The bottom-left quadrant holds the Objects List: a list of all objects loaded in the the VTK window. Panels can be resized by clicking and dragging the vertical and horizontal dividers between each panel. Views in the VTK window are neurological by convention.
The Main application window’s VTK window allows us to display multi-modal data, whilst the Button Panel, Object List and object associated Property Panels allow us to manipulate the properties of the displayed objects.
In addition to the 3D viewing capabilities of the VTK window, DV3D provides traditional 2D orthogonal views of the 3D window via the Orthogonal view window. This window consists of three orthogonal projections of the VTK window’s content. The options panel in this window allows the user to set the refresh frequency of the viewports, increasing program performance. Plane orientation and placement of the viewpoints is also fully customizable.
Viewing Conventions
It is important to make the default visualization conventions of DV3D clear at this stage.
Radiological vs. neurological. Data viewed in the 3D VTK window of the Main application window is rendered according the neurological convention as described by FSL
27
. Data viewed in the 2D Orthogonal view window also conforms to the neurological convention, but can be switched to the radiological convention.
Perspective vs. parallel projection. To make 3D visualization more natural, the VTK window utilizes a perspective projection algorithm during rendering to infer depth in the scene. Since the planes in the Orthogonal view window are effectively 2D we refrain from using this algorithm (since it carries some processing overhead) and revert to parallel projection.
Aligning Different Data Sets
Transformations. DV3D allows the user to add different data sets of different types into the same coordinate space (the VTK window). Data is loaded into a millimeter coordinate frame defined by the data set’s header description (e.g. the sform or qform matrices held in the header of NIfTI-1 files). By using header transformation matrices, DV3D can automatically align data. Alternatively, the user can provide additional affine transformations (4 × 4 matrices) to apply previously calculated alignment parameters (typical examples include affine transformations provided by FSL’s FLIRT when coregistering an individual MRI to the MNI brain). This principle applies to any volumes or surfaces loaded. DV3D does not currently calculate new transformations, but rather handles those pre-calculated in external analysis packages.
Resolution and scaling. Unlike many other visualization packages (e.g. FSLView), DV3D does not require MRI data to be at the same resolution. DV3D uses a millimeter coordinate space. All data loaded into the VTK window are scaled according to the header information (e.g. the pixdim values in ANALYZE™ and NIfTI headers describe the voxel dimensions).
Design Objective: Dealing with Different Data Types
Viewing Volume Data in 2D and 3D
The vtkImagePlaneWidget is the core tool utilized by DV3D to display and interact with volumetric MRI data and associated overlay volumes. This widget works by creating a plane that can be interactively placed in an image volume. Readers may ask why a 2D tool is incorporated in a 3D data viewer. VTK allows the user to manipulate this plane in real time, using the third dimension to tilt, rotate, or translate the plane in virtually any orientation. Thus a 2D plane becomes a diverse data exploration tool. Figure 5
A shows a set of planes created for an MRI data set. The functionality of the vtkImagePlaneWidget is described in detail in the tutorial examples and documentation. In short, it offers the following functionality:
• Coordinate lookup. DV3D captures the slice number data displayed by the vtkImagePlaneWidget and uses it to calculate the equivalent millimeter coordinates in the underlying data set. The slice number and calculated millimeter coordinates are then displayed in the Message Dialog of the Main application window. Figure 5
B shows the lookup cross-hair activated in the plane.
• Interactive volume re-slicing. The core functionality of the widget relies on the vtkImageReslice class that takes the image volume data as an input, re-slices (or ‘reformats’) it as required and then passes the output to the texture mapping pipeline. This tool allows real time slicing through volumetric data at virtually any angle. Figures 5
C–E show this functionality in action.
• Brightness and contrast. In addition to rotation and translation of the planes, it is also possible to change the windowing and level of the data. This effectively adjusts the brightness and contrast of the data displayed in the window. Slider style controls are provided to control the absolute values of the window width and level for more precise user control. The default behavior allowing the mouse to control window width and level can be re-enabled in User Preferences.
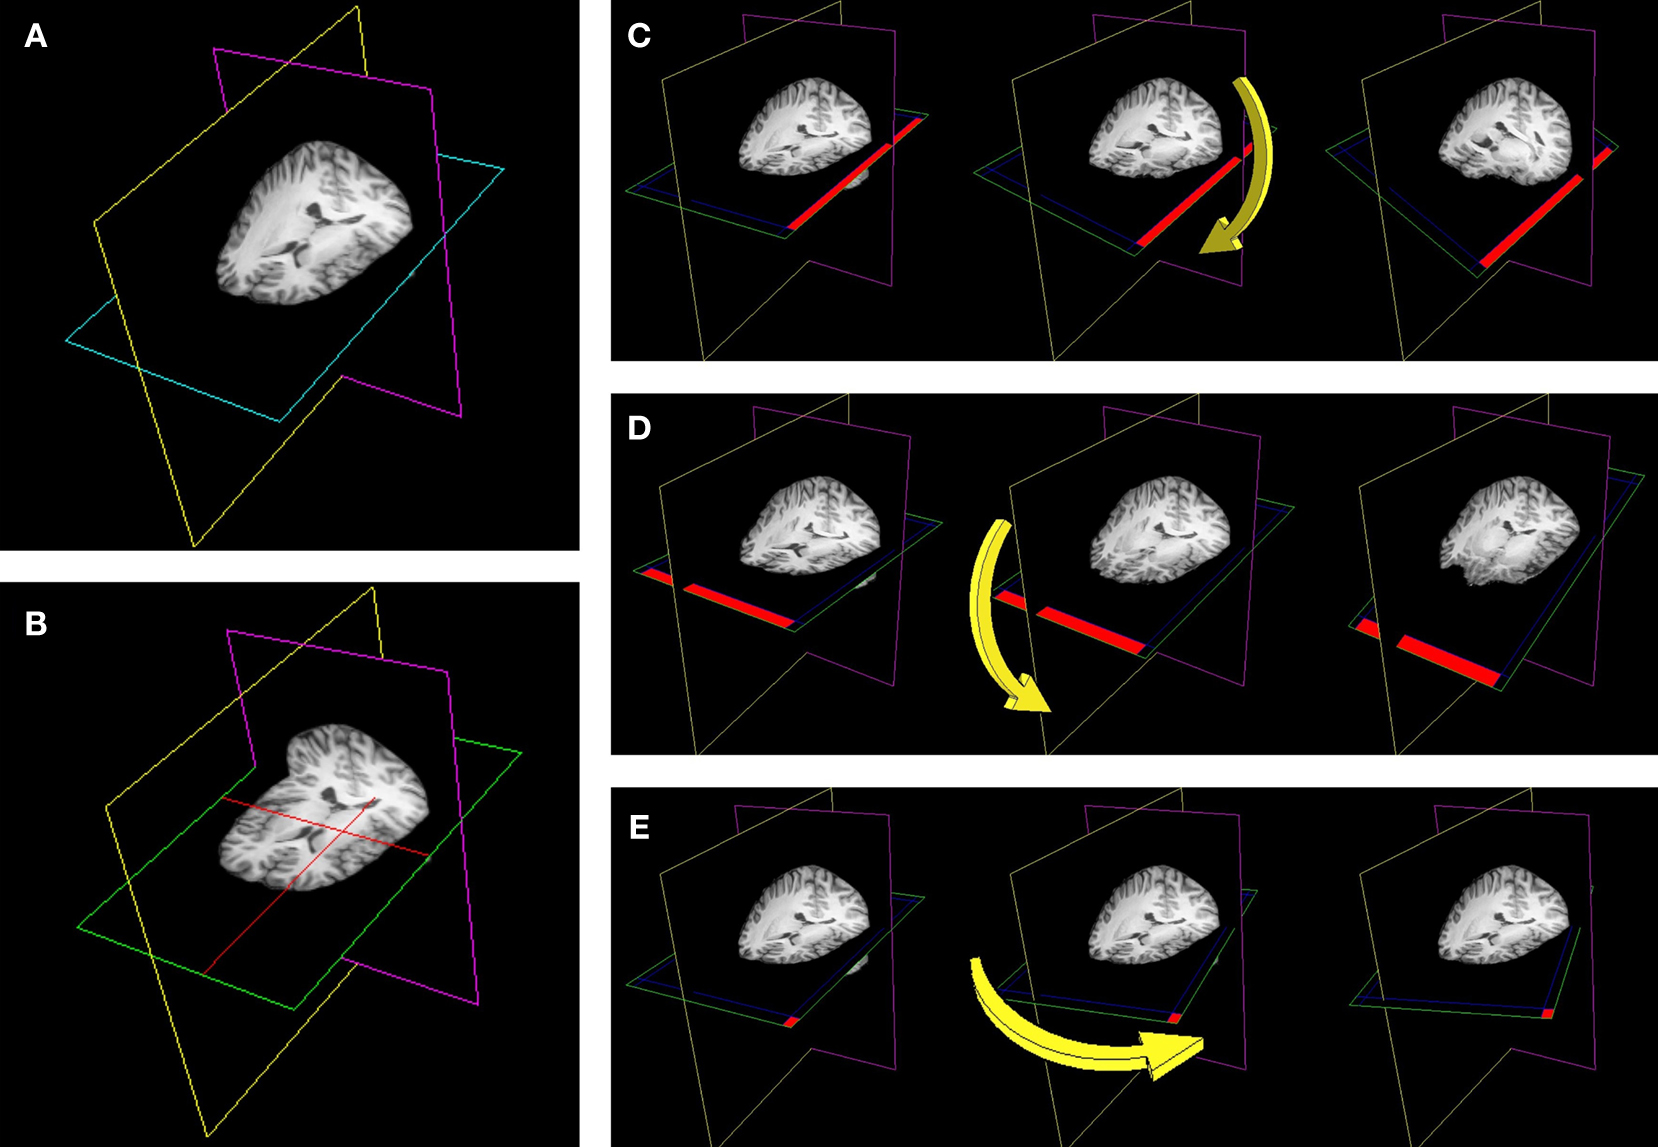
Figure 5. The use of plane widgets to show 3D volume data. (A) A set of three orthogonal planes, each intersecting a single 3D MRI volume. (B) Left clicking on any one plane with a mouse will make a cross-hair visible (in red) allowing data from a specific coordinate in the data set to be displayed. Real-time reformatting of data (re-slicing it in any plane direction) is possible by tilting the planes around their current origin. (C) The axial plane is rotated around the y-axis by clicking on the edge of the plane (show in red) and moving the mouse. (D) The axial plane is rotated around the x-axis by clicking on another plane edge (shown in red). (E) The axial plane is rotated around the z-axis by clicking in the corner of the plane (shown in red).
Using multiple vtkImagePlaneWidgets, DV3D allows simultaneous overlaying of statistical data in 2D. Once a base volume has been loaded and its planes have been created, additional volumes can be loaded and overlaid onto this volume. The overlay load routine is accessed via the Functional tab on the Button Panel. Overlay volumes currently have to be transformed into the coordinate space of the base volume but do not need to be at the same resolution. For every overlay volume loaded, an additional set of planes is created; one for each axis in the VTK window and one for each axis in the Orthogonal view window. The overlay data is initially assigned a yellow (for its minimum value) to red (for its maximum) color lookup table before it is rendered. As with the base image planes, two additional objects are created: an Object List label and a Property Panel. Sliders control the window width and window level of the overlay layer only, i.e. the effective scalar range for the data that are visible in the overlay layer. This acts as a real time 2D and 3D statistical thresholding tool. The color map currently in use can also be altered using the color map selection dialog.
Viewing 3D Surfaces
DV3D provides methods for loading and generating surfaces for display in the VTK window. Surfaces are created in memory as vtkPolyData objects, which have a number of native properties that the program is able to manipulate to increase user interactivity. Examples include access to the global transparency and color properties of the object. These properties can then be altered using the property panel automatically created for any surface loaded or generated.
Loading surfaces. Surface load routines are accessed via the Surfaces tab on the Button Panel. Clicking the Load button opens a file dialog offering the import of a number of different file formats. Surface inputs currently supported by DV3D include:
• FreeSurfer output surfaces (including inflated surfaces).
• SurfRelax output surfaces in the Geomview binary.off file format.
• mrVista.mrm outputs.
• vtkPolyDataWriter output files (.vtk).
• Any surface exported to the GIfTI format.
Once the surface load dialog completes the object is loaded and automatically added to the VTK window and the Orthogonal view window. The automatically generated property panel will also be displayed.
Generating surfaces. VTK provides techniques for dynamically generating surfaces from volume data in memory. DV3D uses the vtkContourFilter to calculate and extract surfaces from underlying MRI data volumes. The vtkContourFilter interrogates the volume data set, finding points in the volume where the scalar value corresponds to a value stipulated by the user. It then scans through the data volume, connecting points of the same value and creating isocontour lines (in 2D) or isosurfaces (in 3D). Since the stipulated search value may occur several times in the data volume, multiple isolines or isocontours can be returned by the algorithm. An additional option offered by the algorithm is to retain only the largest connected surface, i.e., the surface with the largest number of vertices.
It may be interesting to generate surfaces from underlying data for a number of reasons. In Figure 6
we show an example of a rough estimate of a scalp (Figure 6
A) and rough cortical surface (Figure 6
B) representative of the white-matter/gray-matter boundary, extracted from the same individual’s data. Isosurfaces extraction is highly sensitive to homogeneity inconsistencies in the MRI image volume and produces better results with intensity normalized volumes. In Figure 6
C we show the same routine applied to the skull-stripped 1 × 1 × 1 mm3 MNI brain distributed with FSL 4.0. It should be evident that this result is less noisy than that shown in Figure 6
B, a result of the intensity normalization of the MNI brain. Surface generation for cortical surfaces using DV3D is meant to aid quick data exploration and is not nearly as informative or accurate as the algorithms utilized by programs like FreeSurfer, FSL’s FAST
28
or SurfRelax. The speed with which an individual can extract a rough representation of this surface is however very useful. DV3D can give a user a quick insight into the cortical shape in just 30 s, where other packages take between 15 min and several hours to run.
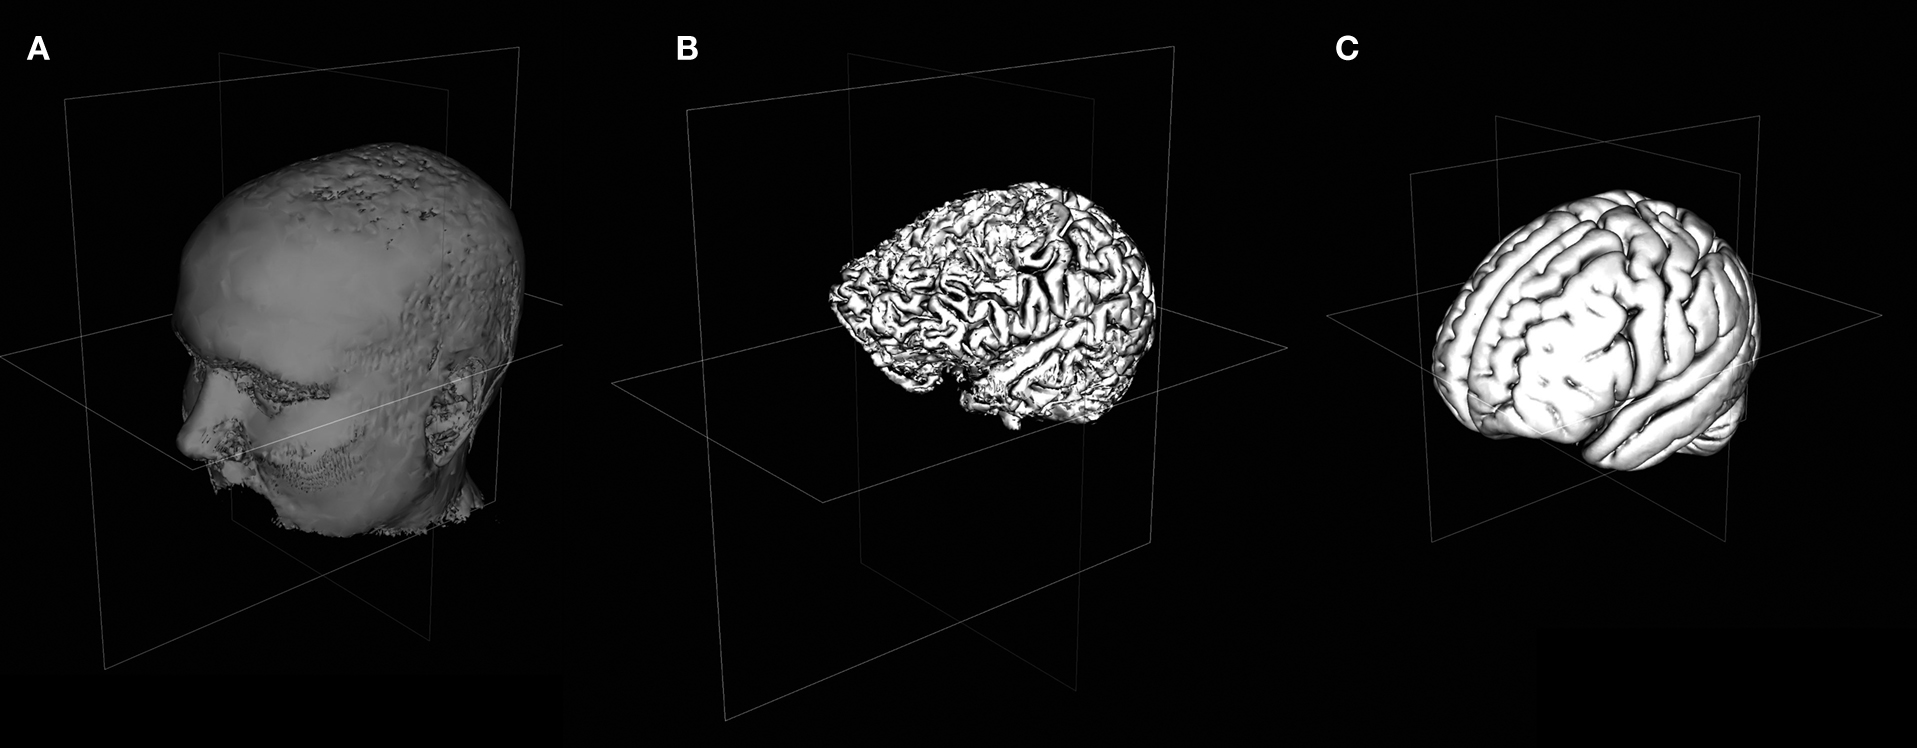
Figure 6. Viewing 3D Surfaces in DV3D. (A) Example of a rough estimate of a scalp using the surface extraction technique. (B) Example of a rough estimate of a cortex using the same technique. Here the data set has been skull stripped first using FSL’s Brain Extraction Tool. (C) A rough cortical extraction of the 1 × 1 × 1 mm3 MNI brain distributed with FSL 4.0.
Activation color mapping. In addition to offering access to the global transparency and color properties of the object, vtkPolyData objects allow access to the properties of individual vertices that define the shape of the surface. Each vertex can have a scalar value associated with it. VTK allows the user to create a color lookup table covering the range of all scalar values associated with the vertices of a surface. The color presented at each vertex on the surface can then be directly mapped through this lookup table to the scalar value at that point. This offers an easy way to map patterns of activation to a surface.
Viewing Time-Series Data
Interactive time-series data visualization is another data exploration technique supported by DV3D. The ability to follow real time changes in signal amplitude at specified locations in data sets relies on VTK’s aforementioned ability to map scalar data to individual vertices of loaded surfaces. DV3D extends the ability of VTK to map scalar data by allowing users to pass new values into surface objects’ scalar arrays. By allowing users to update the scalar values mapped to surfaces with data from any time point in a time-series, DV3D allows dynamic viewing of time-series data in 2D and 3D by stepping through successive time points. DV3D also supports extraction of sensor time-series data for MEG and EEG data (e.g. Butterfly plots).
Numpy
29
is a mathematical methods module for Python that allows, amongst many other mathematical functions, the use and manipulation of arrays and matrix mathematics in Python. Python’s automatic memory management, coupled with the power of Numpy matrix manipulations means that DV3D has access to efficient temporary data storage of large data arrays. VTK also offers techniques for data arrays to be passed directly into VTKArray classes, further increasing processing efficiency.
Two time-series objects are shown in Figure 7
. A 3D contour plot and a minimum norm solution (techniques used for visualizing and analyzing MEG and EEG data) for two MEG data sets are shown in Figures 7
A,B, respectively. The user first provides a coordinate file that describes the surface that is to be added to the VTK window. This file provides the coordinates for the vertices and edges of the surface to be generated. The user then provides a time-data file that holds an array of scalar values. This file holds multiple values for each vertex, arranged chronologically to represent the time-series at each location or vertex in the coordinate file. Independently of the exact file formats, DV3D generates a surface from the coordinate file, and then loads the time-data file into memory, constructing a Numpy array to hold the time-series data. As the user interacts with the object, stepping to subsequent or previous time points, DV3D simply steps to the appropriate point in the array and extracts the relevant values. These values are then converted to a VTKArray and passed directly to the scalar value representation of the object. Although this process may seem rather complex, it is an extremely efficient technique for managing large data arrays without restricting rendering speed when visualizing time-series data.
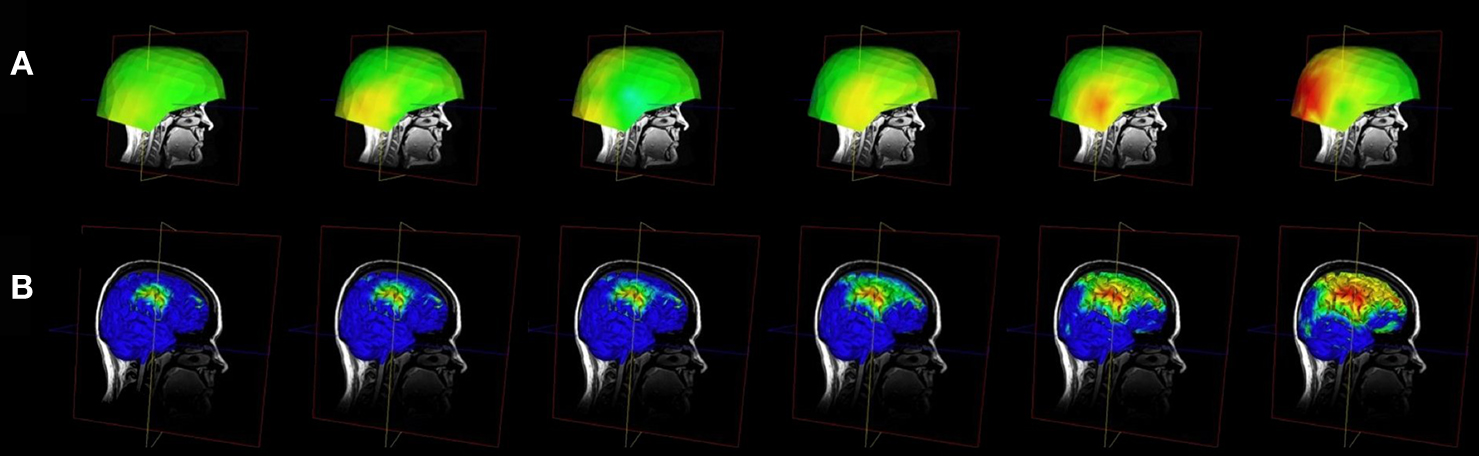
Figure 7. Viewing time-series data in DV3D. (A) Evolution of an MEG field displayed via 3D-contour plot. (B) Evolution of a minimum norm projection via surface scalar lookup table. In both instances frames can be automatically generated by cycling data and exported for movie creation.
Advanced Interaction Techniques
We have shown the way in which DV3D can load surfaces or generate them from underlying data, or re-slice volume data in real time using image planes. We will now briefly describe three of the more advanced features demonstrated in the user documentation and tutorials to show the data exploration potential of DV3D.
3D overlay data. This visualization technique relies on the previously described method for extracting isosurfaces from MRI volumes using the vtkContourFilter. We previously described extracting a rough representation of the cortex by passing a base sMRI volume to the vtkContourFilter. Following the same principle, we can pass an overlay volume to the vtkContourFilter in the place of the structural volume. This volume could, for example, be a statistical z-score map of the activation resulting from a contrast analysis of fMRI data. This is illustrated with a visual motion fMRI data set in Figure 8
. The 2D overlay data is shown in Figure 8
A.
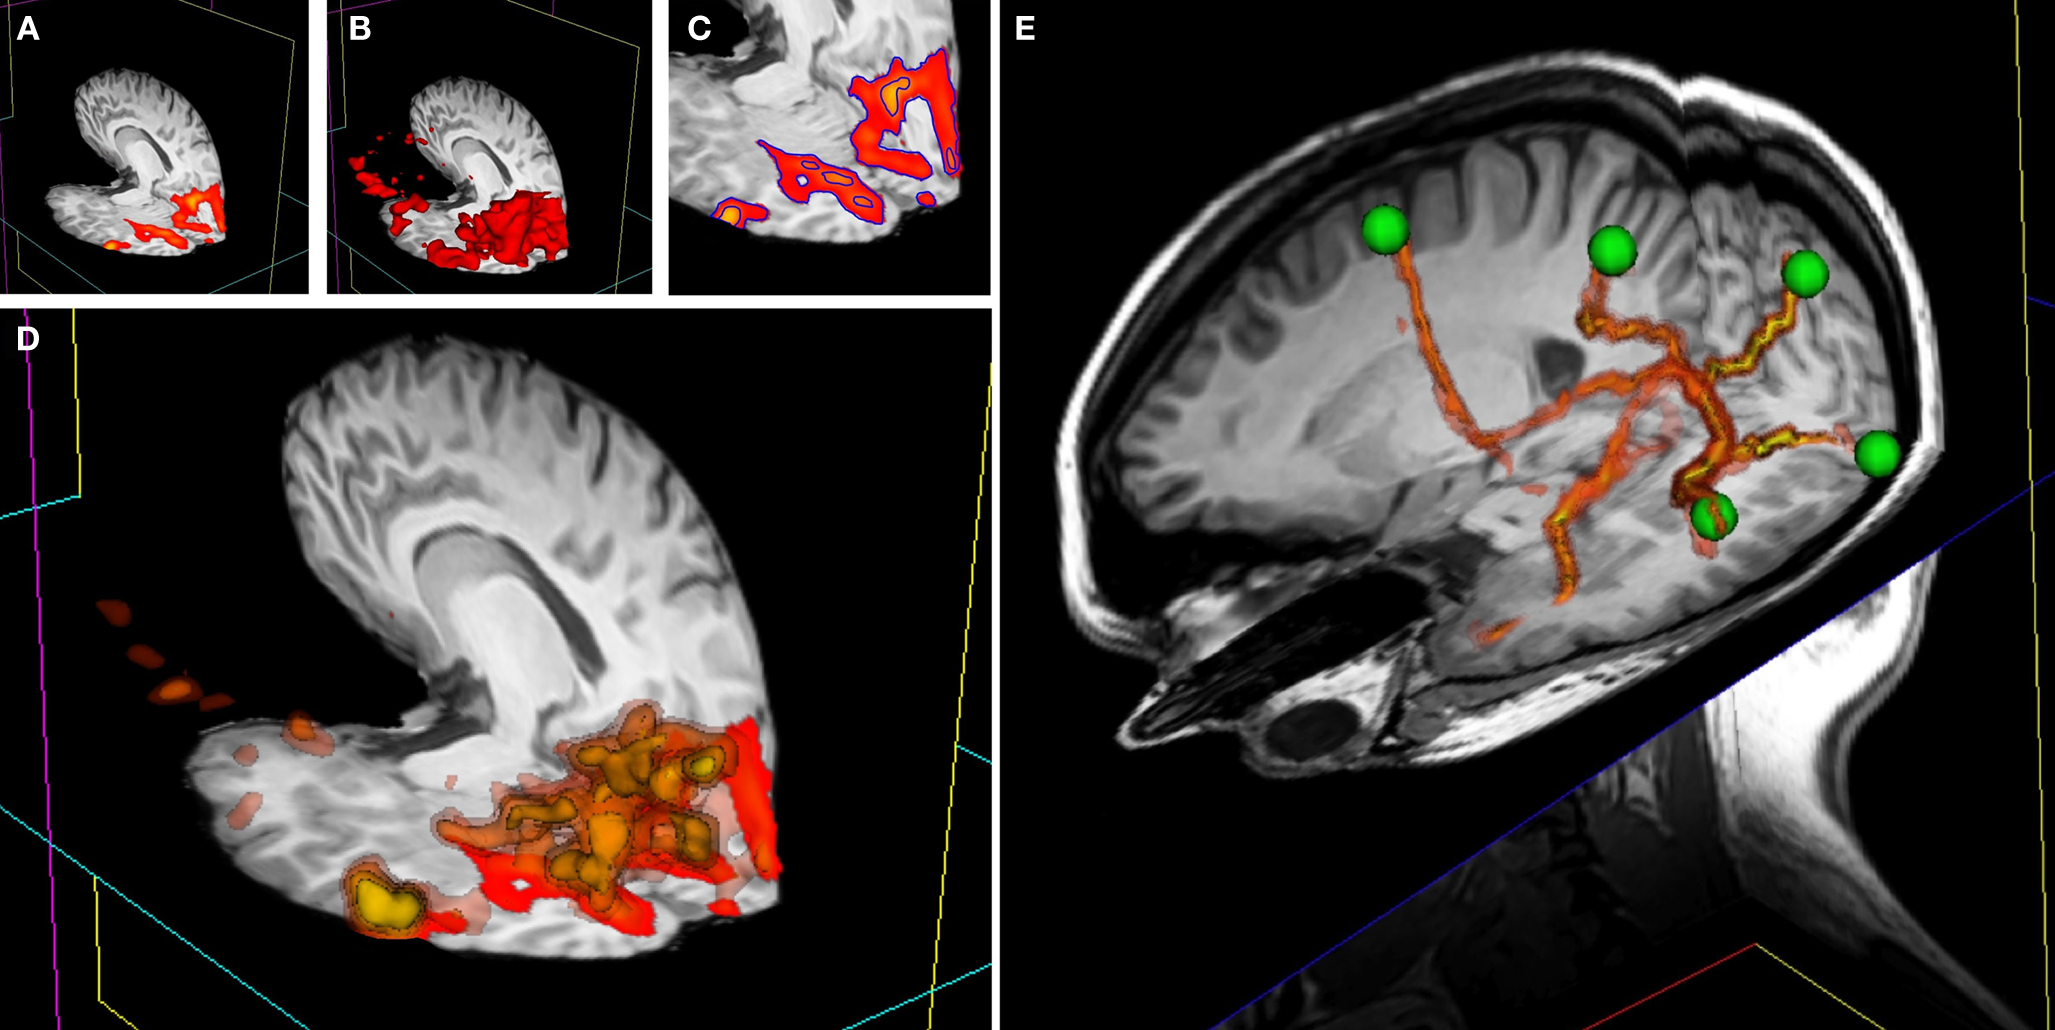
Figure 8. 3D overlay data using isosurface transparency. (A) 2D overlay data from an fMRI experiment overlaid onto a structural MRI volume. (B) The vtkContourFilter can be applied to create an isosurface through the data at a specific threshold value, say z = 2.3. The returned 3D surfaces will encompass all areas in the data set that have a z-score of z = 2.3 or above. We could repeat the process, asking the vtkContourFilter to return smaller surfaces as we increase the threshold. (C) A 2D representation (using isocontours shown in blue) of 2 separate isovalues used to extract surfaces. (D) If we simultaneously render five sets of surfaces, at z-scores of z = 2.3, 3.3, 4.3, 5.3, and 6.3, for example, the only set of surfaces visible would be that at z = 2.3, since all other surfaces are inside this surface. We can manipulate the transparency and color of the vtkPolyData class to make the distribution of activation visible and overcome this problem. By making the outermost surface (at the lowest threshold value) 80% transparent, the second outermost 60% transparent, the third 40% transparent, the fourth 20% transparent, and the highest threshold surface completely opaque, we make all surfaces simultaneously visible. To emphasize this effect, we can also apply a color gradient (yellow to red) across the surface threshold range. Interacting with this mode of visualization in 3D gives an instantaneous percept of the entire distribution of the activation in 3D. (E) This image shows a number of tracts output from FSL’s Probtrack toolbox rendered using the 3D overlay technique. The tracts are seen as yellow to red isosurfaces. The green spheres indicate the positions of seed and target points as defined in Probtrack.
Isocontouring with depth-dependent transparency mapping is a technique that can be applied to a variety of neuroimaging data types or result files. Figure 8
E shows how this technique can be applied to probabilistic DTI visualization (e.g. FSL’s Probtrack
30
output) to give a clear representation of the entire extent of probable connectivity between regions. In addition to being a tool for producing interesting 3D images of the connectivity probability distribution of the DTI data set, this technique has another potential benefit for DTI. Standard DTI fiber tracking techniques tend to represent 3D results at streamlines or stream-tubes in 3D space. With this technique, the colors mapped to each surface have actual probabilistic value and can be mapped along the length of the tract or network path with a visible color bar.
Surface interrogation of overlay volume data. The vtkContourFilter interrogates data volumes, finding specific scalar values and then extracting the 3D coordinates with corresponding scalar values, constructing isolines or isosurfaces by effectively ‘connecting the dots’. VTK also offers techniques to do the reverse: having a surface in the same coordinate space as a data volume, we can find where each vertex of the surface intercepts with the data volume and extract the volume’s scalar value at this point. We have already shown (in Figure 7
) that when a scalar values are provided for each vertex of a surface, we can use a color lookup table to overlay a color map of the distribution of the scalar value amplitudes across the surface.
Figure 9
demonstrates the usefulness of this technique. An overlay volume can be loaded into sMRI space (Figure 9
A). The user can then create or load a surface (Figure 9
B) into the same space. From the property panel of this surface the user can choose to map statistical data to the surface (at the current threshold and color map defined by the overlay plane’s property set). This gives the user a very quick way to visualize activation distributions in 3D (Figure 9
C).
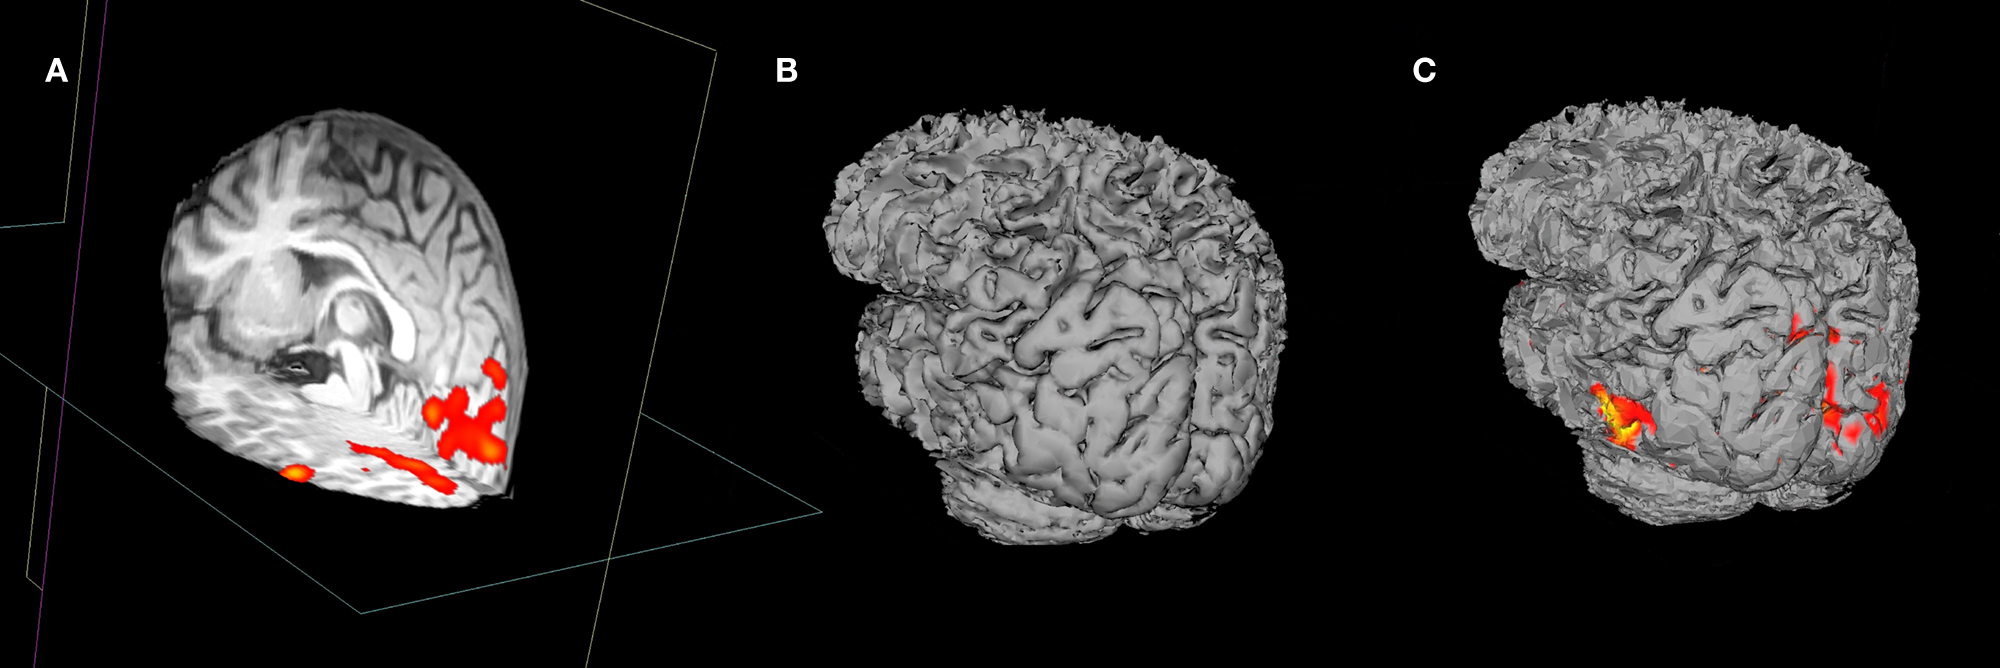
Figure 9. A demonstration of surface interrogation of overlay volume data. (A) Structural MRI space with fMRI data overlay. (B) Rough cortical extraction from underlying structural MRI data. (C) Rough cortex with overlay intersection data rendered onto the surface at the user defined thresholds.
Design Objective: Coregistration to Atlases
Automatic Atlas Lookup
DV3D provides methods for real-time cross referencing with brain atlases. Atlas lookups are currently only possible on MRI-overlay mode. Once the user has loaded a base MRI volume, they can load a second volume into memory. On the Reference tab of the Button Panel, the user can select a file to load as the reference volume to compare to the base volume. Once the user selects a volume, they are prompted to supply a transformation matrix describing the mapping of the base volume (e.g. an individual’s brain) to the reference volume (e.g. the MNI brain). DV3D is currently optimized for use with FSL output data, allowing referencing with the MNI and Talairach brains. If a user supplies the MNI brain as a reference, the user can select to automatically lookup the equivalent Talairach coordinates and brain label. DV3D uses the MTT-pooled transform for the MNI brain to the Talairach brain (Lancaster et al., 2007
). Coordinates and slice numbers of the current and reference data set are displayed in the Message Dialog of the Main application window. The Talairach label, slice number and coordinate is displayed in the Message dialog if the supplied reference volume is the MNI brain and the user has checked the Ref is MNI and Show Talairach Transform check boxes on the Button Panel. Interaction with a base MRI volume, with cross referencing to the MNI and Talairach atlas is demonstrated in Figure 4
.
Design Objective: Export Routines for Sharing and Publication
Surfaces
Any surface currently displayed in DV3D’s VTK window can be written out to a file for sharing or reloading at a later time. Export routines for surfaces can be called by selecting the required surface’s label in the Object List, clicking on the list item with the right mouse button and selecting the Export surface option. This will launch the operating system’s native ‘Save file as’ dialog. The file can then simply be saved and re-loaded where required.
Images
DV3D offers a number of different options for saving out images, capturing the content of the VTK window and the Orthogonal view window as required. The user has full control over the resolution of the image output and is given the option of multiple output formats (including JPEG, TIFF, BMP and PNG). Controls enable the user to export the current view to single image, or export a sequence of views as separate frames (e.g. 360° rotation of the viewport to multiple, sequential images).
Movies
DV3D offers options for saving and creating movies from of the VTK window. The user has full control over the resolution of the image output since the frames of the movie are simply captured at the dimensions of the VTK window as it is displayed on the computer monitor. On the Export tab of the Button Panel the user can select:
• Export 360° directly to.AVI movie. VTK provides a vtkAVIWriter class that is capable of writing renderer contents directly to AVI format video files. Currently this export routine does the same as the Export 360° to multiple images routine, rotating the camera through 360° around the object over 180 frames and creating the output as a movie. Depending on the build options used at VTK installation time or the installer that the user has chosen to use, the vtkAVIWriter class is not always automatically compiled. The Enthought Python distribution, for example, builds this class on Windows by default, but not on OSX. Users wanting access to this functionality should consider manual installation of the VTK modules, or see the more advanced functionality of the streaming routine described in Start interactive streaming.
• Start interactive streaming. This is the most advanced interaction capture technique currently available with DV3D. It has the capability to capture user interactions in real time, periodically capturing frames from the VTK window as the user changes objects in it. Clicking the start interactive streaming button launches the operating system’s ‘Choose folder dialog’, allowing the user to specify a folder for the output to be saved in. With this routine, frames are saved to memory as they are captured rather than being written out immediately. The user will notice very little jittering during interaction due to the decreased processing load. The individual frames are then written out when the Stop stream button in pressed. Individual frames can then be combined into a move format by external software programs such as Apple’s QuickTime Pro.
Examples of all export routines are provided at the software website references in the Supplementary Material section of this paper.
Design Objective: An Efficient Working Environment
A number of features of DV3D are designed to aid users to optimize the working environment of the package.
User Preferences
A user preferences file can be accessed via the Preferences panel. This allows users access to environmental variables including:
• Automatic property panel display: users can choose whether the property panels generated for each loaded object are automatically displayed or not.
• Orthogonal window orientations: these settings allow the user finer control over the layout of the orientations of the Orthogonal view window panels.
• Automatically render orthogonal window: this setting toggles whether the program default is to automatically render the Orthogonal window when the VTK window changes, or whether the user calls this manually.
Parallel Processing
Python offers access to parallel processing via a number of different modules. While there is little need for this at present, we have included a sample of how Python can manage separate threads with this release as a demonstration of how easy it is to implement, and how much potential there is for speeding up user interaction. The demonstration can be run from the Threading tab on the Button Panel. This function runs the load routine for a surface file with over one million vertices. The routine is run in the background while the user continues to interact with the program. Loading the same surface without threading requires the user to wait between 20 and 45 s for the process to complete. An example of the simplicity of the code required to access this functionality is shown in Figure 10
.
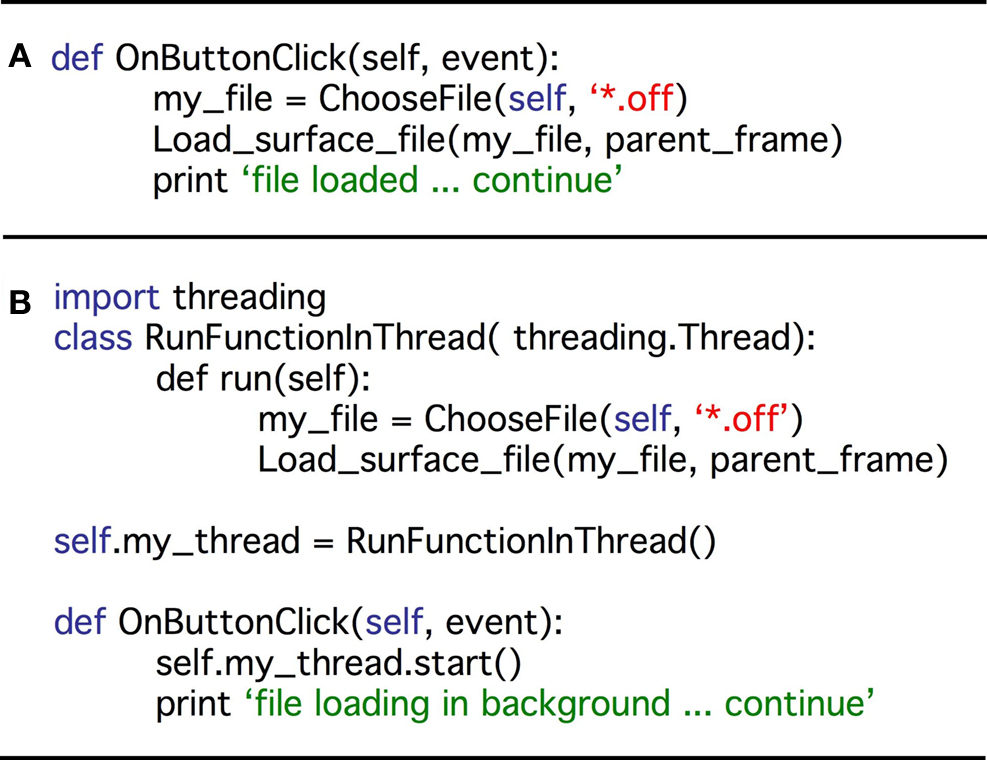
Figure 10. A demonstration of code simplicity in Python: enabling threading. (A) This code example demonstrates how a function may be linked to a button press in a standard Python script using the thread running the main program. On the button click, the program asks the user to choose a file to load. The program then passes the file to the subroutine (Load_surface_file) and runs the subroutine. While the subroutine is running the user has to wait for the object to be loaded and returned to the main program before continuing. (B) This second code example shows that we can produce the same result using Python’s threading module. First the threading module is imported. The functionality of code example in (A) is then added as a function (RunFunctionInThread). The button click in this instance calls a thread (my_thread.start) and runs the load routine will run in the background allowing the user to continue working while it is prepared. Note that threading only requires a few extra lines of simple code.
Workspace Saving
At any point during use of DV3D, users can choose to save the current status of the workspace to a file. This file holds metadata that an be loaded at the start of a later session to load the current working environment, with many of the current settings in use by the user, including all loaded objects and color / transparency settings. This file hard-codes the paths of input files and will fail if files are moved between sessions.
Surface Decimation
Upon loading surfaces into memory, DV3D can be set to run a decimation routine to down-sample the number of vertices of each surface by between 10 and 90%. This surface is not shown automatically (the high-resolution surface is visible by default), but the user can choose to toggle between the decimated and original surface during interaction to help increase the speed of rendering.
Command Line Access for Scripting
In addition to handling workspace files, DV3D offers the ability to handle explicit arguments passed to the program on the command line. This allows users access to advanced scripting options for automation of processing streams.
Design Objective: A Flexible, Scalable and Accessible Open Source Framework
Our implementation of a flexible, scalable and accessible open-source framework is described largely in the Section ‘Methods: Implementing a Python Framework’ of this paper. We show that the combination of Python, wxWidgets and VTK gives us the ability to produce a code base that is freely distributable and platform independent. This implementation has all the functionality required to process a number of different file types and formats, is highly modularized for ease of understanding and promotes future user development due to the relative simplicity of Python as a programming language (for an example, see Figure 10
).
The ‘Results’ Section of this paper shows that DV3D satisfies each of the key design objectives identified as important for a multi-modal neuroimaging data visualization package. In summary, DV3D allows users to view data from many different imaging modalities and analysis streams in a single coordinate space. Data can be cross-referenced with standard spaces in real-time, from 2D or 3D objects. DV3D supports the display of a large number of input data formats, and allows the user to export data in a number of different formats. The user workspace can be customized to allow optimum productivity and allows access for both casual and power users (command line scripting and parallelization). DV3D’s platform independence (due to Python) makes it flexible, and the modularity and simplicity of the code base makes it both accessible and scalable.
Readers may ask about the novelty of DV3D. While we (to the best of our knowledge) are unaware of any other software package that utilizes isocontouring with depth-dependent transparency mapping to display 3D statistical overlays (see Advanced Interaction Techniques), we do not claim that any other techniques utilized by DV3D are novel. Table 1
summarizes the features of DV3D, comparing the resulting functionality achieved by DV3D with similar packages already available. We show that, while DV3D is not an entirely comprehensive solution for visualizing neuroimaging data, it does represent a utility that can offer a single solution to users of a variety of neuroimaging analysis packages. Being optimized for neuroimaging data, this single package offers more options to researchers interested in multi-modal neuroimaging data analysis than any alternative stand-alone visualization package.
While visualization packages are primarily used to display the results output by analysis packages, many visualization tools have developed to include techniques to physically manipulate loaded results files with complex analytical algorithms. 3D Slicer, for example, utilizes complex segmentation algorithms to allow tissue segmentation from any MRI volume acquired at any part of the body. This allows 3D Slicer to be regarded as a tool that is suited to generalized medical imaging analysis and visualization rather than being neuroscience specific. When handling neuroimaging data, 3D Slicer is also more analytically driven than MRICron or DV3D. 3D Slicer does not load fiber-tracking results from external analysis packages. Rather it analyzes diffusion-weighted MRI data to calculate fiber tracts
31
. This move away from being a pure visualization tool, specific for neuroimaging data, does mean that 3D Slicer has more demanding development and maintenance overhead and can take longer to become familiar with, compared to MRICron or DV3D.
DV3D was designed to be a tool optimized for the visualization of neuroimaging data and not an analysis tool per se. Although many algorithms and calculations underlie the functionality of DV3D, they are primarily image processing functions allowing VTK to display results of analyses conducted in other software packages. If DV3D were solely a data visualization tool, it would simply take user input and display it in its raw format. We have shown however that DV3D offers routines for manipulating loaded data to add value to the visualization environment: DV3D can average raw MEG time series data by epoch and display this average as a contour plot; DV3D can manipulate volume grid data and extract and interpolate 3D surfaces from this data to display isosurfaces and isovolumes; DV3D offers the ability to decimate large surface data sets to increase rendering speed. DV3D has thus already began to evolve from a pure visualization tool to a tool that allows users to interact with their data. DV3D does not, however, lose focus of its optimization for neuroimaging data processing.
Since DV3D has the potential to be more than a visualization tool, we have considered extending its functionality. Including more functions in DV3D will allow a more extensive range of tools for users to interrogate data. The modularity of the framework and platform independence of the code base allows access for rapid development and extension to include additional file format support and processing routine extension. Many functions have already been requested by interested parties and are under current consideration for inclusion in subsequent releases. Python offers modules for handling pipes on operating systems, allowing the potential for system calls and data exchange between system processes. We are currently exploring the capability to include calls to DV3D to/from a number of packages. Other examples of user requests currently under development include the ability to align volumes and/or surfaces manually or with automated error-minimization routines, and functions to measure distances, areas, and volume size between/on displayed objects. Future development of DV3D will focus on support for additional formats, increased automation of processing streams, extended local settings customization, and more extensive data sharing options. We will also consider including the GIfTI format as a surface export option due to the significant increases in performance reported when handling these files relative to the.vtk format (Harwell et al., 2008
).
Python has a large and diverse international user base, and promotes the development of increasingly accessible and comprehensive solutions for current computing and analysis requirements. The use of Python as the base for DV3D allows a cross-platform, transparent, and extendible code base for user development. By using Python to wrap existing toolkits, including tools for visualization, rendering, parallelization and GUI generation, DV3D development has required minimal new code to be written to solve complex computations. In addition to the functionality DV3D currently offers, DV3D can also be easily expanded to meet users’ changing needs because of its modular, open-source design. DV3D’s framework is intentionally modularized to provide concise working examples, illustrating the power of VTK and how easily this power can be harnessed by Python. While the authors are keen to extend the package, provision of an open-source package is intended to stimulate and facilitate further development of the software by the user community. Example code illustrating the extension of the functionality of the package is provided for users interested in contributing code or developing the package for their own purposes. DV3D’s code base currently consists of circa 12,000 lines of Python code. 3D Slicer has over 550,000 lines of C++ code, although this includes a large amount of additional analytical functionality that DV3D does not have. We suggest that the simplicity of Python relative to C++, and the vastly smaller code base, make DV3D more accessible in terms of community extension and development prospects.
DV3D’s primary function is to allow easy, interactive display of multi-modal neuroimaging data. DV3D has been successfully implemented on many platforms and is currently used by local users from a variety of disciplines. DV3D is provided as a free, open-source package built on Python’s platform independent model. DV3D can thus be used and, more importantly, developed by the wider neuroimaging community.
The authors declare that the research was conducted in the absence of any commercial or financial relationships that could be construed as a potential conflict of interest.
The authors would like to acknowledge the developers of Python, VTK and wxWidgets for their ongoing support of open-source software provision. The reviewers are to be thanked for their insightful comments, some of which have already resulted in additional functionality being incorporated into the package.
Downloading The Software, Examples and Educational Resources
DV3D, examples output and input files and interactive user tutorials can be freely downloaded from http://www.ynic.york.ac.uk/software/dv3d
.
- ^ http://www.python.org/
- ^ http://www.nitrc.org/
- ^ http://www.analyzedirect.com/Analyze/
- ^ http://www.brainvoyager.com/
- ^ http://www.mathworks.com/products/matlab/
- ^ http://www.ru.nl/fcdonders/fieldtrip/
- ^ http://nutmeg.berkeley.edu/
- ^ http://www.fmrib.ox.ac.uk/fsl/
- ^ http://surfer.nmr.mgh.harvard.edu/
- ^ http://www.fmrib.ox.ac.uk/fslview
- ^ http://www.sph.sc.edu/comd/rorden/mricron/
- ^ http://slicer.org/
- ^ http://www.wxwidgets.org/
- ^ http://www.vtk.org/
- ^ https://www.mristudio.org/
- ^ http://www.fmrib.ox.ac.uk/fsl/fnirt/
- ^ http://www.cma.mgh.harvard.edu/
- ^ http://www.talairach.org/applet/
- ^ http://www.fmrib.ox.ac.uk/fsl/fdt/fdt_bedpostx.html
- ^ http://gridengine.sunsource.net/
- ^ http://www.loni.ucla.edu/Software/
- ^ http://www.enthought.com/products/epd.php
- ^ http://medical.nema.org/
- ^ http://nif.ti.nimh.nih.gov
- ^ http://www.nitrc.org/projects/gifti/
- ^ http://www.geomview.org/docs/html/OFF.html#OFF
- ^ http://www.fmrib.ox.ac.uk/fslfaq/#general_radiologicaldef
- ^ http://www.fmrib.ox.ac.uk/fsl/fast4/
- ^ http://numpy.scipy.org/
- ^ http://www.fmrib.ox.ac.uk/fsl/fdt/fdt_probtrackx.html
- ^ http://www.slicer.org/slicerWiki/index.php/Slicer3:DTMRI