1
Computation Institute, The University of Chicago, Chicago, IL, USA
2
Department of Psychology, The University of Chicago, Chicago, IL, USA
3
Department of Psychology, University of Virginia, Charlottesville, VA, USA
4
Department of Psychiatry, Virginia Commonwealth University, Richmond, VA USA
5
Department of Neurology, The University of Chicago, Chicago, IL, USA
6
Mathematics and Computer Science Division, Argonne National Laboratories, Argonne, IL, USA
We present a computational framework suitable for a data-driven approach to structural equation modeling (SEM) and describe several workflows for modeling functional magnetic resonance imaging (fMRI) data within this framework. The Computational Neuroscience Applications Research Infrastructure (CNARI) employs a high-level scripting language called Swift, which is capable of spawning hundreds of thousands of simultaneous R processes (R Development Core Team, 2008
), consisting of self-contained SEMs, on a high performance computing system (HPC). These self-contained R processing jobs are data objects generated by OpenMx, a plug-in for R, which can generate a single model object containing the matrices and algebraic information necessary to estimate parameters of the model. With such an infrastructure in place a structural modeler may begin to investigate exhaustive searches of the model space. Specific applications of the infrastructure, statistics related to model fit, and limitations are discussed in relation to exhaustive SEM. In particular, we discuss how workflow management techniques can help to solve large computational problems in neuroimaging.
Concepts and Background on CNARI and Driving Neuroscience Usage Model
In the past decade, there has been tremendous growth in the number and scope of functional brain imaging studies performed in the basic and applied neurosciences. These studies have been more complex than those of the past, often incorporating large numbers of participants, multiple physical sites, longitudinal follow-up, combinations of healthy groups and those with disease or injury, and/or additional types of behavioral or biological measurements. Although their numbers are increasing, the inherent complexity of data management and processing in such studies, particularly regarding anatomical and physiological data, represents a major stumbling block to their ultimate success. In studies of recovery from stroke, for example, medical data are stored in paper charts or in hospital medical information systems, behavioral and linguistic data are saved in spreadsheets on personal workstations, structural and metabolic magnetic resonance imaging (MRI) data are stored in manufacturer formats on scanners and/or with the functional MRI data in the file systems of data processing workstations. With these diverse representations of information, not even counting the possible addition of electrophysiological and other structurally unique data types, it is hard enough to perform single case studies that attempt to relate these data to each other, let alone studies that include statistically meaningful numbers of participants.
We have started building the Computational Neuroscience Applications Research Infrastructure (CNARI) to address these concerns (Stef-Praun et al., 2007
; Hasson et al., 2008
; Small et al., 2009
). There are two basic components to CNARI: First is the use of relational database technology to represent the diverse data types of the study in a uniform representational framework that facilitates distributed data access, and permits powerful queries and data reductions to be performed significantly faster by parallelized statistical analysis procedures. Second is the use of “virtual data” grid computing, in which data and data processing are widely distributed on storage devices and computers, and where data transformation and analysis is specified in terms of abstract (“virtual”) procedure descriptions. Together, these techniques enable a community of researchers to access and share data and perform data preparation and analysis without detailed knowledge of the internal workings of distributed computing and storage systems or of the network infrastructure that connects them.
Longitudinal functional brain imaging requires comparison of brain activation images within a single individual over time, and possibly also between single individuals and a group that represents some standard. For example, in a study of recovery from brain injury, the individual data might be compared to a normative (healthy) group. Although such comparisons can be performed using various scalar indices, we have recently begun to do this with entire activation networks. One way of modeling such networks of activation is with structural equation modeling (SEM), a method that uses known anatomy to augment the functional information with structural connectivity information, to create a model of both static and dynamic relationships (McIntosh and Gonzalez-Lima, 1994
; Buchel and Friston, 1997
; Horwitz et al., 1999
). We have developed several such models (Skipper et al., 2007
, 2009
; Solodkin et al., 2004
; Walsh et al., 2008
), based on a combination of primate and human data (Ban et al., 1984
, 1991
; Rizzolatti et al., 1997
, 1998
; Petrides and Pandya, 1984
, 1988
, 1999
; Rosa et al., 1993
; Seltzer and Pandya, 1994
; Hackett et al., 1999
; Barbas, 2000
). In one of these studies, we constructed a group network model for healthy right handed individuals performing bimanual movements, and compared this normative group model to two individuals with different biological states, two healthy left handed people and one individual with stroke. The fit between a strong left hander (i.e., one who used his left hand for everything) and the model was very tight if the hemispheres were flipped in the model. The fits between either the weak left hander (i.e., someone more ambidextrous) or the person with stroke and the group model were poor. These three examples were highly informative for understanding the neurobiology of bimanual movements (Walsh et al., 2008
).
Building such models can be very complex and time consuming, requiring advanced anatomical knowledge and skill. Furthermore, while these previous methods have been useful for generating a set of possible models in the absence of exhaustive techniques, they are inherently flawed since they are based on anatomical connectivity data from non-human primates. In addition, the models created depend on the hypotheses being tested, and thus there is a large number of possible models for any particular set of fMRI activation data. To address these issues, we have embarked on an extension to CNARI that aims to facilitate a more objective type of data-driven SEM via highly parallelized workflows for generating and processing large numbers of models in a manner that is easily reconfigurable and replicable. The goal for this modeling approach is to explore as much as possible of the entire space of plausible models that account for the data. In this paper, we discuss the nature of this grid-enabled SEM, and describe how it can be used and applied to various research problems in brain imaging. One of the original purposes of CNARI was to facilitate the study of stroke recovery, with particular emphasis on natural recovery and treatment for language problems (aphasia). In our presentation, we will use specific examples from language processing, though the workflows presented are generalizable to a wide variety of other SEM problems.
Concepts and Background on SEM: The Motivation and Design of OpenMx
Structural equation modeling (SEM) has a long history dating back to the development of path analysis by Wright (1921
). SEM is a statistical tool for estimating a set of predicted covariances between variables that may be connected with either regression (asymmetric, directional) parameters or covariance (symmetric, non-directional) parameters (see Boker and McArdle, 2005
, for a review). The advent of high speed computers and high level programming languages in the 1960s, together with advances in statistical methodology led to the development of software for fitting models to observed covariance matrices by maximum likelihood (Joreskog, 1967
). This procedure is now commonly known as SEM (see e.g., Bollen, 1989
; Loehlin, 1992
, for introductions; see McIntosh and Gonzalez-Lima, 1994
for its use in neuroimaging). SEM is widely used for fitting statistical models to epidemiological, psychological, sociological and econometric data where there are multivariate outcomes and theoretical reasons to expect that linear or non-linear systems of equations may provide explanatory power in summarizing these large data sets. For instance, in an epidemiological study of heart disease, one may wish to control for a wide variety of possible behavioral covariates while simultaneously accounting for variance due to group membership or genetic variation. For such problems, SEM models represent state-of-the-art in statistical techniques. Neuroimaging data, is a prime candidate for modeling with SEM, given overlapping sources of variance both across space and time within individual as well as sources of variance across individuals due to group membership and other covariates.
SEM models can be described as a function of two model matrices, A, S, a filter matrix, F and a residual matrix U, such that the expected covariance between observed variables is:
R = F(I − A)–1 S((I − A)–1)′F′ + U
where the model matrix A contains the asymmetric paths (regression coefficients), S contains the symmetric paths (covariance coefficients), and the filter matrix, F, strips the latent variables from the model matrices so that the result only contains expectations for the observed covariances (McArdle and McDonald, 1984
; McArdle and Boker, 1990
). One implementation of SEM is the software package Mx (Neale et al., 2003
). The set of built-in functions that Mx can optimize includes maximum likelihood, generalized least squares, and full information maximum likelihood analysis of covariance matrices and/or observed means. In 2007, the OpenMx development project was started in order to rewrite Mx into open source, provide a scripting interface to the R statistical language (Ihaka and Gentleman, 1996
) and provide a number of extensions to the software. Among these improvements was integrating the Mx SEM optimization engine into parallel workflow management software in order to be able to estimate parameters for large numbers of SEM models simultaneously. In this way, statistical resampling techniques such as bootstrapping, simulations to verify the performance of new models, and exhaustive search routines could make use of large-scale parallel computing resources. The current article describes the first application of the OpenMx software to a real-world exhaustive search problem.
Background and Goals
The ability to submit a large number of processes simultaneously to multiple grid sites is a major computational challenge and cannot be accomplished without an evolved workflow management system. In a related research project, we have been developing a workflow system called Swift (Zhao, 2007
), which has been our system of choice for submission and management of large-scale workflows for neuroimaging. Using Swift, individual researchers are able to map large amounts of input and output explicitly and make calls to the cataloged executables that sit on remote grid sites. We have been investigating ways to execute and manipulate exhaustive or partially pruned, data-driven SEM workflows using Swift to operate on covariance data derived from a relational fMRI experiment database. From the standpoint of parallel computing and workflow management this poses some interesting issues and also demonstrates, quite strikingly, the convenience (to the research scientist) of having an elegant, high-level means of expressing, reconfiguring and rerunning such workflows. Here we present several examples of such workflows and explain how they can be expressed and run using Swift, OpenMx and the computational resources of the TeraGrid (Catlett et al., 2007
).
The availability of high performance computing systems (HPCs), ranging from multi-core workstations to clusters, grids, clouds, and now petascale supercomputers, creates opportunities to explore experimental datasets with SEM in ways never before possible. The availability of this computing power, however, can be difficult to harness, particularly for a neuroscientist not versed in high performance computing. For these researchers, it is undesirable to divert mental and manual effort from scientific exploration to the mechanics of large-scale parallel computing. At the same time, both the complexity and the scale of high performance environments makes it ever more challenging to assure the validity of scientific results obtained via such systems.
What scientists in general - and neuroscientists in particular - need, are ways to express the processing they want to perform in a compact, abstract, high-level notation that specifies only the logical nature of their computations, but which abstracts and automates all of the potential, varying details of implementing those computing abstractions across a wide range of computing platforms.
Swift and CNARI
For the past two years our group at the University of Chicago Human Neuroscience Laboratory, in collaboration with the Computation Institute, has been developing and evaluating Swift, a parallel scripting language, for this purpose. Together with members of the OpenMx project described above, we have recently focused significant effort to create a library of Swift procedures for the flexible processing and analysis of data from fMRI and other neuroscience experiments.
We employ a programming model that “loosely couples” application programs. In this model, complete programs become our functions, and the arguments to, and results from these functions can be files, file-structured datasets, as well as database entries.
The goals of expressing data processing steps in an abstract notation are multifold: 1) to distill the computation down to the salient details and eliminate the mechanical details of file manipulation from the expression of the basic workflow steps; 2) to abstract data at a high level to relieve the programmer of concerns for the layout of the data on storage systems; 3) to enable the automatic parallelization of scripts in which independent streams of data are processed; and, 4) to enable the recording of all of the steps of a computation in an automatic, transparent manner. An overview of the scripting modules for SEM analysis, coded by the research scientist within the CNARI framework can be seen in Figure 1
. The Swift programming language enables this model by providing the ability to represent application programs as procedures, and to define compound procedures that permit the user to create libraries of higher level processes that capture the essential protocols of an application’s data preparation and analysis. The language’s data model provides the ability to describe the datasets that are consumed and produced by the procedural abstractions by combining basic primitive data type definitions with a mapping mechanism of on-disk directory structures to form structures and arrays. These data objects are then automatically and transparently sent across distributed execution environments to remote and parallel Swift procedures.
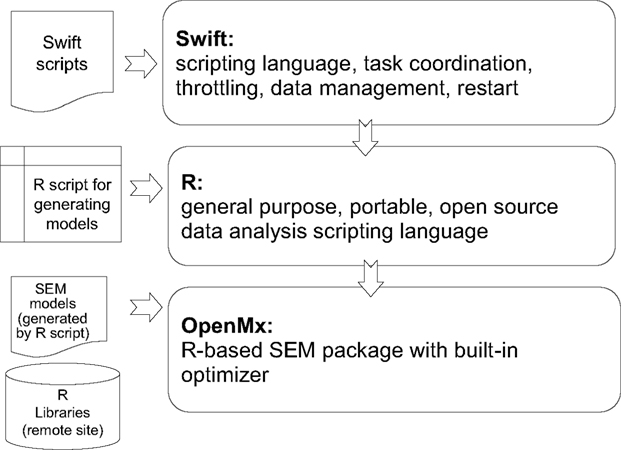
Figure 1. User Interface: Overview of the CNARI scripting modules for SEM workflows.
The Swift language has a C-like syntax, but enforces many of the semantic aspects of a “functional” programming language. Procedures are expressed as functions, permitted to return multiple values; statements are executed in data-dependency order; variables (including array elements and structure members) are single-assignment, making it significantly simpler to determine independent operations and threads of control, and to execute these threads in parallel; a construct called “mapping” is provided to translate between the simple, clean regular abstract data model of Swift and the potentially messy, complex model of real-world directory structures and the file naming and structuring conventions expected by real-world applications.
The notation provides a simple set of flow-of-control statements, such as if and switch (case) statements. The primary way to express a set - potentially large - of parallel operations in swift is to utilize the foreach() statement. This statement iterates over a collection, assigning each member of the collection to a control variable, and then evaluating the body of the foreach() loop once for each value of the target collection. All iterations of a foreach() are potentially (and conceptually) performed in parallel; the runtime system provides appropriate “throttling” and scheduling of the potentially enormous number of parallel operations that this construct can generate and submit for processing.
Atomic procedures in Swift consist of wrappers around specifications that detail the invocation of application programs. In our SEM project, this mechanism is used by Swift to invoke the individual parallel model optimizations of the many thousands of models generated in an OpenMx SEM analysis workflow. “R” is the application program of execution. The invoking (master) program that calls the individual R programs creates a (potentially very long) list of evaluations, each of which is an R expression that embodies the OpenMx engine. The master program generates a large set of model calls and marshals the model’s matrix into a text character stream.
The Swift model of data abstraction was to some degree inspired and motivated by the field of fMRI data analysis. In our earliest efforts to execute fMRI preprocessing workflows on computing grids we observed that the data model of the fMRI domain had a natural tree structure in which the vast number of files stored in traditional file system directories had somewhat similar patterns. These files included data from myriad experiments, test conditions and scans, and also included various types of lower level data such as anatomical and time series data represented in the image/header file pairs of the functional data format (e.g., Analyze or AFNI formats). This suggested to us that data definition constructs could be of significant benefit for scientific workflow scripting, such that data could be described in a “typed” fashion, much like the hierarchical model of “structs” in C or “classes” in Java. To enable an organization (or even a discipline, through community curation efforts such as those managed by collaborations like BIRN)
1
to define and standardize a uniform format for describing their common data elements, Swift provides the notion of data type and “mapping” of each type to a physical representation. The logical type is simple and abstract, and reflects only the logical level of the data; the “mapping” describes how each element of a structure is mapped onto the structure’s physical representation on a file system. To some extent, Swift emulates the mapped filesystem structure on the remote resources where it instantiates processing. Generic mappers with a modest degree of representational flexibility are pre-defined in the swift system; but additional mappers can be created by users for their own communities and used throughout. Figure 2
shows the Swift modules used for execution management once a user has mapped his files, and defined processing jobs within a Swift script.
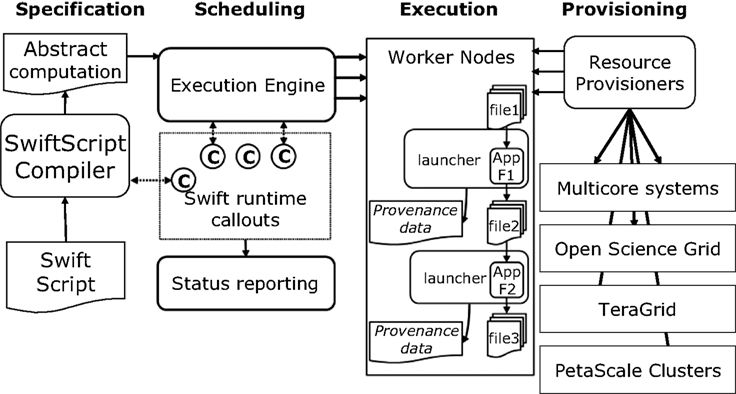
Figure 2. Swift architecture: Managing workflow execution within CNARI. Specification and scheduling are implemented on the client side while execution is implemented on the remote computing resources.
Swift is easy for users to install, and its runtime system provides the client capabilities needed to use workstation, grid and cluster computing resources. From a single client computer, e.g., a modest workstation or personal laptop, the user can launch and control scripts that send parallel work for simultaneous execution on clusters, grids and supercomputers. The user can test the correct execution of the logical script workflow, just by executing directly on a local workstation. If the user’s workstation has multiple cores, Swift can take advantage of those for modest but invaluable parallelism. And as the user’s needs grow or the user is ready to scale up to increasingly large systems, Swift can readily expand to those systems with a single representation and a single client as we will show in our example workflows.
Swift scripts afford a highly productive way to produce and manage the software of neuroscience research units, whether they be local campus departments or international collaborations. In today’s practice, organizations that need to process data from fMRI experiments typically develop and rely on locally produced sets of ad hoc scripts, usually written in a Linux “shell” language such as “c shell” (csh) or bash, or perhaps Perl, to organize the processing protocols and processes of the collaborations. In Swift, however, as all procedures are “typed” with a specific “signature” of data types for the input and output arguments, a more rigorous and less error-prone paradigm is imposed on the overall structure of the scripts. Thus Swift procedures serve as an interface-definition language for ordinary shell procedures. The overall higher-level process is then defined in a multilevel fashion, from top (highest) to bottom (lowest level) being:
• overall application (such as
multiNetworkSEM)• high-level scripts (such as
getCovariance())• low level Swift interfaces (atomic procedures) such as
mxModelProcessor()• an external R wrapper script to do further argument manipulation (RInvoke.sh)
• the R tool itself (R CMD BATCH)
Special power and structure is afforded when the tool being run is not a “canned” compiled application, but rather itself a powerful data manipulation environment such as Perl or Python, or more specific to the model we describe in detail here, the R data analysis language with its vast package library of statistical and analytical procedures, including the OpenMx package used here. In this case, the actual script to be performed can be dynamically generated or selected from a template library, and sent to any computing site, which already has a suitable version of R and the OpenMx package installed.
We now give some concrete examples of how Swift can manipulate large datasets and enable novel analysis techniques by means of effective workflow management. The example framework we have employed our grid-enabled analysis techniques on is an fMRI investigation of the neural processing associated with emblematic gesture observation. Emblematic gestures (“emblems”) are goal-directed, symbolic manual actions that, while expressed as culturally recognizable manual gestures, communicate a linguistically associable propositional meaning. Four experimental conditions were presented to participants in the MRI scanner: 1) Emblem, the symbolic manual gestures; 2) Speech, the spoken form of the linguistic propositions associated with the emblems; 3) Emblem with Speech, simultaneous presentations of the emblems with their verbalized linguistic associations; and 4) Grasping, observation of another type of goal-directed manual action, for which the neural regions associated with its processing have been well-characterized. Data were processed with AFNI (Cox, 1996
) and mean normalized values of each of the hemodynamic response functions for every condition at every voxel in the brain were projected to 2-D cortical surface representations and spatially smoothed on the surfaces using SUMA (Saad et al., 2004
). These surface values were then imported into MySQL database tables for relational indexing and further analyses.
We have begun exploring extremely large, exhaustive SEM workflows as a means of investigating how efficient workflow tools can address computational problems that were previously considered unmanageable. Particularly, in using SEM for looking at functional connectivity many researchers are confined to hypothesis-driven approaches because they lack the tools to reliably implement data-driven methods; this situation can greatly impact mining and interpretation of datasets. In an attempt to address these issues, we are building an infrastructure that can be used by researchers to iterate over various parameters within these large sets in a reasonable amount of time and in a manner that is both dynamic and reliable. The following workflows were run on a TeraGrid HPC system known as Ranger. Ranger comprises 3,936 16-way SMP compute nodes providing 15,744 AMD Opteron™ processors for a total of 62,976 compute cores. The workflows were developed on and submitted (to Ranger) from a single-core Linux workstation running an Intel® Xeon™ 3.20 GHz CPU.
A model generator was developed for the OpenMx package and is designed explicitly to enable parallel execution of exhaustive or partially pruned sets of model objects. Given an n x n covariance matrix, it can generate the entire set of possible models with anywhere from 0 to n2 connections; however, it can also take as input a single index from that set and it will generate and run a single model. What this means in the context of workflow design is that the generator can be controlled (and parallelized) easily by a Swift script. For example, using Swift as the interface to OpenMx we have these few lines of code:
Workflow 1: 4-Region Exhaustive SEM for a Single Experimental Condition
First, a covariance matrix containing activation data for 4 brain regions, over 8 time points, averaged over a group of subjects in the Speech condition was drawn from the experiment database and its location (in this example, on the local file system, though the file could be located anywhere) is mapped in line 5. Line 6 maps the R processing script and lines 1 through 4 define the atomic procedure for invoking R. Each iteration of the foreach loop maps its optimized model output file and calls
mxModelProcessor() with the necessary parameters to generate and run a model. Each of these invocations of mxModelProcessor() is independent and is submitted for processing in parallel. Swift passes 5 variables for each invocation: (1) the covariance matrix; (2) the R script containing the call to OpenMx; (3) the permutation number, i.e., the index of the model; (4) the initialization weight for the free parameters of the given model; and (5) the experimental condition. Clearly, in this workflow all free parameters of the given model will have the same initialization weight as Swift is passing only one weight variable. When the job reaches a worker node on Ranger an R process is initialized, the generator creates the desired model by calculating where in the array that permutation of the model matrix falls. OpenMx then estimates the model parameters using a non-linear optimization algorithm called NPSOL (Gill et al., 1986
), and the optimized model is returned and written out by Swift to the location specified in its mapping on line 10.The above script completed in approximately 40 minutes. The script can then be altered to run over multiple experimental conditions by adding another outer loop:
Workflow 2: 4-Region Exhaustive SEM for 2 Experimental Conditions
When the outer loop is added, the new workflow consists of 131,072 jobs since we are now running the entire set for two conditions. This workflow completed in approximately 2 hours (Figure 3
).
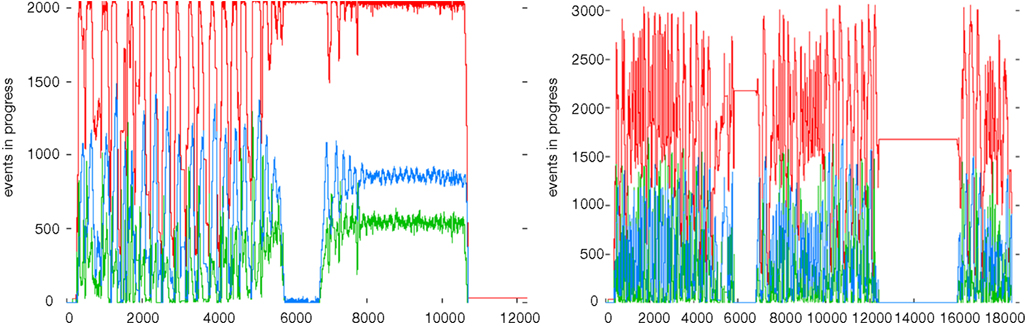
Figure 3. Number of active processes during workflow execution: (left) Processing of the 4-region workflow over 2 experimental conditions. (Right) Processing of the 4-region workflow over multiple networks. The red line represents the execution of jobs on Ranger, while the blue and green represent the staging in and out of files respectively. Plots were generated by swift-plot-log, part of the Swift suite of tools.
Workflow 3: 4-Region Exhaustive SEM for Multiple Networks
In this workflow multiple 4-region networks are run for the Emblem with Speech experimental condition. The regions of interest (ROIs) designated are from FreeSurfer’s
2
automatic parcellation of anatomical regions, based on the Duvernoy atlas (1991)
, and further manual subdivisions to delineate anterior and posterior extents of the superior temporal gyrus and sulcus, as well as superior and inferior segments of the precentral gyrus. Because Emblem with Speech involved subjects’ perceiving simultaneously both spoken (audiovisual) and manual information, here we chose candidate regions expected to be involved in audiovisual recognition of speech and manual action: occipital pole (OP), middle occipital gyrus (MOG), anterior occipital sulcus (AOS), posterior superior temporal sulcus (STSp), posterior superior temporal gyrus (STGp), transverse temporal gyrus (TTG), and supramarginal gyrus (SMG). Covariance matrices of activation data for Emblem with Speech for several networks comprised of these ROIs were then queried from the database:
network 1: {OP, STGp, TTG, AOS}
network 2: {OP, MOG, AOS, STSp}
network 3: {TTG, STGp, SMG, STSp}
This results in a workflow containing 196,608 processing jobs (1 condition x 3 networks x 65536 models) and completed in approximately 5 hours on Ranger. For an example of how this might be used as part of a larger processing workflow see Section “Language Study Workflow in Swift” in the Appendix.
The workflows presented here do not result in a single “best” model representing connectivity amongst the four brain regions for the given conditions. Rather, their value lies in that they produce an exhaustive set of optimized models from which to begin searching for good-fitting models. Thus, a natural extension to this set of workflows might be a model-selection component based on a fit statistic (e.g., Bayesian information criterion, Akaike information criterion, RMSEA), an exploratory visualization component (see “Language Study Workflow in Swift” in the Appendix) or perhaps a combination of these methods. A “model-selection workflow” based on one or more fit statistics extending, for example, workflow 1 would extract the desired fit statistic from each of the 65,536 optimized models and potentially keep or discard a given model based on whether or not it is above or below a selected threshold. It is worth noting that there is a good deal of controversy around which measures provide the most accurate model-selection (Bullmore et al., 2000
) as well as some variation in how SEM software packages actually calculate those fit statistics (Clayton and Pett, 2008
).
While the present workflows suggest new possibilities for exhaustive search and large-scale, parallel analysis techniques, their utility lies heavily in the ability to be easily replicated and reconfigured for use on varying datasets. Exhaustive search through a space of structural equation models is, ab initio, an exploratory technique. Thus, one cannot make statements concerning the probability that there are significant differences between models or that a selected parameter is significantly different from zero. The number of tested models is so great that any statistical argument concerning the likelihood of the data given a null hypothesis is overwhelmed by the number of comparisons made. In addition, one must be concerned about generalizability of results if a single data set was used—the exhaustive search may have overfit idiosyncrasies of the target data. Thus, it is imperative to cross-validate results from exhaustive search using other data sets.
On the other hand, an exhaustive search of the space of structural equation models for a particular data set does result in an empirical distribution of the fit statistics of the models. By plotting the log likelihood resulting from each fit against the number of degrees of freedom in its associated model, it is likely that clusters in the fit statistics will be observed. In this way, we may observe patterns of candidate models that are roughly equivalent given the data. Some of these models may be algebraically equivalent (vonOertzen, in press
), and others may be empirically equivalent given the data. We intend the CNARI development effort to enable this type of data exploration.
Beginning with some basic pruning techniques, we can start to narrow down the space of models in the exhaustive set while leveraging Swift’s ability to submit large numbers of processes, resulting in some powerful workflows. The first reduction in the exhaustive set of models is elimination of any models that are unidentified, that is, models containing negative degrees of freedom due to the presence of more unconstrained than constrained variables. The degrees of freedom can be easily calculated using the following formula:
(n(n+1)/2)-kwhere n is the number of brain regions in the model and k is the number of free parameters and if the result is negative, the model is underidentified (Bollen, 1989
). Additionally, a model with two-way symmetric connections is likely to fail attempts at optimization. Such a connection represents a type of cycle. In fact, most models containing cycles will be difficult to optimize as they are not usually identified in the absence of, e.g., longitudinal data (Neale and Cardon, 1992
; Heath, 1993; Neale et al., 1994
). The size if the acyclic set is given by
4((n*(n-1)/2).An algorithm exists for finding cycles (Boker et al., 2002
) that could potentially be used to further prune the model set. In addition to pruning cyclic and underidentified models, the set may also be pruned for models containing variables that lack residual error. The fit function cannot be evaluated under these circumstances, because the predicted covariance matrix is singular; therefore its determinant is zero, which results in the division of a negative quantity by zero in the calculation of the multivariate normal distribution probability density function, so optimization cannot be performed.
As Table 1
shows, with a moderate degree of pruning, the set for four regions becomes trivial to run in the present infrastructure. Furthermore, the five-region set, while still a large number of processing jobs, becomes much more manageable.
CNARI has been developed with the aim of managing a broad range of diverse neuroscience datasets and performing efficient, reliable parallel analysis workflows on them. Here we have demonstrated workflows that fully exercise this capability by applying this framework to large computational problems; namely, exhaustive search SEM. The need for data-driven techniques in modeling connectivity has emerged not only in our own work in studying language and aphasia but in SEM in general (Bullmore et al., 2000
; Marrelec et al., 2007
), though there has been little discussion of workflow management and parallel computing as means of addressing this need. Researchers, faced with seemingly insurmountable computational problems when selecting appropriate models to test, are often forced to rely on less-than-satisfactory approximations not only due to the sheer amount of processing power required but because of the daunting task of distributing those processing tasks in a cohesive manner such that the results are useful and replicable. As CNARI continues to evolve, we hope to expand these large-scale, data-driven workflows as we use them to address the complex research questions facing us.
Language Study Workflow in Swift
The following is a prototype using Swift and demonstrating how the above modules can be assembled into a larger exploratory workflow. Exhaustive search is run for the Emblem with Speech condition on several four-region networks, and the results of the optimized models are stored in a connectivity database for visualization, further analysis, and pattern detection.
For each of the selected networks
multiNetworkSEM is called with configuration files for the user to access the databases, information on the network to be processed, and the total number of models in the exhaustive set. First, the covariance data is pulled from the experiment database. This is seen in the runQuery function, which is Swift’s call to a python database interface (see Small et al., 2009
for a more detailed description of this mediator component). Then for each iteration of the loop in line 34, Swift invokes mxModelProcessor, assigning each process a model to generate and optimize in OpenMx. The instantiation of the OpenMx model object and the call to the optimizer are encapsulated in the R script mapped on line 33, which is also passed to mxModelProcessor. Each of these processes writes out a file containing the result of the optimization, and these results can be read and inserted into the connectivity database, which is done with insertOptMod. It should be noted that both insertOptMod and getCovariance operate on the same principle: the user assembles a query that the python DBI will submit to the database. If the user also passes an R script (as in line 62), it will process the query result with that R script. Each result file is read, and its contents are inserted into the connectivity database where they can be further analyzed. A call to plotLogLik can be used to plot of the minimum values obtained by OpenMx for each model allowing for identification of patterns or clusters within the set (Figure 4
).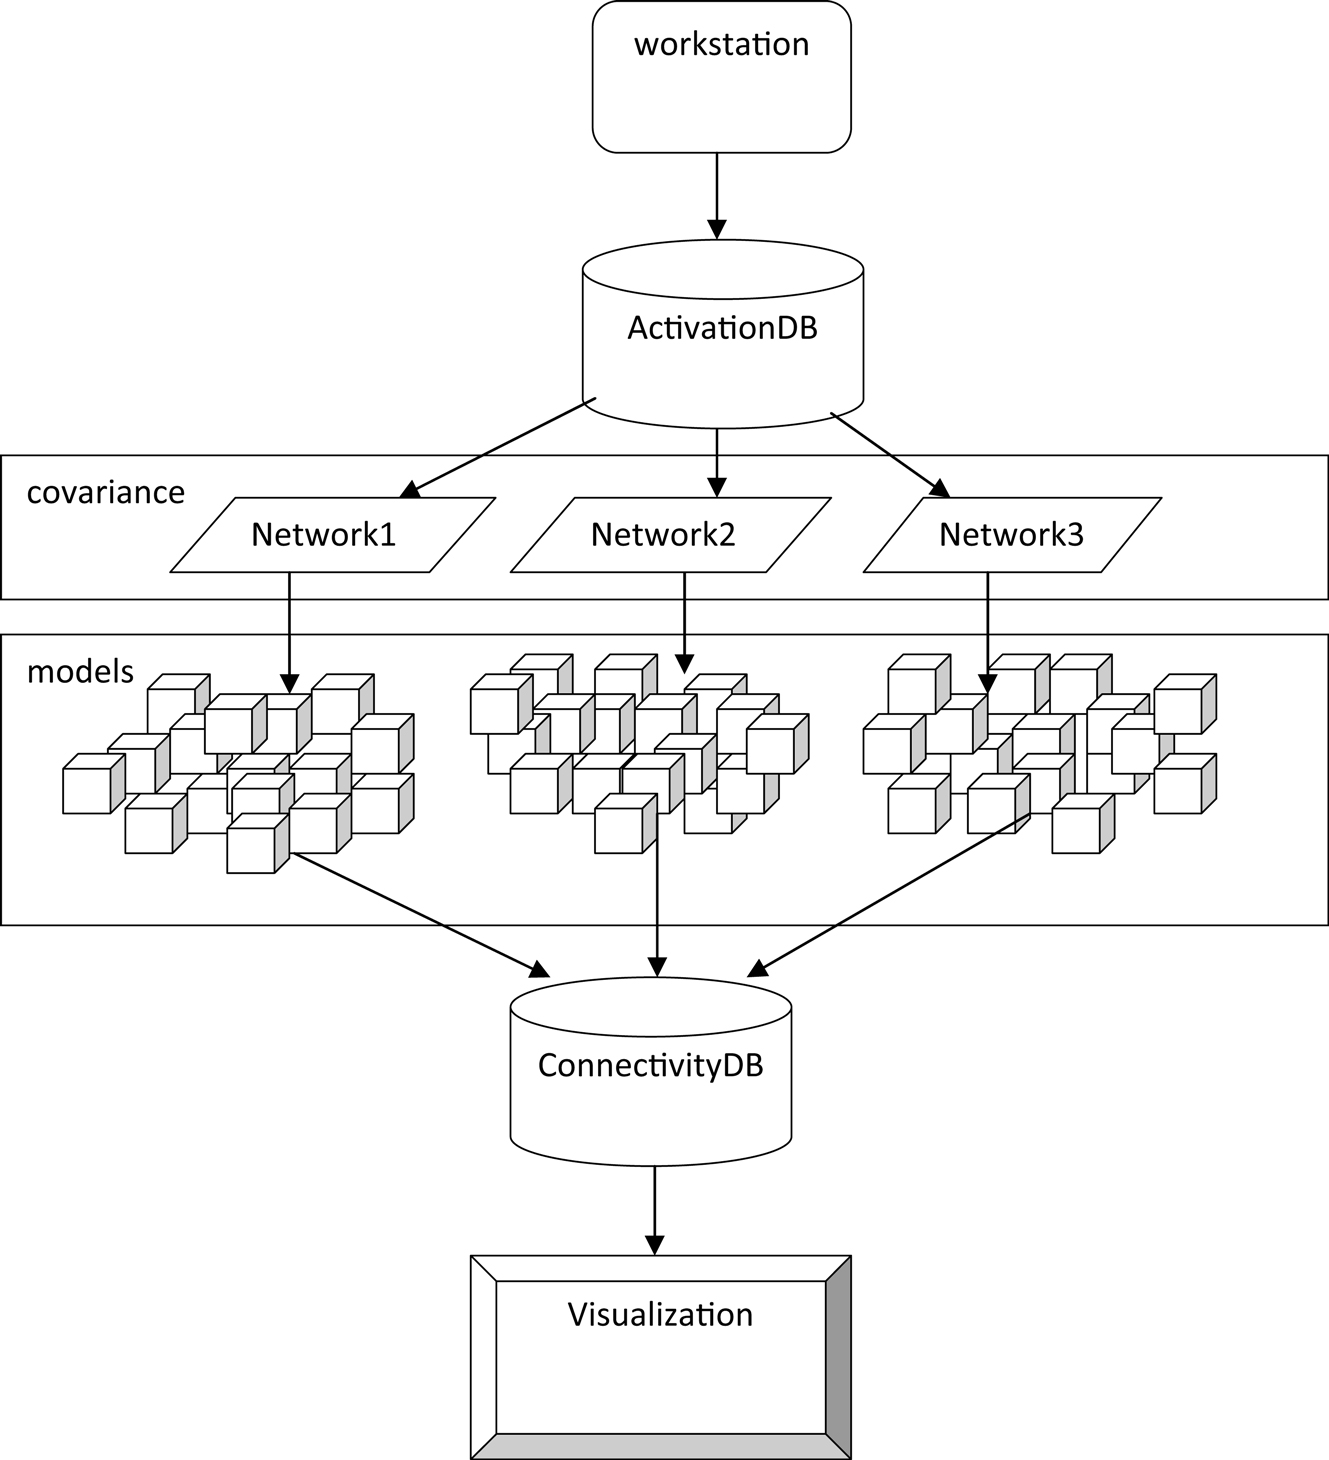
Figure 4. Multinetwork Swift workflow for the Emblem with Speech condition.
The authors declare that the research was conducted in the absence of any commercial or financial relationships that could be construed as a potential conflict of interest.
This research is supported in part by NSF grant OCI-721939, NIH grants DC08638, DA024304-02, DA-18673, 1R21DA024304—01, R21/R33 DC008638 and R01 DC07488, the U.S. Dept. of Energy under Contract DE-AC02-06CH11357, the James S. McDonnell Foundation and the TeraGrid HPC resources of the Texas Advanced Computing Center. The authors thank Ben Clifford and Mihael Hategan for creating and supporting the Swift parallel scripting system, and Michael Spiegal, Jeffrey Spies, and Tim Brick for developing and supporting the OpenMx system.
R Development Core Team (2008). R: A language and environment for statistical computing. R Foundation for Statistical Computing. Vienna, Austria. ISBN: 3-900051-07-0, Available at: http://www.R-project.org.