 Kazuki T. Shin'ya
 Tomohiro Miyasaka
 Takao Ukaji3
 Akihiro Harada
 Kohta I. Kobayashi
- 1Faculty of Life and Medical Sciences, Doshisha University, Kyoto, Japan
- 2Center for Research in Neurodegenerative Diseases, Doshisha University, Kyoto, Japan
- 3School of Pharmacy, Nihon University, Chiba, Japan
- 4Graduate School of Medicine, Osaka University, Osaka, Japan
The role of microtubule-associated proteins (MAPs) in neuronal morphogenesis is well-investigated; however, their specific contribution to the sensory nervous system remains largely unexplored. In this study, we examined the role of MAP2 in auditory sensing, which critically depends on the cytoskeletal structure. Four-week-old Map2 homozygous knockout (Map2−/−) mice exhibited auditory sensitivity equivalent to that of wild-type mice. However, auditory brainstem responses (ABRs) revealed that 16-week-old Map2−/− mice exhibited a 30-dB reduction in hearing sensitivity, with a more pronounced effect at higher frequencies. The ABR wave V peak latency pattern showed a loss of non-linearity in 16-week-old Map2−/− mice. The latency of the ABR wave V further suggested that this reduction was not due to conductive hearing loss. Whole-mount cochlear immunostaining indicated that MAP2 was expressed in the cell bodies of cochlear inner hair cells (IHCs) and outer hair cells (OHCs) in wildtype mice. Notably, MAP2 expression in cochlear hair cells was higher in the basal region, Map2−/− mice had fewer OHCs in the base region, corresponding to high-frequency hearing aligned with ABR measurements. Furthermore, the density and morphology of spiral ganglion neurons were not affected by the loss of MAP2. These findings suggest that MAP2 contributes to the maintenance of hearing sensitivity and plays an important role in cochlear hair cells, particularly in the high-frequency range.
1 Introduction
Hearing loss is the most common sensory disorder, affecting 5% of the global population (Sheffield and Smith, 2019; Wilson et al., 2017). It is influenced by both genetic and environmental factors, each of which is significant for the development and progression of the condition (Zheng et al., 2005; Xuan et al., 2020; Esfahani et al., 2017; Natarajan et al., 2017). Hearing loss caused by genetic mutations accounts for half of all cases of non-syndromic hearing loss. Recent advances in genome sequencing have led to the identification of more than 100 causative genes (Herediary Hearing Loss Homepage, 2024). Genes responsible for hearing loss are mainly involved in functions such as the development and physiology of the inner ear, the hair cell cytoskeleton, hair cell adhesion, intracellular transport, ion hemostasis, the extracellular matrix, and transcription factors (Zhou et al., 2023; Liu et al., 2021; Ingham et al., 2021; Zheng et al., 2009; Robles and Ruggero, 2001). Despite these advances, the causes of 20% of genetic hearing-loss cases remain unidentified, highlighting the need to identify the unknown contributing genetic factors.
The auditory system receives sounds as mechanical vibrations and converts them into electrophysiological responses in cochlear hair cells, which have unique cytoskeletal structures. Inner ear hair cells are highly differentiated, polarized epithelial cells with stereocilial bundles at the apical surface. The stereocilia involve arranged filamentous actin (F-actin) with associated proteins. Furthermore, these are inserted into and supported by a dense mesh of crosslinked F-actin known as the cuticular plate and are also supported by the microtubule network. Because normal hearing necessitates the sensing of nanoscale mechanical motion, which is much smaller than the stereocilial diameter, the cytoarchitectural integrity of hair cells is highly critical. Thus, mutations in genes encoding such cytoskeletal proteins cause deafness.
Mutations in the γ-actin (Actg1) gene, encoding a major isoform of actin in stereocilia, cause autosomal dominant progressive hearing defects in humans (Rendtorff et al., 2006). Trio and F-actin binding protein (TRIOBP) is a protein that organizes the root structures of stereocilia, and its deficiency causes non-syndromic recessive deafness due to decreased stiffness and the degeneration of stereocilia (Kitajiri et al., 2010). Recently, genetic mutations in the Tubb4b gene, encoding an isotype of beta-tubulin, have been found to be associated with early-onset deafness (Maasz et al., 2022). Such tubulinopathies imply that the structures or functions of microtubules are also essential for hearing functions (Bodenbender et al., 2024). Microtubules are tubule-like polymers composed of alpha/beta-tubulin, and they have structural flexibility called dynamic instability that is associated with cellular functions (Conde and Cáceres, 2009; Kaverina and Straube, 2011; Huang et al., 2022). Microtubule stability is regulated by many binding factors, including microtubule associated proteins (MAPs). Thus, it is plausible that MAP dysfunctions can affect hearing ability.
Among the key MAPs involved in microtubule dynamics, MAP2 is a prominent phosphoprotein. MAP2 is localized in the cell bodies and dendrites of mature neurons, with minimal expression in axons (Bernhardt and Matus, 1984; Camilli De et al., 1984). It is a widely used marker for neuronal dendrites. MAP2 binds to microtubules and contributes to their polymerization and stabilization (Itoh and Hotani, 1994; Gamblin et al., 1996). In neuronal dendrites, MAP2 binds to various protein kinases, including protein kinase (PKA), and localizes them to dendrites, thereby regulating microtubule dynamics and contributing to neuronal morphological changes (Obar et al., 1989; Rubino et al., 1989; Slepecky and Ulfendahl, 1992). Consequently, the expression and proper function of MAP2 are essential for normal neuronal development, synaptic plasticity, and the overall stability of neural circuits. The MAP2 gene homolog has been conserved throughout evolution, from invertebrates to mammals. Although the deletion of this gene in mice induces decreased dendrite outgrowth and abnormal PKA localization, it does not result in any lethal phenotypic abnormalities, unless these mice are crossed with Map1b-knockout mice (Teng et al., 2001). Thus, the significance of this protein in individual organisms remains largely unclear.
In addition to the soma and dendrites of neurons, MAP2 is expressed in cochlear hair cells (in both humans Anniko and Arnold, 1995 and rats Ladrech and Lenoir, 2002). Furthermore, several recent studies have reported that MAP2 can interact with actin, which forms the core structure of the stereocilia in cochlear hair cells (Roger et al., 2004). Based on this evidence, we hypothesized that MAP2 functions in hearing and evaluated auditory functions in Map2-knockout mice.
2 Materials and methods
2.1 Animals
Male C57BL/6J wildtype (Map2+/+) mice (4 weeks: N = 7, 16 weeks: N = 10) and male Map2 homozygous knockout (Map2−/−) mice (4 weeks: N = 7, 16 weeks: N = 13) were used in the auditory brainstem response (ABR) recording experiment, while male Map2+/+ mice (16 weeks: N = 5) and male Map2−/− mice (16 weeks: N = 5) were used in the immunostaining experiment. Williamson et al. (2019) observed a sex difference in susceptibility to hearing loss (with greater susceptibility in males); accordingly, only males were used in this study. All animals were housed in groups of 2–5 per cage (25.5 × 15 × 13.5 cm) in an animal facility at the University of Doshisha under a 12-h light/dark (8:00 AM to 8:00 PM light) cycle in a temperature-controlled room (23.0 ± 1 °C). The animals were allowed ad libitum access to standard chow and water. The animal experiments were conducted according to the protocol reviewed and approved by the Institutional Animal Care and Use Committee of DOSHISHA University (Permit No. D23039).
2.2 ABRs measurement
ABR measurements were performed in a sound-proofed room. Animals were anesthetized using three types of mixed anesthetic agents (medetomidine: 0.3 mg/0.3 mL/Kg, midazolam: 4 mg/0.8 mL/kg, butorphanol: 5 mg/1 mL/kg). Body temperature was maintained at approximately 37 °C with a disposable heating pad during anesthesia. Sound stimuli were generated using MATLAB (R2019a; MathWorks Inc., Natick, MA, USA) at a sampling frequency of 192 kHz. Ten frequencies (2, 4, 8, 16, 32, 50, 60, 64, 68, and 72 kHz) were used for ABR measurements. The duration of the sound stimuli was 5 ms (rising and falling: 1 ms), and the inter-stimulus interval was 60 ms. Each frequency was presented 100 times in succession. All the acoustic stimuli were presented using a loudspeaker (ES1, Tucker–Davis Tech. Inc., Alachua, FL, USA) and speaker driver (ED1, Tucker–Davis Tech. Inc., Alachua, FL, USA) through a sound card (UA-101, Roland Corp., Hamamatsu, Japan) and an amplifier (SRP-P2400, SONY Corp., Tokyo, Japan) with a programmable attenuator (PA5, Tucker-Davis Tech. Inc.). The sound pressure levels of the stimuli were calibrated with a microphone (TYPE 7016, ACO CO., LTD., Chiba, Japan) and acoustimeter (TYPE 5935, Brüel & Kjær, Nærum, Denmark) placed 10 cm in front of the animal's head. ABRs were recorded using three electrodes placed on the surfaces of the inferior colliculus (recording electrode), motor cortex (reference electrode), and right head skin (ground electrode). Both recording and reference electrodes were connected to a bioamplifier (RHD2000 Interface; Intan Tech. Inc., Los Angeles, CA, USA), and the raw signals were filtered (0.3–3 kHz) and averaged over 100 repetitions at each frequency and intensity using a custom program coded in MATLAB. The sound level of the stimulus started at 80 dB SPL (re: 20 μPa) and decreased in 5-dB steps until it reached 0 dB SPL. The baseline was defined as the maximum amplitude during the 5-ms period before the onset of the sound stimulus. The wave V of the ABR was visually confirmed between 5.4 and 9.6 ms after stimulus onset, and the maximum amplitude of the wave V was extracted. In addition, the minimum sound pressure level capable of evoking a wave V greater than the baseline was identified as the ABR threshold. ABR audiograms were determined. The ABR wave V peak latency (PL) was measured and calculated offline.
2.3 Whole-mount immunostaining of cochlea
Whole-mount immunostaining of the cochleae was performed according to the established protocol (Montgomery and Cox, 2016). In brief, after being anesthetized with a mixture of medetomidine (0.3 mg/kg), midazolam (4 mg/kg), and butorphanol (5 mg/kg), animals were transcardially perfused with phosphate-buffered saline (PBS), followed by perfusion with a 4% paraformaldehyde (PFA) in PBS. After 2 days of fixation, the left and right temporal bones containing the cochlear bullae were removed. Samples were immersed in a decalcification solution (120 mM ethylenediaminetetraacetic acid, 2.5% formic acid in aq.) at room temperature for at least 3 days. Then, the cochleae were divided into three turns (apex, middle, and base). Based on the place-frequency map (Müller et al., 2005), we estimated the frequency ranges corresponding to each turn and found that the apical, middle, and basal turns corresponded to 4.8–14.8, 14.8–34.1, and 34.1–78.8 kHz.
For immunostaining, tissues were immersed in a blocking buffer (PBS with 5% normal goat serum and 1% Triton-X100) for 1 h at room temperature and were then incubated with the primary antibody solution (5% goat serum, 1% bovine serum albumin (BSA), and 0.1% Triton-X100 in PBS containing the following primary antibodies: rabbit polyclonal anti-myosin VIIa (1:500; Proteus Biosciences, #25-6790) and chicken polyclonal anti-MAP2 (1:5,000; biosensis, #C-1382-50) for 2 days at room temperature. After the primary reaction, the samples were washed four times for 1 h with PBS and were then incubated with the secondary antibody solution (Alexa Fluor 555-conjugated anti-rabbit IgG (1:500; Thermo Fisher Scientific, #A_21429) and Alexa Fluor 488-conjugated anti-chicken IgY (1:500; Thermo Fisher Scientific, #A_11039) in PBS, with 1% BSA, 5% goat serum, and 0.1% Triton-X100, for 2 days at room temperature. After washing with PBS, all tissues were mounted on glass slides and coverslipped with a mounting agent (ProlongTM Diamond Antifade Mountant, Thermo Fisher Scientific, #P36961). Fluorescence images were captured using a LSM 700 Zeiss confocal microscope (Carl Zeiss, Oberkochen, Germany) using 10 × /0.3 Plan-Apochromat and 40 × /0.95 Korr Plan-Apochromat ∞/0.13–0.21 objectives, and fluorescence data were analyzed using Zeiss Zen software. Five to six images were acquired for each cochlear turn at equally spaced intervals along the spiral. The presence or absence of hair cells was determined based on the fluorescence intensity of the myosin VIIa antibody. Fifteen hair cells were randomly selected at each turn, and the average MAP2 fluorescence intensity in the region of interest was measured. To avoid signal saturation, imaging was performed with sensitivity adjusted such that SGNs in the field of view, which exhibit stronger signal intensity than that of hair cells, did not become saturated. The laser fluorescence sensitivity and imaging settings adopted in the initial observations were used for all samples to ensure consistency among different preparations. For each turn, the numbers of OHCs and IHCs were quantified by counting and averaging the number of cells per 100 μm using ImageJ software to facilitate the counting process by placing markers on counted cells to produce a permanent data record. To identify MAP2 localization in cochlea hair cells, samples were blocked with 2% BSA in PBS and incubated with a rabbit anti-MAP2N polyclonal antibody (1:1,000, raised in-house Kubo et al., 2019), followed by Alexa Flour 555–conjugated anti-rabbit IgG (1:1,000, Invitrogen, A31572) and Alexa Flour 633–conjugated Phalloidin (1:200, Invitrogen, A22284). Samples were counterstained with DAPI (Vector Laboratories, H-1200). Fluorescence images were captured using a LSM 710 Zeiss confocal microscope (Carl Zeiss), and fluorescence data were analyzed using Zeiss Zen software.
2.4 Hematoxylin/eosin (HE) staining for the spiral ganglion neurons (SGNs)
Animal euthanasia and perfusion were performed using the same protocol as for whole-mount staining. For HE staining, the entire head of the mouse was decalcified for 7 days using 22.5% formic acid, 10% citric acid, and 2% NaOH in aq. The specimens were dehydrated with ethanol, cleared with xylene, and embedded in paraffin (3 h × 2 times in 100% paraffin, followed by overnight immersion). The embedded samples were sectioned at 6 μm thickness using a microtome and stained with HE. Imaging of these sectioned specimens was performed using an optical microscope (BX53, Olympus, Tokyo, Japan).
2.5 Statistical analysis
Statistical analyses were conducted using the standard analysis software SigmaPlot 10.0 (Systat Software Inc., San Jose, CA, USA) and R (version 2.7-1, R Foundation for Statistical Computing, Vienna, Austria) with the EZR plugin (version 1.55) (Kanda, 2013). All values are presented as the mean ± standard error of the mean. Averaged data were compared using unpaired Student's t-test (as indicated) for two categories. Statistical significance was set at P < 0.05.
3 Results
3.1 Loss of MAP2 causes reduced hearing sensitivity
Auditory brainstem responses (ABRs) were measured in wild-type (Map2+/+) and Map2 homozygous knockout (Map2−/−) mice. Audiograms of the ABR threshold were measured to evaluate the effect of MAP2-deficiency on auditory sensitivity, and the latency-intensity function of the ABR was evaluated to gain physiological insights into sensitivity changes. When tone bursts of 2, 4, 8, 16, 32, 50, 60, 64, 68, and 72 kHz were used to record ABRs in 4 and 16-week-old male mice, the ABRs of 16-week-old Map2−/− mice showed response-threshold elevations with frequency characteristics distinct from those of 16-week-old Map2 +/+ mice (Figures 1A, 2). The ABR thresholds of Map2−/− mice were higher than those of Map2+/+ mice from 4 to 32 kHz, with a maximum increase of 30 dB at 16 kHz (Figure 2). No ABR above 50 kHz was observed in Map2−/− mice, even with the loudest stimulus (90 dB SPL). At 4 weeks old, there were no significant differences in the hearing threshold between the two groups. The peak latency of wave V in Map2−/− mice increased quasi-linearly as the sound pressure level decreased, while that in Map2+/+ mice began to plateau below 65 dB SPL, revealing a loss of non-linearity of the wave V latency to weak sound in Map2−/− mice (Figure 1B). These results indicate that the Map2−/− mice showed progressive high-frequency hearing loss, a characteristic of sensorineural hearing loss.
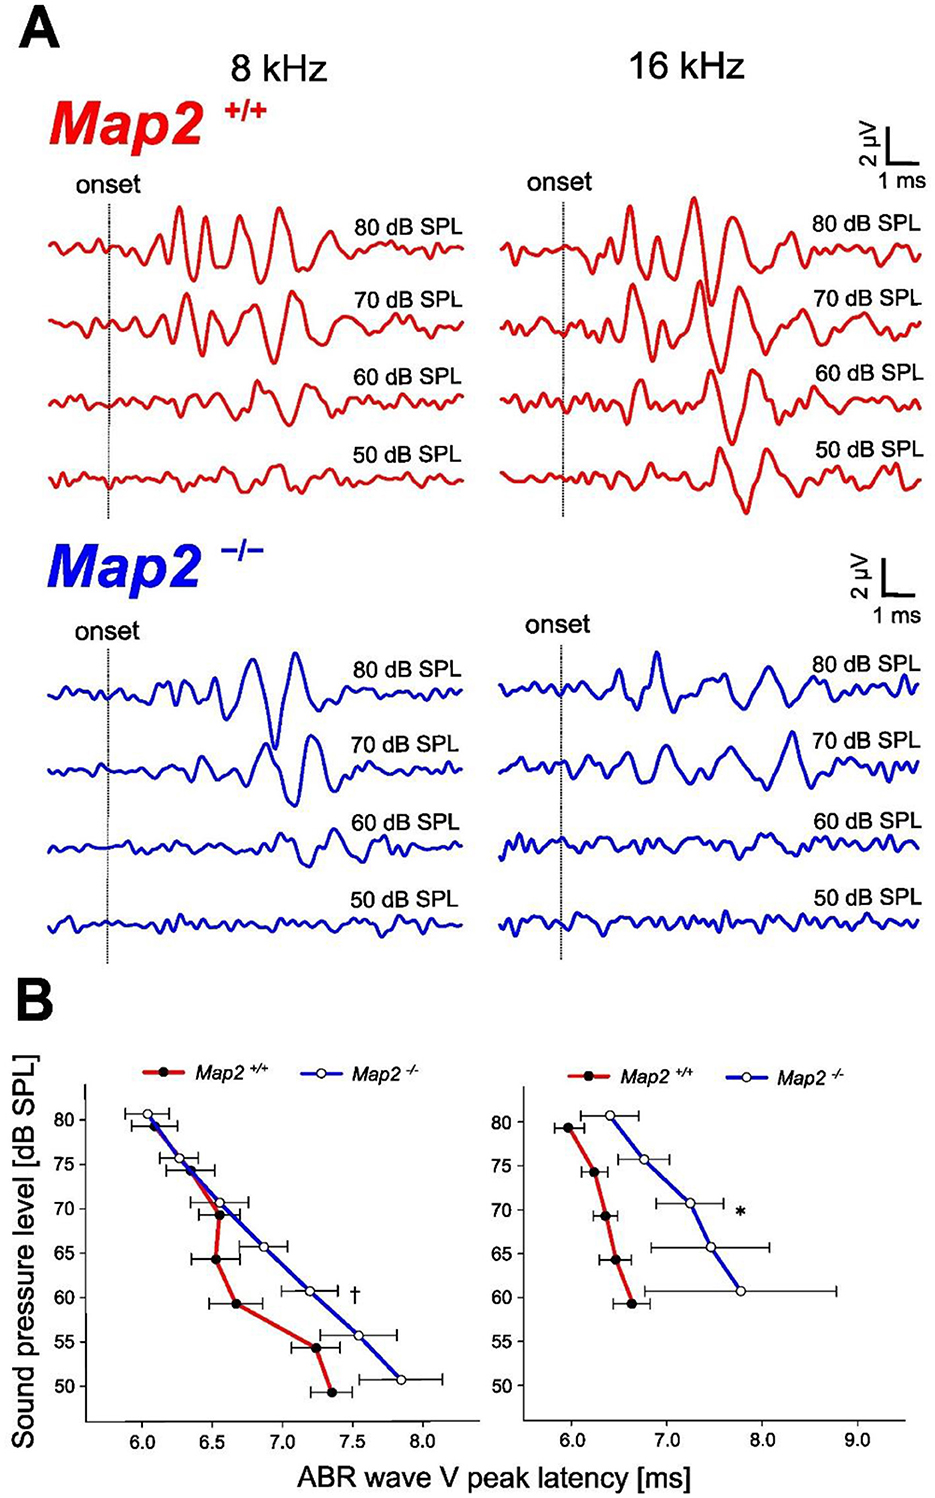
Figure 1. Hearing loss phenotype of Map2−/− mice. (A) Representative auditory brainstem response (ABR) waveforms evoked by a tone burst (8, 16 kHz) in 16 weeks Map2+/+ (red) and Map2−/− (blue) mice. (B) ABR wave V peak latency of 8 and 16 kHz sound stimuli. Map2−/− mice showed a significantly longer ABR wave V peak latency than that of Map2+/+ mice and loss of non-linearity. Data are expressed as the mean ± standard error of the mean (SEM). †P < 0.1; *P < 0.05 by unpaired Student's t-tests with Bonferroni's correction (16 weeks Map2+/+: N = 7, 16 weeks Map2−/−: N = 9).
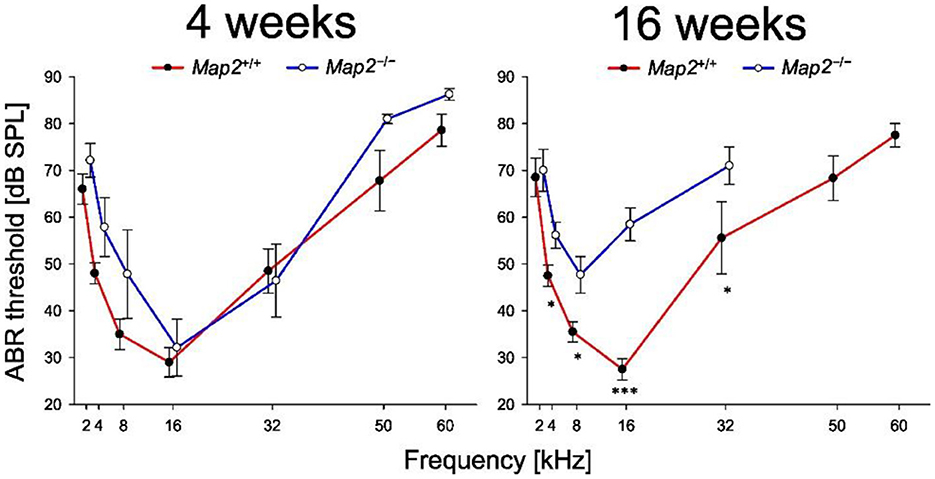
Figure 2. Map2−/− mice exhibited a decline in hearing sensitivity earlier. Audiograms of Map2+/+ and Map2−/− mice. Map2−/− mice had a significantly higher ABR threshold (dB SPL) than that of age-matched Map2+/+ mice. Data are the mean ± SEM. *P < 0.05; ***P < 0.001 by unpaired Student's t-test with Bonferroni's correction (4 weeks: Map2+/+: N = 7, Map2−/−: N = 7, 16 weeks: Map2+/+: N = 10, Map2−/−: N = 13).
3.2 MAP2 localizes to OHCs and IHCs
ABRs analyze indicated the loss of non-linearity in response latency and the significant decrease in auditory sensitivity, both of which suggest abnormalities in the cochlear outer hair cells. To elucidate the responsible site for the hearing impairment induced by MAP2 deficiency, MAP2 localization in the cochlear hair cells was determined using whole-mount cochlear immunofluorescent staining. Anti-MAP2 antibodies labeled neurons in the cochlear ganglion as well as hair cells at the apex, middle, and base of the cochlea (Figure 3). The MAP2 fluorescence intensity in wild-type mice varied depending on the turn, with the highest intensity in the basal turn and the lowest in the apical turn (Figure 3E). High magnification view indicates that both inner and outer hair cells express MAP2 as reported previously. These fluorescence signals were abolished in the cochleae of Map2−/− mice. MAP2 appeared to be expressed throughout the whole cell bodies of both OHCs and IHCs. Phalloidin, an F-actin marker, strongly labeled the stereocilia and cuticular plates but simultaneously labeled cell junctions and weakly labeled the cytoplasm (Figure 4).
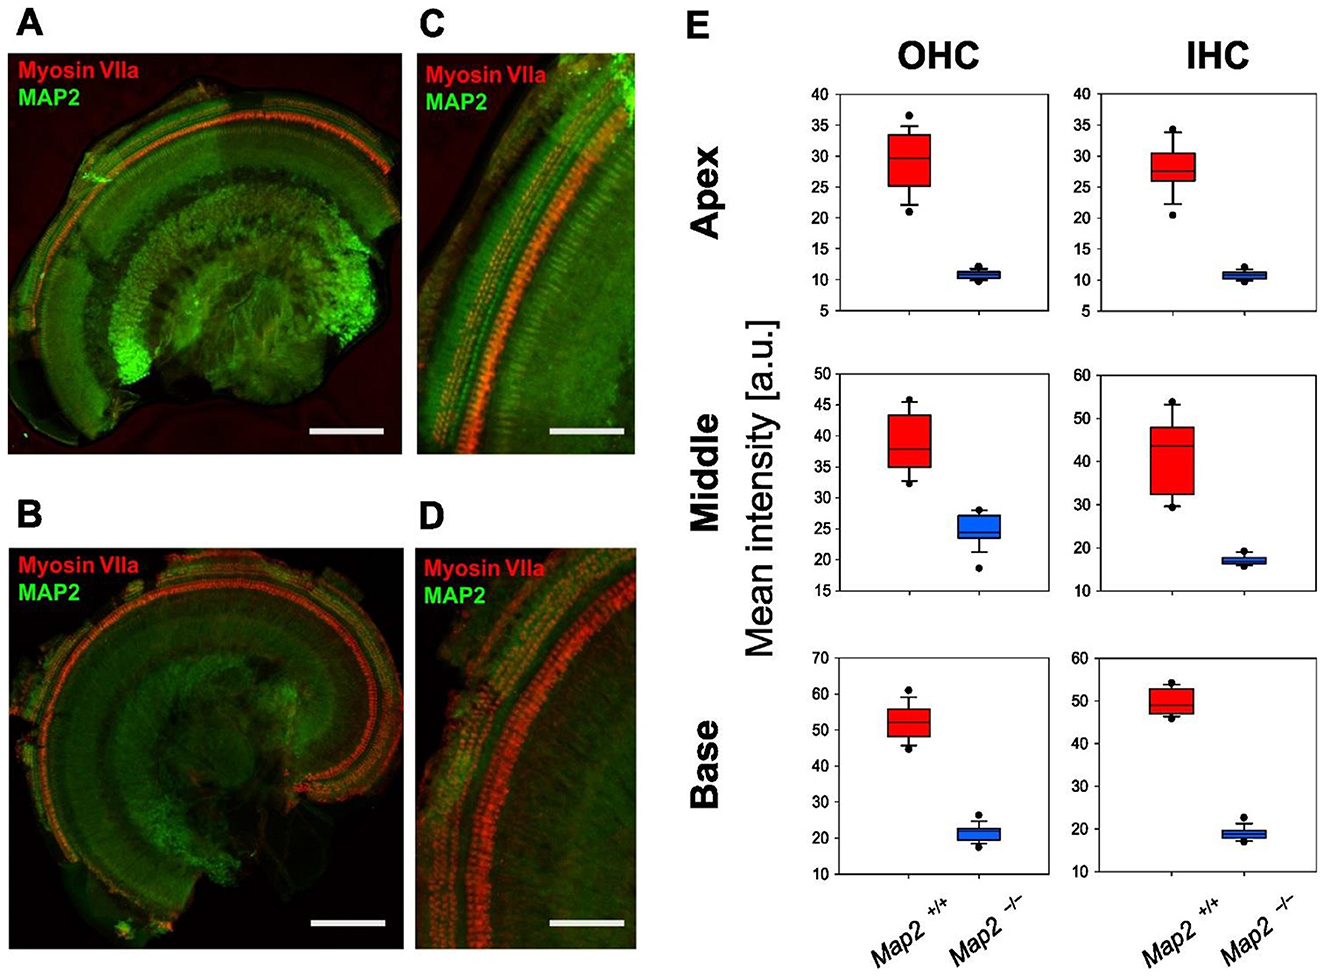
Figure 3. Expression of MAP2 in Map2+/+ and Map2−/− mouse cochlea. Immunofluorescence staining shows the expression of MAP2 (green) and myosin VIIa (red) in the cochlear outer hair cells (OHCs: 3 rows) and inner hair cells (IHCs: 1 row) and spiral ganglion (center of the sample) of the (A, C) Map2+/+ and (B, D) Map2−/− mice. Myosin VIIa was used as a hair cell marker. (A, B) Scale bar = 200 μm. (C, D) Scale bar = 50 μm. (E) Distribution of MAP2 fluorescence intensity of OHCs and IHCs. The boxes and the middle line represent the first (25%), second (50%), and third quartiles (75%). The whiskers represent 10% and 90%. Outliers indicate 1% and 99%.
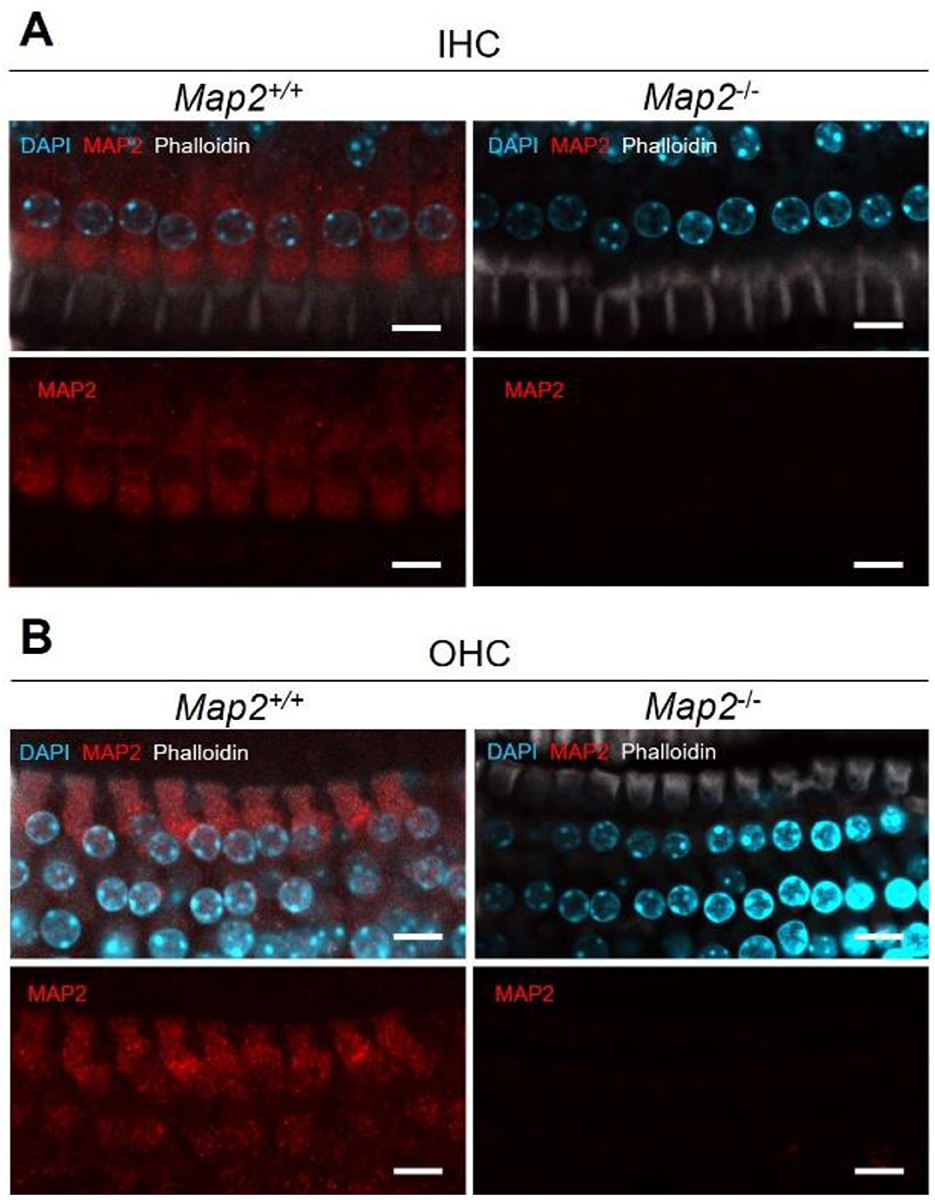
Figure 4. MAP2 expression in the (A) inner hair cells (IHCs) and (B) outer hair cells (OHCs) in Map2+/+ and Map2−/− mice. Representative images of inner ear hair cells in cochleae from Map2+/+ mice and Map2−/− mice aged 16 weeks. MAP2 labeled the entire cell body of the OHCs and IHCs (red). Stereocilia, cuticular plates, cell junctions and cytoplasm were labeled with phalloidin (white). Nuclei were stained with DAPI (light blue). Scale bar = 10 μm.
3.3 Loss of MAP2 reduces the number of OHCs in the inner ear, corresponding to the high frequency band
To probe whether the hearing loss in MAP2 deficiency are caused by the reduced viability of hair cell, the number of hair cells per turn in the cochlea was determined by immunostaining with myosin VIIa, a marker of hair cells. Map2−/− mice had approximately 35% lower number of OHCs in the base of cochlea. No difference was seen in that of OHCs in regions other than in the base of the cochlea or in the inner hair cells (IHCs) of any region of the cochlea between Map2+/+ and Map2−/− mice (Figure 5).
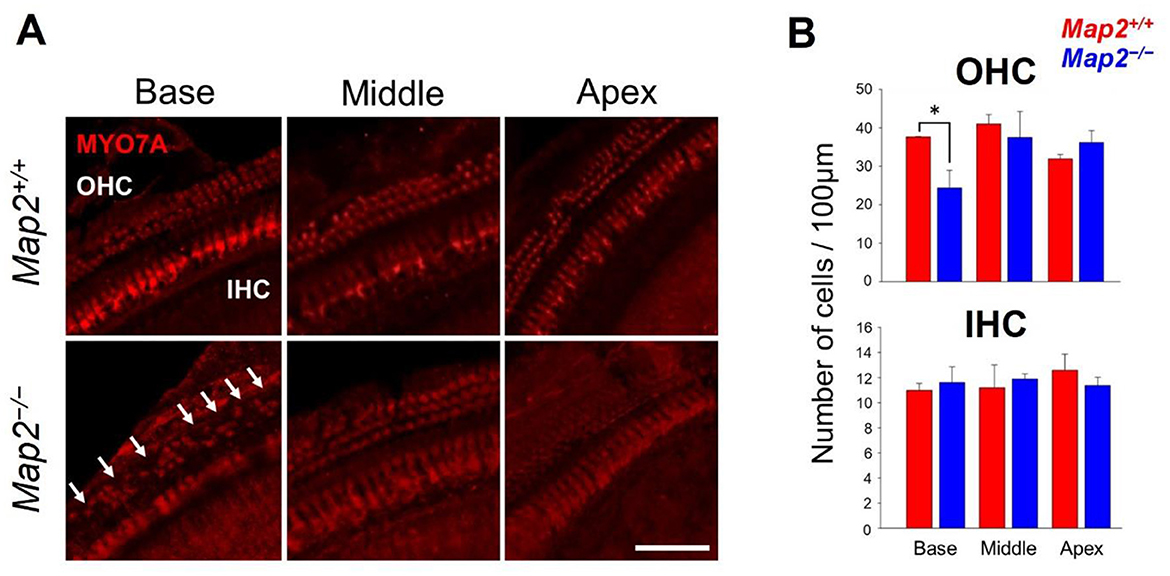
Figure 5. Comparison of the number of live hair cells between Map2+/+ and Map2−/− mice. (A) MYO7A distribution in OHCs and IHCs in base, middle, and apical turns of the cochlea in Map2+/+ (top panels) and Map2−/− mice (bottom panels). White arrows show the loss of OHCs. Scale bar = 50 μm. (B) Comparison of the numbers of OHCs (top panel) and IHCs (bottom panel) between Map2+/+ and Map2−/− mice. The number of OHCs in the basal turn of Map2−/− mice was significantly lower than that of Map2+/+ mice (unpaired t-test: *P < 0.05). The number of OHCs in both the middle and basal turns did not differ between Map2+/+ and Map2−/− mice. Similarly, the number IHCs did not differ between Map2+/+ and Map2−/− mice across the entire cochlea. The red bar represents Map2+/+ mice (N = 5), and the blue bar represents Map2−/− mice (N = 5). Bars represent the mean ± standard error of the mean (SEM).
3.4 Loss of MAP2 did not affect the forms and density of SGNs
We investigated whether a MAP2 deficiency affects the morphology of SGNs. The SGNs of Map2−/− mice maintained the same cell density and morphology observed in wild-type mice at 16 weeks old, and no infiltration by non-neuronal cells, such as microglia, was observed (Figure 6).
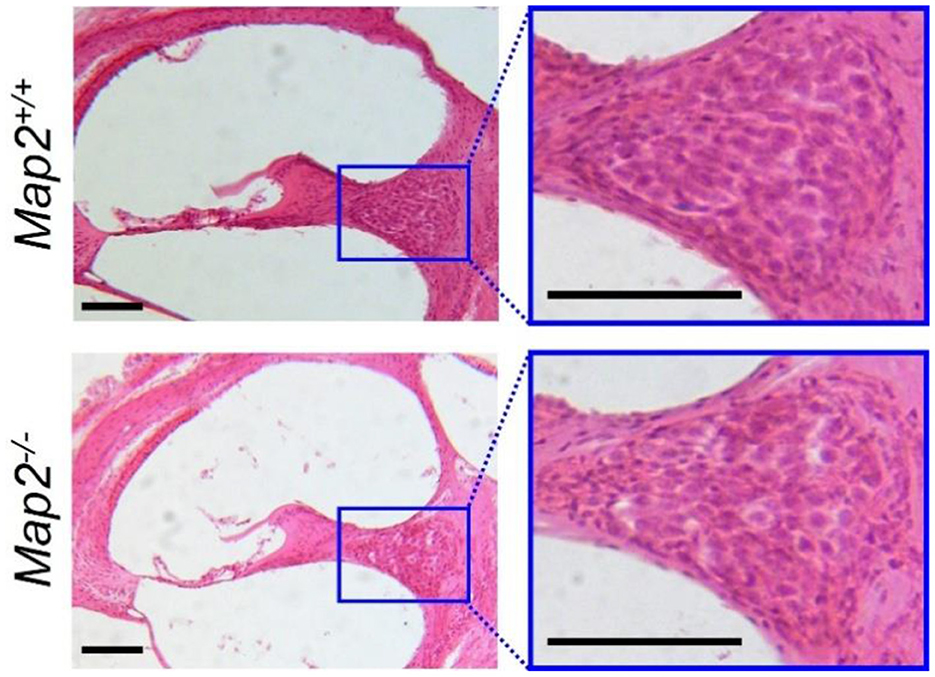
Figure 6. Density and morphology of SGN in Map2+/+ and Map2−/− mice. The left images show cross sections of Map2+/+ (upper) and Map2−/− mice (lower) cochlea, stained with HE, and cut along its vertical axis. Magnification = 10×. Scale bar = 100 μm. The right images show zoomed-in view of the SGNs. Magnification = 20×. Scale bar = 100 μm.
4 Discussion
Here we showed that loss of MAP2 causes hearing disorder by in vivo experiment. Specifically, audiograms generated by recording ABRs showed that 16-week-old Map2−/− mice had reduced hearing sensitivity compared to that in 16-week-old Map2+/+ mice, particularly in the high-frequency range. As the frequency of stimulus decreased, the difference decreased and became statistically insignificant at a frequency of 2 kHz. C57BL/6 mice are known to develop age-related hearing loss from around 12-week-old in the wild type. Under the conditions of this study, no increase in high-frequency ABR thresholds was observed in Map2+/+ mice, but significant hearing loss was observed in Map2−/− mice, suggesting that MAP2 deficiency may increase vulnerability in the high-frequency range. This interpretation accords with the observation that 4-week-old Map2−/− mice do not exhibit clear hearing loss. It is plausible that factors affecting the vulnerability of sensory hair cells determine the onset of it. Thus, a detailed understanding of the role of MAP2 in the auditory system may contribute to the establishment of strategies to prevent the progression of hearing loss.
Sensorineural hearing loss caused by damage to the inner ear or a more central part of the auditory pathway, shows a frequency dependent or acoustic feature dependent decrease in hearing sensitivity. The frequency dependent hearing loss observed in Map2−/− mice falls under the category of sensorineural hearing loss. Additionally, in typical conductive hearing loss, the latency-intensity function of the hearing impairment is expected to shift upward from normal hearing in proportion to the degree of hearing loss (Qin et al., 2010). However, the latency-intensity function of the wave V shows that the difference in latency between Map2+/+ and Map2−/− mice increased as the stimulus intensity decreased. Overall, the ABR response of Map2−/− mice does not contradict the symptoms of sensorineural hearing loss and suggests that loss of MAP2 disrupts cochlear function and/or the central auditory pathway.
Hair cells in the basal turn of the cochlea exhibit a greater intrinsic vulnerability to damage compared with that of their apical counterparts, a phenomenon observed across various insults, including ototoxic agents (Kamimura et al., 1999; Forge and Schacht, 2000), acoustic overstimulation (Chan and Fechter, 2003), and age-related degeneration (Mahendrasingam et al., 2011). This tonotopic gradient of susceptibility is recapitulated in organotypic culture models, where basal hair cells consistently demonstrate higher sensitivity to a range of stressors (Sha et al., 2001). Several genes have been reported to display tonotopically graded patterns that correlate with this gradient of vulnerability (Yoshimura et al., 2004). A notable example is PKHD1L1, localized to the tips of cochlear hair cells and enriched in the high-frequency region, which is most frequently exposed to mechanical stress from sound. The loss of the Pkhd1l1 gene results in progressive hearing loss (Wu et al., 2019), suggesting that its expression protects against damage. In our study, the fluorescence intensity of MAP2 in hair cells also exhibited a clear tonotopic gradient, with the highest values in the basal turn and the lowest values in the apical turn. Although the functional significance of this pattern remains unclear, it is possible that MAP2, similar to PKHD1L1, contributes to resilience against damage. Given that MAP2 is involved in cytoskeletal organization, its higher expression in the basal region could support structural integrity and resistance to mechanical stress.
Furthermore, staining of cochlear revealed that MAP2 expression was observed in both IHCs and OHCs. A previous study reported that MAP2c, one of the isoforms of MAP2, was expressed in both IHCs and OHCs and was distributed more densely in OHCs than in IHCs, specifically at the border between the cell bodies (near the root of the stereocilia) of OHCs (Ladrech and Lenoir, 2002), but no significant difference in fluorescence intensity was observed in the cytoplasm. The antibody we used reacts with all MAP2 isoforms, so it is not possible to distinguish between isoforms, but it is likely to be the MAP2c fluorescence. Co-staining with MAP2 and phalloidin revealed that MAP2 fluorescence was present in the cytoplasm of both OHCs and IHCs. MAP2c is known to cross-link and bundle with actin (Roger et al., 2004), the main component of stereocilia and cuticular plates. Although the precise role of MAP2 in hair cell function has not yet been defined, its selective expression in hair cells suggests that MAP2 plays a critical role in the maintenance and/or function of these cells, which can explain the hearing loss in Map2−/− mice.
The loss of MAP2 reduced the number of OHCs in the basal turn of the cochlea, suggesting that MAP2 is an important protein in the maintenance of OHCs. As the outer OHCs in the basal turn are considered the most susceptible to mechanical stress from sound stimuli (Cody and Russell, 1987), the selective decrease in OHCs in the basal turn suggests that MAP2 may play a role in mechanical stress resistance. This hypothesis is partially supported by our observation of MAP2 expression in the cuticular plates, which are among the main cellular structures affected by acoustic trauma. However, the hearing sensitivity of Map2−/− mice was significantly reduced not only in the high-frequency range (ca. 34.1–78.8 kHz), corresponding to the basal turn, but also in the relatively low-frequency range (below 34.1 kHz), corresponding to the middle and basal turns, where no difference in cell number was observed. This discrepancy suggests that hearing insensitivity caused by MAP2 deficiency cannot be solely attributed to hair cell loss. Because of the technical limitation, we have not addressed whether the survived MAP2-deficient hair cells have normal physiological functions. However, if MAP2 in hair cells contributes to the mechanical property of stereocilia, such as stiffness, possibly through interaction with F-actin, the loss of MAP2 could simultaneously impact mechanotransduction (i.e., ABR sensitivity) and vulnerability to mechanical stress (i.e., reduction in OHCs). This hypothesis is consistent with several findings that genetic mutations affecting the mechanical properties of stereocilia can lead to hearing loss (Shi et al., 2022; Moon et al., 2020). Thus, hair cells (in particular OHCs) are specifically vulnerable to MAP2 deficiency, and loss of these cells may be one of the causes of frequency dependent hearing impairment in Map2−/− mice.
Cochlear hair cells exhibit unique structural specializations, including stereocilia. MAP2 may be involved in these structural features. For example, ribbon synapses of IHC are unique architectural features, and losses and dynamic changes due to noise exposure cause hearing impairment (referred to as hidden hearing loss) (Ismail Mohamad et al., 2024). MAP2 binds to and supports the function of F-actin and microtubules, which play crucial roles in cell movement, axon growth, and the transport of organelles/proteins to the growth cone (Arnette et al., 2016). At the presynaptic terminal, F-actin and microtubules are involved in the rapid/slow replenishment of synaptic vesicles (Piriya Ananda Babu et al., 2020). Although a MAP2 deficiency did not reduce the number of IHCs, it may impair these systems, thereby hindering the proper functioning of ribbon synapses. It is also possible that loss of MAP2 disrupts the synaptic output of IHCs. Tubulin expression has been observed in both IHCs and OHCs, with microtubule bundles running parallel to the longitudinal axis of the cell (Slepecky and Ulfendahl, 1992; Steyger et al., 1989). Given that MAP2 regulates microtubule stability and dynamics, its genetic loss would be expected to disrupt the microtubule network and hinder intracellular vesicular transport toward the basal synaptic pole of hair cells, thereby attenuating their output. Overall, the role of MAP2 in hair cells other than stereocilia was not sufficiently considered in this study and should be a focus of future research.
It is also important to consider that MAP2 deficiency may affect the proximal auditory neuronal pathway more than it does the cochlea. MAP2 and its paralog bind to microtubules and regulate their length, thereby contributing to the cellular morphology and transport of substances (Harada et al., 2002). Its potential contribution to normal neural functions, including neurodevelopment, remains poorly understood. However, it is reasonable to consider that MAP2 slightly but definitively affects the function of the auditory neuronal pathway, and thereby produces the hearing loss phenotype involving the ABR wave V in Map2−/− mice. Indeed, a reduction in ABR wave V amplitude following acoustic exposure reflects synaptic dysfunction in mice (Mehraei et al., 2016), and a defect in Map1b, which encodes a protein closely related to MAP2 and plays a complementary role to that of MAP2, has been reported to cause hearing loss due to spiral ganglion neurons dysfunction (Cui et al., 2020). We also found that Map2−/− mice do not show alterations in SGN morphology; however, the neural function of the SGNs and other auditory pathways up to the inferior colliculus, which are the main wave V sources, warrant investigation.
(Sloan-Heggen et al. 2016) reported that pathogenic variants in 49 different genes were identified in 39% of patients with hearing loss, indicating that much of the genetic basis of hearing impairment remains unclear. According to a recent review (Feng et al., 2023), 120 genes are known to be associated with hearing impairment, and a significant number of these genes are involved in cytoskeletal changes in inner ear hair cells. Numerous Map2 variants are present in humans (Kalcheva et al., 1995) and could potentially contribute to the genetic basis of hearing impairment. Further investigation in future studies must be needed how mutations in Map2 impact on clinical deaf cases.
In conclusion, our study demonstrates that a deficiency in Map2, which encodes a microtubule-associated protein, causes OHC loss, resulting in high-frequency hearing loss. Our findings provide insights into the pathophysiology of hearing loss caused by hair cell damage and are expected to contribute to the development of therapeutic interventions.
Data availability statement
The raw data supporting the conclusions of this article will be made available by the authors, without undue reservation.
Ethics statement
The animal study was approved by Institutional Animal Care and Use Committee of Doshisha University. The study was conducted in accordance with the local legislation and institutional requirements.
Author contributions
KS: Writing – review & editing, Formal analysis, Investigation, Funding acquisition, Methodology, Visualization, Conceptualization, Writing – original draft. TM: Writing – original draft, Supervision, Methodology, Conceptualization, Resources, Funding acquisition, Writing – review & editing. TU: Methodology, Formal analysis, Investigation, Visualization, Writing – review & editing. AH: Supervision, Writing – review & editing, Writing – original draft, Resources. KK: Writing – original draft, Methodology, Resources, Supervision, Funding acquisition, Writing – review & editing, Conceptualization.
Funding
The author(s) declare that financial support was received for the research and/or publication of this article. This study was supported by JSPS grants 23KJ2083 (KS), 23K24207 (TM), 24H00729 (KK), and Nihon University Research Grant for 2024 (TM). The Japan Science Society (KS).
Acknowledgments
We thank Matsuri Morimoto, Yuta Tamai, Yuki Ito, Ryo Nishibori, Hidekazu Nagamura, and Kazuki Yoshino-Hashizawa for critical discussion of the data, and Takafumi Furuyama for critical reading of the manuscript.
Conflict of interest
The authors declare that the research was conducted in the absence of any commercial or financial relationships that could be construed as a potential conflict of interest.
Generative AI statement
The author(s) declare that Gen AI was used in the creation of this manuscript. ChatGPT was used to check the grammar, spelling, and vocabulary of our manuscript.
Any alternative text (alt text) provided alongside figures in this article has been generated by Frontiers with the support of artificial intelligence and reasonable efforts have been made to ensure accuracy, including review by the authors wherever possible. If you identify any issues, please contact us.
Publisher's note
All claims expressed in this article are solely those of the authors and do not necessarily represent those of their affiliated organizations, or those of the publisher, the editors and the reviewers. Any product that may be evaluated in this article, or claim that may be made by its manufacturer, is not guaranteed or endorsed by the publisher.
References
Anniko, M., and Arnold, W. (1995). Microtubule-associated proteins in adult human sensory organs. ORL J. Otorhinol. Relat. Spec. 57, 78–81. doi: 10.1159/000276715
Arnette, C., Frye, K., and Kaverina, I. (2016). Microtubule and actin interplay drive intracellular c-Src trafficking. PLoS ONE 11:e0148996. doi: 10.1371/journal.pone.0148996
Bernhardt, R., and Matus, A. (1984). Light and electron microscopic studies of the distribution of microtubule-associated protein 2 in rat brain: a difference between dendritic and axonal cytoskeletons. J. Comp. Neurol. 226, 203–221. doi: 10.1002/cne.902260205
Bodenbender, J. P., Marino, V., Philipp, J., Tropitzsch, A., Kernstock, C., Stingl, K, et al. (2024). Comprehensive analysis of two hotspot codons in the TUBB4B gene and associated phenotypes. Sci. Rep. 14:10551. doi: 10.1038/s41598-024-61019-0
Camilli De, P., Miller, E. P., Navone, F., Theurkauf, E. W., and Vallee, B. R. (1984). Distribution of microtubule-associated protein 2 in the nervous system of the rat studied by immunofluorescence. Neuroscience 11, 819–846. doi: 10.1016/0306-4522(84)90194-5
Chan, C. D., and Fechter, L. D. (2003). The relationship between noise-indudced hearing loss and hair cell loss in rats. Hear. Res. 177, 81–90. doi: 10.1016/S0378-5955(02)00802-X
Cody, A. R., and Russell, I. J. (1987). The response of hair cells in the basal turn of the guinea-pig cochlea to tones. J. Physiol. 383, 551–569. doi: 10.1113/jphysiol.1987.sp016428
Conde, C., and Cáceres, A. (2009). Microtubule assembly, organization and dynamics in axons and dendrites. Nat. Rev. Neurosci. 10, 319–332. doi: 10.1038/nrn2631
Cui, L., Zheng, J., Zhao, Q., Chen, J-. R., Liu, H., Peng, G., et al. (2020). Mutations of MAP1B encoding a microtubule-associated phosphoprotein cause sensorineural hearing loss. JCI Insight 5:e136046. doi: 10.1172/jci.insight.136046
Esfahani, M. Z., Khosravi, A., Safavi, N. A., Radmand, G., and Khodadad, K. (2017). Analysis of cisplatin-induced ototoxicity risk factors in Iranian patients with solid tumors: a cohort, prospective and single institute study. Asian Pac. J. Cancer Prevent. 18, 753–758. doi: 10.22034/APJCP.2017.18.3.753
Feng, Y., Hu, S., Zhao, S., and Chen, M. (2023). Recent advances in genetic etiology of non-syndromic deafness in children. Front. Neurosci. 17:1282663. doi: 10.3389/fnins.2023.1282663
Forge, A., and Schacht, J. (2000). Aminoglycoside antibiotics. Audiol. Neurootol. 5, 3–22. doi: 10.1159/000013861
Gamblin, T. C., Nachmanoff, K., Halpain, S., and Williams Jr, R. C. (1996). Recombinant microtubule-associated protein 2c reduces the dynamic instability of individual microtubules. Biochemistry 35, 12576–12586. doi: 10.1021/bi961135d
Harada, A., Teng, J., Takei, Y., Oguchi, K., and Hirokawa, N. (2002). MAP2 is required for dendrite elongation, PKA anchoring in dendrites, and proper PKA signal transduction. J. Cell Biol. 158, 541–549. doi: 10.1083/jcb.200110134
Herediary Hearing Loss Homepage (2024). Hereditary Hearing Loss Homepage. Available online at: http://hereditaryhearingloss.org (Acssessd September 20, 2024).
Huang, L., Peng, Y., Tao, X., Ding, X., Li, R., Jiang, Y., et al. (2022). Microtubule organization is essential for maintaining cellular morphology and function. Oxid. Med. Cell. Longev. 2022:1623181. doi: 10.1155/2022/1623181
Ingham, N. J., Banafshe, N., Panganiban, C., Crunden, J. L., Chen, J., Lewis, M., et al. (2021). Inner hair cell dysfunction in Klhl18 mutant mice leads to low frequency progressive hearing loss. PLoS ONE 16:e0258158. doi: 10.1371/journal.pone.0258158
Ismail Mohamad, N., Santra, P., Park, Y., et al. (2024). Synaptic ribbon dynamics after noise exposure in the hearing cochlea. Commun. Biol. 7:421. doi: 10.1038/s42003-024-06067-y
Itoh, T. J., and Hotani, H. (1994). Microtubule-stabilizing activity of microtubule-associated proteins (MAPs) is due to increase in frequency of rescue in dynamic instability: shortening length decreases with binding of MAPs onto microtubules. Cell Struct. Funct. 19, 279–290. doi: 10.1247/csf.19.279
Kalcheva, N., Albala, J., O'Guin, K., Rubino, H., Garner, C., Shafit-Zagardo, B., et al. (1995). Genomic structure of human microtubule-associated protein 2 (MAP-2) and characterization of additional MAP-2 isoforms. Proc. Natl. Acad. Sci. U. S. A. 92, 10894–10898. doi: 10.1073/pnas.92.24.10894
Kamimura, T., Whitworth, C. A., and Rybak, L. P. (1999). Effect of 4-methylthiobenzoic acid on cisplatin-induced ototoxicity in the rat. Hear. Res. 131, 117–127. doi: 10.1016/S0378-5955(99)00017-9
Kanda, Y. (2013). Investigation of the Freely Available Easy-to-Use Software ‘EZR' for Medical Statistics. Bone Marrow Transplant. 48, 452–458. doi: 10.1038/bmt.2012.244
Kaverina, I., and Straube, A. (2011). Regulation of cell migration by dynamic microtubules. Semin Cell Dev Biol. 22, 968–974. doi: 10.1016/j.semcdb.2011.09.017
Kitajiri, S., Sakamoto, T., Belyantseva, I. A., Goodyear, R. J., Stepanyan, R., Fujiwara, I., et al. (2010). Actin-bundling protein triobp forms resilient rootlets of hair cell stereocilia essential for hearing. Cell 141, 786–798. doi: 10.1016/j.cell.2010.03.049
Kubo, A., Misonou, H., Matsuyama, M., Nomori, A., Wada-Kakuda, S., Takashima, A., et al. (2019). Distribution of endogenous normal tau in the mouse brain. J. Comp. Neurol. 527, 985–998. doi: 10.1002/cne.24577
Ladrech, S., and Lenoir, M. (2002). Changes in MAP2 and tyrosinated alpha-tubulin expression in cochlear inner hair cells after amikacin treatment in the rat. J. Comp. Neurol. 451, 70–78. doi: 10.1002/cne.10334
Liu, H., Giffen, K. P., Grati, M., Morrill, S. W., Li, Y., Liu, X., et al. (2021). Transcription co-factor LBH is necessary for the survival of cochlear hair cells. J. Cell Sci. 134:jcs254458. doi: 10.1242/jcs.254458
Maasz, A., Hadzsiev, K., Ripszam, R., Zsigmond, A., Maka, E., Knezy, K., et al. (2022). TUBB4B gene mutation in Leber phenotype of congenital amaurosis syndrome associated with early-onset deafness. Eur. J. Med. Genet. 65:104471. doi: 10.1016/j.ejmg.2022.104471
Mahendrasingam, S., Macdonald, J. A., and Furness, D. N. (2011). Relative time course of degeneration of different cochlear structures in the CD/1 mouse model of accelerated aging. J. Assoc. Res. Otolaryngol. 12, 437–453. doi: 10.1007/s10162-011-0263-6
Mehraei, G., Hickox, A. E., Bharadwaj, H. M., Goldberg, H., Verhulst, S., Liberman, M. C., et al. (2016). Auditory brainstem response latency in noise as a marker of cochlear synaptopathy. J. Neurosci. 36, 3755–3764. doi: 10.1523/JNEUROSCI.4460-15.2016
Montgomery, S. C., and Cox, B. C. (2016). Whole mount dissection and immunofluorescence of the adult mouse cochlea. J. Vis. Exp. 107:e53561. doi: 10.3791/53561
Moon, K. H., Ma, J. H., Min, H., Koo, H., Kim, H., Ko, H. W., et al. (2020). Dysregulation of sonic hedgehog signaling causes hearing loss in ciliopathy mouse models. Elife 9:e56551. doi: 10.7554/eLife.56551.sa2
Müller, M., von Hünerbein, K., Hoidis, S., and Smolders, J. W. (2005). A physiological place-frequency map of the cochlea in the CBA/J mouse. Hear Res. 202, 63–73. doi: 10.1016/j.heares.2004.08.011
Natarajan, N., Batts, S. A., and Stankovic, K. (2017). Noise-induced hearing loss. J. Clin. Med. 12:2347. doi: 10.3390/jcm12062347
Obar, R. A., Dingus, J., Bayley, H., and Vallee, R. B. (1989). The RII subunit of cAMP-dependent protein kinase binds to a common amino-terminal domain in microtubule-associated proteins 2A, 2B, and 2C. Neuron 3, 639–645. doi: 10.1016/0896-6273(89)90274-2
Piriya Ananda Babu, L., Wang, H. Y., Eguchi, K., Guillaud, L., and Takahashi, T. (2020). Microtubule and actin differentially regulate synaptic vesicle cycling to maintain high-frequency neurotransmission. J. Neurosci. 40, 131–142. doi: 10.1523/JNEUROSCI.1571-19.2019
Qin, Z., Wood, M., and Rosowski, J. J. (2010). Measurement of conductive hearing loss in mice. Hear. Res. 263, 93–103. doi: 10.1016/j.heares.2009.10.002
Rendtorff, N. D., Zhu, M., Fagerheim, T., Antal, T. L., Jones, M., Teslovich, T. M., et al. (2006). A novel missense mutation in ACTG1 causes dominant deafness in a Norwegian DFNA20/26 family, but ACTG1 mutations are not frequent among families with hereditary hearing impairment. Eur. J. Human Genet. 14, 1097–1105. doi: 10.1038/sj.ejhg.5201670
Robles, L., and Ruggero, M. A. (2001). Mechanics of the mammalian cochlea. Physiol. Rev. 81, 1305–1352. doi: 10.1152/physrev.2001.81.3.1305
Roger, B., Al-Bassam, J., Dehmelt, L., Milligan, R. A., and Halpain, S. (2004). MAP2c, but not tau, binds and bundles F-actin via its microtubule binding domain. Curr. Biol. 14, 363–371. doi: 10.1016/j.cub.2004.01.058
Rubino, H. M., Dammerman, M., Shafit-Zagardo, B., and Erlichman, J. (1989). Localization and characterization of the binding site for the regulatory subunit of type II cAMP-dependent protein kinase on MAP2. Neuron 3, 631–638. doi: 10.1016/0896-6273(89)90273-0
Sha, S. H., Taylor, R., Forge, A., and Schacht, J. (2001). Differential vulnerability of basal and apical hair cells is based on intrinsic susceptibility to free radicals. Hear. Res. 155, 1–8. doi: 10.1016/S0378-5955(01)00224-6
Sheffield, A. M., and Smith, R. J. H. (2019). The epidemiology of deafness. Cold Spring Harb. Perspect. Med. 9:a033258. doi: 10.1101/cshperspect.a033258
Shi, H., Wang, H., Zhang, C., Lu, Y., Yao, J., Chen, Z., et al. (2022). Mutations in OSBPL2 cause hearing loss associated with primary cilia defects via sonic hedgehog signaling. JCI Insight 7:e149626. doi: 10.1172/jci.insight.149626
Slepecky, N. B., and Ulfendahl, M. (1992). Actin-binding and microtubule-associated proteins in the organ of Corti. Hear. Res. 57, 201–215. doi: 10.1016/0378-5955(92)90152-D
Sloan-Heggen, C. M., Bierer, A. O., Shearer, A. E., Kolbe, D. L., Nishimura, C. J., Frees, K. L., et al. (2016). Comprehensive genetic testing in the clinical evaluation of 1119 patients with hearing loss. Human Genet. 135, 441–450. doi: 10.1007/s00439-016-1648-8
Steyger, P. S., Furness, D. N., Hackney, C. M., and Richardson, G. P. (1989). Tubulin and microtubules in cochlear hair cells: comparative immunocytochemistry and ultrastructure. Hear. Res. 42, 1–16. doi: 10.1016/0378-5955(89)90113-5
Teng, J., Takei, Y., Harada, A., Nakata, T., Chen, J., Hirokawa, N., et al. (2001). Synergistic effects of MAP2 and MAP1B knockout in neuronal migration, dendritic outgrowth, and microtubule organization. J. Cell Biol. 155, 65–76. doi: 10.1083/jcb.200106025
Williamson, T. T., Ding, B., Zhu, X., and Frisina, R. D. (2019). Hormone replacement therapy attenuates hearing loss:Mechanisms involving estrogen and the IGF-1 pathway. Aging Cell 18:e12939. doi: 10.1111/acel.12939
Wilson, B. S., Tucci, D. L., Merson, M. H., and O'Donoghue, G. M. (2017). Global hearing health care: new findings and perspectives. Lancet, 390, 2503–2515. doi: 10.1016/S0140-6736(17)31073-5
Wu, X., Ivanchenko, M. V., Al Jandal, H., et al. (2019). PKHD1L1 is a coat protein of hair-cell stereocilia and is required for normal hearing. Nat. Commun. 10:3801. doi: 10.1038/s41467-019-11712-w
Xuan, L., Sun, B., Meng, X., Liu, C., Cong, Y., Wu, S., et al. (2020). Ototoxicity in patients with invasive ductal breast cancer who were treated with docetaxel: report of two cases. Cancer Biol. Ther. 21, 990–993. doi: 10.1080/15384047.2020.1831370
Yoshimura, H., Takumi, Y., Nishio, S. Y., Suzuki, N., Iwasa, Y., Usami, S., et al. (2004). Deafness gene expression patterns in the mouse cochlea found by microarray analysis. PLoS ONE. 9:e92547. doi: 10.1371/journal.pone.0092547
Zheng, J., Anderson, C. T., Miller, K. K., Cheatham, M., and Dallos, P. (2009). Identifying components of the hair-cell interactome involved in cochlear amplification. BMC Genom. 10:127. doi: 10.1186/1471-2164-10-127
Zheng, Q. Y., Yan, D., Ouyang, X. M., Du, L. L., Yu, H., Chang, B., et al. (2005). Digenic inheritance of deafness caused by mutations in genes encoding cadherin 23 and protocadherin 15 in mice and humans. Human Mol. Genet. 14, 103–111. doi: 10.1093/hmg/ddi010
Keywords: MAP2, cochlea outer hair cell, hearing loss, inner ear, cytoskeleton, stereocilia
Citation: Shin'ya KT, Miyasaka T, Ukaji T, Harada A and Kobayashi KI (2025) Microtubule-associated protein 2 (MAP2) deficiency causes high-frequency hearing loss. Front. Audiol. Otol. 3:1605980. doi: 10.3389/fauot.2025.1605980
Received: 04 April 2025; Accepted: 16 September 2025;
Published: 03 October 2025.
Edited by:
Emma J. Kenyon, Swansea University Medical School, United KingdomReviewed by:
Ivan A. Lopez, University of California, Los Angeles, United StatesDavid Furness, Keele University, United Kingdom
Copyright © 2025 Shin'ya, Miyasaka, Ukaji, Harada and Kobayashi. This is an open-access article distributed under the terms of the Creative Commons Attribution License (CC BY). The use, distribution or reproduction in other forums is permitted, provided the original author(s) and the copyright owner(s) are credited and that the original publication in this journal is cited, in accordance with accepted academic practice. No use, distribution or reproduction is permitted which does not comply with these terms.
*Correspondence: Tomohiro Miyasaka, bWl5YXNha2EudG9tb2hpcm9Abmlob24tdS5hYy5qcA==; Kohta I. Kobayashi, a2tvYmF5YXNAbWFpbC5kb3NoaXNoYS5hYy5qcA==