 Nadine Buczak
 Eugen Kludt1,2
 Thomas Lenarz
 Andreas Büchner
- 1Department of Otolaryngology, Hannover Medical School, Hannover, Germany
- 2Cluster of Excellence “Hearing4All”, Hannover, Germany
Introduction: Speech understanding in cochlear implant (CI) users is influenced by various factors, particularly cognitive and linguistic abilities. While previous studies have explored both bottom-up and top-down processes in speech comprehension, this study focuses specifically on the role of cognitive and linguistic factors in shaping speech recognition outcomes in post-lingually deafened adults.
Methods: Fifty-eight post-lingually deafened adults, with at least 12 months of CI experience, participated in this study using a previously established dataset. Participants were categorized into Poor Performers (n = 25; ≤ 35% word recognition at 65 dB SPL) and Good Performers (n = 33; ≥65% word recognition at 65 dB SPL). Participants with single-sided deafness were excluded to avoid confounding effects. Cognitive and linguistic variables, including vocabulary size (Wortschatztest, WST), processing speed (Symbol Digit Modality Test, SDMT), and executive control (Stroop Test), were assessed. Descriptive statistics were calculated to explore group differences, and Cohen's d was used to assess effect sizes. Statistical tests included univariate linear regression for individual predictors and multiple linear regression for the overall model.
Results: The results indicated that larger vocabulary size, faster processing speed, and higher educational level were significantly associated with better speech performance. Additionally, younger age at testing correlated with improved outcomes, while early onset hearing loss (before age 7) was linked to poorer performance.
Discussion: These findings emphasize the critical influence of cognitive and linguistic abilities, early auditory experiences, and educational background on CI outcomes. Together, these factors significantly predict speech understanding, highlighting the need to consider them in rehabilitation planning and comprehensive assessments to guide targeted interventions.
1 Introduction
Cochlear implants (CIs) are widely recognized as the standard of care for severe to profound sensorineural hearing loss (SNHL) across all age groups (Dazert et al., 2020; Lenarz, 2018). These devices are highly effective in restoring hearing in individuals with profound deafness, enabling many recipients to achieve substantial improvements in speech perception. However, there remains considerable variability in individual speech performance outcomes, which cannot yet be fully explained (Blamey et al., 2013; Boisvert et al., 2020; Holden et al., 2013; Tamati et al., 2020; Völter et al., 2022). This issue is especially evident among adult CI patients with post-lingual deafness, who would typically be expected to perform well due to their prior normal language development (Moberly et al., 2016). Despite over two decades of acknowledgment, the challenge of poor performers—those who gain little to no benefit—remains unresolved (Blamey et al., 2013; Holden et al., 2013; Moberly et al., 2016; Völter et al., 2021, 2022). According to Lenarz et al. (2012), 10–50% of adult CI users are categorized as poor performers, with 13% recognizing < 10% of words in sentences in quiet environments. This variability in outcomes, particularly the issue of poor performers, highlights the need to address these challenges to improve speech perception outcomes, especially in light of the significant consequences of hearing loss and the societal costs (Moberly et al., 2016; Pisoni et al., 2018; Völter et al., 2021, 2022).
Many factors influence CI outcomes, yet only a subset of these are fully understood. Patient-related factors account for only 10–22% of the variability in speech recognition outcomes (Blamey et al., 2013; Holden et al., 2013), whereas surgical factors, such as cochlear abnormalities, scalar translocation, insertion depth, and proximity to the modiolus, have been shown to explain up to 20% of the variation in early sentence recognition (James et al., 2019). Interestingly, James et al. (2019) also found that patient-related factors contributed ~40% of the variance in their cohort of 96 adult CI recipients, suggesting that their influence may vary across studies. Better outcomes are generally linked to greater residual hearing before implantation and prior hearing aid use, whereas partial electrode insertion, meningitis history, and congenital ear malformations negatively impact performance (Buchman et al., 2004; Moberly et al., 2016). Other factors, such as implant user's age, duration of deafness before implantation, the number of active electrodes, and the device brand, also play a role in predicting individual hearing success (Moberly et al., 2016; Völter et al., 2022). These findings underscore the complexity of CI outcomes and highlight the need for further investigation into additional contributing factors beyond patient-related and surgical influences. In addition to these clinical and surgical variables, emerging evidence underscores the importance of etiology of hearing loss, neural health, device-related factors, and post-implantation rehabilitation—including both structured auditory training and individual motivation—in determining CI outcomes. Greater neural survival—often inferred from electrophysiological markers such as focused thresholds, ECAP amplitudes, and interphase gap or polarity effects—has been associated with better speech perception (Arjmandi et al., 2022; Carlyon et al., 2018; DeVries et al., 2016; Goehring et al., 2019; Long et al., 2014), while more optimal electrode location is also linked to improved neural health and performance (Schvartz-Leyzac et al., 2020). Device programming, mapping accuracy, and post-operative rehabilitation strategies can further modulate auditory sensitivity and enhance outcomes (Busby and Arora, 2016; de Graaff et al., 2020; Fu and Galvin, 2007; Harris et al., 2016). Recent studies emphasize that patient-driven factors—such as pre-implant expectations, personal motivation, social support, and active engagement in rehabilitation—distinguish adults with better speech recognition and quality of life after implantation (Harris et al., 2016). Thus, understanding CI success requires a multifactorial perspective that integrates clinical, surgical, etiological, neural, device-related, rehabilitative, psychosocial, and cognitive-linguistic influences (Blamey et al., 2013; Dawson et al., 2025; Holden et al., 2013). Socioeconomic factors, such as education level, access to rehabilitation resources, and travel-related barriers, have also been implicated in the variability of CI outcomes, influencing candidacy evaluation, device use, and speech recognition results (Davis et al., 2023; Zhao et al., 2020). Additionally, tinnitus severity and related symptoms have also been identified as potential factors influencing CI outcomes, possibly through impacts on attention and listening effort (Ivansic et al., 2017; Liu et al., 2018).
The variability in adult CI speech perception outcomes likely stems from a complex interplay of “bottom-up” auditory sensitivity and “top-down” linguistic and neurocognitive factors, though their relative importance is unclear (Moberly et al., 2016; Zekveld et al., 2007). While auditory sensitivity, which involves perceiving and distinguishing spectral and temporal cues within speech, has traditionally been the focus, more recent research highlights the significant role of top-down factors, such as linguistic skills and neurocognitive processing, in explaining this variability (Bhargava et al., 2014; Bialystok and Craik, 2010; Marslen-Wilson, 1987; Moberly et al., 2016; Vitevitch and Luce, 1998; Zekveld et al., 2007). Phonological sensitivity, for instance, is a strong predictor of speech recognition outcomes, and better lexical and grammatical knowledge aids in understanding words and sentences, especially under challenging listening conditions (Moberly et al., 2016). Moreover, linguistic factors such as lexical access, inhibition of lexical competitors, and the integration of phonemic and lexical information into context are crucial for general speech processing, as noted in studies by Cutler and Clifton (2000) and Weber and Scharenborg (2012). Finke et al. (2016) found that normal-hearing listeners outperformed CI users in distinguishing printed real words from pseudowords, indicating that deficits in fundamental language processing may contribute to poorer performance in CI users. However, this does not imply that CI users have lost these foundational skills, but rather that their language development was interrupted by the lack of auditory input during critical periods. Cochlear implants restore hearing, but challenges in processing auditory-phonetic features, especially in noisy environments, persist, affecting speech perception outcomes (Holden et al., 2013; Finke et al., 2016).
On the cognitive level, speech recognition is thought to heavily depend on working memory (WM), with larger WM capacity generally correlating with higher speech recognition scores (Besser et al., 2013; Rudner and Signoret, 2016). The Ease of Language Understanding (ELU) model by Rönnberg et al. (2013) posits that a degraded speech input often fails to automatically match a semantic representation in long-term memory (Rönnberg et al., 2013). This mismatch inhibits immediate lexical access and requires additional explicit processing, which depends on WM (Rönnberg et al., 2013; Völter et al., 2021). ELU model suggests that successful perception of degraded speech necessitates selective attention at early stages of stream segregation and relatively more WM capacity to match the degraded input with long-term lexical representations. As the signal provided by CIs is much degraded compared to normal hearing (NH), more WM is occupied with basic speech recognition tasks. The speech signal processed by CIs is often degraded in terms of temporal and frequency resolution, leading to challenges in speech perception. Due to the limited number of channels and the distortion of auditory cues, CIs can struggle to replicate the fine details of speech sounds, which impacts the clarity of phonemes and overall speech intelligibility. Studies have shown that the reduced temporal resolution and frequency selectivity of CIs contribute to difficulties in tasks like speech in noise, sound localization, and phonetic discrimination (Choi et al., 2023; Friesen et al., 2001; Shannon et al., 1995). The influence of cognitive factors on speech recognition is proposed to increase as the speech signal deteriorates, such as with decreasing signal-to-noise ratios (SNRs) (Rudner et al., 2012). Inhibitory control, measured by tasks like the Stroop test, also aids speech recognition by managing competing lexical information and noise (Rönnberg et al., 2013; Völter et al., 2021). Another perspective is provided by the cognitive spare capacity hypothesis, which suggests that cognitive resources required for lexical access leave limited capacity for post-lexical speech processing and integration into discourse in adverse listening conditions (Mishra et al., 2014).
Speech recognition in challenging acoustic environments is influenced by linguistic factors, such as verbal intelligence. Braza et al. (2022) found that a larger receptive vocabulary enhances speech-in-noise recognition across all ages, regardless of when the words were learned. Similarly, Carroll et al. (2016) highlighted that the efficiency of lexical access plays a key role in speech recognition in noise. While older adults tend to have a larger vocabulary due to accumulated life experience (Verhaeghen, 2003), their slower lexical access can hamper real-time speech processing in noisy environments (Sommers and Danielson, 1999). Studies have also linked vocabulary knowledge to improved performance in tasks like phoneme restoration and word recognition in noise (Benard et al., 2014; Kaandorp et al., 2015; McAuliffe et al., 2013). Given its strong connection to educational background, vocabulary knowledge plays a significant role in speech processing (Mergl et al., 1999; Schmidt and Metzler, 1992). However, age-related declines in working memory (WM) and lexical access introduce additional challenges, as older adults may struggle with cognitive changes that affect speech comprehension (Desjardins and Doherty, 2013; Verhaeghen and Salthouse, 1997). Still, a richer vocabulary is generally associated with better speech recognition outcomes, reinforcing the link between linguistic knowledge, cognitive abilities, and speech perception in noise.
While CIs provide substantial benefits, speech perception outcomes vary widely, particularly among poor performers. Dawson et al. (2025) conducted a broad investigation into the factors influencing these outcomes, considering both “bottom-up” contributors, such as auditory sensitivity, and “top-down” influences, including linguistic and cognitive abilities. Building on this foundation, the present study takes a more detailed approach, specifically examining the role of neurocognitive and linguistic factors in speech understanding. Rather than addressing a broad spectrum of influences, this extended analysis focuses on how specific cognitive abilities—such as working memory, processing speed, and inhibitory control—interact with linguistic skills to shape speech perception. Additionally, educational background was included as a new factor, providing further insight into individual differences in CI performance. By narrowing the scope to these top-down contributors, this study aims to deepen our understanding of their specific impact on speech recognition outcomes.
2 Methods
2.1 Study participants
A total of 58 post-lingually deafened adult CI users with Cochlear™ Nucleus® Implants; CI24RE (CA), CI422, CI522, CI622, CI512, CI612, CI532, CI632, and Hybrid L 24, were included in this linguistic and neurocognitive extended analysis from the Dawson et al. (2025) study data. Participants are fluent in German and have no diagnosed mental or neurocognitive disorder. Participants were categorized based on their auditory configuration: bilateral, bimodal, or unilateral. For CI participants with bilateral implants meeting eligibility criteria in both ears, testing was limited to one ear to maintain a balanced distribution of participants between the poorer- and better-performing groups. Participants with single-sided deafness (SSD), as described in Dawson et al. (2025), were excluded from this analysis. This decision was based on the difficulty of achieving adequate masking of the contralateral normal-hearing ear during the sentence-in-noise test, which could have biased speech recognition results. Moreover, previous research has shown that SSD patients often demonstrate limited benefit from CI input due to their strong reliance on the normal-hearing ear, particularly when tested in the CI-only condition (Galvin et al., 2019; Zeitler et al., 2019). While direct audio input was used for the word recognition in quiet task, exclusion was maintained for consistency and to avoid confounding effects associated with asymmetric hearing. Participants were divided into two groups: poor and good performers. Participants were classified as poor performers if their word recognition score at 65 dB SPL was below the 35th percentile of the CI population at the German Hearing Center (DHZ, Medical School Hannover) for implants since 2007. Conversely, a score above the 65th percentile and at least 20% higher than the pre-operative aided word score classified a subject as a good performer. Analysis of Freiburg word scores in quiet, obtained ≥12 months post-implantation, determined that the 35th percentile corresponded to a word score of ~35%. Consequently, 25 CI users with scores of 0–35% on the Freiburg word test (Hahlbrock, 1953) at 65 dB SPL were classified as Poor Performers (PP), while 33 users with scores ≥65% were classified as Good Performers (GP). The study was approved by the local Medical Ethical Committee (Medical School of Hanover). All participants voluntarily participated in the study and signed an informed consent form. Demographic information (Table 1) was collected to characterize the CI patient cohort and included age (in years), gender (male/female), duration of deafness prior to implantation (in years), age at implantation (in years), type of auditory supply (unilateral, bimodal, or bilateral) and hearing loss type (since childhood/other). At our center, the duration of deafness was defined as the self-reported time point at which the patient perceived the onset of profound hearing loss in the ear to be implanted. This typically referred to the point when the individual no longer experienced meaningful benefit from conventional hearing aids—for example, being unable to conduct a successful phone conversation. This information was documented in the clinical records during the preoperative evaluation and was not derived from the screening form. This approach is consistent with clinical practice guidelines for cochlear implantation, which emphasize functional hearing ability in candidacy evaluation [(American Academy of Otolaryngology–Head Neck Surgery (AAO-HNS), 2014)]. The cutoff age for hearing loss type was 7 years. Participants who experienced hearing loss at ≤ 6 years were classified as “since childhood,” and those at 7 years or older as “other.” This cutoff was based on research indicating that language development, particularly in terms of speech perception, is typically completed by the age of 6. After this critical period, the brain's ability to adapt to speech sounds diminishes, making language learning more difficult (Kuhl, 2004; Werker and Hensch, 2015). Additionally, baseline auditory performance data were recorded, including scores on the Freiburg monosyllabic word test at 65 dB SPL (in %), pre-implantation word recognition scores at 65 dB SPL (in %), and speech-in-noise performance as measured by the Oldenburg Sentence Test (OLSA) in dB SNR. Further assessments involved a series of cognitive and linguistic tests to evaluate patient abilities. These included a vocabulary test (Wortschatztest), the Single Digit Modality Test (SDMT), and the Stroop Test. Detailed descriptions and methodologies for each test are provided in the subsequent sections.
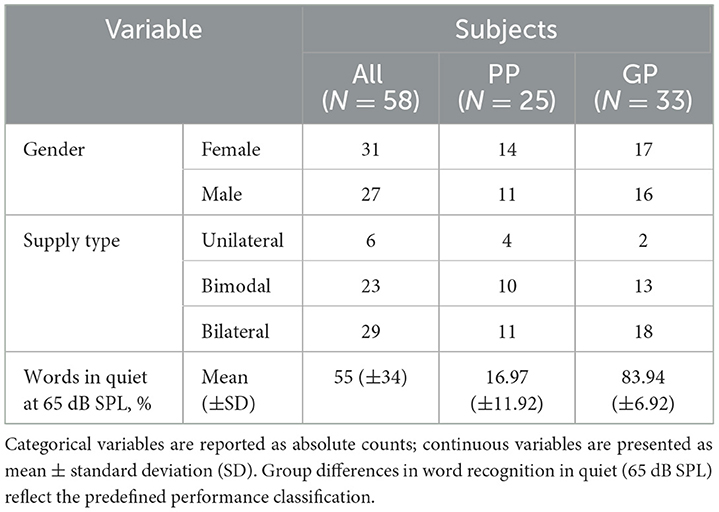
Table 1. Demographic and clinical characteristics of all participants (N = 58), divided into Poor Performers (PP; n = 25) and Good Performers (GP; n = 33).
2.2 Vocabulary size
The Wortschatztest (WST), developed by Schmidt and Metzler (1992), is a German paper-and pencil test designed to evaluate verbal intelligence by measuring vocabulary size. The WST consists of 42 lines, each filled with one existing target word and 5 distracting non-words, and provides information about recognition performance. With each successive line the Wortschatztest increases difficulty by transitioning from common, concrete words to less frequent, abstract, and specialized vocabulary, requiring broader linguistic knowledge. This progression ensures a comprehensive assessment of the participant's vocabulary depth. The number of correctly recognized target words determines the raw score, which represents the vocabulary size. Previous studies have shown a correlation between speech performance and vocabulary size (Benard et al., 2014; Carroll et al., 2016; Finke et al., 2016; Kaandorp et al., 2015).
2.3 Neurocognitive factors
The Symbol Digit Modalities Test (SDMT) is a paper-and-pencil test used to assess neurocognitive function (Smith, 1982). Participants are shown a reference key at the top of the test that pairs nine abstract symbols with the digits 1–9. Below the key, a sequence of symbols is presented, and participants must write the corresponding number for each symbol as quickly and accurately as possible. A short practice session using the first 10 items is provided to familiarize participants with the task. The main test lasts 90 seconds, during which participants assign numbers to as many symbols as possible. The score is the total number of correctly matched symbols within the time limit. The SDMT provides information about processing speed, visual scanning, motor speed, and divided attention (Smith, 1982).
The Stroop Color and Word Test (SCWT), first introduced by Stroop in 1935, is a neuropsychological test measuring executive functions and cognitive interference (Jensen and Rohwer, 1966; Scarpina and Tagini, 2017). Selective attention, cognitive flexibility, processing speed, and inhibitory control are the cognitive processes assessed by the SCWT (Jensen and Rohwer, 1966; Golden, 1978; Scarpina and Tagini, 2017). The SCWT consists of three main tasks, where participants are required to read tables in a timely manner. For each task, the measured time in seconds and the number of incorrect naming are measured. A 5-s penalty is added to the total time for each incorrect naming. The total measured time, including penalties for incorrect responses, is used for the analysis. In the first task (SCWTDots), participants read rows of colors (red, green, yellow or blue) presented in dots. In the second task (SCWTWords), participants read rows of color words (e.g., blue or green) printed in black ink. In the third task (SCWTColours), participants are presented with rows of color words printed in divergent color inks. The participants are required to name the color of the ink, but not the word itself. The third task involves a less automated process, whereby the participants must suppress the interference of a more automated process at the same time (MacLeod and Dunbar, 1988; Scarpina and Tagini, 2017). This challenge, focusing on the less automated process and inhibiting the greater automated process, is known as the Stroop effect (Stroop, 1935).
2.4 Speech in quiet
To assess word recognition in quiet, speech stimuli were delivered at 65 dB SPL (RMS) directly to the CI using a Personal Audio Cable (PAC) linked to a tablet and the Nucleus 6 sound processor. Participants completed the test independently using the Self-Scoring Speech Audiometry (SAM) system, which allowed them to listen to the stimuli and input their answers on the tablet. Word recognition was evaluated using the Freiburg monosyllabic word lists (Hahlbrock, 1953), which are adapted from the original CNC (Consonant-Nucleus-Consonant) lists by Peterson and Lehiste (1962).
2.5 Speech in noise
Speech-in-noise recognition was tested using the Oldenburger Satzstest (OLSA), which consists of 20 short five-word sentences in German Kollmeier and Wesselkamp, 1997. The test was conducted in a free-field setup within a soundproof booth. Both the speech and the speech-shaped masking noise were presented from a loudspeaker positioned directly in front of the listener at 0° azimuth. The contralateral ear was masked using a plug and muff to prevent cross-hearing. Speech was presented at a fixed level of 65 dB SPL, while the level of the masking noise was adaptively adjusted based on the participant's responses. Each participant completed the OLSA test twice, and the average Speech Reception Threshold (SRT) across both runs was used for analysis. For participants who could not complete the OLSA due to poor performance, an SRT value of 15 dB SNR was assigned. This cutoff is supported by previous research, such as Kaandorp et al. (2015), which used the same threshold in CI studies. According to the Speech Intelligibility Index (SII), developed by the American National Standards Institute (American National Standards Institute, 1997), all speech information is accessible at 15 dB SNR in steady-state LTASS noise. Two of the 58 participants did not perform the OLSA test.
2.6 Educational level
The education level was based on self-reported information provided by the patient regarding their highest level of education. The German Qualifications Framework (Deutscher Qualifikationsrahmen, DQR) classifies educational qualifications in Germany into eight levels (Figure 1), reflecting a progression from foundational to advanced skills, knowledge, and competencies (Industrie und Handelskammer, 2016). In this analysis, educational stages were aligned with the DQR framework for consistency. Elementary School (8 years) corresponds to Level 1, representing foundational education. Secondary School (9 years) is categorized at Level 2, emphasizing broader knowledge and vocational preparation, while Secondary School (10 years) is assigned to Level 3, focusing on more specialized skills and academic understanding. Both Apprenticeship (Ausbildung) and High School (Abitur) fall under Level 4, as they provide substantial academic or practical skills. The apprenticeship is a structured vocational training program combining practical experience in a company with instruction at a vocational school, typically lasting 2–3.5 years. Master Craftsman qualification (Meister) and university degrees are classified at Level 5, reflecting advanced theoretical and practical expertise. The Master Craftsman qualification (Meister) is a high-level vocational credential that builds on an apprenticeship and permits independent business operation and the training of apprentices.
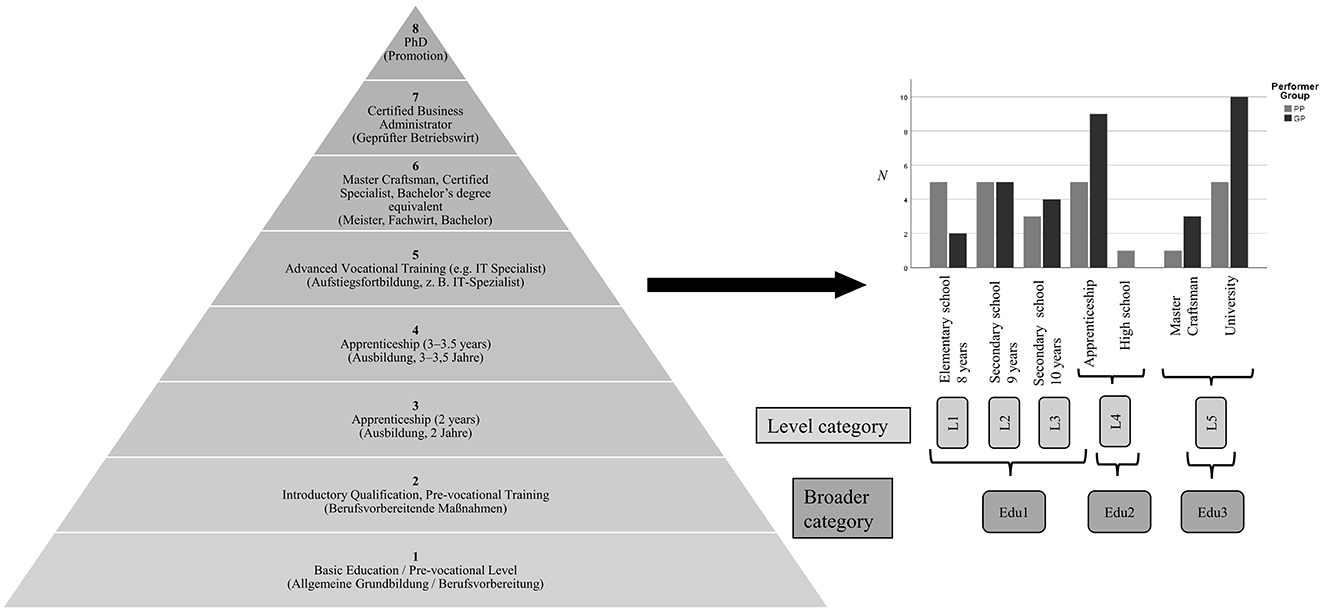
Figure 1. Pyramid representation of the German Qualifications Framework (DQR), adapted from the German Chamber of Industry and Commerce (Industrie und Handelskammer, 2016). The left side illustrates the eight DQR levels, ranging from Level 1 (basic education) to Level 8 (PhD). For each level, the English designation is listed first, followed by the corresponding German term in parentheses. On the right, DQR levels were assigned to patients based on their self-reported highest educational attainment. These assignments (L1–L5) were then consolidated into three broader educational categories—Edu1, Edu2, and Edu3—to facilitate comparison across groups.
To streamline the analysis and as illustrated in Figure 1, three broader categories were created: Edu1, encompassing Elementary School, Secondary School (9 years), and Secondary School (10 years); Edu2, representing Apprenticeship (Ausbildung) and High School (Abitur); and Edu3, including the Master Craftsman (Meister) and university qualifications. This categorization simplifies the comparison of educational backgrounds.
2.7 Statistical analysis
All data were analyzed using SPSS (IBM Corp., version 14) (IBM Corp, 2019) and MATLAB (The Mathworks, R2019b) (The MathWorks, 2019). Initially, medical records (e.g., age, duration of deafness) and linguistic, cognitive, and audiological data were compared between PP and GP using descriptive statistics (mean and standard deviation). The OLSA end educational level mean data were compared between GP and PP using the Mann-Whitney U test. Age (at testing and implantation), duration of deafness, word score prior implantation, linguistic and cognitive data were compared between PP and GP using two-tailed t-tests, and effect sizes were calculated with Cohen's d. In the second step, univariate linear regression followed by multivariable linear regression (MLR) was used to identify predictors associated with speech performance in quiet and noise, as well as linguistic data. Univariate analyses identified predictor variables with significant relationships (p ≤ 0.2). However, to determine the strongest predictors when considered together, an initial multivariable regression model was created, followed by backward stepwise regression. At each step, the predictor with the highest p-value (excluding the intercept) was removed, and the model was re-run until all predictors had p-values around 0.2 or below. This cut-off was chosen to retain variables that explain a reasonable amount of variance, suitable for this exploratory study. The adjusted R2, a more conservative measure, was employed in the multiple linear regression to reduce the risk of inflating the model's explanatory power and to avoid overestimating its predictive ability. Age (at testing and implantation), educational level, SDMT, SCWT, and WST were treated as continuous variables, while gender (males/females) and hearing loss type (since childhood/other) were categorized. Standard model assumptions were confirmed as valid. To assess multicollinearity among predictor variables, the variance inflation factor (VIF) was utilized, ensuring VIFs below 2 in the final model to minimize intercorrelation. The number of participants was provided for each analysis, and significance levels were set as follows: *p < 0.05, **p < 0.01, ***p < 0.001.
3 Results
3.1 Results for group differences
Table 1 summarizes the demographic and clinical characteristics of the 58 CI users included in the study, categorized into Poor Performers (PP) and Good Performers (GP). The two groups were comparable in terms of gender distribution and type of auditory supply. As expected, there was a clear distinction in word recognition performance in quiet, with the PP group showing substantially lower scores compared to the GP group.
Table 2 summarizes the comparison of mean scores and p-values for various predictors between Poor Performers (PP) and Good Performers (GP). Statistically significant differences were found for the Wortschatztest (WST), where PP scored lower than GP (p = 0.038), and for the Speech in Noise (OLSA) test, with a highly significant difference (p < 0.001), with Good Performers achieving substantially better SNR values. Additionally, a trend toward significance was observed for Educational Level (p = 0.087) and SCWTDots (p = 0.095), suggesting a possible effect but not reaching conventional significance thresholds. Other measures, including SDMT, word score prior to implantation, age, and duration of deafness, did not show significant group differences.
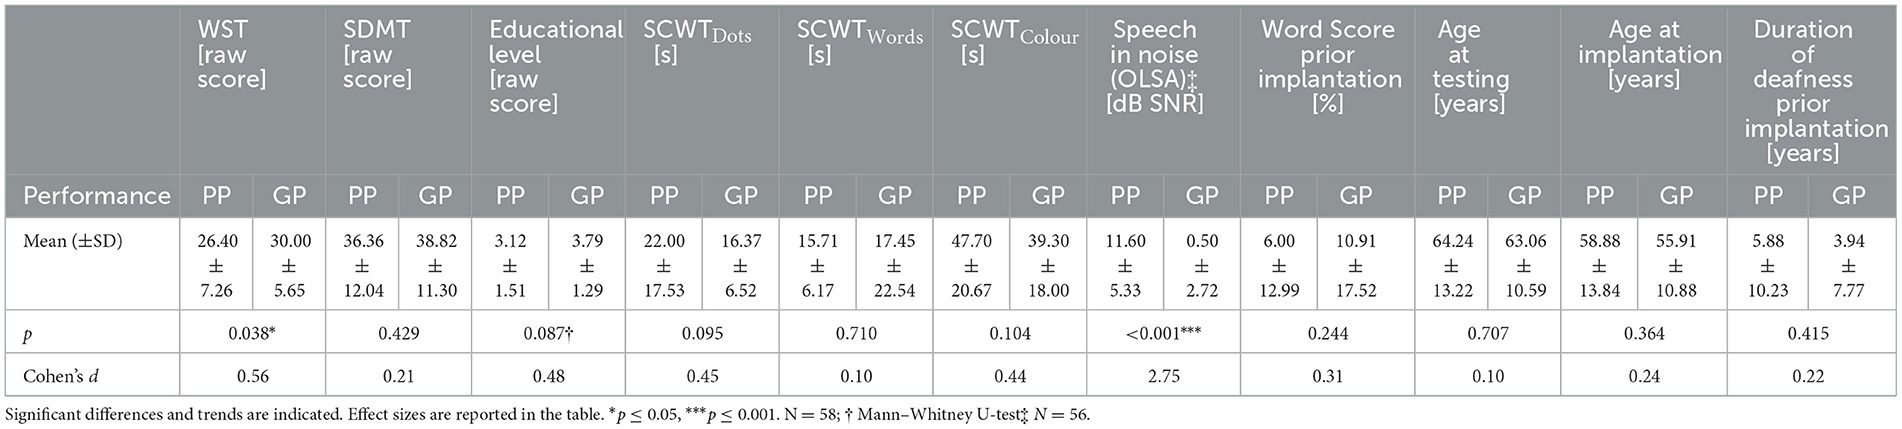
Table 2. Group comparison of mean scores and p-values for various variables between Poor Performers (PP) and Good Performers (GP).
3.2 Results for word recognition in quiet
Table 3 presents the results of univariate linear regression analyses on various predictors for words in quiet (65 dB SPL). Each one-point increase in vocabulary size (WST) was associated with a 1.54 percentage point increase in word recognition (p = 0.026). In contrast, SDMT, SCWTWords, and other variables such as age at testing, age at implantation, and duration of deafness prior to implantation did not show significant associations with word recognition. A one-second increase in SCWTColours is linked to a 0.402 percentage point decrease in word recognition in quiet, showing a trend toward significance (p = 0.089). Similarly, participants with higher educational levels scored 5.696 percentage points higher in word recognition than those with lower educational levels, also showing a trend toward significance (p = 0.079). Participants with childhood hearing loss scored 23.481 percentage points lower in word recognition than those with later-onset hearing loss (p = 0.026). These results highlight that WST and the type of hearing loss are significant predictors of word recognition in quiet, while other factors show trends or no significant relationships.
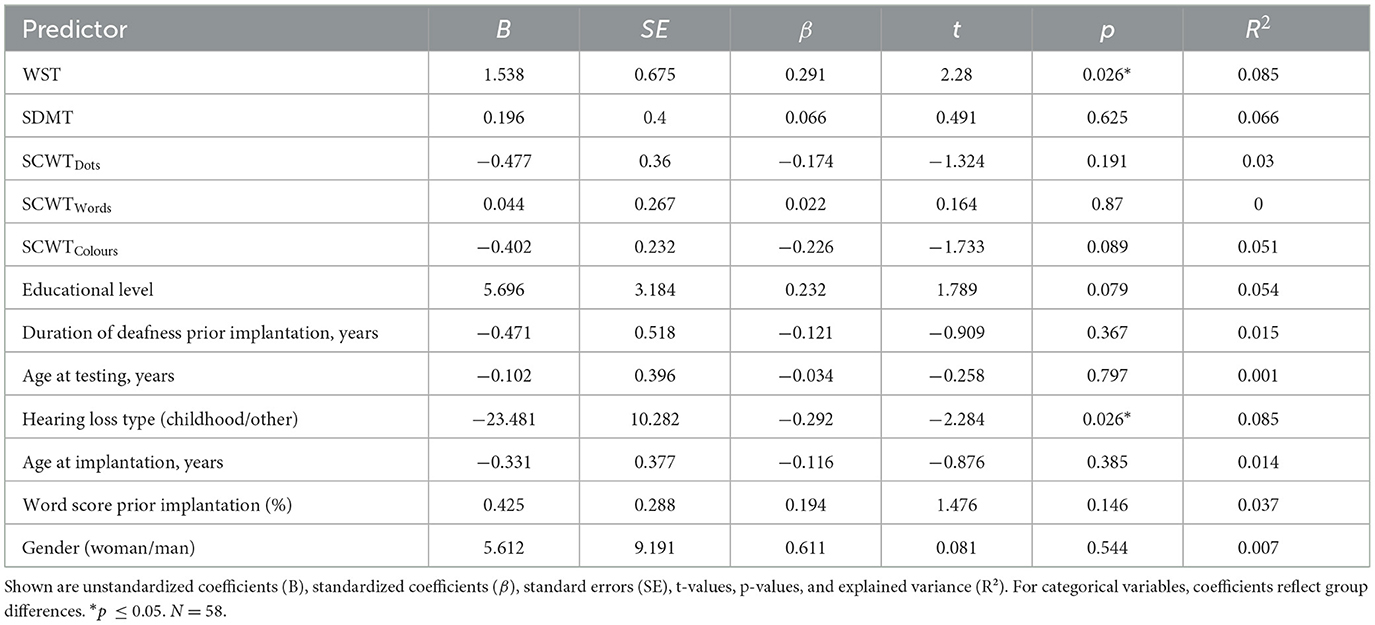
Table 3. Univariate linear regression analyses predicting word recognition in quiet (65 dB SPL) based on cognitive, linguistic and patient-related predictors.
In Table 4, the multiple linear regression analysis for words in quiet (65 dB SPL) was conducted using predictors selected with a p-value cut-off of 0.2. SCWTColours was prioritized over SCWTDots as it represents the more challenging task in the Stroop test and is therefore considered a more relevant predictor of cognitive processing speed in this context. According to Scarpina and Tagini (2017), while some studies use ratios for Stroop conditions, there is no consensus on their necessity. They suggest that both raw scores and ratios can be valid depending on the research question. For this analysis, SCWTColours was presented using the raw score, as it directly reflects cognitive processing speed in the more challenging incongruent condition. Among the predictors, only the type of hearing loss showed a significant association, with participants with childhood hearing loss scoring 23.679 percentage points lower in word recognition compared to those with later-onset hearing loss (p = 0.027). Vocabulary size (WST), word score prior to implantation, and SCWTColours all showed trends toward significance in predicting word recognition in quiet. Each one-point increase in WST was associated with a 0.493 percentage point increase in word recognition (p = 0.510), a 1% increase in word score prior implantation was linked to a 0.484 percentage point increase (p = 0.082), and a one-second increase in SCWTColours was associated with a 0.479 percentage point decrease in word recognition (p = 0.051).
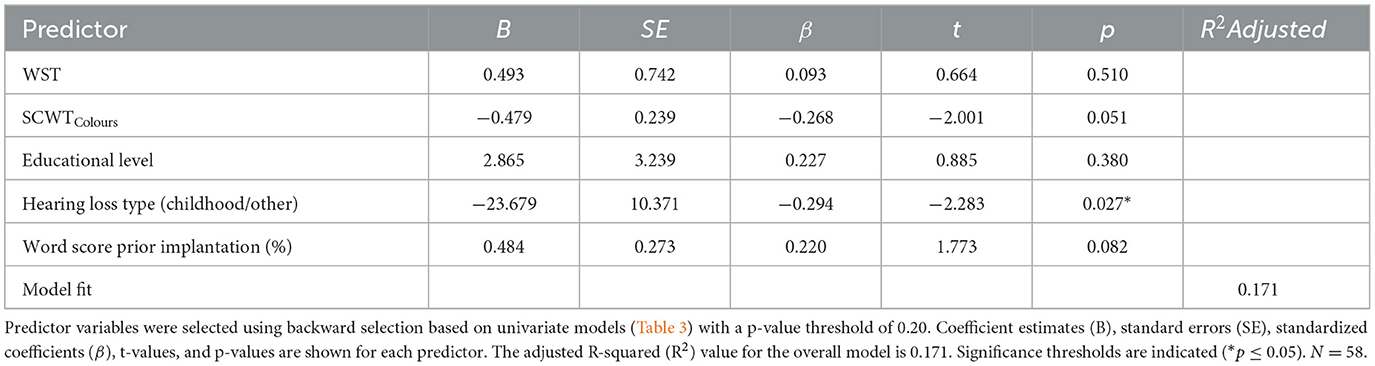
Table 4. Multivariable linear regression model predicting word recognition in quiet (65 dB SPL) based on cognitive, linguistic and patient-related predictors.
Table 5 shows a significant negative association between SCWTColours and word recognition in quiet, with a one-second decrease in SCWTColours linked to a 0.503 percentage point increase in word recognition (p = 0.028). Additionally, participants with childhood hearing loss scored 23.679 percentage points lower in word recognition compared to those with later-onset hearing loss (p = 0.009).

Table 5. Multivariable linear regression model predicting word recognition in quiet (65 dB SPL) based on cognitive and patient-related predictors.
3.3 Results for speech in noise
Table 6 shows the results of univariate linear regression analysis on various predictors for speech in noise. It is important to note that for this outcome measure, lower (more negative) values indicate better performance, while higher (more positive) values reflect poorer performance. Larger vocabulary size (WST) was significantly associated with better speech-in-noise performance, with each point increase in WST linked to 0.396 dB decrease in speech-in-noise performance (p = 0.004). A higher educational level was associated with a 1.616 dB improvement in speech-in-noise performance (p = 0.011). Participants with childhood hearing loss performed 4.755 dB worse in speech-in-noise performance compared to those with later-onset hearing loss (p = 0.023). SCWTDots and SCWTColours showed a trend toward significance, with longer times on both tasks linked to poorer speech-in-noise performance. Each second increase in SCWTDots and SCWTColours was associated with a 0.135 dB and 0.089 dB increase in OLSA SRT, respectively (p = 0.059 and p = 0.097). Other predictors, including SDMT, SCWTWords, word score prior to implantation, duration of deafness, age at testing, age at implantation, and gender, showed no significant association with speech-in-noise performance (p > 0.05).
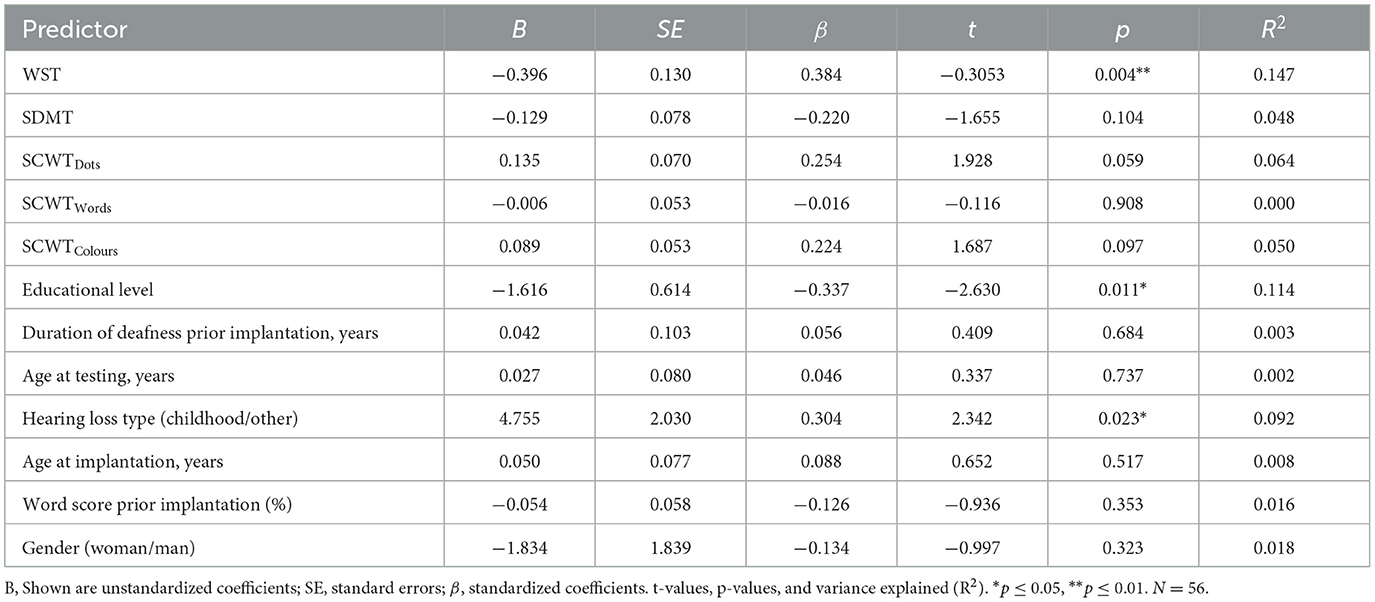
Table 6. Univariate linear regression models predicting speech-in-noise performance (OLSA) based on cognitive, linguistic, and patient-related predictors.
The multiple linear regression analysis (Table 7) identified hearing loss type (childhood vs. later-onset) as the only significant predictor of speech-in-noise performance. Participants with childhood hearing loss showed a 4.65 dB worse speech-in-noise performance compared to those with later-onset hearing loss (p = 0.029). Other predictors, including WST, SCWTColours, SDMT, and educational level, were not significantly associated with speech-in-noise performance.
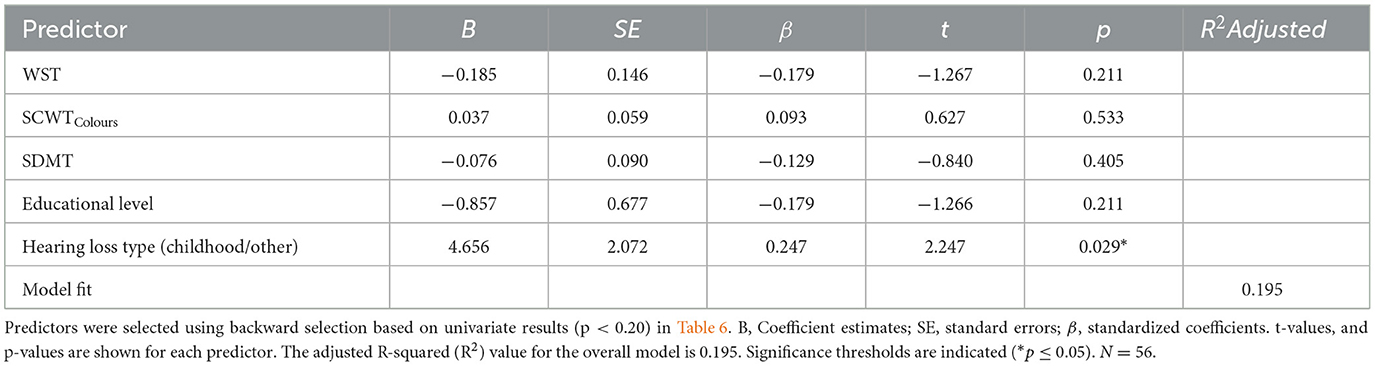
Table 7. Multivariable linear regression model predicting speech-in-noise performance (OLSA) based on cognitive, linguistic and patient-related predictors.
3.4 Results for vocabulary size (WST)
Table 8 presents univariate linear regression results for predictors of WST performance. Higher educational levels were associated with 1.773 higher WST scores (p = 0.003), and each second decrease in SCWTColours reaction time corresponded to a 0.095-point increase in WST scores (p = 0.033). Additionally, each year older at implantation was associated with a 0.146-point increase in WST scores (p = 0.040). SDMT and age at testing showed trends toward significance, with each point increase in SDMT linked to a 0.135-point increase in WST scores, and each year older at testing associated with a 0.125-point increase in WST scores (p = 0.072 and p = 0.094, respectively). Other factors, such as duration of deafness, word score prior to implantation, and gender, showed no significant associations with WST performance.
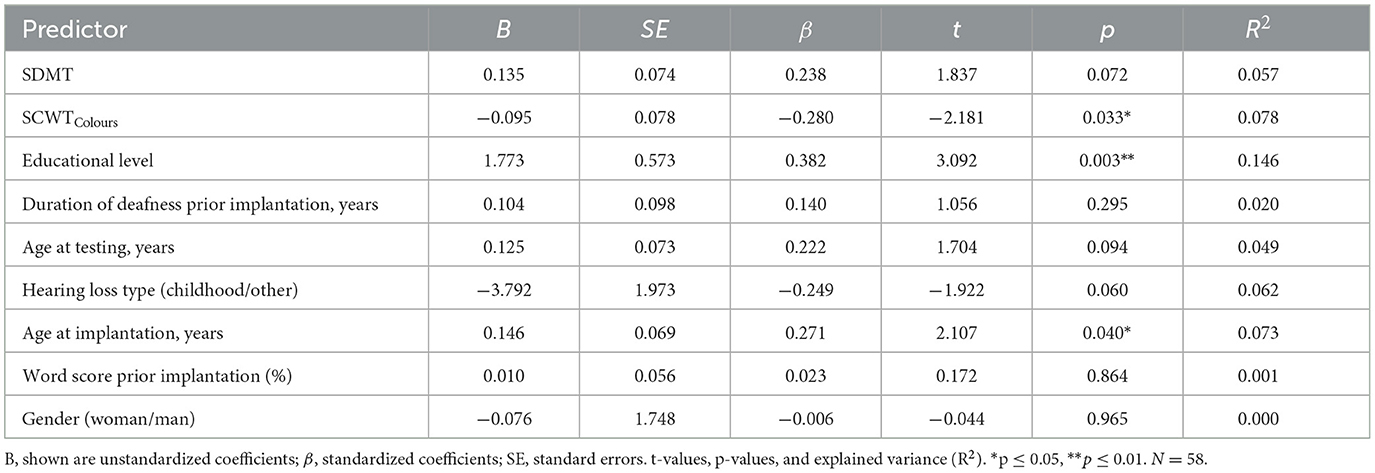
Table 8. Univariate linear regression models predicting vocabulary size (WST) based on cognitive and patient-related predictors.
Due to multicollinearity between age at testing and age at implantation (Pearson correlation = 0.927**, VIF = 9.089), age at implantation was excluded from further analysis to improve the stability and interpretability of the regression model. Although univariate analysis showed a slightly stronger association between age at implantation (p = 0.040, R2 = 0.073) and speech performance compared to age at testing (p = 0.094, R2 = 0.049), age at testing was retained in the analysis. This decision was based on its greater relevance to participants' current cognitive and linguistic state, which is directly linked to their present speech performance. Given the study's focus on factors influencing current speech outcomes, age at testing was considered the more pertinent predictor. First, duration of deafness prior to implantation, word score prior to implantation, and gender were removed from the subsequent multiple linear regression model, as their p-values exceeded the threshold of 0.2. In the next analysis, hearing loss type was also excluded from the multiple linear regression model presented in Table 9, as it did not meet the significance threshold (B = −2.113, SE = 1.704, p = 0.221), with a p-value >0.2. This intermediate step was calculated but is not presented as a separate table in order to streamline the analysis. The final multiple linear regression model on WST is shown in Table 9.
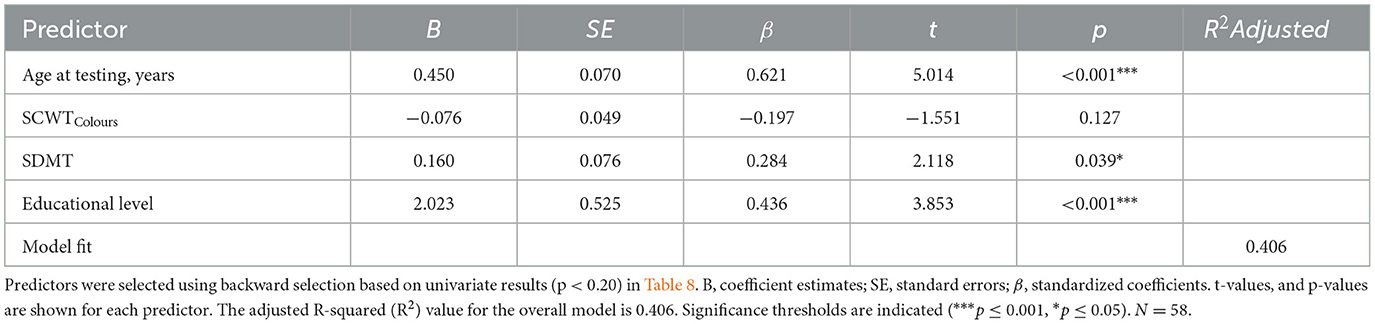
Table 9. Multivariable linear regression model predicting vocabulary size (WST) based on cognitive and patient-related predictors.
Table 9 shows that age at testing and educational level were strong positive predictors of vocabulary size. Each year of age was associated with a 0.450-point increase in WST scores (p < 0.001), and each higher education level was linked to a 2.023-point increase (p < 0.001). Faster processing speed, as indicated by higher SDMT scores, was also positively related to vocabulary size, with each additional point in SDMT linked to a 0.160-point increase in WST scores. SCWTColours showed no significant relationship.
In Table 10, educational level is categorized into several groups: Master Craftsman (Meister), Apprenticeship (Ausbildung), Secondary School (10 years), Secondary School (9 years), and Elementary School (8 years), with “University” as the reference category in the multiple linear regression model. The other educational categories are represented as dummy variables. Age at testing was significantly positively associated with WST scores, with each year of age linked to a 0.286-point increase. Shorter SCWTColours times were linked to higher WST scores, with each second decrease in SCWTColours corresponding to a 0.103-point increase in WST. Participants with lower educational levels scored significantly lower on the WST compared to those with a university degree, with differences ranging from 5.5 to 7.9 points (all p ≤ 0.020). SDMT and hearing loss type showed no significant effects.
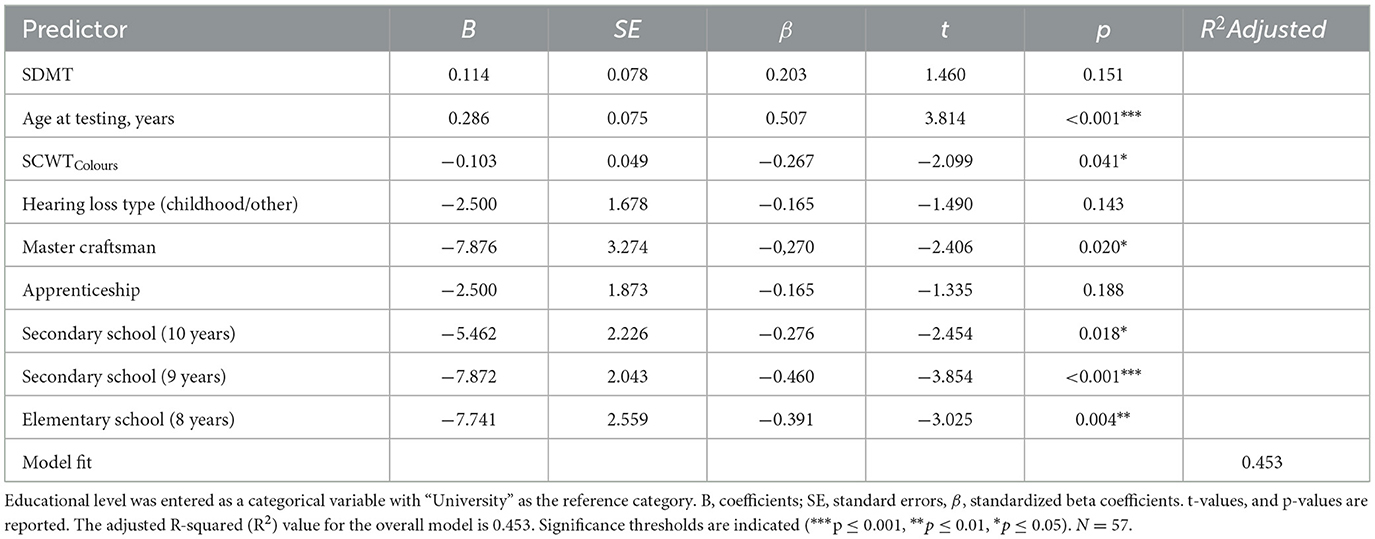
Table 10. Multiple linear regression model predicting vocabulary size (WST) based on cognitive and patient-related predictors.
In Table 11, a preliminary analysis was conducted in which hearing loss type (B = −1.839, SE = 1.722, p = 0.291) was removed from the multiple linear regression model, as it did not meet the significance threshold (cut-off p = 0.2). This intermediate step was calculated but is not presented as a separate table to streamline the analysis. As described in the methods section (Educational Level), educational levels in Table 10 were categorized into three groups (Edu1, Edu2, and Edu3), with Edu3 serving as the reference category. Participants with Edu1 scored 5.688 points lower in vocabulary size than those with Edu3 (the reference category). SDMT was positively associated with vocabulary size, with each point increase in SDMT corresponding to a 0.183-point increase in vocabulary size. Age at testing also had a positive effect, with each year of age corresponding to a 0.353-point increase in vocabulary size. Edu2 did not show a significant effect.
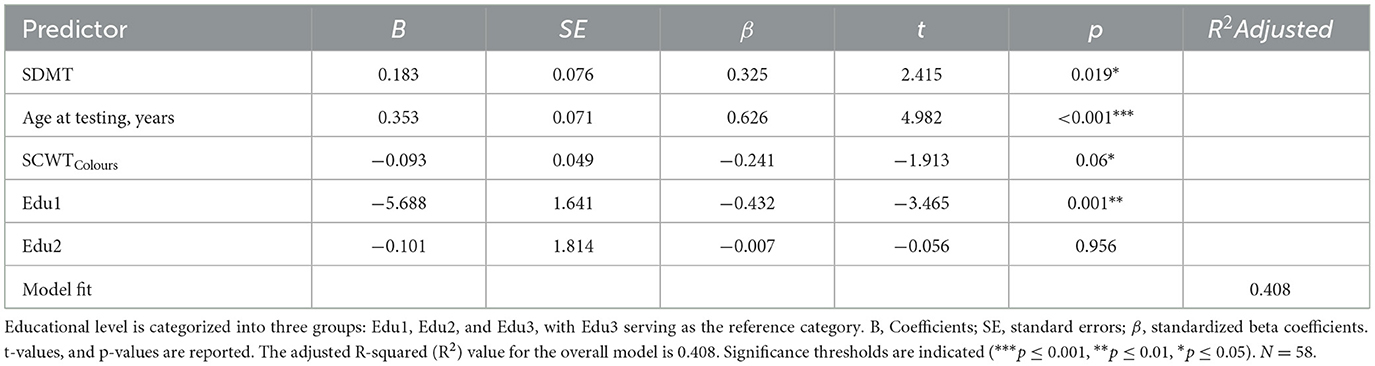
Table 11. Multiple linear regression model predicting vocabulary size (WST) based on cognitive and patient-related predictors.
4 Discussion
4.1 Overview of key findings
This study examined the contribution of cognitive and linguistic factors to speech outcomes in post-lingually deafened adult CI users. Participants were grouped into Poor Performers (PP) and Good Performers (GP) based on word recognition in quiet at 65 dB SPL. Overall, GP exhibited significantly higher vocabulary scores (Wortschatztest, WST) and superior speech-in-noise performance. In addition, univariate and multiple regression analyses highlighted the importance of vocabulary size, childhood hearing loss, and certain cognitive factors (particularly executive control) in shaping speech outcomes. These findings underscore how both linguistic proficiency and cognitive abilities can jointly influence CI success, supporting prior research that links language competence and neurocognitive skills to variability in post-implantation performance (Blamey et al., 2013; Holden et al., 2013; Moberly et al., 2016).
4.2 Linguistic factors: vocabulary size and educational attainment
Consistent with previous studies (Bhargava et al., 2014; Finke et al., 2016; Völter et al., 2021; Zekveld et al., 2007), the present data confirm that a larger vocabulary strongly correlates with better speech understanding in both quiet and noise. Lexical knowledge may enhance the listener's ability to access word representations quickly and accurately, thereby reducing cognitive load during speech perception (Blamey et al., 2013). Furthermore, educational attainment emerged as a significant predictor of vocabulary size, supporting evidence that formal schooling can enrich linguistic knowledge (Cunningham and Stanovich, 1997; Hoff, 2003; Verhaeghen, 2003). Interestingly, our findings suggest a plateau effect around secondary education (up to 10 years) beyond which vocabulary growth no longer demonstrated marked increases. This aligns with research indicating that formal education offers a substantial vocabulary boost early on, but further gains may be more incremental or reliant on specialized, language-rich environments (Cunningham and Stanovich, 1997; Hoff, 2003; Verhaeghen, 2003). Such a plateau implies that ongoing language engagement—rather than education alone—might be necessary to sustain vocabulary expansion into adulthood.
4.3 Childhood hearing loss and lasting impacts
An especially salient predictor of word recognition was childhood hearing loss, which was consistently associated with poorer speech performance in quiet, as observed in previous studies (Green et al., 2007; Cupples et al., 2018). This finding reinforces the importance of early auditory input for the development of robust phonological and linguistic representations. When hearing deprivation occurs during formative years, it can lead to long-term deficits in speech processing and auditory neural plasticity—deficits that may persist into adulthood despite the benefits of cochlear implantation. Early identification and intervention, including earlier CI candidacy or targeted auditory-verbal therapy, might help mitigate these delays and yield better outcomes later in life.
4.4 Cognitive control, processing speed, and speech outcomes
Cognitive factors, particularly executive control (as indexed by the Stroop Color-Word Test) and processing speed (Symbol Digit Modality Test), were also examined. The multiple linear regression models identified Stroop performance (SCWTColours) as a notable predictor of speech recognition in quiet, supporting the “cognitive spare capacity” hypothesis (Mishra et al., 2014). Under demanding auditory conditions, individuals must allocate cognitive resources to both decoding the signal and extracting meaning. Deficits in executive control can reduce overall processing efficiency, leading to poorer speech perception, especially in noise (Pichora-Fuller, 2003; Rönnberg et al., 2013).
Moreover, participants who were faster at cognitive tasks tended to have a larger vocabulary, a relationship that aligns with prior research showing that processing speed can bolster lexical acquisition and retrieval (Marchman and Fernald, 2008; Salthouse, 1996; Verhaeghen and Salthouse, 1997). Taken together, these data emphasize the intertwined roles of cognitive efficiency and linguistic knowledge in maximizing CI outcomes.
4.5 Additional factors influencing CI outcomes
Beyond linguistic, cognitive, and hearing history factors assessed here, other variables may further influence CI outcomes. Etiology of hearing loss, neural health (e.g., spiral ganglion neuron integrity), electrode placement, and device mapping accuracy significantly impact auditory sensitivity and speech recognition (Arjmandi et al., 2022; Busby and Arora, 2016; Carlyon et al., 2018; Schvartz-Leyzac et al., 2020). Moreover, post-implantation auditory rehabilitation strategies and patient-driven factors such as motivation, social support, and active engagement have also been linked to improved speech perception and quality of life (Fu and Galvin, 2007; Harris et al., 2016). Socioeconomic factors—education level, access to rehabilitation resources, and travel-related barriers—also affect device use and outcomes (Davis et al., 2023; Zhao et al., 2020). Additionally, tinnitus severity and related symptoms may negatively influence outcomes by affecting attention and listening effort (Ivansic et al., 2017; Liu et al., 2018). These findings underline the necessity of adopting a comprehensive, multidisciplinary perspective in assessing and improving CI outcomes.
4.6 Clinical and rehabilitation implications
From a clinical standpoint, the present findings highlight the need for holistic assessments of CI candidates that incorporate evaluations of both language (e.g., vocabulary size) and cognition (e.g., executive control, processing speed). Tailored rehabilitation programs might include:
• Vocabulary Enhancement: Intensive language exercises, reading programs, and exposure to varied vocabulary could help fill lexical gaps.
• Cognitive Training: Interventions aimed at executive functions (inhibition, set shifting) or processing speed (e.g., computer-based training, structured auditory-cognitive drills).
• Early Intervention for Childhood Hearing Loss: Children who exhibit hearing deficits should receive timely support—amplification, early CI when appropriate, and robust language instruction—given the lasting ramifications of early auditory deprivation.
• Speech-in-Noise Exercises: Dedicated practice in noise-laden environments may facilitate better attention shifting and more efficient use of cognitive resources for speech understanding.
• Psychosocial support: Encompasses emotional counseling, peer support groups, and access to mental health resources. Such support can help patients better cope with the challenges of auditory rehabilitation, reduce stress, and maintain motivation throughout the CI journey.
Addressing psychosocial and socioeconomic influences—including access to rehabilitation, availability of social support, and travel-related barriers—may help improve equity and optimize speech perception outcomes in diverse CI populations (Davis et al., 2023; Harris et al., 2016; Zhao et al., 2020). Adopting such a multidisciplinary approach might enhance long-term speech outcomes and quality of life for CI recipients, particularly among those at risk of poor performance.
4.7 Limitations and future directions
This study has limitations. Although educational attainment was identified as a significant predictor of vocabulary size in this cohort, the findings indicate that other factors—such as cognitive abilities and a history of childhood hearing loss—are also critical determinants of speech recognition outcomes in adult CI users. The relatively small and homogeneous sample from a single center may limit the extent to which these results can be generalized to the broader CI population, potentially overlooking the influence of diverse backgrounds and life experiences. In addition, factors such as socioeconomic status, the quality and duration of auditory rehabilitation, and individual motivation were not captured in the present analysis, yet may meaningfully impact post-implantation performance. These considerations underscore the multifactorial nature of speech outcomes following cochlear implantation and highlight the need to look beyond educational background alone when evaluating predictors of success. Future research employing larger and more diverse samples will be essential to clarify these complex relationships and to improve the generalizability of findings.
In addition to these broader considerations, several methodological limitations should be noted. First, the extended analysis design and relatively small sample size (N = 58) limit the generalizability of the findings, which is often a challenge in single-center studies in the field of cochlear implantation. Additionally, the small sample size reduces statistical power, potentially leading to Type II errors and overlooking significant relationships between variables. Conducting a power analysis prior to study implementation could have provided a clearer understanding of the required sample size to detect meaningful effects. Second, high correlations between variables like age at implantation and age at testing highlight the need for longitudinal studies that can disentangle the effects of implant timing vs. later-life changes in cognition. Furthermore, the presence of clustering in word recognition scores suggests that a more nuanced analysis approach, such as logistic regression, may be worth considering in future studies to better address such distribution patterns.
Another limitation concerns the lack of a standardized definition for “duration of deafness.” In the current study, this variable was based on patient self-report and clinical history, which may not consistently reflect the true onset of auditory deprivation, especially in cases of gradual or progressive hearing loss. As highlighted by Kelly et al. (2025), defining the beginning of deafness is inherently complex and varies across studies, which complicates comparisons and may influence the interpretation of deafness-related effects on CI outcomes. Establishing more precise and clinically validated criteria for estimating the onset and duration of deafness remains an important methodological goal for future research.
Future work should explore these relationships in larger, more diverse cohorts and adopt prospective, longitudinal designs that track how interventions in vocabulary or cognitive training might alter speech outcomes over time. Increasing sample sizes in future studies will enhance statistical power, allowing for more robust conclusions regarding the predictors of speech performance in CI users. Additionally, investigating specific domains of executive function (working memory, attentional control, and inhibitory function) may uncover which cognitive components are most critical for speech perception in challenging listening environments.
5 Conclusion
Speech understanding in CI users is shaped by a complex network of bottom-up and top-down processes (Moberly et al., 2016; Völter et al., 2021, 2022). Prior research (Blamey et al., 2013; Holden et al., 2013) suggests that patient-related factors account for only 10% to 22% of the variance in speech recognition outcomes. More recent data from Dawson et al. (2025 indicate that combining various predictor variables can explain 33% to 60% of the variance in performance—figures derived from cohorts encompassing both good and poor performers. However, there remains a notable gap in understanding the factors that specifically affect poorly performing CI users. The present study contributes to closing this gap by highlighting how cognitive and linguistic factors, in particular vocabulary size and executive control, play a pivotal role in shaping speech perception. Despite explaining ~17% of the variability in speech performance, our findings underscore the multifaceted nature of speech understanding among adults with post-lingual hearing loss. These results reinforce the idea that no single factor—cognitive, linguistic, or otherwise—dominates the landscape of speech outcomes in CI users. Instead, a constellation of influences such as cognitive control, vocabulary size, early auditory experiences, and educational background collectively determine CI success. This complexity is especially relevant for those with suboptimal improvements post-implantation, emphasizing the need for targeted interventions tailored to their unique cognitive-linguistic profiles. In addition, integrating physiological and psychosocial markers—such as neural survival, device fitting accuracy, and rehabilitation context—into predictive models of CI performance may further enhance explanatory power and clinical relevance.
Future research should delve deeper into the specific cognitive mechanisms (e.g., working memory, inhibitory control, processing speed) underlying speech perception in both quiet and noisy environments. Moreover, longitudinal studies and randomized interventions (e.g., cognitive training, intensive lexical enrichment) could clarify how to enhance CI outcomes most effectively—especially for poorly performing users. Additionally, efforts to define and standardize critical variables such as the duration of deafness are essential, as current inconsistencies limit comparability across studies and may obscure important predictors of CI outcomes (Kelly et al., 2025). By integrating comprehensive assessments that encompass cognitive, linguistic, and demographic variables, clinicians and researchers can better predict post-operative success, design personalized rehabilitation strategies, and ultimately bridge the gap in care for this critical subgroup of CI recipients.
Data availability statement
The raw data supporting the conclusions of this article will be made available by the authors, without undue reservation.
Ethics statement
The studies involving humans were approved by Ethics Committee of Hannover Medical School (MHH), Carl-Neuberg-Str. 1, 30625 Hannover, Germany on April 2020 (MHH 8923-BO_S_2020). The studies were conducted in accordance with the local legislation and institutional requirements. The participants provided their written informed consent to participate in this study.
Author contributions
NB: Writing – original draft, Formal analysis, Conceptualization, Methodology, Data curation, Writing – review & editing, Visualization. EK: Writing – review & editing, Methodology. TL: Resources, Writing – review & editing. AB: Conceptualization, Writing – review & editing, Formal analysis, Writing – original draft, Methodology.
Funding
The author(s) declare that financial support was received for the research and/or publication of this article. This study was supported by Cochlear Ltd. However, Cochlear Ltd. had no role in the study design, data collection, analysis, decision to publish, or preparation of the manuscript. This research was also funded by the Deutsche Forschungsgemeinschaft (DFG, German Research Foundation) under Germany's Excellence Strategy - EXC 2177/1 - Project ID 390895286.
Acknowledgments
Thank you to Mark Schüßler for his support in participant recruitment and data collection. We also sincerely appreciate all participants for volunteering their time to take part in this study.
Conflict of interest
The authors declare that the research was conducted in the absence of any commercial or financial relationships that could be construed as a potential conflict of interest.
Generative AI statement
The author(s) declare that no Gen AI was used in the creation of this manuscript.
Publisher's note
All claims expressed in this article are solely those of the authors and do not necessarily represent those of their affiliated organizations, or those of the publisher, the editors and the reviewers. Any product that may be evaluated in this article, or claim that may be made by its manufacturer, is not guaranteed or endorsed by the publisher.
Abbreviations
ANSI, American National Standards Institute; CI, Cochlear Implant; CNC, Consonant-Nucleus-Consonant; dB SPL, Decibel Sound Pressure Level; DHZ, German Hearing Center; DQR, Deutscher Qualifikationsrahmen; Edu, Educational Level; GP, Good Performers; MLR, Multivariable Linear Regression; OLSA, Oldenburger Satztest; PP, Poor Performers; SAM, Self-Scoring Speech Audiometry; SCWT, Stroop Color and Word Test; SD, Standard Deviation; SDMT, Symbol Digit Modalities Test; SII, Speech Intelligibility Index; SNR, Signal-to-Noise Ratio; SRT, Speech Reception Threshold; VIF, Variance Inflation Factor; WST, Wortschatztest.
References
American Academy of Otolaryngology–Head and Neck Surgery (AAO-HNS). (2014). Clinical practice guideline: cochlear implants. Otolaryngol. Head Neck Surg. 150(2 Suppl.), S1–S30. doi: 10.1177/01945998135170
American National Standards Institute. (1997). ANSI S3.5-1997: Methods for the Calculation of the Speech Intelligibility Index. New York, NY: Acoustical Society of America.
Arjmandi, M. K., Jahn, K. N., and Arenberg, J. G. (2022). Single-channel focused thresholds relate to vowel identification in pediatric and adult cochlear implant listeners. Trends Hear. 26:23312165221095364. doi: 10.1177/23312165221095364
Benard, M., Mensink, J. S., and Başkent, D. (2014). Individual differences in top-down restoration of interrupted speech: links to linguistic and cognitive abilities. J. Acoust. Soc. Am. 135, EL1–EL8. doi: 10.1121/1.4862879
Besser, J., Koelewijn, T., Zekveld, A. A., Kramer, S. E., and Festen, J. M. (2013). How linguistic closure and verbal working memory relate to speech recognition in noise: a review. Trends Amplif. 17, 75–93. doi: 10.1177/1084713813495459
Bhargava, P., Gaudrain, E., and Başkent, D. (2014). Top-down restoration of speech in cochlear-implant users. Hear. Res. 309, 113–123. doi: 10.1016/j.heares.2013.12.003
Bialystok, E., and Craik, F. I. M. (2010). Cognitive and linguistic processing in the bilingual mind. Curr. Dir. Psychol. Sci. 19, 19–23. doi: 10.1177/0963721409358571
Blamey, P. J., Artieres, F., Başkent, D., Bergeron, F., Beynon, A., Burke, E., et al. (2013). Factors affecting auditory performance of postlinguistically deaf adults using cochlear implants: an update with 2251 patients. Audiol. Neurootol. 18, 36–47. doi: 10.1159/000343189
Boisvert, I., Reis, M., Au, A., Cowan, R., and Dowell, R. (2020). Cochlear implantation outcomes in adults: a scoping review. PLoS ONE 15;e0232421. doi: 10.1371/journal.pone.0232421
Braza, M. D., Reis, M., Au, A., Cowan, R., and Dowell, R. (2022). Effects of word familiarity and receptive vocabulary size on speech-in-noise recognition among young adults with normal hearing. PLoS ONE 17:e0264581. doi: 10.1371/journal.pone.0264581
Buchman, C. A., Copeland, B. J., Yu, K. K., Brown, C. J., Carrasco, V. N., and Pillsbury, H. C. 3rd. (2004). Cochlear implantation in children with congenital inner ear malformations. Laryngoscope 114, 309–316. doi: 10.1097/00005537-200402000-00025
Busby, P. A., and Arora, K. (2016). Effects of threshold adjustment on speech perception in nucleus cochlear implant recipients. Ear Hear. 37, 303–311. doi: 10.1097/AUD.0000000000000248
Carlyon, R. P., Cosentino, S., Deeks, J. M., Parkinson, W., and Arenberg, J. G. (2018). Effect of stimulus polarity on detection thresholds in cochlear implant users: relationships with average threshold, gap detection, and rate discrimination. J. Assoc. Res. Otolaryngol. 19, 559–567. doi: 10.1007/s10162-018-0677-5
Carroll, R., Warzybok, A., Kollmeier, B., and Ruigendijk, E. (2016). Age-related differences in lexical access relate to speech recognition in noise. Front. Psychol. 7:990. doi: 10.3389/fpsyg.2016.00990
Choi, I., Gander, P. E., Berger, J. I., Woo, J., Choy, M. H., Hong, J., et al. (2023). Spectral grouping of electrically encoded sound predicts speech-in-noise performance in cochlear implantees. J. Assoc. Res. Otolaryngol. 24, 607–617. doi: 10.1007/s10162-023-00918-x
Cunningham, A. E., and Stanovich, K. E. (1997). Early reading acquisition and its relation to reading experience and ability 10 years later. Dev. Psychol. 33, 934–945. doi: 10.1037/0012-1649.33.6.934
Cupples, L., Ching, T. Y. C., Button, L., Leigh, G., Marnane, V., Whitfield, J., et al. (2018). Language and speech outcomes of children with hearing loss and additional disabilities: identifying the variables that influence performance at five years of age. Int. J. Audiol. 57(Suppl. 2), S93–S104. doi: 10.1080/14992027.2016.1228127
Cutler, A., and Clifton, C. (2000). “Comprehending spoken language: a blueprint of the listener,” in The Neurocognition of Language, eds. C. M. Brown and P. Hagoort (Oxford: Oxford University Press), 123–166. doi: 10.1093/acprof:oso/9780198507932.003.0005
Davis, A. G., Hicks, K. L., Dillon, M. T., Overton, A. B., Roth, N., Richter, M. E., et al. (2023). Hearing health care access for adult cochlear implant candidates and recipients: travel time and socioeconomic status. Laryngosc. Investig. Otolaryngol. 8, 296–302. doi: 10.1002/lio2.1010
Dawson, P., Fullerton, A., Krishnamoorthi, H., Plant, K., Cowan, R., Buczak, N., et al. (2025). A prospective, multicentre case-control trial examining factors that explain variable clinical performance in post lingual adult CI recipients. Trends Hear. 29:23312165251347138. doi: 10.1177/23312165251347138
Dazert, S., Thomas, J. P., Loth, A., Zahnert, T., and Stöver, T. (2020). Cochlear implantation. Dtsch. Arztebl. Int. 117, 690–700. doi: 10.3238/arztebl.2020.0690
de Graaff, F., Lissenberg-Witte, B. I., Kaandorp, M. W., Merkus, P., Goverts, S. T., Kramer, S. E., et al. (2020). Relationship between speech recognition in quiet and noise and fitting parameters, impedances, and ECAP thresholds in adult cochlear implant users. Ear Hear. 41, 935–947. doi: 10.1097/AUD.0000000000000814
Desjardins, J. L., and Doherty, K. A. (2013). Age-related changes in listening effort for various types of masker noises. Ear Hear. 34, 261–272. doi: 10.1097/AUD.0b013e31826d0ba4
DeVries, L., Scheperle, R., and Bierer, J. A. (2016). Assessing the electrode-neuron interface with the electrically evoked compound action potential, electrode position, and behavioral thresholds. J Assoc. Res. Otolaryngol. 17, 237–252. doi: 10.1007/s10162-016-0557-9
Finke, M., Büchner, A., Ruigendijk, E., Meyer, M., and Sandmann, P. (2016). On the relationship between auditory cognition and speech intelligibility in cochlear implant users: an ERP study. Neuropsychologia 87, 169–181. doi: 10.1016/j.neuropsychologia.2016.05.019
Friesen, L. M., Shannon, R. V., Başkent, D., and Wang, X. (2001). Speech recognition in noise as a function of the number of spectral channels: comparison of acoustic hearing and cochlear implants. J. Acoust. Soc. Am. 110, 1150–1163. doi: 10.1121/1.1381538
Fu, Q.-J., and Galvin, J. J. (2007). Perceptual learning and auditory training in cochlear implant recipients. Trends Amplif. 11, 193–205. doi: 10.1177/1084713807301379
Galvin, J. J. III., Fu, Q. J., Wilkinson, E. P., Mills, D., Hagan, S. C., Lupo, J. E., et al. (2019). Benefits of cochlear implantation for single-sided deafness: data from the House Clinic-University of Southern California-University of California, Los Angeles clinical trial. Ear Hear. 40, 766–781. doi: 10.1097/AUD.0000000000000671
Goehring, T., Archer-Boyd, A., Deeks, J. M., Arenberg, J. G., and Carlyon, R. P. (2019). A site-selection strategy based on polarity sensitivity for cochlear implants: effects on spectro-temporal resolution and speech perception. J. Assoc. Res. Otolaryngol. 20, 431–448. doi: 10.1007/s10162-019-00724-4
Golden, C. J. (1978). Stroop Color and Word Test: A Manual for Clinical and Experimental Uses. Chicago, IL: Stoelting Company.
Green, K. M., Bhatt, Y., Mawman, D. J., O'Driscoll, M. P., Saeed, S. R., Ramsden, R. T., et al. (2007). Predictors of audiological outcome following cochlear implantation in adults. Cochlear Implants Int. 8, 1–11. doi: 10.1179/cim.2007.8.1.1
Hahlbrock, K. H. (1953). Über Sprachaudiometrie und neue Wörterteste [Speech audiometry and new word-tests]. Arch. Ohren Nasen Kehlkopfheilkd. 162, 394–431. doi: 10.1007/BF02105664
Harris, M. S., Capretta, N. R., Henning, S. C., Feeney, L., Pitt, M. A., and Moberly, A. C. (2016). Postoperative rehabilitation strategies used by adults with cochlear implants: a pilot study. Laryngosc. Investig. Otolaryngol. 1, 42–48. doi: 10.1002/lio2.20
Hoff, E. (2003). The specificity of environmental influence: socioeconomic status affects early vocabulary development via maternal speech. Child Dev. 74, 1368–1378. doi: 10.1111/1467-8624.00612
Holden, L. K., Finley, C. C., Firszt, J. B., Holden, T. A., Brenner, C., Potts, L. G., et al. (2013). Factors affecting open-set word recognition in adults with cochlear implants. Ear Hear. 34, 342–360. doi: 10.1097/AUD.0b013e3182741aa,7
Industrie und Handelskammer. (2016). Deutscher Qualifikationsrahmen (DQR). Available online at: https://www.ihk.de/stuttgart/standortpolitik/bildungspolitik/berufliche-bildung/deutscher-und-europaeischer-qualifikationsrahmen-663432 [Accessed January 14, 2025].
Ivansic, D., Guntinas-Lichius, O., Müller, B., Volk, G. F., Schneider, G., and Dobel, C. (2017). Impairments of speech comprehension in patients with tinnitus—a review. Front. Aging Neurosci. 9:224. doi: 10.3389/fnagi.2017.00224
James, C. J., Karoui, C., Laborde, M.-L., Lepage, B., Moliner, C.-E., Tartayre, M., et al. (2019). Early sentence recognition in adult cochlear implant users. Ear Hear. 40, 905–917. doi: 10.1097/AUD.0000000000000670
Jensen, A. R., and Rohwer, W. D. (1966). The Stroop color-word test: a review. Acta Psychol. 25, 36–93. doi: 10.1016/0001-6918(66)90004-7
Kaandorp, M. W., de Groot, A. M. B., Festen, J. M., Smits, C., and Goverts, S. T. (2015). The influence of lexical accessibility and vocabulary knowledge on measures of speech recognition in noise. Int. J. Audiol. 55, 157–167. doi: 10.3109/14992027.2015.1104735
Kelly, R., Tinnemore, A. R., Nguyen, N., and Goupell, M. J. (2025). On the difficulty of defining duration of deafness for adults with cochlear implants. Ear Hear. Adv. doi: 10.1097/AUD.0000000000001666
Kollmeier, B., and Wesselkamp, M. (1997). Development and evaluation of a German sentence test for objective and subjective speech intelligibility assessment. J. Acoust. Soc. Am. 102, 2412–2421. doi: 10.1121/1.419624
Kuhl, P. K. (2004). Early language acquisition: cracking the speech code. Nat. Rev. Neurosci. 5, 831–843. doi: 10.1038/nrn1533
Lenarz, M., Sönmez, H., Joseph, G., Büchner, A., and Lenarz, T. (2012). Long-term performance of cochlear implants in postlingually deafened adults. Otolaryngol. Head Neck Surg. 147, 112–118. doi: 10.1177/0194599812438041
Lenarz, T. (2018). Cochlear implant - state of the art. GMS Curr. Top. Otorhinolaryngol. Head Neck Surg. 16:Doc04. doi: 10.3205/cto000143
Liu, Y. W., Cheng, X., Chen, B., Peng, K., Ishiyama, A., and Fu, Q. J. (2018). Effect of tinnitus and duration of deafness on sound localization and speech recognition in noise in patients with single-sided deafness. Trends Hear. 22:2331216518813802. doi: 10.1177/2331216518813802
Long, C. J., Holden, T. A., McClelland, G. H., Parkinson, W. S., Shelton, C., Kelsall, D. C., et al. (2014). Examining the electro-neural interface of cochlear implant users using psychophysics, CT scans, and speech understanding. J. Assoc. Res. Otolaryngol. 15, 293–304. doi: 10.1007/s10162-013-0437-5
MacLeod, C. M., and Dunbar, K. (1988). Training and Stroop-like interference: evidence for a continuum of automaticity. J. Exp. Psychol. Learn. Mem. Cogn. 14, 126–135. doi: 10.1037/0278-7393.14.1.126
Marchman, V. A., and Fernald, A. (2008). Speed of word recognition and vocabulary knowledge in infancy predict cognitive and language outcomes in later childhood. Dev. Sci. 11, F9–F16. doi: 10.1111/j.1467-7687.2008.00671.x
Marslen-Wilson, W. D. (1987). Functional parallelism in spoken word-recognition. Cognition 25, 71–102. doi: 10.1016/0010-0277(87)90005-9
McAuliffe, M. J., Gibson, E. M., Kerr, S. E., Anderson, T., and LaShell, P. J. (2013). Vocabulary influences older and younger listeners' processing of dysarthric speech. J. Acoust. Soc. Am. 134, 1358–1368. doi: 10.1121/1.4812764
Mergl, R., Tigges, P., Schröter, A., Möller, H. J., and Hegerl, U. (1999). Digitized analysis of handwriting and drawing movements in healthy subjects: methods, results and perspectives. J. Neurosci. Methods 90, 157–169. doi: 10.1016/S0165-0270(99)00080-1
Mishra, S., Stenfelt, S., Lunner, T., Rönnberg, J., and Rudner, M. (2014). Cognitive spare capacity in older adults with hearing loss. Front. Aging Neurosci. 6:96. doi: 10.3389/fnagi.2014.00096
Moberly, A. C., Bates, C., Harris, M. S., and Pisoni, D. B. (2016). The enigma of poor performance by adults with cochlear implants. Otol. Neurotol. 37, 1522–1528. doi: 10.1097/MAO.0000000000001211
Peterson, G. E., and Lehiste, I. (1962). Revised CNC lists for auditory tests. J. Speech Hear. Disord. 27, 62–70. doi: 10.1044/jshd.2701.62
Pichora-Fuller, M. K. (2003). Processing speed and timing in aging adults: psychoacoustics, speech perception, and comprehension. Int. J. Audiol. 42(Suppl. 1), S59–S67. doi: 10.3109/14992020309074625
Pisoni, D. B., Kronenberger, W. G., Harris, M. S., and Moberly, A. C. (2018). Three challenges for future research on cochlear implants. World J. Otorhinolaryngol. Head Neck Surg. 3, 240–254. doi: 10.1016/j.wjorl.2017.12.010
Rönnberg, J., Lunner, T., Zekveld, A. A., Sörqvist, P., Danielson, H., Lyxell, B., et al. (2013). The ease of language understanding (ELU) model: theoretical, empirical, and clinical advances. Front. Syst. Neurosci. 7:31. doi: 10.3389/fnsys.2013.00031
Rudner, M., Lunner, T., Behrens, T., Thorén, E. S., and Rönnberg, J. (2012). Working memory capacity may influence perceived effort during aided speech recognition in noise. J. Am. Acad. Audiol. 23, 577–589. doi: 10.3766/jaaa.23.7.7
Rudner, M., and Signoret, C. (2016). The role of working memory and executive function in communication under adverse conditions. Front. Psychol. 7:148. doi: 10.3389/fpsyg.2016.00148
Salthouse, T. A. (1996). The processing-speed theory of adult age differences in cognition. Psychol. Rev. 103, 403–428. doi: 10.1037/0033-295X.103.3.403
Scarpina, F., and Tagini, S. (2017). The Stroop color and word test. Front. Psychol. 8:557. doi: 10.3389/fpsyg.2017.00557
Schvartz-Leyzac, K. C., Holden, T. A., Zwolan, T. A., Arts, H. A., Firszt, J. B., Buswinka, C. J., et al. (2020). Effects of electrode location on estimates of neural health in humans with cochlear implants. J. Assoc. Res. Otolaryngol. 21, 259–275. doi: 10.1007/s10162-020-00749-0
Shannon, R. V., Zeng, F. G., Kamath, V., Wygonski, J., and Ekelid, M. (1995). Speech recognition with primarily temporal cues. Science 270, 303–304. doi: 10.1126/science.270.5234.303
Smith, A. (1982). Symbol Digit Modalities Test (SDMT): Manual (Revised). Los Angeles, CA: Western Psychological Services.
Sommers, M. S., and Danielson, S. M. (1999). Inhibitory processes and spoken word recognition in young and older adults: the interaction of lexical competition and semantic context. Psychol. Aging 14, 458–472. doi: 10.1037/0882-7974.14.3.458
Stroop, J. R. (1935). Studies of interference in serial verbal reactions. J. Exp. Psychol. 18, 643–662. doi: 10.1037/h0054651
Tamati, T. N., Ray, C., Vasil, K. J., Pisoni, D. B., and Moberly, A. C. (2020). High- and low-performing adult cochlear implant users on high-variability sentence recognition: differences in auditory spectral resolution and neurocognitive functioning. J. Am. Acad. Audiol. 31, 324–335. doi: 10.3766/jaaa.18106
The MathWorks. (2019). MATLAB (R2019b). Available online at: https://www.mathworks.com/products/matlab.html [Accessed January 14, 2025].
Verhaeghen, P. (2003). Aging and vocabulary scores: a meta-analysis. Psychol. Aging 18, 332–339. doi: 10.1037/0882-7974.18.2.332
Verhaeghen, P., and Salthouse, T. A. (1997). Meta-analyses of age–cognition relations in adulthood: estimates of linear and nonlinear age effects and structural models. Psychol. Bull. 122, 231–249. doi: 10.1037/0033-2909.122.3.231
Vitevitch, M. S., and Luce, P. A. (1998). When words compete: levels of processing in perception of spoken words. Psychol. Sci. 9, 325–329. doi: 10.1111/1467-9280.00064
Völter, C., Oberländer, K., Carroll, R., Dazert, S., Lentz, B., Martin, R., et al. (2021). Nonauditory functions in low-performing adult cochlear implant users. Otol. Neurotol. 42, e543–e551. doi: 10.1097/MAO.0000000000003033
Völter, C., Oberländer, K., Haubitz, I., Carroll, R., Dazert, S., and Thomas, J. P. (2022). Poor performer: a distinct entity in cochlear implant users? Audiol. Neurootol. 27, 356–367. doi: 10.1159/000524107
Weber, A., and Scharenborg, O. (2012). Models of spoken-word recognition. WIREs Cogn. Sci. 3, 387–401. doi: 10.1002/wcs.1178
Werker, J. F., and Hensch, T. K. (2015). Critical periods in speech perception: new directions. Annu. Rev. Psychol. 66, 173–196. doi: 10.1146/annurev-psych-010814-015104
Zeitler, D. M., Sladen, D. P., DeJong, M. D., Torres, J. H., Dorman, M. F., and Carlson, M. L. (2019). Cochlear implantation for single-sided deafness in children and adolescents. Int. J. Pediatr. Otorhinolaryngol. 118, 128–133. doi: 10.1016/j.ijporl.2018.12.037
Zekveld, A. A., Deijen, J. B., Goverts, S. T., and Kramer, S. E. (2007). The relationship between nonverbal cognitive functions and hearing loss. J. Speech Lang. Hear. Res. 50, 74–82. doi: 10.1044/1092-4388(2007/006)
Keywords: cochlear implants, speech performance, Poor Performer, linguistic skills, neurocognitive functions
Citation: Buczak N, Kludt E, Lenarz T and Büchner A (2025) Beyond auditory sensitivity: cognitive and linguistic influences on clinical performance in post-lingual adult cochlear implant users. Front. Audiol. Otol. 3:1625799. doi: 10.3389/fauot.2025.1625799
Received: 09 May 2025; Accepted: 07 July 2025;
Published: 06 August 2025.
Edited by:
Ilona Anderson, MED-EL, AustriaReviewed by:
Kaibao Nie, University of Washington, United StatesEllen Andries, Antwerp University Hospital, Belgium
Copyright © 2025 Buczak, Kludt, Lenarz and Büchner. This is an open-access article distributed under the terms of the Creative Commons Attribution License (CC BY). The use, distribution or reproduction in other forums is permitted, provided the original author(s) and the copyright owner(s) are credited and that the original publication in this journal is cited, in accordance with accepted academic practice. No use, distribution or reproduction is permitted which does not comply with these terms.
*Correspondence: Nadine Buczak, QnVjemFrLm5hZGluZUBtaC1oYW5ub3Zlci5kZQ==