 Carlyn Murray1
 Hannah Guest1
 Garreth Prendergast1
 Kevin Munro1
 Rebecca Millman1
 Stephen A. Roberts2
 Karolina Kluk1
 Christopher J. Plack1,3*
- 1Manchester Centre for Audiology and Deafness, Manchester Academic Health Science Centre, The University of Manchester, Manchester, United Kingdom
- 2Centre for Biostatistics, The University of Manchester, Manchester, United Kingdom
- 3Department of Psychology, Lancaster University, Lancaster, United Kingdom
Noise exposure can induce temporary threshold shifts (TTS), typically assessed using pure-tone audiometry (PTA). The magnitude of TTS is influenced by noise attributes such as duration and intensity, but likely also by a number of personal factors influencing individual susceptibility. Most research on such factors has relied on experimentally induced TTS, which enables controlled exposures but cannot generate substantial TTS without raising ethical concerns. This study explored an alternative paradigm, measuring TTS in 51 young adults immediately after attending a noisy concert. Potential predictors included self-reported noise exposure in the weeks preceding the event, hypothesized to have a “conditioning” effect that mitigates TTS, as well as sex and skin tone, since female sex hormones and higher melanin levels may have otoprotective effects. Temporary auditory shifts were measured primarily using PTA at 3–6 kHz, with supplementary assessments via distortion-product otoacoustic emissions (DPOAEs), extended high-frequency (EHF) audiometry, and self-reported tinnitus. Pre-registered hypotheses predicted reduced TTS with higher prior noise exposure, female sex, and darker skin tones. Results revealed robust shifts in PTA, modest shifts in DPOAEs, and increased tinnitus reports, but no shifts in EHF measures. Regression analyses showed non-significant trends aligning with the conditioning noise and sex hypotheses, but not skin tone. The pre-and-post-concert paradigm proved effective, with high participant engagement and compliance during late-night testing. This methodology shows promise for future studies on TTS susceptibility, and recommendations are provided to refine its implementation.
1 Introduction
Exposure to loud sound can induce both temporary (TTS) and permanent (PTS) threshold shifts in humans and animals. The nature of the shifts depends on the level, duration, frequency content, and temporal pattern of the noise (Le Prell et al., 2012; Ryan et al., 2016). Occupational noise-exposure regulations (e.g., Health Safety Executive, 2005; National Institute for Occupational Safety and Health, 1998; Neitzel and Fligor, 2019) seek to constrain these parameters, yet are typically based on data from homogeneous cohorts—often male and Caucasian (National Institute for Occupational Safety and Health, 1998)—and apply “one-size-fits-all” limits. At the same time, recreational noise, especially loud music, has become a leading source of exposure (Dillard et al., 2022) and a growing public-health concern in youth (World Health Organization, 2022). As with occupational noise standards, public health guidelines may overlook meaningful inter-individual differences in vulnerability.
Evidence on individual susceptibility spans both laboratory and epidemiological studies in animals and humans, and encompasses both TTS and PTS outcomes. It is important to acknowledge that PTS carries the greatest long-term burden, and it remains unclear how well TTS susceptibility predicts permanent damage (Themann et al., 2015), so we must distinguish findings for these two endpoints. Across species and settings, three promising modulators emerge: prior sound “conditioning,” female sex, and higher melanin levels, all of which appear to mitigate both TTS and PTS, suggesting shared protective mechanisms.
Sound conditioning refers to the phenomenon whereby pre-exposure to moderate, non-traumatic noise reduces the cochlea's susceptibility to subsequent high-level noise trauma (Canlon et al., 1988), observed in chinchillas, rats, mice, guinea pigs, rabbits, and gerbils (Harrison et al., 2022). Researchers have recorded effects on TTS (Rajan and Johnstone, 1983), PTS (Kujawa and Liberman, 1997; Canlon and Fransson, 1998; Henselman et al., 1995), or both (Canlon et al., 1988; Pukkila et al., 1997; Campo et al., 1991). Proposed mechanisms include glucocorticoid production (Wang and Liberman, 2002; Tahera et al., 2007), apoptosis suppression (Niu et al., 2003), antioxidant upregulation (Jacono et al., 1998), F-actin modulation (Hu and Henderson, 1997), upregulation of heat-shock proteins (Yoshida et al., 1999; Zuo et al., 2008; Zhu et al., 2020), and protection against reactive nitrogen species (Alvarado et al., 2016). Only one published study has investigated the duration of conditioning effects, which persisted in chinchillas for at least 2 months (McFadden et al., 1997).
Human evidence derives from a small sample of listeners, reported initially by Miyakita et al. (1992; n = 8) and expanded by Barrenäs and Hellström (1996; n = 12). TTS was induced (using 105 dB SPL noise) on days 1, 2, 3, 4, 5, 7, 9, 11, 13, 17, 19, and 21. On days 5–13 (the “training period”), participants additionally underwent 6 h of conditioning exposure to music at 70 dBA. On days 14–16 (the “break”), they received neither traumatic noise nor conditioning noise. TTS magnitude reduced over days 5–13, then rose again. Results were interpreted as indicating a conditioning effect that decayed following the “training period”; however, the authors noted difficulty distinguishing “conditioning” from “toughening.” Niu and Canlon (2002) define conditioning as moderate-level, non-traumatic exposure, whereas toughening results from repeated high-level exposures, each one causing TTS. Because participants also experienced repeated trauma (which ceased during the break), the post-break TTS rebound may reflect loss of toughening rather than decay of conditioning. Indeed, TTS did not rise steadily over days 17–21, but decreased from 19 to 21, suggesting intertwined conditioning and toughening effects that the design could not disentangle.
Biological sex is a second likely determinant of hearing vulnerability. Premenopausal women generally exhibit more acute hearing than age-matched men (Aloufi et al., 2023). Although males may experience higher noise exposure—for example, to workplace noise (Eng et al., 2011)—Wang et al. (2021) found that high-frequency loss remained more prevalent in males even when industrial workers were matched for age, job role, and tenure. Similarly, Helfer (2011) reported greater hearing loss risk in male soldiers vs. similarly exposed females comrades. Extending findings to TTS, Kraaijenga et al. (2018) measured larger shifts among males than females at a music festival. Sex hormones likely contribute, since postmenopausal women undergo rapid hearing declines (Hederstierna et al., 2010) while estrogen replacement protects against TTS and PTS in animal models (Shuster et al., 2021).
Melanin, a free-radical scavenger present in cochlear tissues, offers another protective candidate. Rodent models generally show melanin reduces noise-induced damage (Ohlemiller and Gagnon, 2007; Murillo-Cuesta et al., 2010). In human epidemiological studies, darker skin tone serves as a non-invasive proxy for cochlear melanin, and is consistently associated with lower rates of hearing loss (Helzner et al., 2005; Agrawal et al., 2008; Lin et al., 2011). Black employees exposed to occupational noise have better hearing thresholds than white colleagues (Ishii and Talbott, 1998; Jerger et al., 1986). Factors related to race and ethnicity can complicate interpretation, but Lin et al. (2012) found that lighter skin tone was a risk factor for permanent hearing loss, independent of race and ethnicity. Similar results have been observed for TTS, which was found to be smaller in participants with darker pigmentation of the skin (Barrenäs and Lindgren, 1990) and eyes (Garber et al., 1982; Barrenäs and Lindgren, 1991).
In summary, female sex is likely associated with reduced risk of PTS, at least prior to menopause, but evidence in relation to TTS is more limited. Melanin generally appears protective against both PTS and TTS. The same is true of sound conditioning, but the human data are modest. Moreover, no studies have used sound conditioning resulting from real-world listening habits, as opposed to controlled exposures. It may be valuable to determine whether noise exposures encountered in day-to-day life are capable of conferring beneficial conditioning effects.
A related issue is that most human TTS research employs laboratory exposures to evoke TTS. While this ensures uniformity, it may raise ethical concerns, since seemingly temporary shifts may be accompanied by “hidden” permanent auditory damage (Harrison et al., 2022). Howgate and Plack (2011) therefore trialed an alternative approach, measuring TTS in attendees of noisy music events. Building on this work, the present study recruited only participants who had already purchased concert tickets, so that risk to hearing was not imposed by the research. The use of real-world exposures may also enhance the ecological validity of the work; in developed nations, noise exposure is increasingly from recreational sources, with amplified-music events a dominant source (Dillard et al., 2022).
The study aimed to test for factors that might influence the extent of TTS following noisy live-music events. It capitalized on the proximity of the University of Manchester hearing laboratories to a large live-popular-music venue, the Manchester Academy. The primary analysis tested whether noise exposure over the 10 weeks preceding the concert—a proxy for sound conditioning—predicted smaller TTS. Secondary analyses examined protective effects of female sex and darker skin tone (as a surrogate for cochlear melanin). We also sought to explore the magnitude of concert-induced TTS, the feasibility of the research paradigm, and potential alternative outcome measures: shifts in distortion-product otoacoustic emission (DPOAE) amplitudes, extended high-frequency (EHF) audiometric thresholds, and self-reported tinnitus.
2 Materials and methods
2.1 Registered protocol
A comprehensive study protocol was registered via the Open Science Framework (https://osf.io/7h5jm). At the time of registration, data had been gathered from the first 16 of 51 participants (this internal pilot phase allowed all procedures to be tested for feasibility, including the logistics of late-night test sessions and participant travel). The pilot data had not been analyzed in relation to our research questions, nor entered digitally in a form that would allow them to be analyzed.
All study methods and procedures presented below are consistent with the registered protocol, with the exception of the OAE-related hypothesis, which erroneously hypothesized a negative relation between past noise exposure and ΔOAE. To correct this typographic error, the hypothesis was reversed in our analysis and in the present publication.
2.2 Participants
Sixty-five young people aged 18 to 22 were recruited via posters and social media advertising. All had purchased tickets to a noisy concert occurring in 2021 at the Manchester Academy, and reported that they did not ever wear hearing protection to such concerts. Thirteen participants were excluded due to: excessive wax (n = 3), abnormal audiogram (n = 1), abnormal middle-ear function (n = 5), failure to attend session 2 (n = 2), or failure to commence session-2 testing within 45 min of the music ending (n = 2).
The remaining 52 exhibited normal otoscopic findings, pure-tone audiometric thresholds ≤ 20 dB HL at 0.25 to 8 kHz, and normal tympanometric results (compliance 0.3–1.6 cm3, pressure −50 to +50 daPa). Participants self-reported their skin tone using a six-point scale classifying skin by its reaction to summer sunlight (Fitzpatrick, 1988). For skin tone and other demographic data, see Table 1.
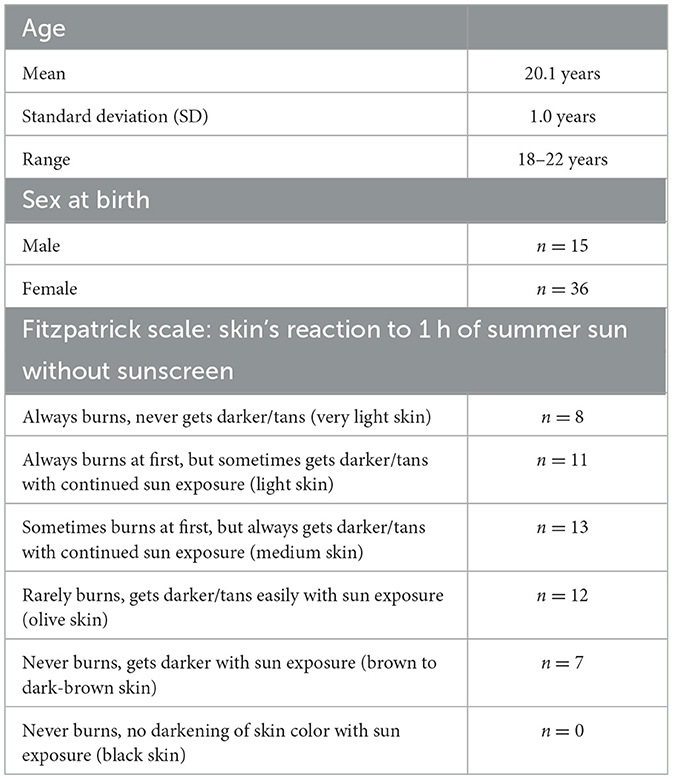
Table 1. Participant characteristics.
Of the 52 eligible participants who completed all testing, one participant was excluded from analysis and replaced by an additional recruit, due to a substantial improvement in EHF audiometric thresholds and otoacoustic emissions following concert exposure, possibly reflecting fluctuating hearing loss that was not detected at the screening stage. The pattern of results was not substantially altered by this exclusion (and note that results in relation to noise exposure and sex would have been strengthened slightly by inclusion of this participant). Data from the remaining 51 participants were analyzed. Though the study protocol proposed an evaluable sample size of 50, an additional one participant was recruited before study recruitment channels could be closed, and this participant was permitted to attend their follow-up test session and was included in the analyzed sample.
2.3 Test sessions
Each participant attended two test sessions: a baseline session in the days prior to a concert at the Manchester Academy, and a post-exposure session immediately after the concert (see also Section 2.11, “Timing of post-concert testing”). For the sake of convenience, the right ear was the test ear for the majority of participants. For eight participants, the left ear was substituted, due to presence of ear wax (n = 5), abnormal middle-ear function (n = 1), difficulty obtaining a tympanometric seal (n = 1), or piercings (n = 1) in the right ear. At the baseline session, care was taken to record the test ear and size of the best-fitting ear tip, to ensure consistency between sessions.
All procedures were approved by the Psychology, Communication, and Human Neuroscience Ethics Panel at the University of Manchester (reference 2022-12896-21954). All participants provided written informed consent for participation.
2.4 Pure-tone audiometry
Participants were seated in a double-walled sound-attenuating booth. At baseline, pure-tone air-conduction thresholds at 0.25, 0.5, 1, 2, 3, 4, 6, and 8 kHz were obtained from both ears in accordance with the recommended procedures of the British Society of Audiology (2018), using a GSI Arrow audiometer, TDH-39 supra-aural headphones, and MX41 cushions. At the follow-up session, thresholds were re-measured, only in the test ear and only at 3, 4, and 6 kHz, as these were the frequencies most likely to exhibit a TTS. The PTA threshold average was defined as the arithmetic mean of the thresholds at 3, 4, and 6 kHz. The pre-concert value of this measure was subtracted from the post-concert value to produce the PTA-shift outcome measure (ΔPTA).
2.5 Extended high-frequency audiometry
Participants were seated in a double-walled sound-attenuating booth. At both sessions, EHF audiometric thresholds were measured through Sennheiser HDA200 headphones for narrowband noise centered at 10.6 kHz (3-kHz bandwidth) and 14 kHz (4-kHz bandwidth). A three-interval, three-alternative, forced-choice procedure was employed, with four initial reversals (6 dB steps), six threshold reversals (2 dB steps), and a two-down one-up stepping rule. Threshold was defined as the arithmetic mean of the signal levels at the final six reversals. The EHF threshold average was defined as the arithmetic mean of the thresholds at 10.6 and 14 kHz. The pre-concert value of this measure was subtracted from the post-concert value to produce the EHF-threshold-shift outcome measure (ΔEHF).
2.6 Distortion-product otoacoustic emissions
DPOAE (2f1-f2) amplitudes were measured using the Mimosa HearID for f2 frequencies of 3–16 kHz (6 points per octave, f2/f1 = 1.2, L1 = 65 dB SPL, L2 = 55 dB SPL). The standard-frequency OAE amplitude average (in dB SPL) was defined as the arithmetic mean of the amplitudes across 3–6 kHz, while the EHF version was the arithmetic mean across 9–16 kHz. For each frequency region, the pre-concert value was subtracted from the post-concert value to produce the OAE-shift outcome measure (ΔOAE) and the EHF-OAE-shift outcome measure (ΔEHFOAE).
2.7 Tinnitus
The participant reported their tinnitus status pre-concert and post-concert, selecting from five ordinal response options: “No tinnitus,” “Quiet tinnitus,” “Moderate tinnitus,” “Loud tinnitus,” and “Very loud tinnitus.” The binary outcome measure used in logistic regression was calculated as follows. First, the concert-induced shift in tinnitus was calculated as the number of categories by which the participant's response was shifted from pre- to post-concert. For example, a change from “No tinnitus” to “Moderate tinnitus” was coded as a shift of “2.” Negative shifts were possible in principle, but none were evident in practice. To produce the binary tinnitus outcome measure (ΔTinnitus), participants were dichotomized into those whose shifts were > or ≤ the median for the cohort (n = 21 and n = 30, respectively).
2.8 Demographic characteristics
At the baseline session, the participant reported the Fitzpatrick skin tone category that best described their skin (Fitzpatrick, 1988) and their sex at birth (the “Demographic and Hearing Questionnaire” is available at https://osf.io/b5fp8/files/?view_only=b5a1d08453b04fc7b43a3ff4a18fc461). Since all participants reported their sex as male or female, sex was modeled as a binary variable. Skin tone was modeled as a linear term representing the numeric value on the 1–6 scale (1 representing the lightest skin tone category, 6 the darkest). The two resulting variables are denoted by Sex and SkinTone.
2.9 Noise exposure history
Participants completed two study-specific questionnaires providing retrospective estimates of noise exposure, based on the basic principles of the Noise Exposure Structured Interview (NESI; Guest et al., 2018), with methods adapted to suit questionnaire format. The two resulting questionnaires were the “Noise Exposure Table” (NET) and the “Noise Exposure Table: 10-week Exposure” (NET10), both available at https://osf.io/b5fp8/files/?view_only=b5a1d08453b04fc7b43a3ff4a18fc461. The former sought data on exposure over the lifetime, the latter over the 10 weeks leading up to the concert. Both recorded data on exposure to activities with an estimated sound level >80 dBA. For free-field activities, this was defined as environments requiring a raised voice to communicate, at a distance of four feet, to a normal-hearing listener without hearing protection. For earphone/headphone use, this was defined as a volume-control setting ≥70% of maximum volume. Data were also recorded on any unprotected exposures to firearm noise. Included exposure activities were noisy concerts/gigs, noisy bars/nightclubs, noisy music festivals, noisy sports matches, engine noise (e.g., motorbikes or motorsports), noisy music making (e.g., playing in a band), DIY noise (e.g., power tools or lawnmowers), earphone/headphone use, firearm exposure, and up to four other noisy activities identified by the participant. For free-field exposures, data were also sought on hearing protection: the proportion of exposures for which it was worn and the type of protector.
For all continuous-type exposures (i.e., all activities except firearm exposure), total duration of exposure was estimated by multiplying the number of exposures by the duration of a single exposure. For all continuous-type free-field exposures, the sound level was estimated based on the vocal effort required to communicate, at a distance of four feet, to a normal-hearing listener without hearing protection (Ferguson et al., 2019; Guest et al., 2018; Lutman et al., 2008). The need to “Raise your voice” corresponded to a level of 87 dBA, “Talk loudly” to 90 dBA, “Talk very loudly” to 93 dBA, “Shout” to 99 dBA, “Move closer and shout” to 105 dBA, and “Shout in ear” to 110 dBA. The attenuation provided by hearing protection was estimated based on the type of protector (Guest et al., 2018). For earphone/headphone exposure, sound level was estimated based on volume-control setting (Guest et al., 2018; Portnuff et al., 2011), with settings of 70%, 80%, 90%, and maximum volume corresponding to levels of 82, 88, 94, and 100 dBA, respectively.
For all continuous-type exposures (i.e., all activities except firearm exposure), duration and level were combined to yield noise units linearly related to energy of exposure, as in Guest et al. (2018). Note that the sound levels used in this calculation are adjusted for the estimated attenuation provided by hearing protection and weighted by the proportion of exposures for which it was worn. For firearm exposure, the impulsive nature of the noise requires an alternative approach, since combining data on level and duration does not provide a meaningful estimate of exposure energy. Hence, data were sought on the number of rounds fired and the type of firearm; from these were derived units of noise exposure comparable with the units calculated for continuous-type exposures (Guest et al., 2018). In practice, no participant reported firearm use in the NET10 (over the past 10 weeks), but three did so in the NET (over the lifetime). Finally, noise-exposure units from all activities were summed to yield a value linearly related to total energy of noise exposure over the period assessed by the questionnaire.
Noise exposure over the 10 weeks prior to the concert was the basis of the study's primary predictor variable, per the registered protocol. This was intended to reflect the finding that conditioning effects persist for at least 2 months (McFadden et al., 1997). Alternative noise metrics were possible, for example, incorporating exposure over the lifetime rather than the past 10 weeks, or quantifying duration rather than energy of exposure. The full dataset for the study is available at https://osf.io/b5fp8/files/?view_only=b5a1d08453b04fc7b43a3ff4a18fc461, should readers wish to explore alternative metrics.
Since energy-based measures are right-skewed, appropriate transforms were sought based on the observed distributions, in line with the registered protocol. For all raw measures of noise exposure (quantifying energy or duration, over 10 weeks or over the lifetime), the transform that yielded a normal distribution was the fourth root (see Figure 1). Hence, the measure of noise exposure used in the analyses reported below is fourth-root-transformed noise energy incurred over the past 10 weeks, denoted by Noise10week. Since some previous studies using energy-based self-report measures of noise exposure have used raw units or alternative transforms (e.g., Shehabi et al., 2023), the dataset at https://osf.io/b5fp8/files/?view_only=b5a1d08453b04fc7b43a3ff4a18fc461 also includes raw noise units.
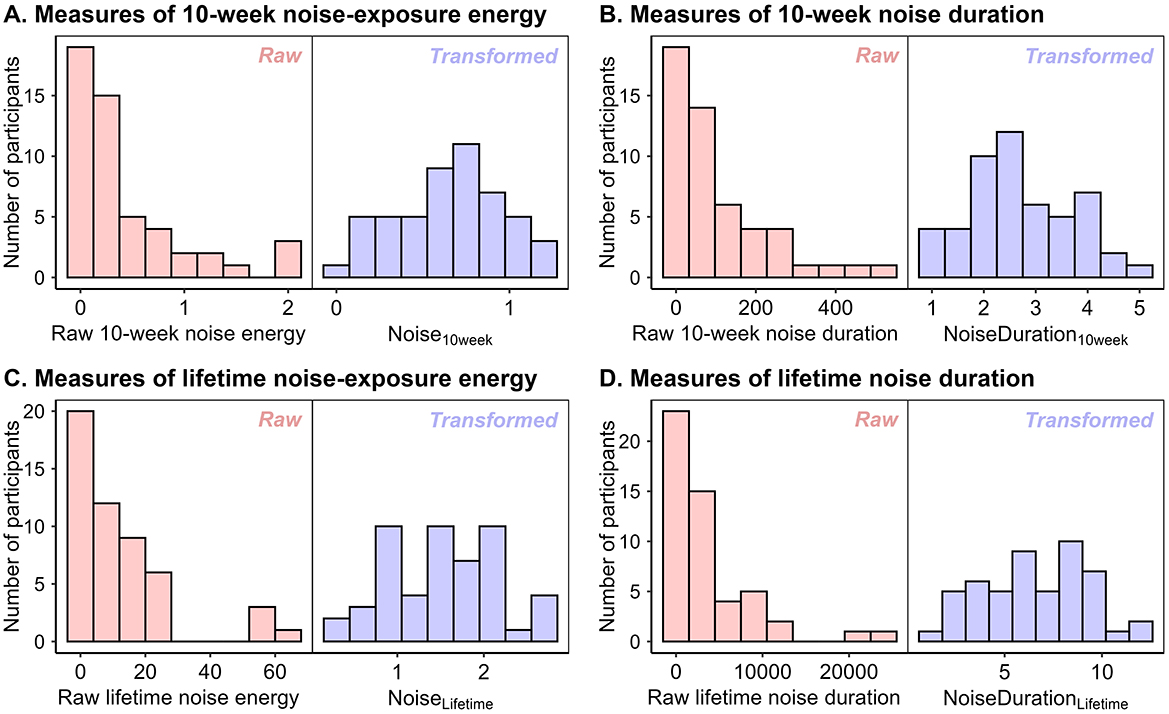
Figure 1. Measures of noise exposure before and after fourth-root transformation. (A) Noise exposure energy over the 10 weeks prior to the concert. (B) Duration of noise exposure over the 10 weeks prior to the concert. (C) Noise exposure energy over the lifetime. (D) Duration of noise exposure over the lifetime.
2.10 Concert noise exposure
At the final test session, participants estimated the duration of music exposure (i.e., concert length minus the pre-performance wait and any intervals) and the average sound level (using the NESI Speech Communication Table; Guest et al., 2018). As a supplementary measure, participants were asked if they were willing to take a 5 s recording of concert sound level (in dBA) using the Decibel X smartphone app (version 9.3.3, SkyPaw Co., Ltd., 2021). There were just 39 willing participants, of which 35 judged that the level they recorded was representative of the concert's average sound level. The subjective estimate of sound level, obtained from all participants, was combined with estimated music duration to yield the primary measure of concert noise exposure, using the same formula as in Section 2.9. Since this measure exhibited the same right skew as the measures of historical noise exposure, it was subjected to the same fourth-root transform; the resulting measure is denoted by Noiseconcert. The equivalent measure based on the smartphone measurements, available for 35 participants, can be accessed at https://osf.io/b5fp8/files/?view_only=b5a1d08453b04fc7b43a3ff4a18fc461.
2.11 Timing of post-concert testing
The concert venue is located <3 min walk from the hearing laboratory. At the final session, the delay (in minutes) between cessation of the music and commencement of follow-up testing was estimated as follows. When the music finished at the end of the concert, the participant sent a text message to the researcher to inform them of this. The researcher met the participant at the building entrance and immediately obtained an estimate of how many minutes had passed since the music stopped. If there was any discrepancy between this estimate and the time at which the participant had sent the text message, the participant was questioned further to clarify the duration of the delay. The median value was 9 min, and values were within 15 min for 88% of participants. Since TTS decays approximately exponentially (Carder and Miller, 1972), the delay value was log-transformed for use in the analysis models, per the registered protocol. The resulting variable is denoted by TestingDelay.
2.12 Analysis
Data were analyzed using R Version 4.2.2 (R Core Team, 2022). The primary analysis tested for an association between Noise10week and ΔPTA. Exploratory analyses investigated demographic characteristics that might influence susceptibility to threshold shift, by adding Sex and SkinTone as covariates. Additional exploratory analyses substituted ΔOAE and ΔTinnitus as alternative outcome measures, in place of ΔPTA (results are reported in the Supplementary material). Note that analyses using ΔEHF and ΔEHFOAE were not conducted, since auditory shifts were not evident in this frequency range.
All hypotheses were tested using multiple linear regression models implemented via the “lm” function, with the exception of the secondary analysis with ΔTinnitus as its outcome variable, which employed analogous multiple logistic regression models implemented via “glm.” The basic model (used in the primary analysis) was:
Noise10week was the predictor of interest, hypothesized to exhibit a negative relation to ΔPTA. Noiseconcert and TestingDelay were covariates of no interest, included in the model because higher-energy concerts might lead to larger ΔPTA and longer delays before testing should lead to decays in ΔPTA.
To test for effects of demographic characteristics on ΔPTA, the Sex and SkinTone variables were subsequently added to the regression models, in line with the registered protocol.
Assumptions of linearity, homoscedasticity, independence of errors, and freedom from multicollinearity were confirmed for all models. Normality of residuals was assessed via Q-Q plots, which revealed that most residuals aligned with the expected normal distribution, with the exception of three potential outliers in the right tail. Calculation of Cook's distances (<0.25 for all observations and models) indicated that none of the three exerted excessive influence on results. By way of confirmation, reanalysis with the three potential outliers removed did not alter the pattern of results from those reported here.
3 Results
3.1 Auditory shifts
Figure 2 presents the pre-concert and post-concert auditory measurements. It is clear that PTA (averaged across 3–6 kHz) exhibited the most robust shifts. The shift in PTA thresholds was significant, as assessed by a paired-samples t-test (mean = 12.5 dB, SD = 7.8 dB, p < 0.00001). OAE amplitudes in the same frequency range exhibited smaller but still significant shifts (mean = −2.7 dB, SD = 3.4 dB, p < 0.00001). No significant shifts were observed in EHF audiometric thresholds (p = 0.15) or EHF OAEs (p = 0.79).
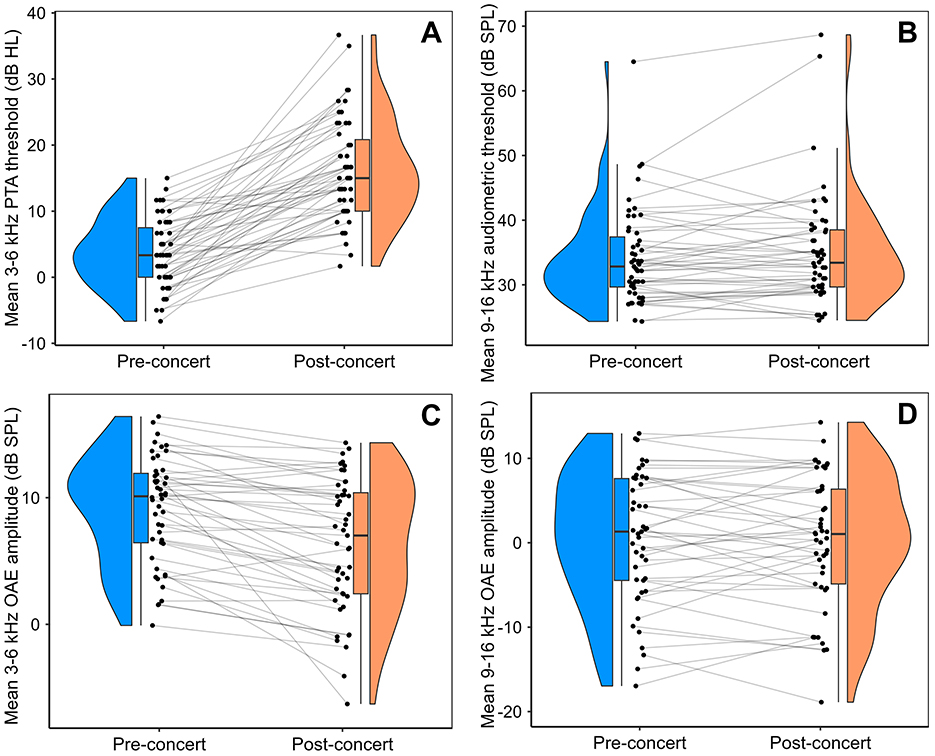
Figure 2. Raincloud plots presenting the pre- and post-concert auditory measures. PTA thresholds and OAE amplitudes underwent highly significant shifts, while equivalent measures in the EHF range did not. (A) PTA thresholds (mean of 3–6 kHz). (B) EHF audiometric thresholds (mean of 10.6 and 14 kHz). (C) OAE amplitudes (mean of 3–6 kHz). (D) EHFOAE amplitudes (mean of 9–16 kHz).
Figure 3 presents self-reported tinnitus data at the two timepoints. The number of participants reporting tinnitus increased from four (before the concert) to 42 (after the concert). Most reported a one-category or two-category increase in tinnitus; a minority reported larger increases.
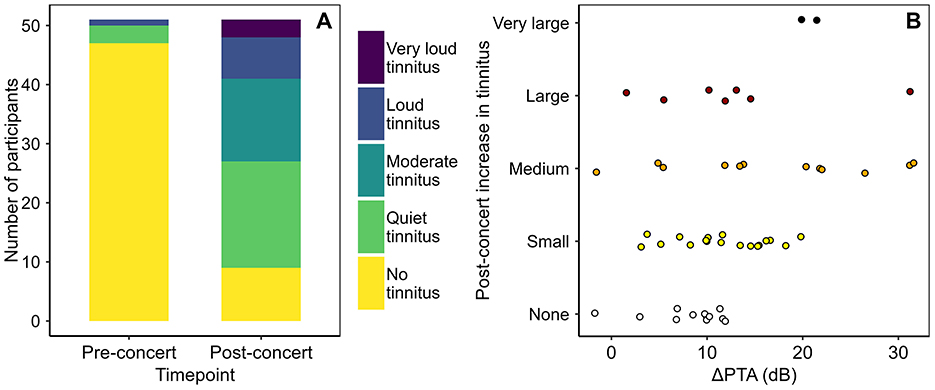
Figure 3. (A) Self-reported tinnitus scores, pre- and post-concert. (B) Relation between post-concert increases in PTA and tinnitus. Note that on the y-axis, increases in tinnitus described as “small,” “medium,” “large,” and “very large” denote, respectively, increases of one, two, three, and four tinnitus loudness categories.
Analyses with ΔPTA as the outcome measure are reported in the main text. Analogous models using ΔOAE and ΔTinnitus are reported in the Supplementary material.
3.2 Relations to past noise exposure
Figure 4 plots the primary outcome, ΔPTA, vs. the primary predictor, Noise10week. Results of the multiple linear regression models are presented in Table 2. The first row represents the primary model, with a single predictor of interest: Noise10week. The second adds in the demographic variables, Sex and SkinTone.
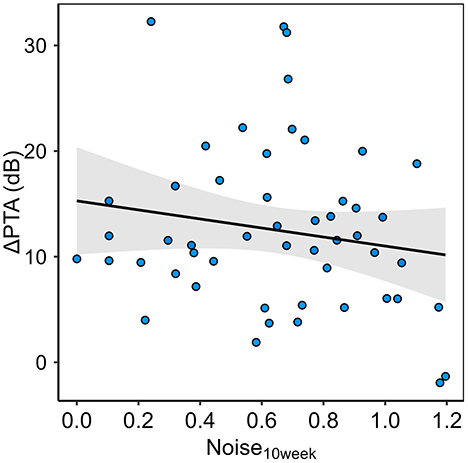
Figure 4. The study's primary outcome variable, ΔPTA, plotted in relation to the primary predictor variable, Noise10week.
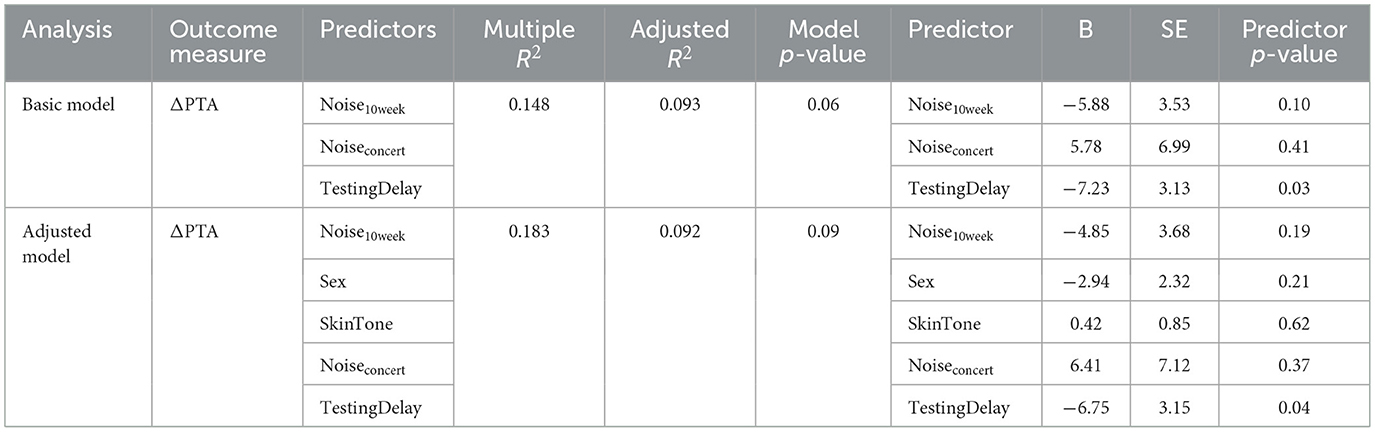
Table 2. Results of multiple linear regression models.
The linear association between Noise10week and ΔPTA did not reach statistical significance but trended in the predicted direction: each one-unit increase in Noise10week was associated with a 5.88 dB decrease in ΔPTA (SE = 3.53, p = 0.10, two-tailed). Over the range of exposures observed in our sample (~0 to 1.2), this corresponds to an approximate 7 dB reduction in ΔPTA from the least- to the most-exposed participants. Removing Noise10week from the primary model also reduced the adjusted R2 from 0.093 to 0.060, suggesting a modest contribution of this variable to the model's explanatory power, but the associated F-test did not reach significance (p = 0.10), indicating that the observed contribution might not be reliable.
3.3 Relations to sex
Figure 5A plots the primary outcome, ΔPTA, vs. Sex. In multiple linear regression, females exhibited mean TTS that was 2.94 dB lower than that of males, after controlling for covariates, but the effect failed to reach the nominal significance level (SE = 2.32, p = 0.21, two-tailed). Removing Sex from the analysis reduced the adjusted R2 from 0.092 to 0.080, consistent with a small contribution to the model's explanatory power, but the associated F-test was not statistically significant (p = 0.22).
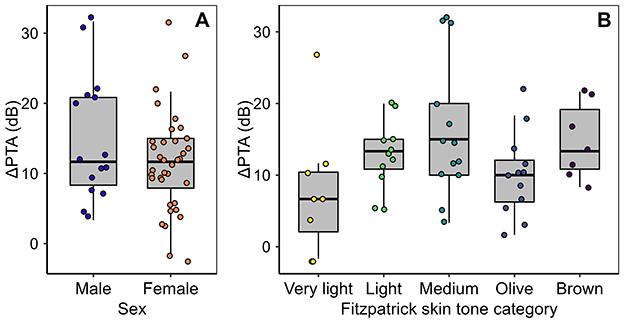
Figure 5. The study's primary outcome variable, ΔPTA, plotted in relation to the two demographic predictor variables, Sex (A) and SkinTone (B).
3.4 Relations to skin tone
Figure 5B plots the primary outcome, ΔPTA, vs. SkinTone. Contrary to our hypothesis, darker skin did not appear protective; no significant effect was observed, and each one-category shift toward darker skin corresponded to a 0.4 dB increase in ΔPTA (SE = 0.85 dB, p = 0.62, two-tailed). Adding SkinTone to the model also reduced the adjusted R2.
4 Discussion
4.1 Temporary auditory shifts
Results suggest that conventional PTA-based measures are preferable to those based on OAEs (and far superior to EHF measures), for the purposes of investigating individual differences in susceptibility to temporary noise-induced auditory shifts. Shifts in PTA were substantial while OAE shifts were more modest, consistent with the findings reviewed by Marshall et al. (2001). EHF shifts—both audiometric and OAE—were negligible. There is growing evidence that EHF audiometry may be sensitive to the early signs of permanent NIHL (Mehrparvar et al., 2014; Schmuziger et al., 2007) but the present study reveals no such sensitivity to the temporary effects of noise exposure.
Compared with previous studies of TTS caused by real-world noise exposures, our ΔPTA values were similar to those measured in the last two decades (Kim et al., 2005; Howgate and Plack, 2011) but lower than those measured earlier (15–37 dB; Axelsson and Lindgren, 1978; Drake-Lee, 1992; Jerger and Jerger, 1970; Rupp and Koch, 1969; Tin and Lim, 2000; Ulrich and Pinheiro, 1974). Stricter noise-control regulations and greater awareness of the dangers of excessive noise in recent years may explain the trend for lower TTS over time. Mean ΔOAE was −2.75 dB, which is comparable with Iliadou et al. (2024) but smaller than some earlier studies reporting ΔOAE after loud music exposure (Kim et al., 2005; Vinck et al., 1999).
There were robust effects of concert exposure on tinnitus, with most participants reporting an increase in tinnitus following the concert and none reporting a decrease. Formal analysis of the relationship between ΔPTA and ΔTinnitus was not conducted, but data visualization suggests that large PTA shifts (>20 dB) were sufficient but not necessary for large shifts in tinnitus (see Figure 3B).
4.2 Effects of prior “conditioning” noise exposure
As discussed in the Background, extensive animal data support protective effects of sound conditioning. Direct exploration of conditioning effects in humans was conducted by Miyakita et al. (1992). Findings indicated that 6 h of daily exposure to music at 70 dB SPL lessened the TTS induced by subsequent traumatic exposures (effect size ~6–8 dB at 3–5 kHz), though toughening of the cochlea by repeated traumatic exposures may also have played a role. The present study design was based on the notion that individuals with limited day-to-day exposure might face heightened risk when encountering a one-off high-intensity event like a loud concert.
The current analysis revealed a non-significant trend toward smaller TTS in individuals with higher energy of noise exposure over the preceding 10 weeks (p = 0.10, two-tailed). When extrapolated across the observed Noise10week range (~0 to 1.2), this trend corresponds to an estimated 7 dB reduction in ΔPTA from the least- to the most-exposed participants. Although our pre-registered hypothesis was directional, we opted for a two-tailed test to maintain a conservative approach; had we used a one-tailed test, the result would have approached statistical significance.
Of course, this non-significant trend may simply reflect sampling variability rather than a true conditioning effect. Nonetheless, several alternative explanations warrant consideration, particularly given issues of statistical power and reliance on self-report exposure data (see Section 4.4 below).
4.3 Effects of sex and skin tone
The study's results in relation to skin tone do not support protective effects of melanin on susceptibility to TTS, despite prior evidence in both animals and humans. Indeed, darker skin tone corresponded to greater TTS, on average, though results were non-significant. Of course, the predictor variable was not a direct measure of cochlear melanin, and the study instead relied on a proxy: a potentially less accurate self-report measure of skin tone. However, this proxy measure, assessing the skin's reaction to sun exposure, exhibits good internal consistency and construct validity (Fasugba et al., 2014) and has previously been shown to relate to human susceptibility to TTS (Barrenäs and Lindgren, 1990) and PTS (Lin et al., 2012).
Results in relation to sex were more consistent with pre-registered hypotheses. Females exhibited, on average, roughly 3 dB smaller TTS than males—a meaningful difference, given the cohort's mean TTS of 12.5 dB. However, as with the conditioning effect discussed above, this sex effect fell short of statistical significance. As with the conditioning trend, it remains unclear whether this pattern reflects genuinely heightened susceptibility in males or merely sampling variability compounded by limited power and measurement imprecision (see Section 4.4 below).
4.4 Study limitations and solutions
Results of the study should be interpreted in light of a number of methodological limitations. Foremost is statistical power. Trends were observed in the expected directions in relation to sex and prior noise exposure, but these did not achieve statistical significance. Post hoc power analysis indicates that a sample size of ~200 would be sufficient to detect either effect with 80% power at an alpha of 0.05, if the effect is of the magnitude observed in the present study and the range of noise exposures similar to those reported here.
Undermining the effective power of the study was variability in the energy of concert noise exposures, adding “noise” to the TTS data. Unlike controlled animal models where noise exposure can be manipulated precisely, TTS in our study was driven by a range of concert exposures, varying in level and duration. This variability was likely driven not only by differences in output levels of venue loudspeakers, but also distance of the listener from the loudspeakers and room acoustics (none of which were measured in the present study). Self-report data on concert level and duration were combined into estimates of concert noise-exposure energy, included in the analysis model to control for these nuisance factors. In practice, our self-reports of these parameters were likely too imprecise to fully statistically control. In regression terms, this inflated the error term and attenuated the effects of conditioning noise exposure and sex (biasing them toward zero), which in turn reduced the effective power.
If the current research paradigm, using a range of noisy events, is to be applied usefully in future, it might benefit from more sensitive techniques to measure event noise exposure. High-quality dosimeters represent the gold standard, but are cumbersome. The smartphone app used in the present study was convenient but resulting estimates of concert noise-exposure energy did not relate to TTS, perhaps due to insufficiency of a brief measurement and/or measurement inaccuracy at very high sound levels. Future technological advances may offer effective alternatives, such as smart watches or ear-level wearables with dosimetry capability.
Another potential approach would be to use more uniform exposures across the study sample. An experimental approach, whereby TTS is induced through controlled lab exposure, is feasible (Iliadou et al., 2024) but is accompanied by ethical concerns (Harrison et al., 2022). An approach closer to that of the present study would be recruitment of individuals with tickets to a single large music event, for example, a stadium concert. Since this might render in-person measurement of TTS infeasible, smartphone measurements of hearing thresholds before and after the concert might represent a workable approach. Though smartphone measurements of absolute audiometric thresholds are plagued by calibration issues (Almufarrij et al., 2023), measurement of audiometric changes might be more tractable.
Challenges in the measurement of noise exposure are even greater for conditioning exposures occurring over the weeks prior to the TTS-inducing event. The self-report instrument used to quantify prior noise exposure was the NET10, which recorded estimates of the level and duration of exposure to various noisy activities in the 10 weeks leading up to the concert. Retrospective self-report estimates of cumulative noise exposure are problematic, due to limitations of recall (Sallis and Saelens, 2000). The NESI (Guest et al., 2018), on which the NET10 was based, has been shown to produce estimates of noise exposure that correlate with tinnitus (Guest et al., 2017) and speech-in-noise ability (Shehabi et al., 2023), but inaccuracy remains a concern.
A further potential limitation is the choice of timeframe across which to assess the conditioning noise exposure. The use of a 10-week period was based on the sole study investigating persistence of conditioning effects, which used a chinchilla model (McFadden et al., 1997). Conditioning effects may decay more rapidly (or persist longer) in humans, rendering our primary noise metric suboptimal.
A final issue with quantification of conditioning noise exposure is that real-world exposures vary in both level and duration (as well as frequency content, kurtosis, and other parameters). This is in contrast with experimentally applied sound conditioning, which is more uniform, both between and within subjects. We elected to quantify energy of exposure to noisy activities (>80 dBA), regardless of the level, duration, timing, and other features of the constituent exposures; this metric may not adequately represent the conditioning effects of noise. It may also be that noise >80 dBA is not as effective in conditioning the cochlea as noise at higher or lower levels. Relatedly, it is important to bear in mind Niu and Canlon's (2002) distinction between sound conditioning (induced by low-level, non-damaging noise) and toughening (a consequence of repeated TTS). Our use of an energy-based metric means that our “conditioning” measure may actually encompass toughening, further complicating the interpretation of results.
In summary, our self-report measure of conditioning noise exposure may have focused on an exposure period that was too long or too short, on noise levels that were too high or too low, on sound energy rather than alternative metrics, or been invalidated by recall failure. One approach avoiding these pitfalls may be an experimental approach, randomizing participants to groups with different prescribed conditioning levels, for example, heavy use vs. non-use of headphones/earphones in the days prior to the exposure event (as in Miyakita et al., 1992). Another option might be to exploit the existing capabilities of commonly owned smartphones, as some devices store extensive personal data on music listening.
4.5 Feasibility of TTS research using ecologically occurring noise exposures
The opportunity to measure substantial TTS without inducing it experimentally makes the present study's approach potentially valuable, if challenges in the measurement and control of noise exposure (Section 4.4) can be addressed effectively. The willingness of young concert attendees to participate, despite the inconvenience of post-concert testing, is encouraging. Late-night sessions proceeded uneventfully. Most participants found the premise of the study engaging, and were enthusiastic to see their results. Finding ways to capitalize on this enthusiasm, in order to yield similar data on a larger scale, seems a potentially fruitful and ethical approach to TTS research in humans.
5 Conclusions
Our results revealed substantial temporary shifts in pure-tone thresholds, modest OAE shifts, and negligible effects at extended high frequencies. We also found non-significant trends in line with our pre-registered hypotheses—namely, a protective “conditioning” effect of prior noise exposure and smaller TTS in females—which may represent true physiological differences or simply residual variability and measurement error. Future research with enhanced statistical power could verify these effects and provide opportunities to test additional factors.
The present work highlights both the promise and the hurdles of using naturally occurring noise events to probe individual vulnerability. Crucially, recruiting concertgoers for TTS testing proved ethical, acceptable, and engaging. This paradigm could be advanced by refining exposure quantification (via wearable dosimeters, standardized event sampling, or enhanced self-report) and bolstering sample sizes. Our view is that exploring innovative research designs in this field is worthwhile, if we are to move beyond generalized noise regulations and public health advice and pave the way for targeted interventions tailored to those most at risk.
Data availability statement
The raw data supporting the conclusions of this article will be made available by the authors, without undue reservation.
Ethics statement
The studies involving humans were approved by the Psychology, Communication, and Human Neuroscience Ethics Panel at the University of Manchester. The studies were conducted in accordance with the local legislation and institutional requirements. The participants provided their written informed consent to participate in this study.
Author contributions
CM: Data curation, Writing – original draft, Methodology, Investigation, Writing – review & editing, Formal analysis. HG: Resources, Formal analysis, Methodology, Visualization, Investigation, Writing – review & editing, Supervision. GP: Supervision, Writing – review & editing, Conceptualization, Funding acquisition, Resources, Project administration. KM: Funding acquisition, Supervision, Writing – review & editing, Conceptualization. RM: Funding acquisition, Supervision, Conceptualization, Writing – review & editing. SR: Conceptualization, Writing – review & editing, Methodology, Formal analysis. KK: Writing – review & editing, Supervision, Conceptualization, Funding acquisition. CP: Formal analysis, Resources, Writing – review & editing, Methodology, Conceptualization, Supervision, Project administration, Funding acquisition.
Funding
The author(s) declare that financial support was received for the research and/or publication of this article. This work was funded by the Medical Research Council (MR/V01272X/1) and supported by the National Institute for Health and Care Research (NIHR) Manchester Biomedical Research Centre (NIHR203308).
Acknowledgments
We owe profound thanks to music venue the Manchester Academy for their essential support in promoting the study to concert attendees.
Conflict of interest
The authors declare that the research was conducted in the absence of any commercial or financial relationships that could be construed as a potential conflict of interest.
The author(s) declared that they were an editorial board member of Frontiers, at the time of submission. This had no impact on the peer review process and the final decision.
Generative AI statement
The author(s) declare that no Gen AI was used in the creation of this manuscript.
Any alternative text (alt text) provided alongside figures in this article has been generated by Frontiers with the support of artificial intelligence and reasonable efforts have been made to ensure accuracy, including review by the authors wherever possible. If you identify any issues, please contact us.
Publisher's note
All claims expressed in this article are solely those of the authors and do not necessarily represent those of their affiliated organizations, or those of the publisher, the editors and the reviewers. Any product that may be evaluated in this article, or claim that may be made by its manufacturer, is not guaranteed or endorsed by the publisher.
Author disclaimer
The views expressed are those of the authors and not necessarily those of the NIHR or the Department of Health and Social Care.
Supplementary material
The Supplementary Material for this article can be found online at: https://www.frontiersin.org/articles/10.3389/fauot.2025.1635615/full#supplementary-material
Abbreviations
DPOAE, distortion-product otoacoustic emission; EHF, extended high frequency; NET, Noise Exposure Table; NET10, Noise Exposure Table (Past 10 Weeks); OAE, otoacoustic emission; PTA, pure-tone audiometry; PTS, permanent threshold shift; SD, standard deviation; TTS, temporary threshold shift.
References
Agrawal, Y., Platz, E. A., and Niparko, J. K. (2008). Prevalence of hearing loss and differences by demographic characteristics among US adults: data from the National Health and Nutrition Examination Survey, 1999-2004. Arch. Intern. Med. 168, 1522–1530. doi: 10.1001/archinte.168.14.1522
Almufarrij, I., Dillon, H., Dawes, P., Moore, D. R., Yeung, W., Charalambous, A. P., et al. (2023). Web- and app-based tools for remote hearing assessment: a scoping review. Int. J. Audiol. 62, 699–712. doi: 10.1080/14992027.2022.2075798
Aloufi, N., Heinrich, A., Marshall, K., and Kluk, K. (2023). Sex differences and the effect of female sex hormones on auditory function: a systematic review. Front. Hum. Neurosci. 17:1077409. doi: 10.3389/fnhum.2023.1077409
Alvarado, J., Fuentes-Santamaría, V., Gabaldón-Ull, M., Jareño-Flores, T., Miller, J., and Juiz, J. (2016). Noise-induced “toughening” effect in Wistar rats: enhanced auditory brainstem responses are related to calretinin and nitric oxide synthase upregulation. Front. Neuroanat. 10:91. doi: 10.3389/fnana.2016.00019
Axelsson, A., and Lindgren, F. (1978). Temporary threshold shift after exposure to pop music. Scand. Audiol. 7, 127–135. doi: 10.3109/01050397809076279
Barrenäs, M. L., and Hellström, P. A. (1996). The effect of low level acoustic stimulation on susceptibility to noise in blue- and brown-eyed young human subjects. Ear Hear. 17, 63–68. doi: 10.1097/00003446-199602000-00008
Barrenäs, M. L., and Lindgren, F. (1990). The influence of inner ear melanin on susceptibility to TTS in humans. Scand. Audiol. 19, 97–102. doi: 10.3109/01050399009070759
Barrenäs, M. L., and Lindgren, F. (1991). The influence of eye colour on susceptibility to TTS in humans. Br. J. Audiol. 25, 303–307. doi: 10.3109/03005369109076602
British Society of Audiology (2018). Recommended procedure: pure-tone air-conduction and bone-conduction threshold audiometry with and without masking. Available online at: https://www.thebsa.org.uk/guidance-and-resources/current-guidance/ (Accessed January 2025).
Campo, P., Subramaniam, M., and Henderson, D. (1991). The effect of ‘conditioning' exposures on hearing loss from traumatic exposure. Hear. Res. 55, 195–200. doi: 10.1016/0378-5955(91)90104-H
Canlon, B., Borg, E., and Flock, Å. (1988). Protection against noise trauma by pre-exposure to a low level acoustic stimulus. Hear. Res. 34, 197–200. doi: 10.1016/0378-5955(88)90107-4
Canlon, B., and Fransson, A. (1998). Reducing noise damage by using a mid-frequency sound conditioning stimulus. Neuroreport 9, 269–270. doi: 10.1097/00001756-199801260-00017
Carder, H. M., and Miller, J. D. (1972). Temporary threshold shifts from prolonged exposure to noise. J. Speech Hear. Res. 15, 603–623. doi: 10.1044/jshr.1503.603
Dillard, L. K., Arunda, M. O., Lopez-Perez, L., Martinez, R. X., Jiménez, L., and Chadha, S. (2022). Prevalence and global estimates of unsafe listening practices in adolescents and young adults: a systematic review and meta-analysis. BMJ Global Health 7:e010501. doi: 10.1136/bmjgh-2022-010501
Drake-Lee, A. B. (1992). Beyond music: auditory temporary threshold shift in rock musicians after a heavy metal concert. J. Royal Soc. Med. 85, 617–619. doi: 10.1177/014107689208501010
Eng, A., 't Mannetje, A., McLean, D., Ellison-Loschmann, L., Cheng, S., and Pearce, N. (2011). Gender differences in occupational exposure patterns. Occup. Environ. Med. 68, 888–894. doi: 10.1136/oem.2010.064097
Fasugba, O., Gardner, A., and Smyth, W. (2014). The Fitzpatrick skin type scale: a reliability and validity study in women undergoing radiation therapy for breast cancer. J. Wound Care 23, 358, 360–362, 364. doi: 10.12968/jowc.2014.23.7.358
Ferguson, M. A., Tomlinson, K. B., Davis, A. C., and Lutman, M. E. (2019). A simple method to estimate noise levels in the workplace based on self-reported speech communication effort in noise. Int. J. Audiol. 58, 450–453. doi: 10.1080/14992027.2019.1600203
Fitzpatrick, T. B. (1988). The validity and practicality of sun-reactive skin types I through VI. Arch. Dermatol. 124, 869–871. doi: 10.1001/archderm.1988.01670060015008
Garber, S. R., Turner, C. W., Creel, D., and Witkop Jr, C. J. (1982). Auditory system abnormalities in human albinos. Ear Hear. 3, 207–210. doi: 10.1097/00003446-198207000-00004
Guest, H., Dewey, R. S., Plack, C. J., Couth, S., Prendergast, G., Bakay, W., et al. (2018). The Noise Exposure Structured Interview (NESI): an instrument for the comprehensive estimation of lifetime noise exposure. Trends Hear. 22:2331216518803213. doi: 10.1177/2331216518803213
Guest, H., Munro, K. J., Prendergast, G., Howe, S., and Plack, C. J. (2017). Tinnitus with a normal audiogram: relation to noise exposure but no evidence for cochlear synaptopathy. Hear. Res. 344, 265–274. doi: 10.1016/j.heares.2016.12.002
Harrison, R. T., DeBacker, J. R., Trevino, M., Bielefeld, E. C., and Lobarinas, E. (2022). Cochlear preconditioning as a modulator of susceptibility to hearing loss. Antioxidants Redox Signal. 36, 1215–1228. doi: 10.1089/ars.2021.0055
Hederstierna, C., Hultcrantz, M., Collins, A., and Rosenhall, U. (2010). The menopause triggers hearing decline in healthy women. Hear. Res. 259, 31–35. doi: 10.1016/j.heares.2009.09.009
Helfer, T. M. (2011). Noise-induced hearing injuries, active component, U.S. Armed Forces, 2007-2010. MSMR 18, 7–10.
Helzner, E., Cauley, J., Pratt, S., Wisniewski, S., Zmuda, J., Talbott, E., et al. (2005). Race and sex differences in age-related hearing loss: the health, aging and body composition study. J. Am. Geriatr. Soc. 53, 2119–2127. doi: 10.1111/j.1532-5415.2005.00525.x
Henselman, L., Henderson, D., Subramaniam, M., Hofstetter, P., and Sallustio, V. (1995). Effect of “conditioning” on hearing loss from military noise exposures. J. Acoust. Soc. Am. 97, 3343–3344. doi: 10.1121/1.412754
Howgate, S., and Plack, C. J. (2011). A behavioral measure of the cochlear changes underlying temporary threshold shifts. Hear. Res. 277, 78–87. doi: 10.1016/j.heares.2011.03.009
Hu, B. H., and Henderson, D. (1997). Changes in F-actin labeling in the outer hair cell and the Deiters cell in the chinchilla cochlea following noise exposure. Hear. Res. 110, 209–218. doi: 10.1016/S0378-5955(97)00075-0
Iliadou, E., Pastiadis, K., Dimitriadis, D., Plack, C. J., and Bibas, A. (2024). Development and validation of an efficient and Safe Loud Music Exposure Paradigm. J. Speech Lang. Hear. Res. 67, 668–679. doi: 10.1044/2023_JSLHR-23-00332
Ishii, E. K., and Talbott, E. O. (1998). Race/ethnicity differences in the prevalence of noise-induced hearing loss in a group of metal fabricating workers. J. Occup. Environ. Med. 40, 661–666. doi: 10.1097/00043764-199808000-00001
Jacono, A., Hu, B., Kopke, R., Henderson, D., Water, T., and Steinman, H. (1998). Changes in cochlear antioxidant enzyme activity after sound conditioning and noise exposure in the chinchilla. Hear. Res. 117, 31–38. doi: 10.1016/S0378-5955(97)00214-1
Jerger, J., and Jerger, S. (1970). Temporary threshold shift in rock-and-roll musicians. J. Speech Hear. Res. 13, 221–224. doi: 10.1044/jshr.1301.221
Jerger, J., Jerger, S., Pepe, P., and Miller, R. (1986). Race difference in susceptibility to noise-induced hearing loss. Am. J. Otol. 7, 425–429.
Kim, J. S., Nam, E., and Park, S. I. (2005). Electrocochleography is more sensitive than distortion-product otoacoustic emission test for detecting noise-induced temporary threshold shift. Otolaryngol. Head Neck Surg. 133, 619–624. doi: 10.1016/j.otohns.2005.06.012
Kraaijenga, V. J. C., Munster, J. J. S. A., and Zanten, G. A. (2018). Association of behavior with noise-induced hearing loss among attendees of an outdoor music festival. JAMA Otolaryngology–Head and Neck Surgery 144, 490. doi: 10.1001/jamaoto.2018.0272
Kujawa, S. G., and Liberman, M. C. (1997). Conditioning-related protection from acoustic injury: effects of chronic deefferentation and sham surgery. J. Neurophysiol. 78, 3095–3106. doi: 10.1152/jn.1997.78.6.3095
Le Prell, C. G., Henderson, D., Fay, R. R., and Popper, A. N. (Eds.) (2012). Noise-induced Hearing Loss: Scientific Advances, Vol. 40. New York: Springer.
Lin, F. R., Maas, P., Chien, W., Carey, J. P., Ferrucci, L., and Thorpe, R. (2012). Association of skin color, race/ethnicity, and hearing loss among adults in the USA. J. Assoc. Res. Otolaryngol. 13, 109–117. doi: 10.1007/s10162-011-0298-8
Lin, F. R., Niparko, J. K., and Ferrucci, L. (2011). Hearing loss prevalence in the United States. Arch. Intern. Med. 171, 1851–1852. doi: 10.1001/archinternmed.2011.506
Lutman, M. E., Davis, A. C., and Ferguson, M. A. (2008). Epidemiological evidence for the effectiveness of the noise at work regulations. Research report, No. RR669. Sudbury, UK: Health and Safety Executive.
Marshall, L., Lapsley Miller, J. A., and Heller, L. M. (2001). Distortion-product otoacoustic emissions as a screening tool for noise-induced hearing loss. Noise Health 3, 43–60.
McFadden, S., Henderson, D., and Shen, Y. (1997). Low-frequency ‘conditioning' provides long-term protection from noise-induced threshold shifts in chinchillas. Hear. Res. 103, 142–150. doi: 10.1016/S0378-5955(96)00170-0
Mehrparvar, A. H., Mirmohammadi, S. J., Davari, M. H., Mostaghaci, M., Mollasadeghi, A., Bahaloo, M., et al. (2014). Conventional audiometry, extended high-frequency audiometry, and DPOAE for early diagnosis of NIHL. Iran. Red Crescent Med. J. 16:e9628. doi: 10.5812/ircmj.9628
Miyakita, T., Hellström, P. A., Frimanson, E., and Axelsson, A. (1992). Effect of low level acoustic stimulation on temporary threshold shift in young humans. Hear. Res. 60, 149–155. doi: 10.1016/0378-5955(92)90017-H
Murillo-Cuesta, S., Contreras, J., Zurita, E., Cediel, R., Cantero, M., Varela-Nieto, I., et al. (2010). Melanin precursors prevent premature age-related and noise-induced hearing loss in albino mice. Pigment Cell Melanoma Res. 23, 72–83. doi: 10.1111/j.1755-148X.2009.00646.x
National Institute for Occupational Safety and Health (1998). NIOSH criteria for a recommended standard: occupational noise exposure, revised criteria 1998. Publication no. 98–126. Washington, DC.
Neitzel, R. L., and Fligor, B. J. (2019). Risk of noise-induced hearing loss due to recreational sound: review and recommendations. J. Acoust. Soc. Am. 146:3911. doi: 10.1121/1.5132287
Niu, X., and Canlon, B. (2002). Protecting against noise trauma by sound conditioning. J. Sound Vib. 250, 115–118. doi: 10.1006/jsvi.2001.3899
Niu, X., Shao, R., and Canlon, B. (2003). Suppression of apoptosis occurs in the cochlea by sound conditioning. Neuroreport 14, 1025–1029. doi: 10.1097/00001756-200305230-00024
Ohlemiller, K. K., and Gagnon, P. M. (2007). Genetic dependence of cochlear cells and structures injured by noise. Hear. Res. 224, 34–50. doi: 10.1016/j.heares.2006.11.005
Portnuff, C. D., Fligor, B. J., and Arehart, K. H. (2011). Teenage use of portable listening devices: a hazard to hearing? J. Am. Acad. Audiol. 22, 663–677. doi: 10.3766/jaaa.22.10.5
Pukkila, M., Zhai, S., Virkkala, J., Pirvola, U., and Ylikoski, J. (1997). The “toughening” phenomenon in rat's auditory organ. Acta Otolaryngol. Suppl. 529, 59–62. doi: 10.3109/00016489709124081
R Core Team (2022). R: A language and environment for statistical computing. R Foundation for Statistical Computing. Available online at: https://www.R-project.org/ (Accessed January 2025).
Rajan, R., and Johnstone, B. M. (1983). Residual effects in monaural temporary threshold shifts to pure tones. Hear. Res. 12, 185–197. doi: 10.1016/0378-5955(83)90105-3
Rupp, R. R., and Koch, L. J. (1969). Effects of too-loud music on human ears but, mother, Rock'n Roll has to be loud! Clin. Pediatr. 8, 60–62. doi: 10.1177/000992286900800204
Ryan, A., Kujawa, S., Hammill, T., Prell, C., and Kil, J. (2016). Temporary and permanent noise-induced threshold shifts. Otol. Neurotol. 37, e271–e275. doi: 10.1097/MAO.0000000000001071
Sallis, J. F., and Saelens, B. E. (2000). Assessment of physical activity by self-report: status, limitations, and future directions. Res. Q. Exerc. Sport 71, 1–14. doi: 10.1080/02701367.2000.11082780
Schmuziger, N., Patscheke, J., and Probst, R. (2007). An assessment of threshold shifts in nonprofessional pop/rock musicians using conventional and extended high-frequency audiometry. Ear Hear. 28, 643–648. doi: 10.1097/AUD.0b013e31812f7144
Shehabi, A., Prendergast, G., Guest, H., and Plack, C. J. (2023). Noise exposure in Palestinian workers without a diagnosis of hearing impairment: relations to speech-perception-in-noise difficulties, tinnitus, and hyperacusis. J. Speech Lang. Hear. Res. 66, 1085–1109. doi: 10.1044/2022_JSLHR-22-00461
Shuster, B., Casserly, R., Lipford, E., Olszewski, R., Milon, B., Viechweg, S., et al. (2021). Estradiol protects against noise-induced hearing loss and modulates auditory physiology in female mice. Int. J. Mol. Sci. 22:12208. doi: 10.3390/ijms222212208
Tahera, Y., Meltser, I., Johansson, P., Salman, H., and Canlon, B. (2007). Sound conditioning protects hearing by activating the hypothalamic-pituitary-adrenal axis. Neurobiol. Dis. 25, 189–197. doi: 10.1016/j.nbd.2006.09.004
Themann, C. L., Byrne, D. C., Davis, R. R., Morata, T. C., Murphy, W. J., and Stephenson, M. R. (2015). Early prognosis of noise-induced hearing loss: prioritising prevention over prediction. Occup. Environ. Med. 72, 83–84. doi: 10.1136/oemed-2014-102453
Tin, L. L., and Lim, O. P. (2000). A study on the effects of discotheque noise on the hearing of young patrons. Asia Pac. J. Public Health 12, 37–40. doi: 10.1177/101053950001200108
Ulrich, R. F., and Pinheiro, M. L. (1974). Temporary hearing losses in teenagers attending repeated rock-and-roll sessions. Acta Otolaryngol. 77, 51–55. doi: 10.3109/00016487409124597
Vinck, B. M., Van Cauwenberge, P. B., Leroy, L., and Corthals, P. (1999). Sensitivity of transient evoked and distortion product otoacoustic emissions to the direct effects of noise on the human cochlea. Int. J. Audiol. 38, 44–52. doi: 10.3109/00206099909073001
Wang, Q., Wang, X., Yang, L., Han, K., Huang, Z., and Wu, H. (2021). Sex differences in noise-induced hearing loss: a cross-sectional study in China. Biol. Sex Differ. 12:24. doi: 10.1186/s13293-021-00369-0
Wang, Y., and Liberman, M. C. (2002). Restraint stress and protection from acoustic injury in mice. Hear. Res. 165, 96–102. doi: 10.1016/S0378-5955(02)00289-7
World Health Organization (2022). WHO global standard for safe listening venues and events. Genevac: World Health Organization.
Yoshida, N., Kristiansen, A., and Liberman, M. C. (1999). Heat stress and protection from permanent acoustic injury in mice. J. Neurosci. 19, 10116–10124. doi: 10.1523/JNEUROSCI.19-22-10116.1999
Zhu, G., Wu, Y., Qiu, Y., Tian, K., Mi, W., Liu, X., et al. (2020). Hsp70/Bmi1-FoxO1-SOD signaling pathway contributes to the protective effect of sound conditioning against acute acoustic trauma in a rat model. Neural Plast. 2020:8823785. doi: 10.1155/2020/8823785
Keywords: temporary threshold shift, noise-induced hearing loss, individual susceptibility, sound conditioning, sex differences, melanin
Citation: Murray C, Guest H, Prendergast G, Munro K, Millman R, Roberts SA, Kluk K and Plack CJ (2025) Factors determining susceptibility to temporary threshold shift in humans: insights from concert attendance. Front. Audiol. Otol. 3:1635615. doi: 10.3389/fauot.2025.1635615
Received: 26 May 2025; Accepted: 19 September 2025;
Published: 13 October 2025.
Edited by:
Mary M. Flaherty, University of Illinois at Urbana-Champaign, United StatesReviewed by:
Gerhard Hesse, Tinnitus-Klinik, GermanyCelia Zhang, University of the Pacific, United States
Copyright © 2025 Murray, Guest, Prendergast, Munro, Millman, Roberts, Kluk and Plack. This is an open-access article distributed under the terms of the Creative Commons Attribution License (CC BY). The use, distribution or reproduction in other forums is permitted, provided the original author(s) and the copyright owner(s) are credited and that the original publication in this journal is cited, in accordance with accepted academic practice. No use, distribution or reproduction is permitted which does not comply with these terms.
*Correspondence: Christopher J. Plack, Y2hyaXMucGxhY2tAbWFuY2hlc3Rlci5hYy51aw==