 Alex Gascon
 Marlene Bagatto
 Susan Scollie
 Cassandra Cowan
 William Hodgetts
- 1Bone-Conduction Amplification Laboratory - Craniofacial Care Program, Covenant Health, Misericordia Community Hospital, Edmonton, AB, Canada
- 2Faculty of Rehabilitation Medicine, University of Alberta, Edmonton, AB, Canada
- 3Faculty of Health Sciences, National Centre for Audiology and School of Communication Sciences and Disorders, Western University, London, ON, Canada
Objectives: Objective measurements and prescriptive formulas for air-conduction hearing aids have been discussed extensively in the literature. In contrast, the application of objective verification tools such as clinical skull-simulators in the bone-conduction amplification literature is still emerging. This approach offers a critical step toward understanding the variability in percutaneous bone-conduction hearing devices (BCD) output on a larger scale. Our study aims to quantify this variability using skull-simulator measurements of percutaneous BCD users, thereby generating accuracy description of the range of outputs normally fitted in a clinical context.
Design: A cross-sectional retrospective study was conducted, analyzing skull-simulator measurements from routine audiology appointments of 79 adult percutaneous BCD users fitted with the DSL-BCD v1.1 prescription procedure. We explored the relationship between in-situ bone-conduction hearing thresholds and frequency-specific and root mean square error (RMSE) deviations from targets, along with aided speech intelligibility index (SII) using linear regressions for standard speech signals. BCD skull-simulator measurements were conducted at the user's daily listening level.
Results: At a 65 dB SPL speech input, over 50% of participants showed output-to-target deviations within ±5 dB at all frequencies except 750, 6,000, and 8,000 Hz. Fittings generally fell below targets as in-situ bone-conduction thresholds worsened, with exceptions at 250 and 500 Hz showing the reverse trend. A significant correlation was observed between in-situ bone-conduction thresholds and aided SII across all input levels, indicating an expected decrease in aided SII with increased bone-conduction hearing loss. The RMSE was within 5 dB for 37% of participants, lower than reported in air-conduction hearing aid literature. Secondary analyses assessing BCD capabilities of matching targets following fine-tuning, without participants' involvement, indicated that a RMSE within 5 dB could be met in 79% of cases.
Conclusions: This study outlines the deviations in output-to-target and aided SII among adult percutaneous BCD users, offering clinicians a benchmark through 95% confidence interval regression models and in-situ threshold averages. This normative data is beneficial for fitting BCDs in users with elevated in-situ thresholds, reducing uncertainty about optimal fittings. Further research is necessary to elucidate the relationship between aided SII, output-to-target deviations, outcomes and preferences in percutaneous BCD wearers.
1 Introduction
For audiologists, objective verification of hearing devices, followed by fine-tuning according to a validated prescription, is a recommended step in fitting amplification devices (Alberta College of Speech-Language Pathologists Audiologists, 2021; Audiology Practice Standards Organization, 2021; Valente et al., 2006). Although air-conduction hearing aids have been subject to verification for decades, the tools for verifying percutaneous bone-conduction hearing devices (BCD) with skin-penetrating abutments have only recently been introduced. In 2018, the availability of a clinical skull simulator by Audioscan® (Etymotic Design, Inc, Dorchester, Canada) enabled the objective measurement of percutaneous BCD output in dB FL (decibel Force Level) across various input levels and frequencies, mirroring the verification process for air-conduction hearing aids using a coupler (Seewald et al., 1999; Scollie et al., 2022). The DSL-BCD v1.1 prescriptive algorithm (Hodgetts and Scollie, 2017) is designed to establish frequency shape, output, and compression targets for percutaneous devices, tailored to the wearer's unique bone-conduction thresholds and the specific characteristics of the device, including its maximum force output (MFO). Subsequent measurement of the device's output with a skull simulator connected to a hearing aid analyzer facilitates assessment of its frequency response and aided audibility. Similar to the DSL v5.0 formula for air-conduction aids, fitting BCDs to DSL-BCD targets is aimed at ensuring optimal aided speech intelligibility and comfort for users (Polonenko et al., 2010; Seewald et al., 2005; Van Eeckhoutte et al., 2020). Prescriptive targets and objective verification tools provide objective metrics that enhance our understanding of variability in hearing device fittings. Research on air-conduction hearing aids has extensively compared device output in dB SPL (Decibel Sound Pressure Level) against prescriptive targets (e.g., Baker and Jenstad, 2017; Dao et al., 2021; Polonenko et al., 2010). For instance, Dao et al. (2021) performed a retrospective analysis of 281 adult fittings to evaluate output-to-target accuracy and aided speech intelligibility index (SII), offering normative data on SII and root-mean squared error (RMSE) for deviations from target outputs based on individual hearing thresholds. These data were integrated into a hearing aid analyzer (e.g., Audiocan Verifit) to assist clinicians in determining whether their fittings provide a typical aided response, based on the aided SII and RMSE. Within this literature, it is important to note that users' daily use and/or preferred settings may differ from those settings that best meet target, especially at the individual level or for specific frequency regions (Polonenko et al., 2010; Van Eeckhoutte et al., 2020). Some authors have used the agreement between observed daily use gain and prescribed gain as a way of evaluating whether a prescriptive target is appropriate, particularly in the early days of prescriptive methods (Snik and Hombergen, 1993; Snik and Stollman, 1995).
1.1 Study goals and objectives
Hodgetts and Scollie (2017) adapted the DSL v5.0 air-conduction algorithm for bone-conduction hearing devices to develop the DSL-BCD v1.1 algorithm, including modifications for Force Level measurements. This adaptation was validated against a sample of 39 adults, full-time percutaneous BCD users, leading to adjustments in low-frequency gain to better address clinical concerns such as own voice occlusion effects. Despite its availability in clinics since 2018, the extent of output-to-target deviations and typical levels of aided speech audibility in percutaneous BCD fittings have not been explored. This project aims to investigate these output-to-target deviations in adult percutaneous BCD wearers by comparing their device outputs, after the devices had been fitted using DSL-BCD fitting procedures (Hodgetts and Scollie, 2017) and adjusted to daily use settings.
Research questions:
1. What are typical output-to-target deviations, RMSE and aided SII for adult percutaneous BCD wearers' daily settings?
2. What is the relationship between the in-situ percutaneous bone-conduction hearing thresholds and output-to-target deviation, aided SII and RMSE at daily settings?
3. Does the BCD manufacturer's power categorization, maximum force output and feedback management strategy impact the RMSE and aided SII at daily settings?
The overarching goal of this project is to expand our understanding of the typical fitting characteristics of percutaneous BCDs and establish clinically relevant performance benchmarks in adult users.
2 Materials and methods
A cross-sectional retrospective study was conducted with approval from the Health Research Ethics Board of the University of Alberta, Covenant Health and Alberta Health Services (Pro00125725). Data were gathered from clinical records of routine audiological assessments of adults using a percutaneous BCD on a skin-penetrating abutment (i.e., Cochlear BAHA and Oticon Medical Ponto). Records involving malfunctioning BCDs were excluded. Collected data included demographic information, type of hearing loss, BCD model, prescriptive formula, and screenshots from the Audioscan Skull-Simulator connected to an Audioscan Verifit 2 hearing aid analyzer. These screenshots documented the BCD's output in dB FL across frequencies from 250 to 8,000 Hz, in-situ bone-conduction (BC) thresholds in dB DL (decibel Dial Level), DSL-BCD v1.1 targets in dB FL, and the aided SII as calculated by the Audioscan Verifit 2. A research assistant entered the data into a spreadsheet under the supervision of an audiologist meeting registration requirements. Once the data were entered in a spreadsheet, the audiologist cross-checked the screenshots with the spreadsheet entries to ensure that the data entry was accurate. BCD fitting data were originally collected during standard audiology appointments, with the device set to the participant's daily listening level.
2.1 Procedures
2.1.1 In-situ BC threshold measurements
In-situ BC thresholds were measured in a double-walled sound-treated booth without contralateral ear masking, following the DSL-BCD v1.1 fitting method (Hodgetts and Scollie, 2017). These thresholds represent the participant's threshold of hearing through the bone-conduction path using their personal BCD, obtained via the in-situ modules of the BCD fitting software, and based on direct-bone conduction reference equivalent threshold force levels (Carlsson and Håkansson, 1997). These thresholds are intended for BCD fitting and verification (Gascon et al., 2022) but are not diagnostic or ear-specific, reflecting a combination of ipsilateral and contralateral responses.
2.1.2 BCD daily listening levels and skull-simulator measurements
Daily listening levels were determined by audiologists, based on in-situ BC thresholds and DSL-BCD v1.1 formula outputs. For new BCD fitting, in-situ BC thresholds were measured and inputted in the BCD programming software which generated the gain, compression ratio and frequency response using the DSL-BCD v1.1 prescriptive formula. Further adjustments to the devices were made following clinical history, subjective sound quality evaluations, acoustic feedback and skull-simulator measurements. For follow-up BCD fittings, in-situ BC thresholds were measured and adjustments were performed as needed. For example, experienced BCD users satisfied with their device, with stable in-situ BC thresholds and adequate skull-simulators measurements did not have further adjustments. The daily listening level aimed to provide both sufficient aided audibility and subjective comfort and loudness to the users, while minimizing the need for manual volume control adjustment by the users. This approach to BCD fine-tuning aims to optimize aided audibility while accounting for the BCD user's preferences (Audiology Practice Standards Organization, 2021; Jorgensen, 2016). Following initial settings, adjustments were made as necessary, incorporating clinical history, subjective feedback, and objective skull-simulator assessments. Measurements at the daily listening level used the Audioscan Verifit 2 with a calibrated male speech signal at 55, 65, and 75 dB SPL, recorded in dB FL, alongside the maximum force output at each 1/3 octave frequency using a 90 dB SPL burst.
2.2 Participants
For this study, data from 91 percutaneous BCD users were reviewed, excluding five due to incomplete data and seven based on exclusion criteria, resulting in a final sample of 79 (49 females, mean age = 60.3, SD = 17.9). Outliers were assessed based on a visual inspection of the hearing aid analyzer screenshot (i.e., the SpeechMap showing output curves with dB FL on the Y axis and frequencies on the X axis) and the fit-to-target deviations. Participants with fit-to-target deviations outside of the 3rd or 1st ± 1.5 interquartile ranges for at least 3 frequencies, at any input level or an atypical output curve on the SpeechMap were excluded. All participants used Oticon Medical BCDs, except for one who used a Cochlear BAHA 5 Power. Sixty-six participants used BCD classified as “Power” devices by the manufacturer (i.e., Ponto 5 Super Power, Ponto 3 Super Power, Ponto 3 Power, Ponto Plus Power, etc.), while 13 used “Regular” devices (i.e., Ponto 3, Ponto 5 Mini, Ponto Plus, etc.) Participants had unilateral conductive (N = 1), unilateral mixed (N = 5), bilateral conductive hearing loss (N = 12), limited usable hearing unilaterally (historically referred to as single-sided deafness, N = 7) or bilateral mixed/sensorineural hearing loss (N = 44) (Figure 1). The audiograms of 10 participants were incomplete, which did not allow to classify their type of hearing loss. For in-situ BC thresholds analysis, the degree of cochlear loss was categorized by the in-situ BC 4-frequency pure-tone average (0.5, 1, 2 and 4 kHz; 4PTA), following the American Speech-Language-Hearing Association (2022) guidelines. Only 2 participants had in-situ BC 4-frequency in the moderately-severe category (>55 dB DL).
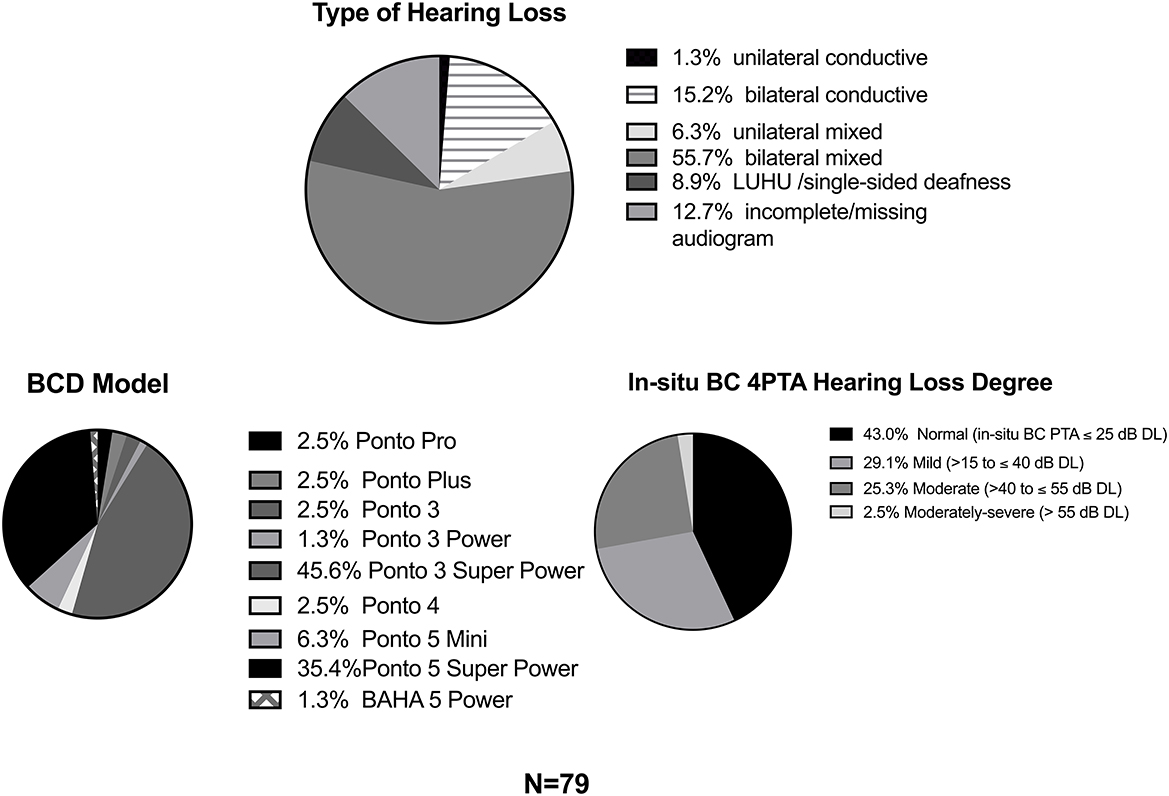
Figure 1. Type of hearing loss, BCD model and in-situ BC 4PTA hearing loss degree of study sample.
2.3 Analysis
2.3.1 Aided speech-intelligibility index (SII)
The SII, ranging from 0.0 to 1.0, estimates the audible and usable proportion of the speech spectrum, weighting different frequency bands based on their importance for speech understanding (American National Standards Institute, 1997; Amlani et al., 2002; Hornsby, 2004). The SII also models distortions that occur when speech is presented at high presentation levels in air-conduction hearing. The aided SII is correlated with speech perception scores in air-conduction hearing aid users (Sherbecoe and Studebaker, 2003; Scollie, 2008; Killion and Mueller, 2010; McCreery and Stelmachowicz, 2011) and has been shown to help predict important speech and language-related outcomes in pediatric air-conduction hearing aid users (McCreery, 2015; McCreery et al., 2020; Wiseman et al., 2022). However, it is critical to note that the ANSI (1997) SII calculation (American National Standards Institute, 1997) is based on air-conduction hearing, in adults with normal hearing sensitivity, and that the SII provided by the Verifit 2 hearing aid analyzer uses assumptions based on air-conduction hearing. To our knowledge, an SII specific to bone-conduction hearing has not been developed. As such, its application to bone-conduction hearing remains to be fully explored. For Research Question 1, 95 percent individual confidence intervals (i.e., the prediction intervals) of the SII using the in-situ BC 4PTA as a predictor were calculated.
2.3.2 Root-mean squared error (RMSE)
The RMSE aggregates differences across 0.5, 1, 2, and 4 kHz at each input level. A ± 5 dB output-to-target (i.e., RMSE ≤ 5 dB) range was deemed clinically acceptable and chosen as a criterion for analysis, consistent with air-conduction aid literature (McCreery et al., 2013; Moodie et al., 2017; Dao et al., 2021). For Research Question 1, 95 percent individual confidence intervals of the RMSE using the in-situ BC 4PTA as a predictor were calculated.
2.3.3 Regression models of output-to-target deviations
For Research Question 2, simple linear regressions explored relationships between in-situ BC thresholds (predictors) and output-to-target deviations at each audiometric frequency from 250 to 8,000 Hz, aided SII, and RMSE (outcome variables). Polynomial regression and curve analysis assessed the best-fitting models, focusing on the standard speech signal at 65 dB SPL, with analysis also conducted for 55 and 75 dB SPL input levels.
Hierarchical regression was then used to assess whether predictors of Research Question 3 explained an additional statistically significant portion of the variance in RMSE and SII compared to the simple regressions. The additional predictors were entered in the following order: BCD power category (device categorized as a power or regular, based on manufacturer category), MFO (4-frequency average of BCD output on the skull-simulator at 0.5, 1, 2 and 4 kHz with the 90 dB SPL tone burst, in dB FL) and feedback management strategy (categorized based on the BCD's chip generation). Analyses were performed using IBM SPSS v29.0 and GraphPrism 10 for macOS. A conservative Bonferroni correction of a factor of 24 was applied to p < 0.05 to account for the number of statistical tests conducted (p < 0. 002).
2.4 Secondary analysis of match-to-targets following fine-tuning
Additional skull-simulator output measurements were performed using participants' BCD programming file to assess whether additional fine-tuning could improve match to targets for a subset of participants (N = 62) using Oticon Medical Ponto 3 Super Power, Ponto 5 Super Power and Ponto 5 Mini from the laboratory. Other older BCD models were not available in the laboratory. The participant's personal BCD settings were retrieved from the fitting database (Noah, HIMSA) and loaded into a BCD of the same model. This analysis was conducted with new Oticon Medical Ponto 3 Super Power, Ponto 5 Super Power and Ponto 5 Mini BCD from the research laboratory. Skull-simulator verifications using the same inputs (55, 65, 75 dB SPL speech signal and 90 dB SPL tone bursts) were run using the participants' programming file and in-situ BC thresholds. Fine-tuning of the gain was performed by an audiologist to match the DSL-BCD v1.1 targets as closely as possible. These skull-simulator measurements were performed in the laboratory, without the participants' involvement.
3 Results
3.1 Aided speech intelligibility index (SII)
3.1.1 Relationship between in-situ BC 4PTA and SII
The correlation between the aided SII and in-situ BC 4PTA was analyzed using linear regressions for all three input levels. Figure 2 displays the best-fit line for each input level with the predicted 95% confidence intervals. For the three input levels, increasing degree of cochlear hearing loss led to lower aided SII. The relationship for the 55 dB SPL speech signal aligned best with a simple linear equation [r2 = 0.90, F(1, 76) = 667.93, p < 0.001]. For the 65 dB SPL, a quadratic function fitted best [r2 = 0.90, F(2, 76) = 326.10, p < 0.001]. For the 75 dB signal, a cubic function was most representative [r2 = 0.83, F(3, 74) = 121.36, p < 0.001]. According to Cohen's effect size guidelines (Cohen, 1988), the 4-frequency in-situ BC PTA had a large effect size for each input level, accounting for between 83 and 90% of the variance in aided SII across the three input levels.
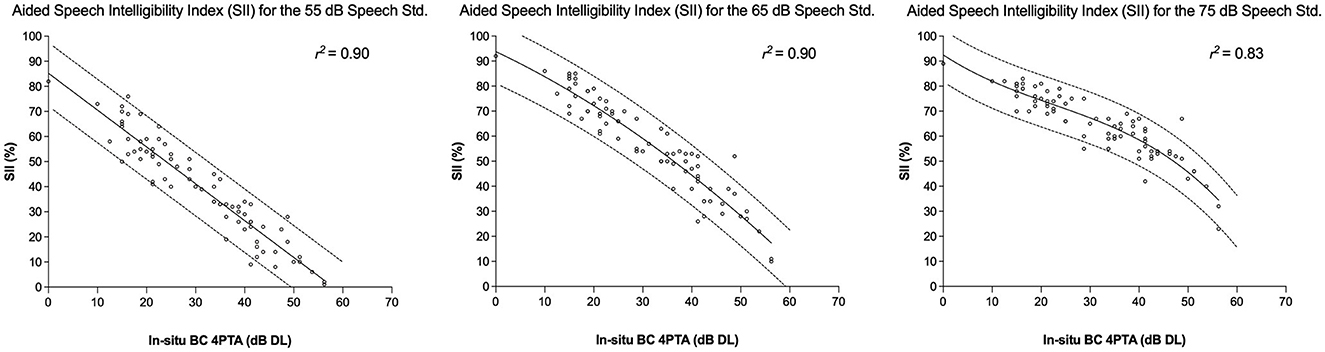
Figure 2. Relationship between in-situ BC 4PTA and SII with 95 CI for the 55, 65, and 75 dB SPL input levels.
3.1.2 Relationship between several BCD characteristics and SII
Before proceeding with the investigation of the additional BCD characteristics with multiple regression, statistical analyses were run to ensure that the categorical predictors (i.e., power category and feedback management strategies) were adequate. An independent sample two-sided T-Test was conducted to compare the MFO of the BCD categorized as power vs. regular device by the manufacturer to ensure that this category was overall representative of the BCD output capabilities on the skull-simulator. The mean of 4-frequency MFO in dB FL on the skull simulator for BCD categorized as regular (n = 12, M = 99.96 dB FL, SD = 2.55) was smaller than the power BCD (n = 66, M = 108.56 dB FL, SD = 2.43). Two-tailed T-Test revealed a statistically significant difference between the means [t(77) = −11.55, p < 0.001], with a large effect size based on Cohen's d and absolute difference between the means (d = −3.51, absolute mean difference = 8.7 dB). This confirmed that BCD classified as a Power device by the manufacturer had overall higher MFO compared to Regular devices when measured on the skull-simulator. Similarly, an independent sample two-sided T-test was conducted to compare the MFO of the BCD based on the feedback management strategy. Most participants had Ponto 5 Super Power (N = 28) or Ponto 3 Super Power devices (N = 36), the remaining devices had 5 users or fewer. Due to an insufficient number of participants, only the Ponto 3 Super Power and Ponto 5 Super Power MFO have been compared to assess the impact of the feedback management strategy. T-Test revealed a higher mean MFO for the Ponto 3 SP (M = 109.62 dB FL) compared to the Ponto 5 SP (M = 107.36 dB FL). This difference was statistically significant [t(62) = 4.18, p < 0.001], with an overall small to medium effect size based on Cohen's d and the means difference (d = 1.05, mean difference = 2.26 dB). This confirmed that the feedback management strategy does have an overall effect on MFO, with the Ponto 3 SP having higher MFO on the skull-simulator compared to the Ponto 5 SP.
Multiple regression with hierarchical predictor entry was used to test whether adding predictors to the simple regression with the in-situ BC 4PTA explained additional portions of the variance in SII (Table 1). For the 55 dB calibrated speech signal, adding the power category improved the model with a small effect size (R2 change = 0.02, p < 0.0001). The parameter estimate was positive, suggesting that Power device led to higher aided SII. Adding MFO did not explain an additional statistically significant portion of RMSE variance compared to the model with in-situ BC 4PTA and Power (R2 change = 0.0075, p = 0.0079). For the 65 dB calibrated speech signal, adding the power category did not improve the model compared to the simple regression (R2 change = 0.01, p = 0.0025, ns). Adding MFO to the simple regression revealed a statistically significant difference with a small effect size (R2 change = 0.0279, p < 0.001). For the 75 dB calibrated speech signal, adding the power level did not improve the model (R2 change = 0.006, p = 0.1274). Adding the MFO revealed a statistically significant improvement in the model, with a small effect size (R2 change= 0.0256, p = 0.0012). Adding the feedback management strategy as an additional predictor did not significantly improve the model for any input. The parameter estimates for the MFO predictors in the 65 and 75 dB SPL were positive; as such higher MFO led to higher SII. In summary, the Power category or the BCD's MFO were associated with higher SII for the three input levels. These device characteristics explained a small and statistically significant additional portion of the variance in SII not explained by the in-situ BC 4PTA.
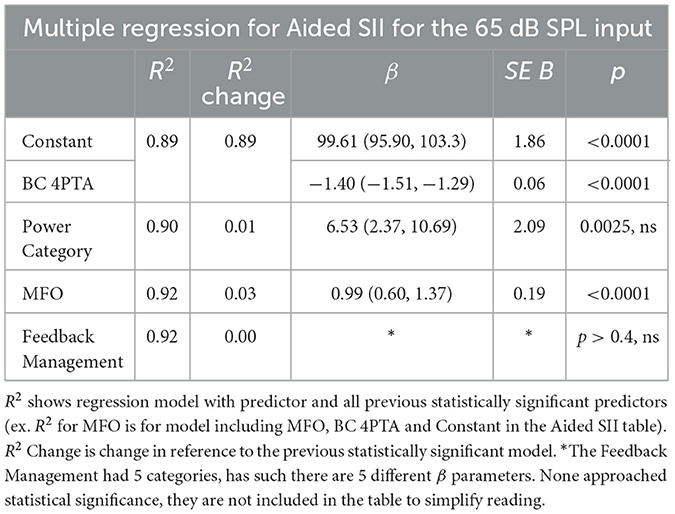
Table 1. Multiple regression for the aided SII for the 65 dB SPL input.
3.2 Root-mean squared error RMSE
3.2.1 Descriptive statistics
Table 2 describes the proportion of participants with a RMSE within the 5 dB criterion for the three input levels. For the entire sample, 36.7% of the participants had RMSE within the criterion for the 65 dB SPL input. When participants are categorized by the degree of in-situ BC 4PTA, the proportion of participants within the criterion declines with increasing degree of hearing loss, from 58.8% (normal in-situ BC 4PTA), 34.8% (mild) to 4.3% (moderate). A similar trend was seen with the 55 and 75 dB SPL input levels. Of note, the 75 dB SPL input level had the highest proportion of participants within 5 dB RMSE at each input level.
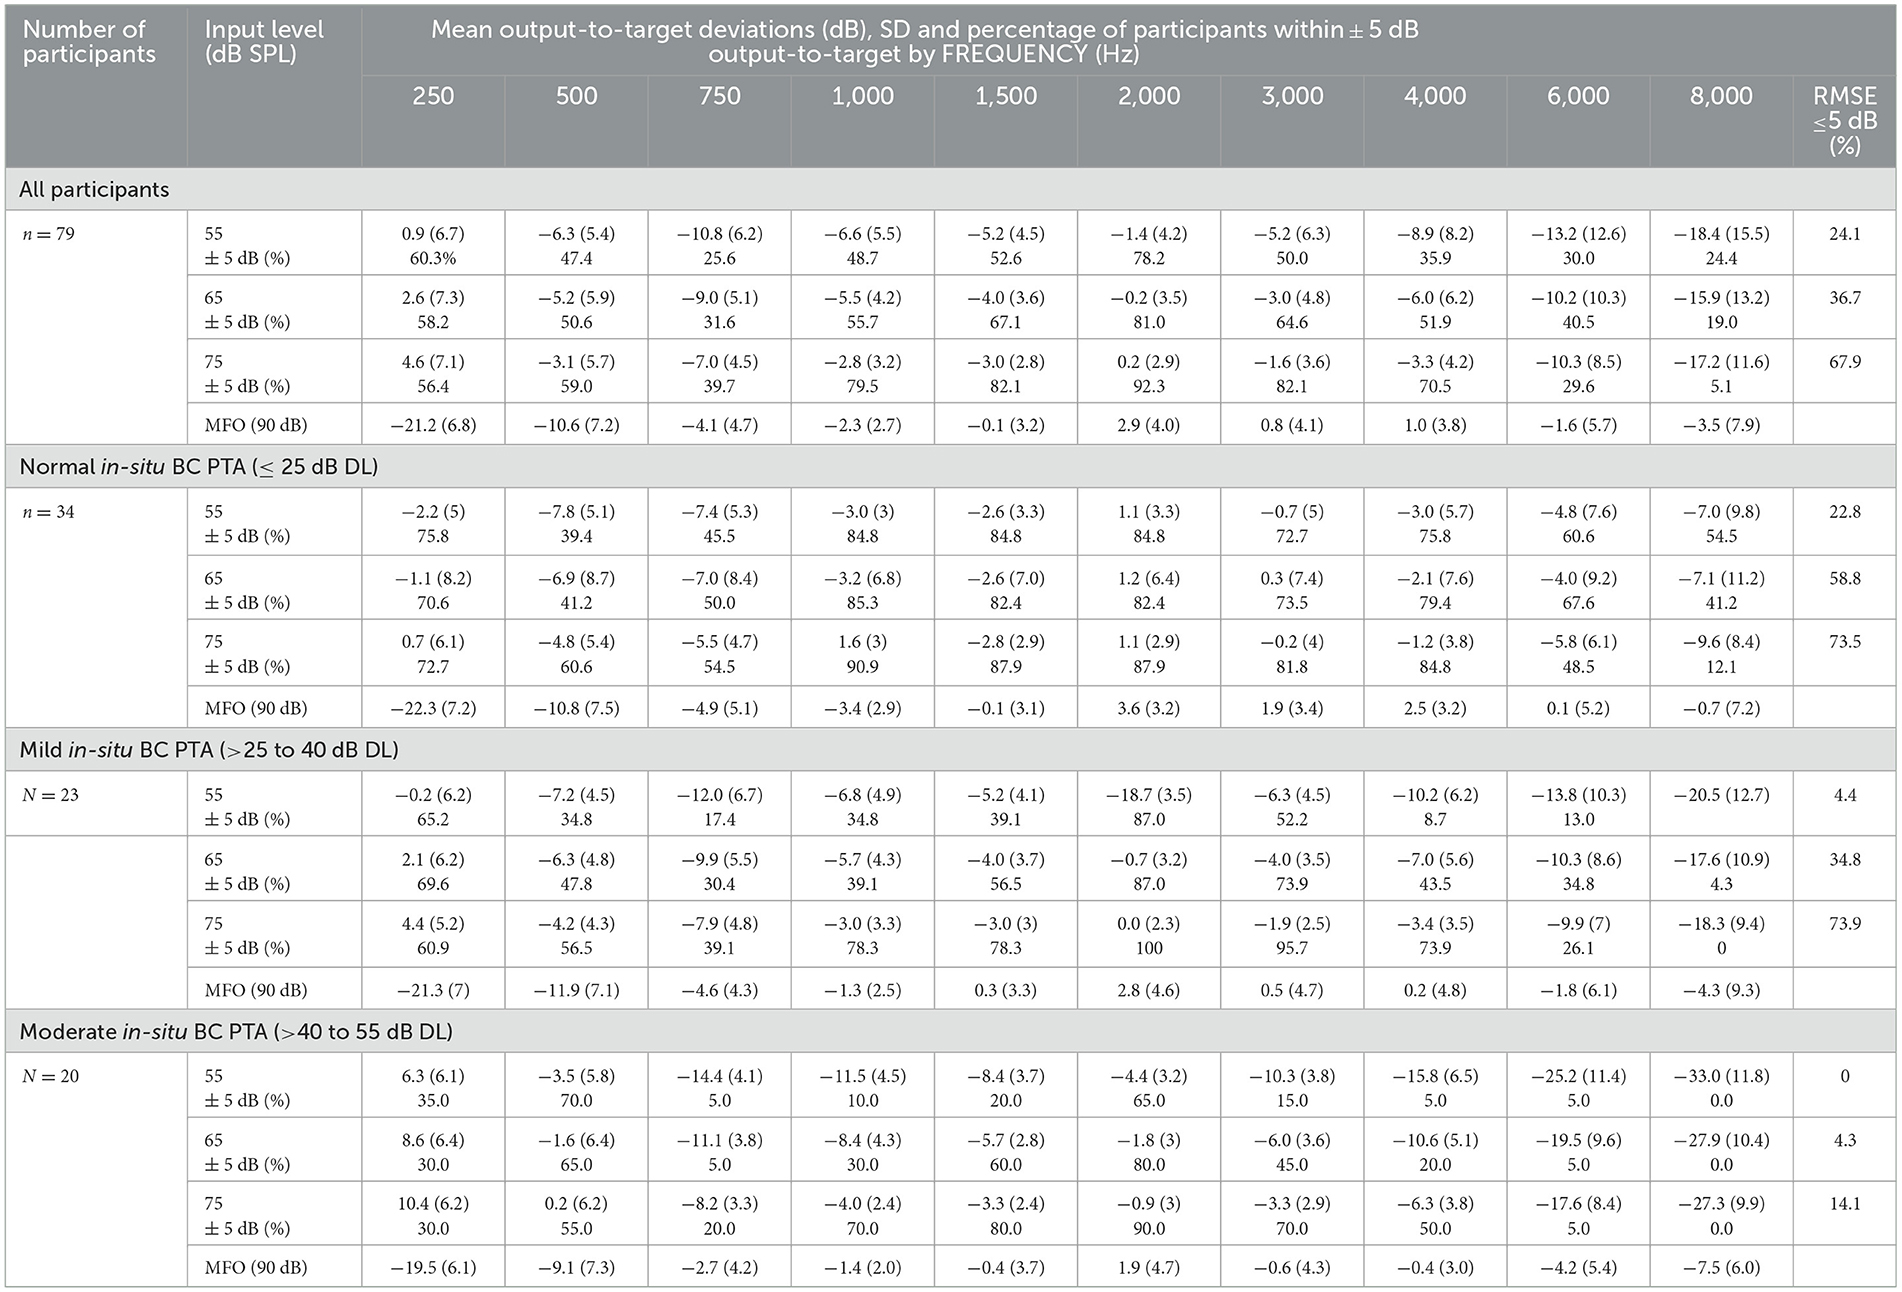
Table 2. Mean output-to-target deviations, percentage of participants within ±5 dB output-to-target by frequency and percentage of participant with the 5 dB RMSE criterion. Results are presented for the entire sample, and by degree of in-situ BC 4PTA degree of hearing loss.
3.2.2 Relationship between in-situ BC 4PTA and RMSE
The relationship between the 4-frequency in-situ BC 4PTA and RMSE was explored using linear regression for all input levels, with polynomial regression and visual inspection for curve analysis. Figure 3 presents the best-fit lines for each input level along with the predicted 95% confidence intervals. Simple linear equations best represented the relationships for the 55 and 65 dB speech signals [55 dB SPL; r2 = 0.45, F(1, 76) = 61.32, p < 0.001; 65 dB SPL; r2 = 0.20, F(1, 77) = 19.19, p < 0.001]. The relationship between the 4-frequency in-situ BC 4PTA and RMSE for the 75 dB speech signal was not statistically significant for any linear or curvilinear models [r2 = 0.03, F(1, 76) = 2.43, p = 0.123]. Using Cohen's d classification, the 4-frequency in-situ BC 4PTA had a large effect size for the 55 dB input and medium effect size for the 65 dB input, predicting 45 and 20% of the variance in RMSE, respectively.
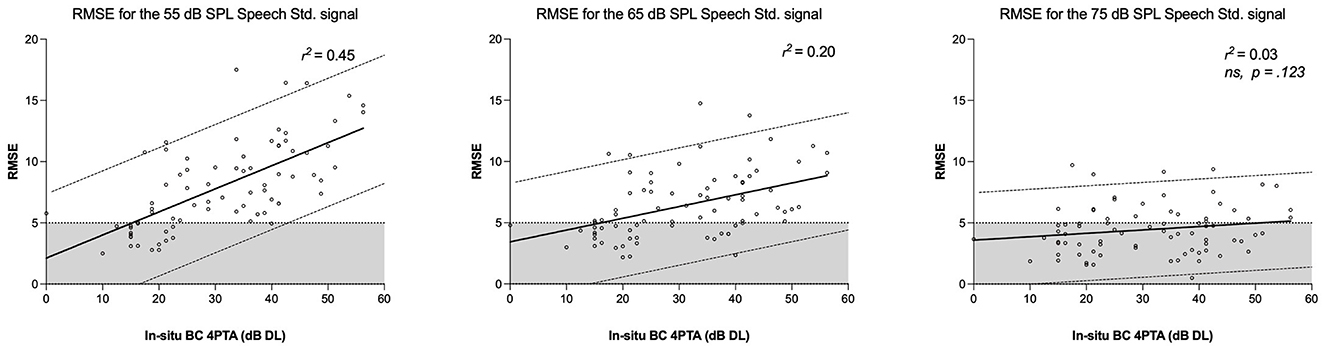
Figure 3. Relationship between in-situ BC 4PTA and RMSE with 95 CI for the 55, 65, and 75 dB SPL input levels. The shaded area represents the 5 dB RMSE criterion.
3.2.3 Relationship between several BCD characteristics and RMSE
Hierarchical regression was used to test if adding BCD characteristics predictors to the simple linear regression with BC 4PTA explained additional significant portions of the variance in RMSE (Table 3). Adding the power category did not significantly improve the model for any input levels. Adding MFO approached statistical significance for 55, 65 and 75 dB SPL (respectively p = 0.05, 0.01 and 0.0025) with small effect sizes (respectively, R2 change of 0.05, 0.06 and 0.11). The parameter estimate had a negative coefficient, showing that as MFO increases, the RMSE tends to decrease. Adding the feedback management strategy as an additional predictor did not significantly improve the model for any input level.
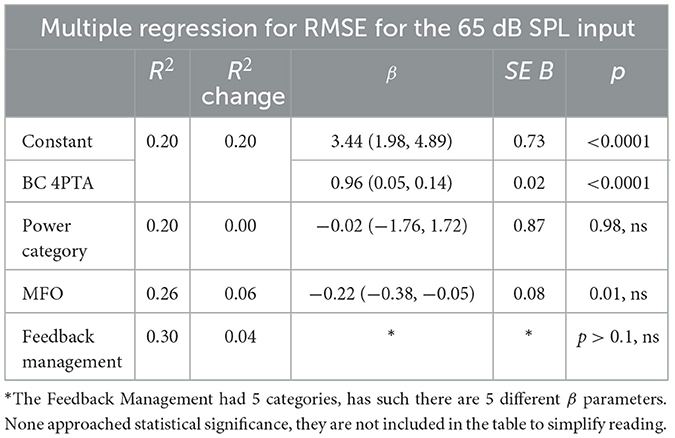
Table 3. Multiple regression for the RMSE for the 65 dB SPL input.
For the 55 dB calibrated speech signal, adding the power category did not improve the model (R2 change = −0.007, p = 0.34, ns). Adding MFO approached statistical significance, with a small effect size (R2 change = 0.05, p = 0.006). The MFO parameter had a negative coefficient, showing that higher MFO tend to reduce the RMSE. Adding feedback management strategy as an additional predictor did not result in a significant improvement in the model (R2 change = 0.0158, p = 0.81). For the 65 dB calibrated speech signal, adding the power category did not improve the model compared to the simple regression (R2 change = 0.00, p = 0.98, ns). Adding MFO to the simple regression approached statistical significance, with a small effect size (R2 change = 0.06, p = 0.01), with a negative coefficient. Adding the feedback management strategy as an additional predictor did not result in a significant improvement in the model (R2 change = 0.04, p = 0.60). For the 75 dB calibrated speech signal, adding the power level did not improve the model (R2 change = 0.005, p = 0.5294). Adding the MFO also approached statistical significance, with a small effect size (R2 change = 0.11, p = 0.0025). As with the 55 and 65 dB SPL analyses, the estimated parameter had a negative coefficient. Adding the feedback management strategy as an additional predictor did not significantly improve the model (R2 change = 0.10, p = 0.12).
3.3 Frequency specific analysis of output-to-target deviations
The upper graph in Figure 4 illustrates individual data points and mean output-to-target deviations in dB for the 65 dB SPL standard speech signal across the entire sample. Visual inspection indicates mean output-to-target deviations within the ±5 dB criterion from 250 to 3,000 Hz, with an exception at 750 Hz (−9.0 dB, SD = 5.1). Table 2 shows numerical values of the mean output-to-target deviations and the proportion of participants within 5 dB of targets. The mean deviations decrease from −6 to −16 dB from 4 to 8 kHz, suggesting the BCD output progressively falls below the target as frequency increases. For the 65 dB SPL speech signal, over 50% of participants met the ±5 dB criterion at all frequencies except 750, 6,000, and 8,000 Hz (Table 2). When categorized by degrees of cochlear loss (normal, mild, and moderate, based on in-situ BC 4PTA), the fittings for each hearing loss level showed a poorer match to the target at higher frequencies and were increasingly below targets as the degree of hearing loss escalated. For the MFO, overall, the mean output-to-target maximum force outputs were negative, except from 2 to 4 kHz where it exceeded the targets by 3.6 to 1.9 dB on average. This shows that MFO on the skull-simulator typically does not exceed the DSL BCD v1.1 targets.
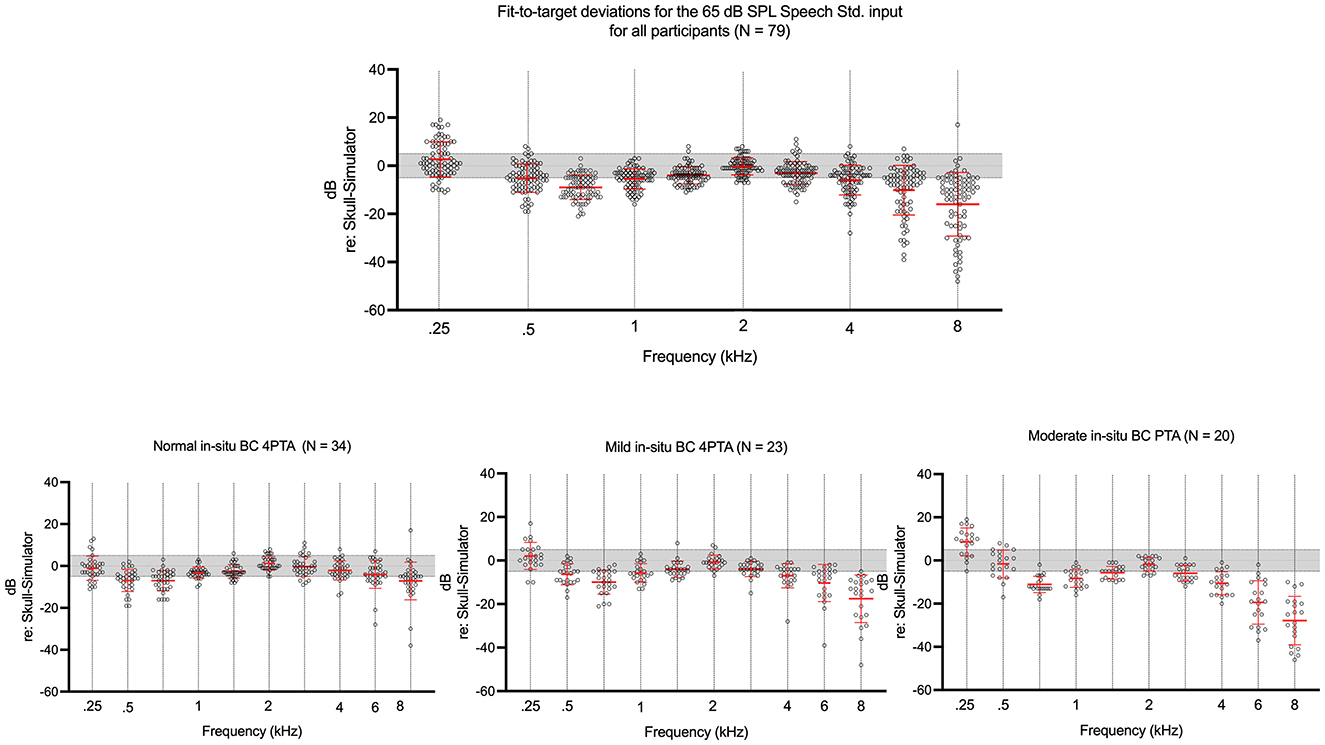
Figure 4. Fit-to-target deviations for the 65 dB SPL input. Shaded area represents the ±5 dB criterion. Whiskers represent ±1 SD from the mean.
The relationship between in-situ BC 4PTA hearing levels and output-to-target deviations for the 65 dB SPL speech signal was examined using simple linear regressions at each audiometric frequency (Figure 5). The relationship was statistically significant across all audiometric frequencies. All slopes were negative except at 250 and 500 Hz. At these two frequencies, output becomes increasingly above targets with worsening degrees of in-situ BC 4PTA. At 750 Hz and above, the output-to-target deviation increasingly falls below the target with worsening hearing loss. A visual inspection of Figure 5 suggests steeper slopes as frequency rises from 750 to 8,000 Hz, showing that worsening degrees of cochlear loss are increasingly impacting higher frequencies output to targets (i.e., there is a compounding effect of higher frequency and increasing degree of hearing loss on deviation to targets). The vertical dashed lines in the graphs denote the predicted in-situ BC 4PTA at the ±5 dB output-to-target criterion, revealing that the upper limit for in-situ BC 4PTA expected to meet the criterion decreases as frequency increases, except for 750 and 1,500 Hz. For instance, at 1 and 4 kHz, the regression line predicts that BCD users with an in-situ BC 4PTA of 28 dB DL or better typically meet the ±5 dB criterion. At 6 and 8 kHz, BCD users with in-situ BC 4PTA of 21 and 16 dB DL, respectively, are anticipated to be within the criterion. In summary, the linear models suggest that certain frequencies are less tolerant of poorer in-situ bone-conduction thresholds in meeting the ±5 dB output-to-target criterion, especially at 750 Hz, 6, and 8 kHz, with the lowest cut-off in-situ BC 4PTA for 1, 2, 3, and 4 kHz being 28 dB DL.
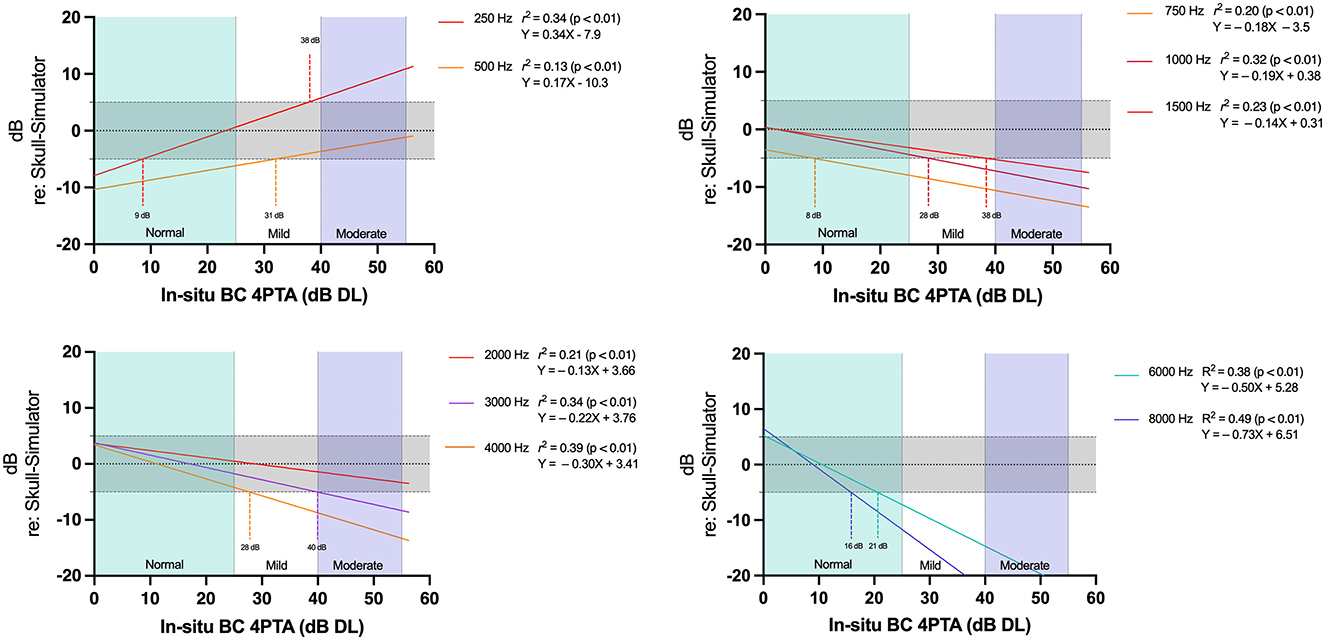
Figure 5. Linear regression model for output-to-targets by in-situ BC 4 PTA. Each regression line represents an audiometric frequency. Shaded area represents the ±5 dB criterion.
3.4 Secondary analysis of match-to-targets after fine-tuning
Additional skull-simulator output measurements were performed on a subset of participants using Ponto 5 Super Power, Ponto 3 Super Power and Ponto 5 Mini (N = 62) to assess if additional fine-tuning could improve match to targets for the 65 dB SPL input (Table 4). These measurements were conducted without the participant's involvement. After fine-tuning to match DSL BCD v1.1 targets with the skull-simulator, 79% of this subset had an RMSE ≤ 5 dB. For participants with normal in-situ BC 4PTA (N = 26), 92% of participants met the 5 dB RMSE criterion. For participants with mild and moderate in-situ BC 4PTA dB (N = 17 and N = 19), respectively, 94% and 47% had RMSE ≤ 5 dB.
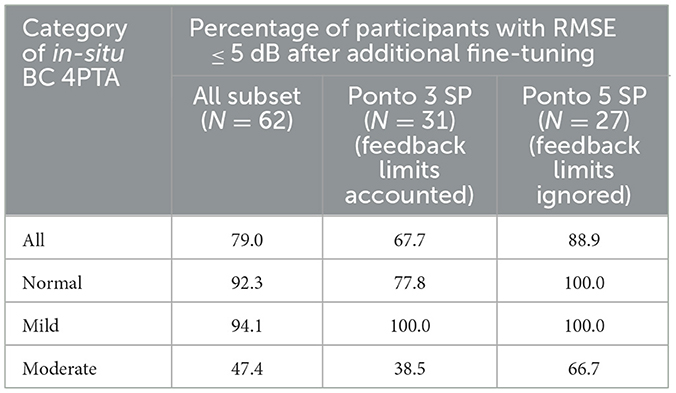
Table 4. Secondary analysis after additional BCD fine tuning.
Two-tailed repeated measure T-Test revealed a statistically significant smaller RMSE in the secondary analysis's fine-tuned subset compared to the RMSE from the chart review [t(61) = 7.7, p < 0.001], with a large effect size [MChartReview = 6.5 (2.8), MSecondaryAnalysis = 4.0 (2.4), Cohen d = 0.98]. Similar findings were found when comparing the aided SII, showing significantly better SII in the fine-tuned subset [t(61) = −4.8, p < 0.001] with a medium effect size [MChartReview = 55.13 (17.1), MSecondaryAnalysis = 59.6 (16.7), Cohen d = −0.60]. Repeated measure analysis of variances (ANOVA) was conducted to assess if the in-situ BC 4PTA category (between-subjects variable) was associated with a greater or smaller difference between the chart review and the fine-tuned subset in RMSE and SII (within-subjects dependent variable). For the RMSE, the repeated measure ANOVA had a significant main effect with a large effect size [F(1) = 62.7, p = < 0.001, η2p = 0.51], supporting smaller RMSE in the fine-tuned subset. The Condition x in-situ BC 4PTA category interaction term approached statistical significance [F(1, 2) = 3,0, p = 0.055, η2p = 0.094] with a small effect size. Although not statistically significant, inspection of means suggests that the fine-tuning was less able the improve the match-to-targets in the participants with Moderate in-situ BC 4PTA compared to the participants with normal and mild in-situ BC 4PTA. For the SII, the repeated measure ANOVA had a significant main effect with a large effect size [F(1) = 24.3, p = < 0.001, η2p = 0.29] showing better SII in the fine-tuned subset, without a significant interaction term (p = 0.17). This supports that the SII and RMSE improvements from fine-tuning were overall similar across the in-situ BC 4PTA hearing loss category for this subset. This supports that additional fine-tuning can improve RMSE and SII for the 65 dB speech signal of this data set, however this fine-tuning was done without accounting for the BCD users' preference and feedback.
3.4.1 BCD match-to-targets with or without feedback limits
Additional analyses of this subset were conducted to assess the role of feedback limits on the RMSE and SII. For participants using the Ponto 3 Super Power (N = 31), the BCD's fine-tuning was performed without overriding participants' feedback limits, previously set by running the feedback test on the user in the clinic. As such, BCD's feedback limits constrained the reserve gain available from the device in this subset of Ponto 3 Super Power. For the Ponto 5 Super Power (N = 27), fine-tuning was performed ignoring the feedback limits. The mean aided SII was higher for the Ponto 5 Super Power than with the Ponto 3 Super Power, both in the chart review data (SII 57.3 vs. 51.1) and in the subset of fine-tuned BCD (63.1 vs. 54.3). The Ponto 3 Super Power had a similar proportion within the 5 dB RMSE compared to the Ponto 5 Super Power in the chart review (33.3% vs. 32.3%), and a smaller proportion within criterion in the fine-tuned condition (68% vs. 89%) (Table 4). Higher proportions of Ponto 5 Super Power output within the RMSE criterion were also seen within each degree of in-situ BC 4PTA in the fine-tuned condition, especially for the moderate degree (39% vs. 67%). For the Ponto 3 Super Power, two-tailed repeated measure T-Test revealed a statistically significant smaller RMSE in the fine-tuned subset compared to the chart review participants' data [t(30) = 4.7, p < 0.001], with a large effect size [MChartReview = 6.5 (2.7), MSecondaryAnalysis = 4.5 (2.7), Cohen d = 0.85]. There was no statistically significant difference in SII between the chart review and fine-tuned Ponto 3 Super Power [t(30) = −2.2, p = 0.035]. This supports that additional fine-tuning of the Ponto 3 Super Power, done without overriding the feedback limits, resulted in a better match to targets compared to the chart review, but overall did not improve the aided SII. For the Ponto 5 Super Power subset, T-Test revealed statistically significant smaller RMSE and better SII (p < 0.001) with large effect sizes in the fine-tuned condition compared to the chart review. As such, fine-tuning done while ignoring feedback limits improved the RMSE and SII. This secondary analysis focusing on the impact of feedback limits supports that a better match to targets and better SII could be achieved by fine-tuning, however feedback limits can negatively impact both.
4 Discussion
This study verified the output of the bone-conduction hearing aids worn in daily life by 79 adults who were successful users, and who had been fitted with the devices following best practices protocols that included the use of a prescriptive target (Hodgetts and Scollie, 2017). Multilevel verification of aided output using calibrated speech signals was used to quantify deviation of the daily listening level of each device against the prescription, and to quantify the aided Speech Intelligibility Index for each fitting. The results fell into significant trends by degree of hearing loss, test level, and frequency. Consistent with similar studies of air conduction hearing aid users (e.g., Dao et al., 2021; Polonenko et al., 2010), in-situ BC 4PTA was a significant predictor of frequency-specific output-to-target deviations, RMSE (i.e., significant for the 55 and 65 dB SPL input levels only) and aided SII in adult percutaneous BCD users fitted with the DSL BCD v1.1 approach. Our findings indicate that clinicians should anticipate most fittings to fall below prescribed targets above the passband of the device, with increasing degree of under-target responses as the in-situ BC 4PTA increases, with responses at 6,000 Hz and above being 10 dB or more below target, on average for losses at the mild to moderate level. This may, for some fittings, limit access to high-frequency content of speech, which has been recognized. Recognizing these deviations as both typical and commonly occurring can assist clinicians in determining whether deviation from target is typical or requires further fine-tuning.
4.1 Aided speech intelligibility index
This study presents a typical range of aided SII values for three different input levels, aiding clinicians in evaluating their fittings. The relationship between the aided SII and in-situ BC 4PTA aligns with expectations, with a decrease in speech spectrum audibility correlating with increased cochlear loss. With increasing degree of cochlear loss, a smaller portion of the speech spectrum becomes audible, even if the BCD is adjusted to maximize aided audibility across the speech spectrum. Overall, this is similar to the air-conduction literature for adults and children fitted with DSL v5.0 (Moodie et al., 2017; Dao et al., 2021). When visually comparing the aided SII for air-conduction curves in Dao et al. (2021) to Figure 2 and adjusting the table to the same scale, the regression lines in the current study have a steeper slope. This suggests that there is a steeper decline of aided SII in percutaneous BCD as the degree of in-situ 4PTA worsens compared to air-conduction hearing device users. This difference with air-conduction amplification could be attributed to the impact of the degree of cochlear loss on audible bandwidth for percutaneous BCD users, as a result of BCD's high-frequency output limitations and the low-cut in the DSL BCD v1.1 formula discussed above. The descriptive statistics in Table 2 and the frequency-specific regression line in Figure 5 show output increasingly below targets as the hearing loss worsens, an effect that is more pronounced as the frequency increases. While output-to-target deviations do not provide information about the aided SII, these results support that worsening degrees of cochlear loss lead to a reduction in the upper high-frequency bandwidth available to the BCD user. The aided SII calculation gives higher importance to the high-frequency components of the speech spectrum (American National Standards Institute, 1997), as the poorer high-frequency aided negatively impact the aided SII calculation. In addition to increasing bandwidth constraints with worsening degrees of cochlear loss, the SII also reduces the audibility estimate for higher output levels due to increased distortion in the signal, again resulting in poorer aided SII as the in-situ BC thresholds worsen. For clinicians, Figure 2 can be used to assess if the fitting falls within the 95 CI of aided SII given the user in-situ BC 4TPA.
4.2 RMSE and frequency specific output-to-target deviation
When assessing output-to-target deviation at individual audiometric frequencies, the descriptive statistic showed that over 50% of the entire sample met the 5 dB criterion from 250 to 4,000 Hz for the 65 dB SPL input, with 36.7% of the users having a RMSE within 5 dB (Table 2). Visual inspection of the data shows that fittings were overall increasingly below targets with increasing degrees of cochlear loss (Figure 4). This proportion is lower than previously reported in the adult air-conduction literature with DSL v5.0, with 77% of the sample meeting the 5 dB RMSE in Dao et al. (2021) and 68% in Polonenko et al. (2010). In the bone-conduction amplification literature, Voss et al. (2021) investigated the relationship between performance in auditory tasks and percutaneous BCD skull-simulator measurement in adults with unilateral hearing loss. In their methodology, they did report that the DSL BCD v1.1 targets could not be met with a regular BCD, the Cochlear™ BAHA 5, while output targets were on average within 5 dB of targets with BAHA 5 Power once fine-tuning was done. The larger deviation from targets in the current study compared to the air-conduction amplification literature can in part be attributed to methodological differences. The procedure used to set the BCD daily listening level in clinic did not aim to only match targets, as the fine-tuning procedure also accounted for BCD user preference and gain restrictions due to feedback (see Procedures). Dao et al. (2021) and Sun et al. (2024) studies present data of hearing devices fine-tuned to match DSL targets during verification. The current study is closer methodologically to Polonenko et al. (2010) who investigated deviation to target with air-conduction hearing aids set at preferred listening level and with ongoing clinical care to accommodate individual preferences; the percentage of participants within 5 dB RMSE for the 60 dB SPL input is also somewhat closer to that in the current study.
As observed with air-conduction devices, the proportion of participants within the 5 dB criterion at individual audiometric frequencies decreased with worsening hearing loss, and the decrease is more pronounced at 4 kHz and above (Table 2). Frequency-specific regression analyses (Figure 5) indicated that participants with in-situ BC 4PTA up to 28 dB DL typically met the 5 dB criterion between 1,000 and 4,000 Hz. The 5 dB output-to-target deviation criterion at 2 kHz was more forgiving of worsening degree of hearing loss compared to other frequencies, where BCD users with in-situ BC 4PTA up to 50 dB DL were mostly within the criterion. This phenomenon is also seen in the descriptive statistics, where approximately 80% of the participants were within 5 dB of targets at 2 kHz, regardless of their in-situ BC 4PTA hearing loss level (Table 2). In the air-conduction literature, Baker and Jenstad (2017) also found that 100% of their air-conduction fittings with DSL v5.0 were within 5 dB of target at 2 kHz for all degrees of hearing loss for the 65 and 75 dB SPL, while other frequencies showed a decline in the proportion within 5 dB with worsening degrees of loss.
The in-situ BC 4PTA was a statistically significant predictor of RMSE for the 55 and 65 dB SPL speech signal, explaining, respectively, 45 and 20% of the variance (Figure 3). This is in line with the frequency-specific regression, which is expected given that the RMSE is an aggregate measure summarizing deviation from 500 to 4,000 Hz. The relationship between in-situ BC 4PTA and RMSE for the 75 dB SPL was not statistically significant (R2 = 0.03, p = 0.123), suggesting that the expected output to target could not be predicted from the in-situ BC thresholds. The descriptive statistics in Table 2 show that the proportion of participants with the 5 dB RMSE criterion is similar from normal to mild in-situ BC 4PTA for the 75 dB SLP input, while it declines for the 55 and 65 dB inputs. This could be attributed to the DSL BCD v1.1 prescriptive algorithm using the manufacturer specified MFO to set up the upper limit of the device leading to additional gain prescribed for loud output and less compression (Hodgetts and Scollie, 2017).
At 250 and 500 Hz, the linear regressions of output-to-target deviations and 4-frequency in-situ BC PTA had positive slopes (Figure 2). That is, as the in-situ BC thresholds worsen, the BCD output tends to approach or exceed the DSL BCD v1.1 targets. This is the opposite effect of the remaining frequency. For 4-frequency in-situ BC 4PTA greater or equal to 38 dB DL, the output was overall at least 5 dB above targets at 250 Hz (Figures 1, 2). A similar phenomenon is seen in the descriptive statistics of Dao et al. (2021) and Polonenko et al. (2010), where the proportion of participants within 5 dB of targets increases with worsening degrees of hearing loss in the low frequencies. Due to the retrospective design, the causal mechanisms for this effect can only be speculated on. First, the DSL-BCD v1.1 algorithm has a low-cut aiming to reduce the “hearing in a barrel” sensation and/or own voice issues that can be caused by low-frequency amplification in bone-conduction hearing (Hodgetts and Scollie, 2017). Bone-conduction hearing device users with elevated bone-conduction hearing thresholds might be less prone to this problem, given that perception of their own voice through their unaided bone-conduction hearing path is reduced due to their poorer inner ear hearing. As poorer low-frequency hearing thresholds are associated with reduced occlusion effect in air-conduction hearing aid users, a similar phenomenon could be present in percutaneous BCDs. DSL BCD v1.1 targets for all input levels at 250 Hz are below the thresholds of audibility (i.e., even for 0 dB DL in-situ), which is the result of the low-cut discussed above. As such, the audiologist doing the fine tuning might have focused on maximizing aided audibility for the BCD by increasing overall gain across several frequencies, and in the absence of own voice issues by the user, ignored the output at 250 Hz. For 500 Hz, DSL BCD v1.1 prescribes targets above the threshold of audibility for in-situ BC thresholds ≤ 30 dB DL. The audiologist doing the fine-tuning may have similarly ignored the target deviation for thresholds > 30 dB DL. Another likely scenario is that BCD users may compensate for their poorer aided-audibility of the speech spectrum in the mid and high-frequencies by increasingly relying on low-frequency hearing. While increased low-frequency gain is unlikely to improve speech understanding, percutaneous BCD with at least moderate cochlear losses may potentially perceive benefit from more low-frequency output to improve the loudness sensation and audibility of environmental sounds. Finally, the over-target output at 250–500 Hz may also be related to inflexibility of the BCD's frequency response, as the aided audibility at mid- and high-frequencies is not completely independent from the gain setting at 250–500 Hz (i.e., increasing gain at 250–500 Hz can be needed to improve the aided audibility in the mid and high-frequencies). Further research in bone-conduction amplification is needed to better understand whether this phenomenon is unique to the clinic where data were collected, and output at 250 and 500 Hz related to loudness in BCD.
4.3 Impact of BCD characteristic on RMSE and aided SII
The hierarchical multiple regression approach assessed whether BCD characteristics explained additional portions of the variance in RMSE and aided SII. Simple regression showed that increasing degrees of bone-conduction hearing loss was associated with poorer aided SII for the three input levels. The in-situ BC 4PTA accounted for between 83 and 90 % the variance across input levels, making in-situ BC 4PTA a strong predictor of aided SII for BCD fitted with the DSL BCD v1.1 fitting method. Power category, MFO and Feeback strategies were entered in a hierarchical multiple regression to assess if they explained an additional portion of the variance in SII. The Power category or MFO explained another 2% of the variance in SII. This indicates that, for the same in-situ BC 4PTA, a BCD with a higher MFO is expected to have a higher aided SII at all input levels. This is in line with the architecture of DSL BCD v1.1, as it prescribes gain based on BCD characteristics (Hodgetts and Scollie, 2017). That is, for the same in-situ BC 4PTA, BCD of different MFO (e.g., Ponto 5 Mini vs. Ponto 5 Super Power) would have different target prescriptions. This contrasts with the DSL v5.0 air-conduction fitting formula, where device characteristics are not accounted for in the target calculation. DSL BCD v1.1 opted to account for the MFO in target calculation to optimize the BCD's dynamic range available to the user, and given that MFO are expected to fall below the user's thresholds of discomfort.
For the RMSE, none of the additional predictors reached statistical significance. Of note, MFO would have reached statistical significance with a less conservative correction factor for the p-value (Bonferroni correction factor resulted in a severe p < 0.002 for significance testing, while p-values for the three levels were, respectively, 0.006, 0.01, and 0.0025). For the 55 and 65 dB SPL input levels, MFO explained an additional 5 and 6% of the variance. For the 75 dB SPL input, MFO explained an additional 11% of the variance, a medium effect size. The MFO parameter was negative for the three input levels showing that high MFO may slightly counteract the increased RMSE associated with worsening degree of cochlear hearing loss. While MFO was not a statistically significant predictor of the RMSE in the current experiment, data suggest that BCD with high MFO may achieve a better match to targets. The Power categorization and Feedback management strategy did not approach statistical significance. While Dao et al. (2021) analyzed venting impact on match to targets, the air-conduction amplification literature typically does not include device power characteristics, limiting the comparisons with this literature. The air-conduction amplification literature typically relies upon the larger power range available in these devices, choosing devices with appropriate power levels, so it is typically studied as a limiting factor in fit to targets. The MFO analysis of the current study aligns with the architecture of DSL BCD v1.1 described in Hodgetts and Scollie (2017), especially for the SII increasing (i.e., higher MFO leads to higher gain prescription, resulting in higher SII). For the RMSE, MFO would not be expected to impact match-targets given that DSL BCD targets are calculated accounting for MFO; the slight not-significant trend toward smaller RMSE with increasing MFO may be related to feedback or patient preferences, requiring further investigation.
4.4 Secondary analysis of match-to-targets after fine-tuning
Skull-simulator measurements were conducted to assess if the fittings more closely approximated target, or had different SII values, if the fittings were based only on fine-tuning. This secondary analysis clearly demonstrated that fine-tuning improved both of these variables. These findings are similar to Sun et al. (2024) who investigated the use of the skull-simulator for the fitting of BCD worn on a soft elastic headband in pediatric patients. Their findings supported that the first fit calculated by the BCD software resulted in output below DSL BCD v1.1 Pediatric targets, and that fine-tuning improved match to targets within 5 dB in over 80% of their sample. In this study, RMSE was within the 5 dB criterion for 79% of the sample for fine-tuned data (Table 4), also similar to the 77% of Dao et al. (2021) and the 68% of Polonenko et al. (2010). However, these fine-tuned measurements were conducted without participants' involvement. As with many prescriptive targets, the DSL BCD prescription was based on the average settings of a group of patients, and variability around this target was observed even in the development study (Hodgetts and Scollie, 2017). Fine tuning to individual preference after fitting to target is a component of best practice protocols (Valente et al., 2006; Alberta College of Speech-Language Pathologists Audiologists, 2021; Audiology Practice Standards Organization, 2021). Nonetheless, this secondary analysis showed that feedback limits did negatively impact the RMSE and aided SII. In addition to acoustic feedback from the BCD, individuals may have several reasons for preferring their BCD daily listening level below the prescribed DSL-BCD v1.1 targets. In their functional improvement study, Dumper et al. (2009) found that their sample of BCD had worst sound aversiveness when aided. This could relate to a need for improved noise management or to the use of prescriptive target modifications for use in noise, both of which have been studied for air conduction devices (Scollie et al., 2005, 2016; Glista et al., 2020). Despite being overall long-term BCD users, the participants' level of acclimatization to amplification and acoustical characteristics of their day-to-day environment may have also varied, which may have contributed to their personal preference for volume. Further study would be needed to map the time course of acclimatization, or to investigate the efficacy of improved signal processing for both feedback management and noise management BCD users.
4.5 Limitations
The data was collected retrospectively from a single site, reflecting the application of the DSL-BCD v1.1 fitting procedure at this location. The method used to determine the daily listening level diverged from preferred listening level approaches described in the amplification literature, where a calibrated speech recording at 60 dB SPL is used, and participants are instructed to manually adjust their hearing device's volume to a comfortable level (Hodgetts et al., 2006; Polonenko et al., 2010; Van Eeckhoutte et al., 2020). In this study, the listening level was set based on subjective impressions of the user and device usage goals, together with skull-simulator BCD output measurements that compared fittings to targets. This less standardized procedure may limit the replicability of our findings, highlighting a constraint of both the retrospective design and the clinical practices at the collection site. The secondary analysis did confirm that fine-tuning without BCD users' involvement could have improved the RMSE to a percentage of participants meeting the 5 dB criterion similar to air-conduction devices. However, the study design does not allow for assessing whether or not this match-to-target fine-tuned setting would have been free of feedback and accepted by the BCD users in their daily life.
Despite these limitations, the retrospective approach likely offers data that are reflective of typical clinical. The variability observed in output-to-target deviations aligns with expectations from air-conduction hearing aid literature and underscores the importance of balancing patient preferences with objective measures in clinical decision-making (Jorgensen, 2016). Most of the devices were Oticon Medical Ponto (only one Cochlear BAHA 5 Power user was part of the data set), as such the results may not generalize to other BCDs, or to non-percutaneous BCDs.
5 Conclusion
This study aimed to provide insights into frequency-specific output-to-target, aided SII and RMSE for percutaneous BCD fittings using the DSL-BCD v1.1 procedure. Similar to the relationship between SII and 4PTA, greater RMSE associated with worsening cochlear loss was expected. The analysis underscored the complex interplay between in-situ BC thresholds, frequency-specific target matches, and overall RMSE offering insights into the nuances of BCD fitting practices. Multiple regression was used to assess if BCD characteristics explained additional portions of the variance. The MFO measured on the skull-simulator led to higher aided SII, with an overall small effect size. This confirms again that MFO remains one of the most important BCD characteristics, where higher MFO contributes to counteract the negative impact of worsening degrees of cochlear hearing loss on aided SII.
Increasing trends of under-amplification were noted as the degree of hearing loss increased, as well as within the high frequencies. Secondary analysis, performed without participants' involvement, aiming to match targets showed that BCD could be within 5 dB RMSE for 80% of the sample, suggesting that the fitting falling below targets in this study was likely related to signal processing limitations and/or patient preferences. By adopting an exploratory approach akin to air-conduction hearing aid research, we offer data that can assist clinicians in evaluating the typicality of their BCD fittings. As the field progresses toward standardized objective verification, further research is essential to enhance our understanding of fitting characteristics on BCD users' outcomes, preferences, and performance.
Data availability statement
The datasets presented in this article are not readily available because please contact authors. Requests to access the datasets should be directed to YWdhc2NvbkB1YWxiZXJ0YS5jYQ==.
Ethics statement
The studies involving humans were approved by Health Research Ethics Board of the University of Alberta. The studies were conducted in accordance with the local legislation and institutional requirements. Written informed consent for participation was not required from the participants or the participants' legal guardians/next of kin in accordance with the national legislation and institutional requirements.
Author contributions
AG: Conceptualization, Data curation, Formal analysis, Investigation, Methodology, Project administration, Validation, Writing – original draft, Writing – review & editing. MB: Conceptualization, Methodology, Project administration, Supervision, Writing – original draft, Writing – review & editing. SS: Conceptualization, Methodology, Project administration, Supervision, Writing – original draft, Writing – review & editing. CC: Data curation, Writing – original draft, Writing – review & editing. WH: Conceptualization, Formal analysis, Investigation, Methodology, Project administration, Resources, Supervision, Validation, Writing – original draft, Writing – review & editing.
Funding
The author(s) declare that financial support was received for the research and/or publication of this article. Portions of this work were funded by Mitacs Accelerate IT23477 - Hodgetts.
Acknowledgments
The authors want to acknowledge the contribution of Jacqueline Cummine and Daniel Aalto for their support in regression analyzes.
Conflict of interest
The authors declare that the research was conducted in the absence of any commercial or financial relationships that could be construed as a potential conflict of interest.
Generative AI statement
The author(s) declare that no Gen AI was used in the creation of this manuscript.
Any alternative text (alt text) provided alongside figures in this article has been generated by Frontiers with the support of artificial intelligence and reasonable efforts have been made to ensure accuracy, including review by the authors wherever possible. If you identify any issues, please contact us.
Publisher's note
All claims expressed in this article are solely those of the authors and do not necessarily represent those of their affiliated organizations, or those of the publisher, the editors and the reviewers. Any product that may be evaluated in this article, or claim that may be made by its manufacturer, is not guaranteed or endorsed by the publisher.
References
Alberta College of Speech-Language Pathologists and Audiologists (2021). Protocol: Pediatric Amplification. Available online at: https://www.acslpa.ca/wp-content/uploads/2023/03/2025-02-12_Pediatric-Amplification-Protocol_Final.pdf (Accessed May 7, 2025).
American National Standards Institute (1997). Methods for Calculation of the Speech Intelligibility Index (ANSI S3.5-1997). New York, NY: American National Standards Institute.
American Speech-Language-Hearing Association (2022). Degree of Hearing Loss. Available online at: https://www.asha.org/public/hearing/degree-of-hearing-loss/?srsltid=AfmBOoreuoVOeM7cx_7HXAIjVKqUg5GN3c6ycoOf4HFqQsj8LvQeHBj9 (Accessed January 1, 2024).
Amlani, A. M., Punch, J. L., and Ching, T. Y. C. (2002). Methods and applications of the audibility index in hearing aid selection and fitting. Trends Amplif. 6, 81–129. doi: 10.1177/108471380200600302
Audiology Practice Standards Organization (2021). Hearing Aid Fitting Standard for Adult and Geriatric Patients. Audiology Practice Standards Organization.
Baker, S., and Jenstad, L. (2017). Matching real-ear targets for adult hearing aid fittings: NAL-NL1 and DSL v5.0 prescriptive formulae. Can. J. Speech-Lang. Pathol. Audiol. 41, 227–235.
Carlsson, P. U., and Håkansson, B. E. V. (1997). The bone-anchored hearing aid: reference quantities and functional gain. Ear Hear. 18, 34–41. doi: 10.1097/00003446-199702000-00004
Cohen, J. (1988). Statistical Power Analysis for the Behavioral Sciences. 2nd Edn. Lawrence Erlbaum Associates.
Dao, A., Folkeard, P., Baker, S., Pumford, J., and Scollie, S. (2021). Fit-to-targets and aided speech intelligibility index values for hearing aids fitted to the DSL v5-adult prescription. J. Am. Acad. Audiol. 32, 90–98. doi: 10.1055/s-0040-1718707
Dumper, J., Hodgetts, B., Liu, R., and Brandner, N. (2009). Indications for bone-anchored hearing aids: a functional outcomes study. J. Otolaryngol.- Head Neck Surg. 38, 96–105.
Gascon, A., Ostevik, A. V., Huynh, T., and Hodgetts, W. E. (2022). Which threshold do we trust? A comparison of threshold measurements in adult bone-conduction device users and normal hearing adults. Hear. Res. 421:108491. doi: 10.1016/j.heares.2022.108491
Glista, D., O'Hagan, R., Van Eeckhoutte, M., Lai, Y., and Scollie, S. (2020). The use of ecological momentary assessment to evaluate real-world aided outcomes with children. Int. J. Audiol. 60, S68–S78. doi: 10.1080/14992027.2021.1881629
Hodgetts, W. E., Scollie, S., and Swain, R. (2006). Effects of applied contact force and volume control setting on output force levels of the BAHA® Softband. Int. J. Audiol. 45, 301–308. doi: 10.1080/14992020600582133
Hodgetts, W. E., and Scollie, S. D. (2017). DSL prescriptive targets for bone conduction devices: adaptation and comparison to clinical fittings. Int. J. Audiol. 56, 521–530. doi: 10.1080/14992027.2017.1302605
Hornsby, B. W. Y. (2004). The speech intelligibility index: what is it and what's it good for? Hear. J. 57, 10–17. doi: 10.1097/00025572-200410000-00003
Jorgensen, L. E. (2016). Verification and validation of hearing aids: Opportunity not an obstacle. J. Otol. 11, 57–62. doi: 10.1016/j.joto.2016.05.001
Killion, M. C., and Mueller, H. G. (2010). Twenty years later: a NEW count-the-dots method. Hear. J. 63, 10–17. doi: 10.1097/01.HJ.0000366911.63043.16
McCreery, R. (2015). Do hearing aids support language development in children with hearing loss?. Hear. J. 69, 8–9. doi: 10.1097/01.HJ.0000483268.77569.b5
McCreery, R. W., Bentler, R. A., and Roush, P. A. (2013). Characteristics of hearing aid fittings in infants and young children. Ear Hear. 34, 701–710. doi: 10.1097/AUD.0b013e31828f1033
McCreery, R. W., and Stelmachowicz, P. G. (2011). Audibility-based predictions of speech recognition for children and adults with normal hearing. J. Acoust. Soc. Am. 130, 4070–4081. doi: 10.1121/1.3658476
McCreery, R. W., Walker, E. A., Stiles, D. J., Spratford, M., Oleson, J. J., and Lewis, D. E. (2020). Audibility-based hearing aid fitting criteria for children with mild bilateral hearing loss. Lang. Speech Hear. Serv. Schls. 51, 55–67. doi: 10.1044/2019_LSHSS-OCHL-19-0021
Moodie S. T. F. Network of Pediatric Audiologists of Canada Scollie, S. D. Bagatto M. P. Keene K. (2017). Fit-to-targets for the desired sensation level version 5.0a hearing aid prescription method for children. Am. J. Audiol. 26, 251–258. doi: 10.1044/2017_AJA-16-0054
Polonenko, M. J., Scollie, S. D., Moodie, S., Seewald, R. C., Laurnagaray, D., Shantz, J., et al. (2010). Fit to targets, preferred listening levels, and self-reported outcomes for the DSL v5.0a hearing aid prescription for adults. Int. J. Audiol. 49, 550–560. doi: 10.3109/14992021003713122
Scollie, S., Folkeard, P., Pumford, J., Abbasalipour, P., and Pietrobon, J. (2022). Venting corrections improve the accuracy of coupler-based simulated real-ear verification for use with adult hearing aid fittings. J. Am. Acad. Audiol. 33, 277–284. doi: 10.1055/a-1808-1275
Scollie, S., Levy, C., Pourmand, N., Abbasalipour, P., Bagatto, M., Richert, F., et al. (2016). Fitting noise management signal processing applying the american academy of audiology pediatric amplification guideline: verification protocols. J. Am. Acad. Audiol. 27, 237;251. doi: 10.3766/jaaa.15060
Scollie, S., Seewald, R., Cornelisse, L., Moodie, S., Bagatto, M., Laurnagaray, D., et al. (2005). The desired sensation level multistage input/output algorithm. Trends Amplif. 9, 159–197. doi: 10.1177/108471380500900403
Scollie, S. D. (2008). Children's speech recognition scores: the speech intelligibility index and proficiency factors for age and hearing level. Ear Hear. 29, 543–556. doi: 10.1097/AUD.0b013e3181734a02
Seewald, R., Moodie, S., Scollie, S., and Bagatto, M. (2005). The DSL method for pediatric hearing instrument fitting: historical perspective and current issues. Trends Amplif. 9, 145–157. doi: 10.1177/108471380500900402
Seewald, R. C., Moodie, K. S., Sinclair, S. T., and Scollie, S. D. (1999). Predictive validity of a procedure for pediatric hearing instrument fitting. Am. J. Audiol. 8, 143–152. doi: 10.1044/1059-0889(1999/017)
Sherbecoe, R. L., and Studebaker, G. A. (2003). Audibility-index predictions of normal-hearing and hearing-impaired listeners' performance on the connected speech test. Ear Hear. 24, 71–88. doi: 10.1097/01.AUD.0000052748.94309.8A
Snik, A. F. M., and Hombergen, G. C. H. J. (1993). Hearing aid fitting of preschool and primary school children: an evaluation using the insertion gain measurement. Scand. Audiol. 22, 245–250. doi: 10.3109/01050399309047476
Snik, A. F. M., and Stollman, M. H. P. (1995). Measured and calculated insertion gains in young children. Br. J. Audiol. 29, 7–11. doi: 10.3109/03005369509086580
Sun, L., Ping, L., Fan, X., Wang, J., and Chen, X. (2024). Simulator verification is potentially beneficial for the fitting of softband bone conduction hearing devices in young children. Otol. Neurotol. 45, e500–e508. doi: 10.1097/MAO.0000000000004245
Valente, M., Harvey, A., Darcy, B., Theresa, C., Dave, C., Dennis, H., et al. (2006). Guidelines for the audiologic management of adult hearing impairment. Audiol. Today 18, 32–36.
Van Eeckhoutte, M., Folkeard, P., Glista, D., and Scollie, S. (2020). Speech recognition, loudness, and preference with extended bandwidth hearing aids for adult hearing aid users. Int. J. Audiol. 59, 780–791. doi: 10.1080/14992027.2020.1750718
Voss, A., Brockmeyer, A., Valente, M., Pumford, J., Wick, C. C., and Durakovic, N. (2021). Differences in force levels, word recognition in quiet, sentence reception threshold in noise, and subjective outcomes for a bone-anchored hearing device programmed using manufacturer first-fit, aided sound-field thresholds and programmed to DSL-BCD using a skull simulator. J. Am. Acad. Audiol. 32, 395–404. doi: 10.1055/s-0041-1730412
Keywords: DSL-BCD, verification, bone-conduction hearing, bone-conduction amplification, SII, hearing implant
Citation: Gascon A, Bagatto M, Scollie S, Cowan C and Hodgetts W (2025) Clinical evaluation of DSL-BCD fittings: assessing output-to-targets for percutaneous bone conduction devices in practice. Front. Audiol. Otol. 3:1714575. doi: 10.3389/fauot.2025.1714575
Received: 27 September 2025; Revised: 07 November 2025;
Accepted: 18 November 2025; Published: 11 December 2025.
Edited by:
Mehdi Abouzari, University of California, Irvine, United StatesReviewed by:
Kristi Oeding, Minnesota State University, Mankato, United StatesPey-Yu Chen, Mackay Memorial Hospital, Taiwan
Copyright © 2025 Gascon, Bagatto, Scollie, Cowan and Hodgetts. This is an open-access article distributed under the terms of the Creative Commons Attribution License (CC BY). The use, distribution or reproduction in other forums is permitted, provided the original author(s) and the copyright owner(s) are credited and that the original publication in this journal is cited, in accordance with accepted academic practice. No use, distribution or reproduction is permitted which does not comply with these terms.
*Correspondence: Alex Gascon, YWdhc2NvbkB1YWxiZXJ0YS5jYQ==