 Jack McLachlan
 Simon R. Cox2
 Maria del C. Valdés Hernández
- 1College of Medicine and Veterinary Medicine, University of Edinburgh, Edinburgh, United Kingdom
- 2Department of Psychology, University of Edinburgh, Edinburgh, United Kingdom
- 3School of Geosciences, University of Edinburgh, Edinburgh, United Kingdom
- 4Centre for Clinical Brain Sciences, University of Edinburgh, Edinburgh, United Kingdom
Background: Now more than ever before, air pollution and cognitive decline are global concerns. Credible links are now emerging between exposure to specific pollutants and cognitive decline. However, the role of specific pollutants on different cognitive domains in adults are inconclusive as the pathways to cognitive decline remain poorly understood.
Objective: To systematically review and meta-analyse the evidence for the association between long-term air pollution exposure and cognitive function in adults.
Data sources: Web of Science, PubMed, Embase searched up to February 2021 with no language restrictions. Individual studies were identified from similar review articles.
Eligibility criteria: Studies investigating the long-term (>3 years) associations between airborne pollutants and cognitive function in older adults (>50 years old).
Results: From 1996 records, 26 satisfied the inclusion criteria. The total sample size included over 2.4 million (53.8% female) subjects with ages ranging from 45 to 100 years (estimated mean age 70 years). Only 18/26 publications included both male and female subjects. Pollutants reported included particulate matter ≤2.5 µm (PM2.5); particulate matter ≤10 µm (PM10); nitrogen dioxide (NO2); nitrogen oxide species (NOx) and ozone (O3). Papers showed great variance in their study characteristics, air pollution modelling methodology and assessment of cognitive domain. Long-term exposure to increased levels of PM2.5 and NO2 were most strongly associated with increased risk of dementia. Decline in cognitive function, executive function, memory and language were most strongly associated with greater exposure to PM2.5, PM10 and NO2 to varying degrees.
Conclusion: An increasing number of studies are supporting the hypothesis that greater exposure to air pollutants is associated with decline in cognitive functions.
Introduction
Normal ageing, mild cognitive impairment and dementia
The rate of age-related decline in mental ability shows significant heterogeneity among older adults, resulting in a large spectrum of what we would consider “normal” brain ageing (1). The latest review of dementia and cognitive decline published by Age UK divides brain function into 3 types: automatic functions [for example breathing, digestion and homeostasis]; motor function [encompassing movement, balance and speech]; and cognitive function [thoughts, emotions, learning, memory, comprehension and decision making] (2). Healthy decline of cognitive function in older people is a concept unconsciously but unanimously accepted and is well summarised by Harada et al. (3).
Defining MCI is more challenging due to a lack of standardised diagnostic criteria (4). It is generally accepted as the intermediate state between healthy ageing and dementia whereby a person experiences dementia-like symptoms such as memory loss, but these symptoms are not severe enough to significantly interfere with daily life. Estimating the prevalence, incidence and social burden of MCI is complex (5). However, it is believed 5%–20% of adults over 65 have MCI (6).
Statistics released by the WHO in 2020 approximate that 5%–8% of adults aged 60 and over have dementia, equating to around 50 million people worldwide, 60% of whom live in low- and middle-income countries (7). This number is projected to increase to 82 million by 2030 and 152 million by 2050. Whilst this is largely attributable to the globally ageing population, the fact that dementia is currently ranked at the seventh leading cause of death highlights the need for preventative action (8).
Air pollution
Air pollution is estimated to kill nearly 6.5 million people annually, being the largest environmental factor globally (9), and is a leading risk factor for mortality (10). In 2017, the global burden of disease of air pollution was measured at 147 million DALYs. Exposure to polluted air is a global crisis with over 90% of the world's population still living in areas where air quality levels exceed WHO limits (11). The highest concentrations of air pollution and indeed its burden of disease are recorded in low- and middle-income countries (10), and are also a key factor in terms of social inequalities outcomes in UK (12). Furthermore, older adults and children are thought to be more vulnerable to the effects of noxious pollutants (13).
Cognitive decline, dementia and air pollution
A number of conceivable biological mechanisms exist to explain how pollutants may damage cognitive health. More is known about the toxic effects air pollution can have on respiratory and cardiovascular health but recently studies suggest they both may facilitate cognitive impairment. Hüls et al. (14) describe how lung function partially mediated visuo-construction performance. Meanwhile, Saito et al. (15) highlight the interrelationship between AD and CVD risk factors and the potential role of β-amyloid. Alternatively, inhaled pollutants, particularly those of smaller aerodynamic diameters, may access the brain directly via the olfactory bulb (16). At a cellular level, Zhang et al. (17) reported PM2.5 triggered oxidative stress and myelin sheath degradation in murine models. Additionally, Woodward et al. (18) suggested pollutants activate the transmembrane protein toll-like receptor 4, which is involved in inflammatory signalling. Like other cerebrovascular risk factors, the harmful effects of air pollution likely accumulate over a lifetime. Greater exposure to PM2.5 has been linked to neuroinflammation, altered immune responses and accumulation of amyloid β-42 and α-synuclein in the brains of children and young adults in Mexico City (19), and the likely mechanisms of its neurological effects including neurodegeneration, are reviewed in Olasehinde and Olaniran (20).
A 2019 report released by the Alzheimer's Society outlined the possible link between air pollution and dementia (21). Similarly, a 2017 Lancet commission included air pollution as a potential risk factor for dementia (22). Nevertheless, a direct causal link has yet to be proven and neither air pollution nor pollution in general were mentioned in the most recent global action plan on dementia (23). The length of clinical trial needed to ascertain the effect of air pollution on cognitive function is unattainable; therefore, longitudinal observation studies are likely to provide the best evidence. Ambient polycyclic aromatic hydrocarbons negatively affect different cognitive functions throughout the lifespan, with general memory being mostly affected in older adults (24). Various reviews have summarised the increasing body of evidence that suggests long-term exposure to air pollution is associated with increased risk of dementia and cognitive decline (25–29). However, only one comprising evidence until 2018 conducted a systematic search (26), and did not meta-analyse the data. We conducted a systematic review of the sources published until 2021 and a meta-analysis on the differential impact of specific air pollutants [PM2.5, PM10, NO2, NOx and O3] on cognitive functions specifically in the elderly. Pollutants have explicit sources (30). Comparing the severity by which each pollutant negatively affects cognitive functions will allow public health bodies to prioritise the most harmful pollutants; and in turn, tackle their sources.
Methods
Databases, sources and searches
The databases Web of Science, PubMed and Embase were searched from inception up to the 6th of February 2021. Each database was subject to three different search strategies:
1. (air pollution) AND inflamm* AND brain
2. (air pollution) AND brain AND cogn*
3. (air pollution) AND brain AND (dementia OR Alzheimer*)
The title and abstract for all records were screened and any duplicates were removed. Each paper was evaluated against the inclusion and exclusion criteria set out below. Additional appropriate papers were identified using the bibliographies of the included studies as well as relevant review articles.
Inclusion criteria
Primary studies with:
• Assessment of exposure to air pollution explained in the Methods section;
• Assessment of cognitive function reflected in outcome measures evaluated in relation to any air pollutant;
• Cohort mean age >50 (clinically considered a middle-age reference). Although no restrictions are imposed to the age range, it is worth noting that cognitive ageing begins in the 20s, and older age is often categorised as 60/65+ albeit variations depend on location, circumstances, etc., so a study including younger (i.e., close to or above 20 years old) individuals is included as long as the mean age of the whole sample is above 50 years old;
• Minimum exposure time of at least 3 years, being 36 months the upper limit for considering exposure to outdoor air pollutants as short-term.
Exclusion criteria
• Studies using non-human subjects;
• Studies reporting non-primary research i.e., review articles;
• Studies where full text was inaccessible (i.e., this considered for reproducibility purposes).
Data were extracted using standard extraction tables. Information collected included: sample size, study characteristics, gender ratio, mean age, age range, cardiovascular comorbidities, air pollutant component, pollutant modelling method, exposure time and cognitive-related outcome measure.
Risk of bias
Each individual study included was assessed for risk of bias across four parameters: generalisabilty, exposure measurement, outcome measurement, and adjustment for confounders.
Generalisability
Low risk of bias in terms of generalisability was defined as a source with a sample size greater than 1,000 that included both sexes and had an age range of over 10 years. Additionally, although inclusion criteria varied considerably amongst the primary sources, studies that used more than one cognitive function test at baseline were considered low risk.
Exposure assessment
Outlining the accuracy of pollutant exposure modelling is difficult as a diverse range of methods exist and often air quality data is estimated. A study was considered low risk of bias if authors used a minimum standard method to assess exposure. An example of a “minimum standard” method is land-use regression models described by the European Study of Cohorts for Air Pollution Effects (31). Atmospheric models using emissions data would be preferable.
Assessment of outcomes
The definition of cognitive function is not universal and therefore multiple techniques are used to investigate it. Studies that employed appropriate tools and criteria to assess dementia or distinct cognitive functions were considered having low risk of bias in assessing outcomes. An example of an appropriate tool is the neuropsychological test battery of CERAD Neuropsychological Assessment Battery (32), noting that the mini-mental state examination (MMSE) results alone may be considered insensitive for capturing normal-range differences in non-clinical samples.
Adjustment for confounders
When multiple models were reported, data were extracted from only the model that had adjusted for the most confounders (e.g., modifiable and non-modifiable vascular risk factors, socioeconomic status, ethnicity, family history of any neurodegenerative disease including dementia subtypes, etc.). Studies that identified and adjusted for five or more confounding factors were considered having low risk of bias in this regard.
Statistical analysis
Studies were firstly divided based on the air pollutant they reported on, and then scrutinised further depending on the cognitive domain they assessed. Cognitive domains/functions for this review were ascertained after analysing the reported data based on authors' own nomenclature. Any air pollutant or cognitive domain that was reported by fewer than five studies was governed insufficient to be included in the meta-analysis. HR, OR and β with 95% CI were used for the meta-analysis, which were conducted using MedCalc (https://www.medcalc.org/). Data is presented in tables and forest plot graphs to visualise the difference in reported effect sizes between studies. In instances where data was reported with a standard error [SE] measurement as opposed to a CI; the formula CI = mean ± SE × 1.96 was used in line with Altman et al. (33). For articles reporting β, or which provided data to calculate it, fixed effects were determined using a Fisher Z transformation of the β coefficients. The random effects model (34) general estimate was given after analysing heterogeneity using the I2 and Cochran's Q statistics (35). Results from each meta-analysis are provided in the Supplementary Material.
Results
Search results
A total of 1,996 records were identified using three separate search strategies (See Supplementary data spreadsheet). Removing duplicates left 866 unique studies. From these, 832 papers were excluded based on inclusion and exclusion criteria. The full-text screening of the remaining papers against the inclusion and exclusion criteria listed above yielded a total of 26 papers. A further paper was identified from individual records. Figure 1 shows the flow chart for study inclusion.
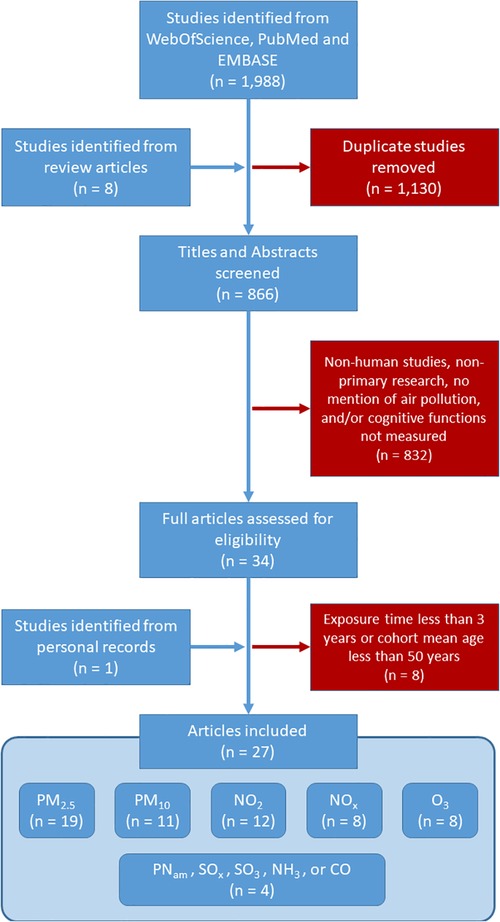
Figure 1. Literature search flow diagram. Duplicates made 56.8% of the titles from all three databases enquired. The final proportion of papers analysed were 76.5% of those which had the full text analysed, after excluding non-human studies and those who either did not mention the sources of air pollution or did not measure any cognitive function.
Study characteristics
Study characteristics are shown in Table 1. In total, over 2.4 million subjects, 53.8% of which are female, were included in the 26 studies. However, the geographical area covered is limited given the overlap in the samples. The sample from two studies (42, 43) was from Northern Manhattan, four studies (44, 46, 50, 51) used data from a USA-wide study on women's health, two studies analysed data from London (56, 57), three studies (37, 39, 40) analysed data from Ruhr and adjacent areas in Germany, three studies used data from the Taiwanese National Registry (47, 52, 60), one study used data from a multicentre ageing Korean study (36), and three studies used data from a municipality in northern Sweden (59, 61, 62). Nineteen papers included both male and female participants in their cohort. The age of participants ranged from 45 to 100 years with an estimated mean age of 70 years. Cardiovascular comorbidity data was extracted due to the well-described association between air pollution and vascular conditions (63). Median exposure time estimated across the sample was 10 years, with only 4/26 studies with relatively small samples analysing exposure for 20 years or more. These were Schikowski et al. (37) (789 individuals, 22-years exposure to NO2, NOx, PM2.5 and PM10), Ranft et al. (39) (399 individuals, 20-years exposure to PM10), Ailshire et al. (51) (779 individuals, approximately 23-years exposure to PM2.5), and Russ et al. (54) [572 individuals exposed to CO, NH3, NMVOC, NOx, PM2.5, and SOx for most of their lifetime (∼60 years)]. Only the studies from USA included ethnicity as covariate in the analyses or restricted the analysis to a certain ethnic group. For example, Paul et al. (45) only included latino (mainly Mexican-Americans) individuals, and Ailshire et al. (51) only included pure black and white individuals and not those with mixed race/ethnicity.
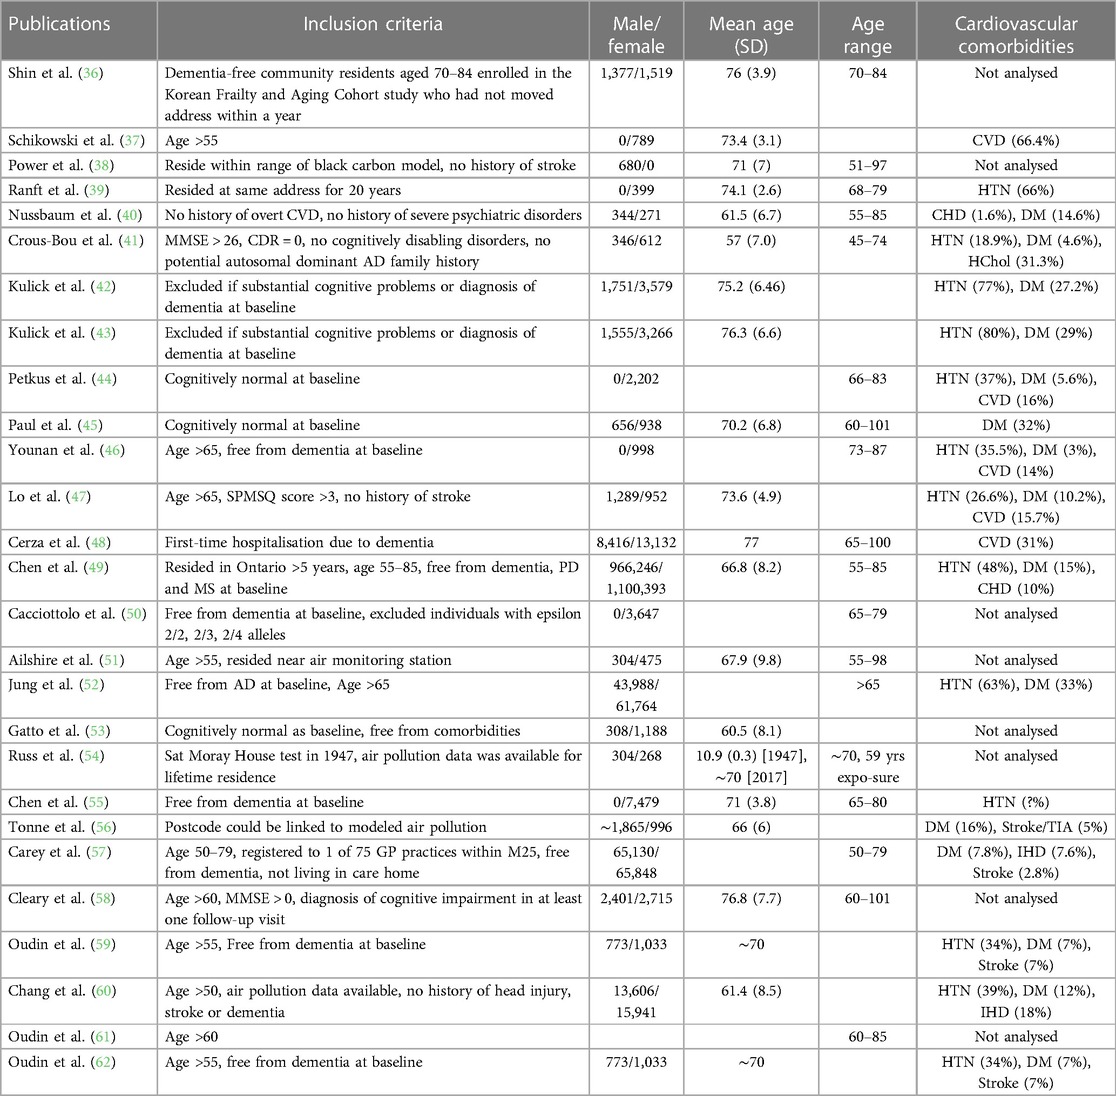
Table 1. Sample characteristics in the included studies.
Quality of the studies included
Risk of bias for the studies included can be seen in Table 2. In general the quality of the studies included was good and the risk of bias, as per the categories defined above, was low with only five studies been considered of moderate risk, mainly owed to the relatively small sample sizes and the use of not widely used tools for assessing the outcome, limiting the reproducibility of their findings.
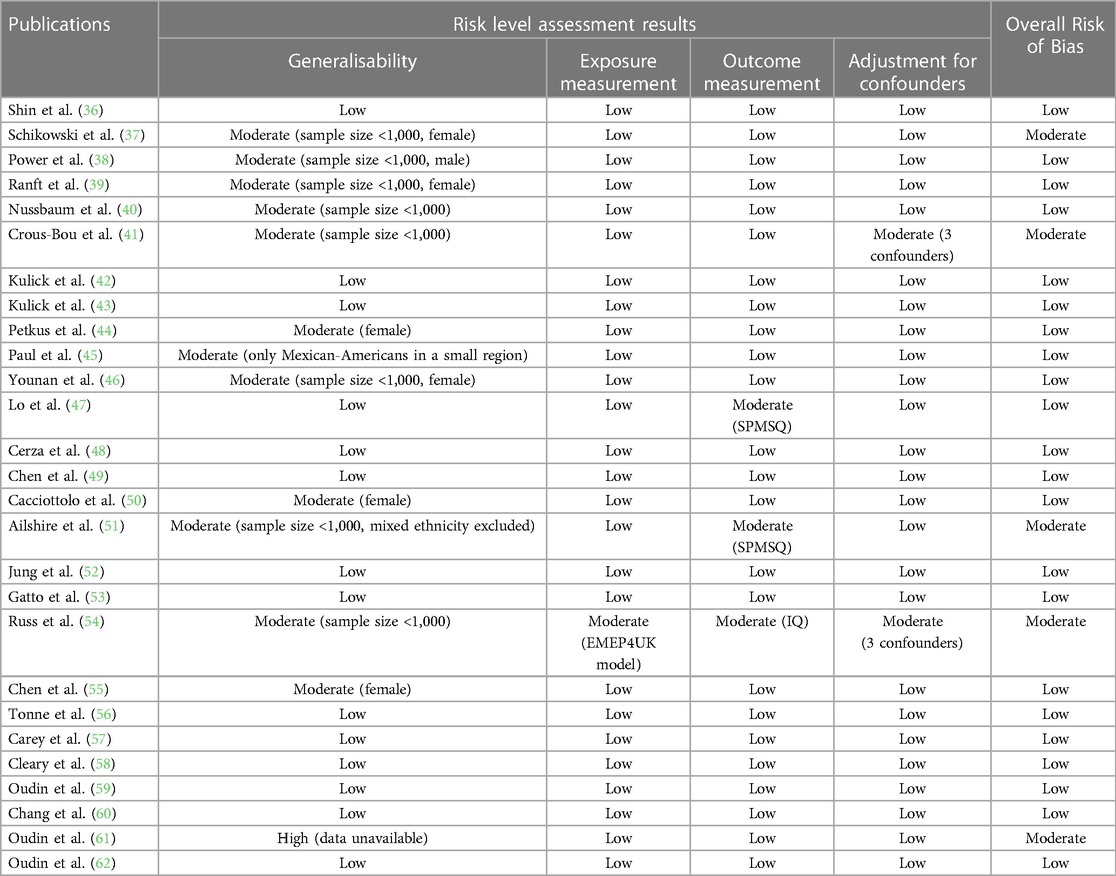
Table 2. Assessment of bias for the studies included.
Air pollutants
Table 3 shows the pollutant modelling method, pollution component, sources, geographical areas covered, and exposure time from the 27 included studies. PM2.5 was included in 19 studies, PM10 in 11, NO2 in 12, NOx in eight, and O3 in eight. Four of the studies included reported effects of other pollutants, but each of these (i.e., individually) were reported in less than three studies and ruled insufficient in data to be further meta-analysed. The included studies used a range of pollutant modelling methods, with refined land-use regression model being the prevalent (in 9/26 studies). Interpolation of data from local monitoring stations was used by four studies. Four other studies reported exposure assessment by constructing spatiotemporal models using Bayesian Maximum Entropy method. The remaining publications used less popular methods of exposure assessment. Exposure time ranged 3–60 years.
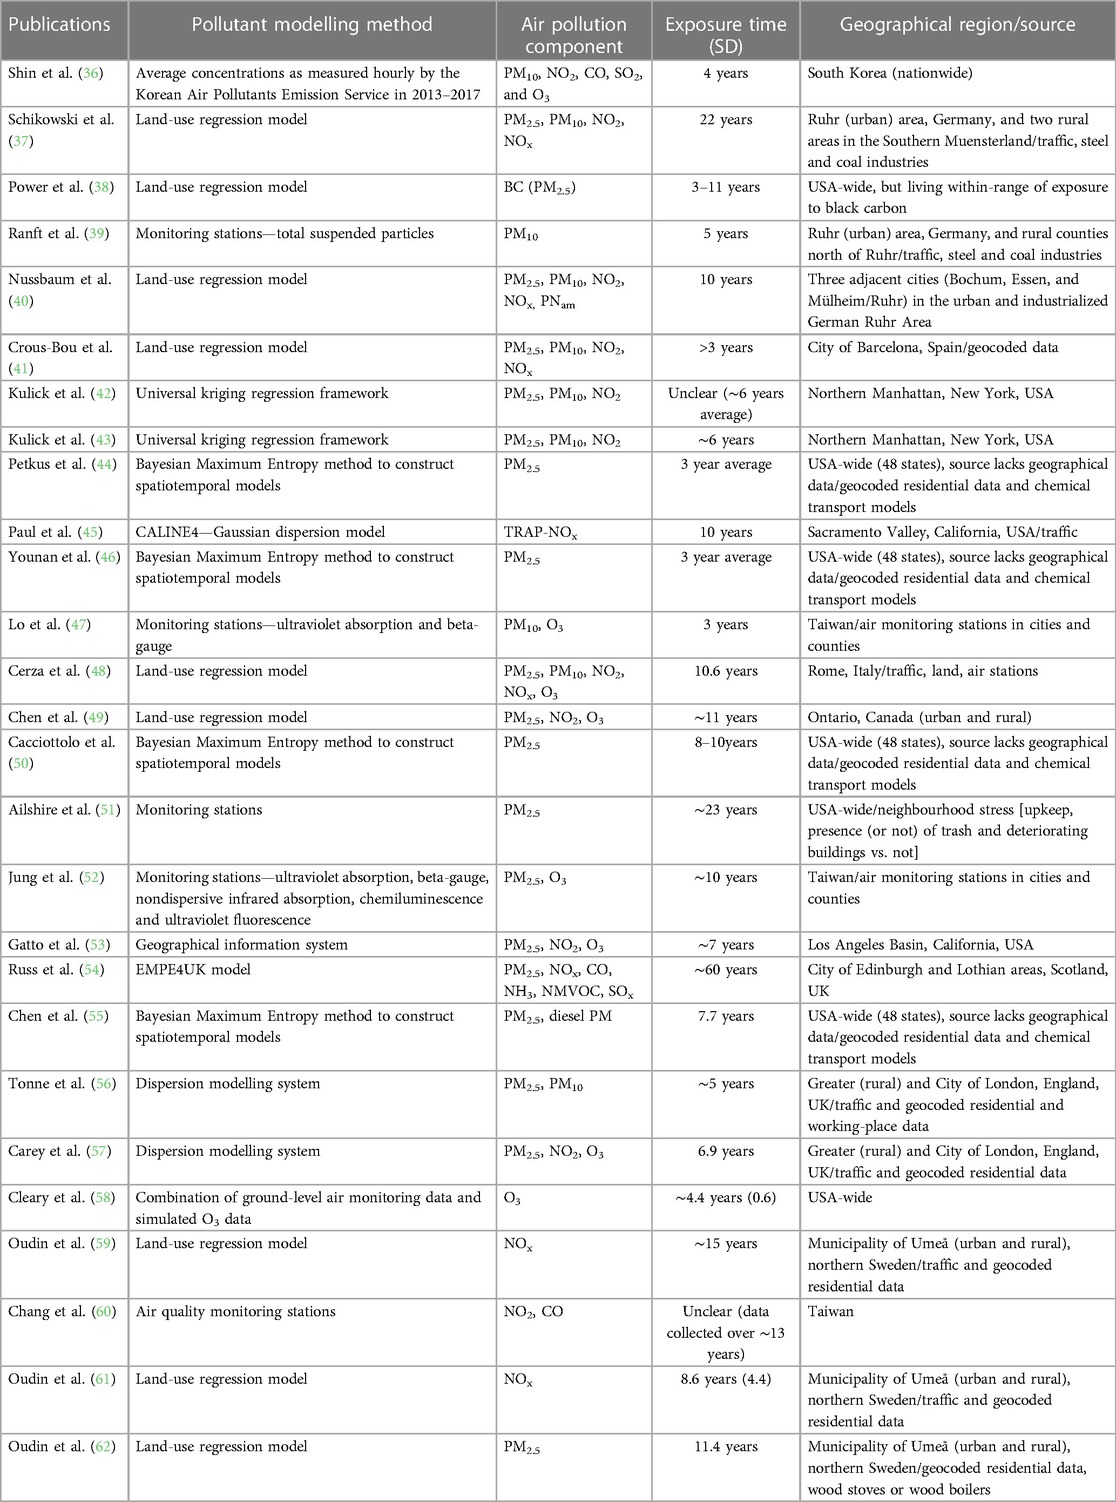
Table 3. Air pollutants analysed in the studies included.
Regarding pollution sources, only one study (51) analysed neighbourhood-stress-related pollution sources [i.e., neighbourhood upkeep, presence (or not) of trash, and deteriorating buildings vs. not], and another (38) focused on exposure to black carbon. Traffic as pollution source was considered in all studies, either directly or indirectly (i.e., considered within geocoded data).
Cognitive-related outcome measures
Table 4 displays the cognitive-related outcome measurements each paper used to assess dementia, executive function, cognitive function, memory and language. Seven articles reported incident dementia cases; one focused solely on incident AD; one used dementia hospitalisations and another combined both incident dementia and dementia hospitalisations. Seven of the papers used an internationally recognised definition of dementia: five referring to an edition (ninth or tenth) of the ICD and two implementing the DSM-IV. Cognitive functions were assessed using a variety of methods. For general cognition, three papers included the CERAD neuropsychological battery; four incorporated MMSE and three used results of assessment of other domains to form a cognition composite. Less consistency was seen in the assessment of the other three cognitive domains (i.e., executive function, memory and language).
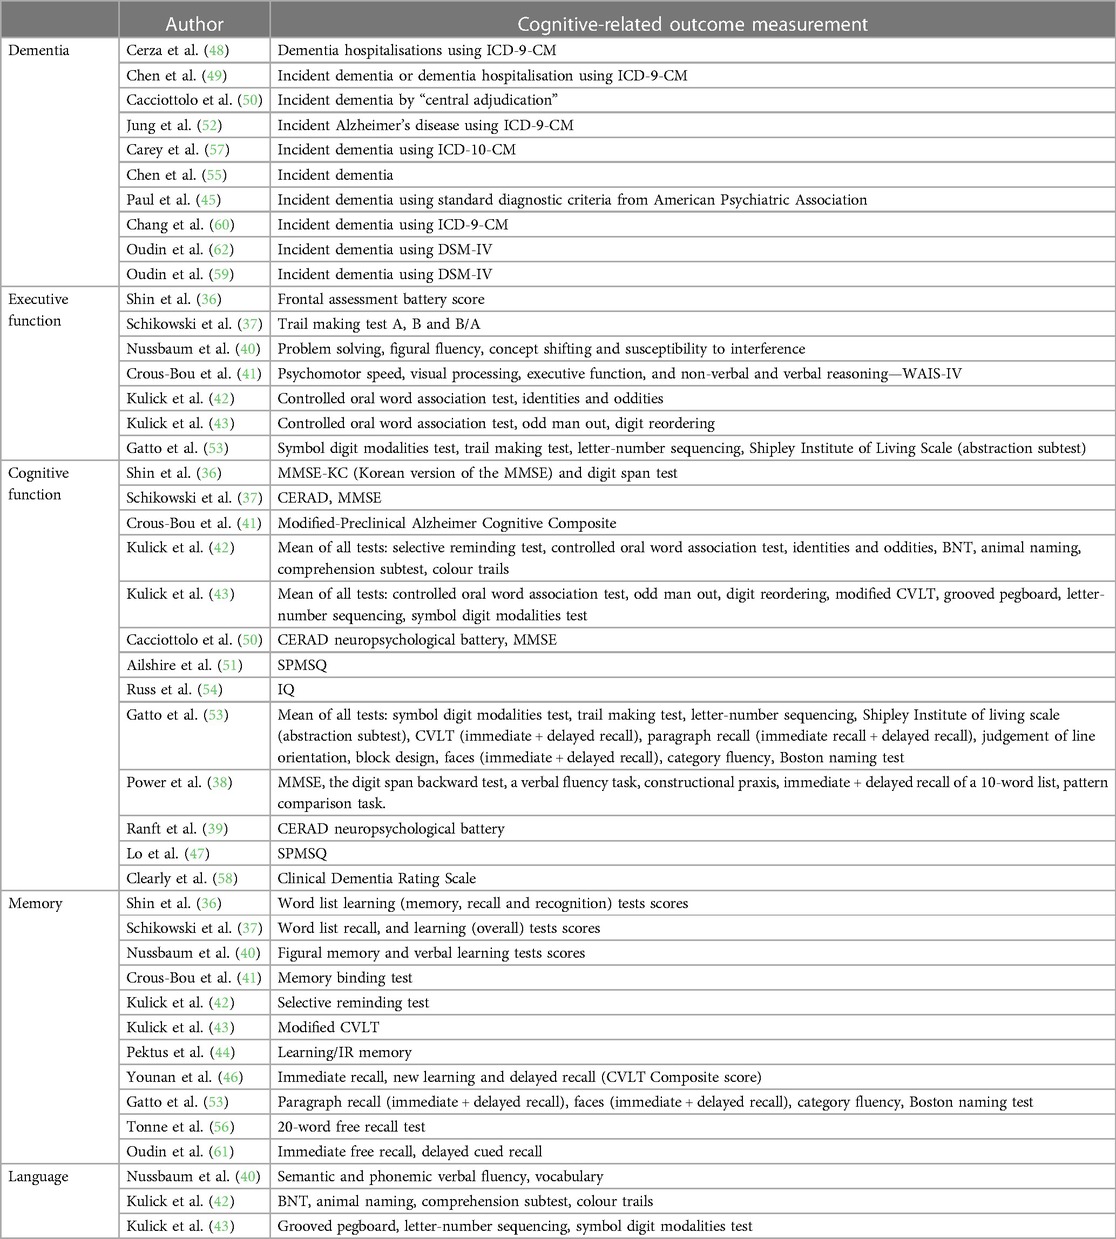
Table 4. Cognitive-related outcome measures of the studies included.
Association between pollutants and dementia
PM2.5
For PM2.5, as Figure 2 shows, four out of seven studies comprising 2,307,016 individuals, among whom the most relevant vascular comorbidity was hypertension (i.e., 45.88% were hypertensive), reported a significant association between increased exposure and an increased risk of dementia (49, 50, 52, 57).
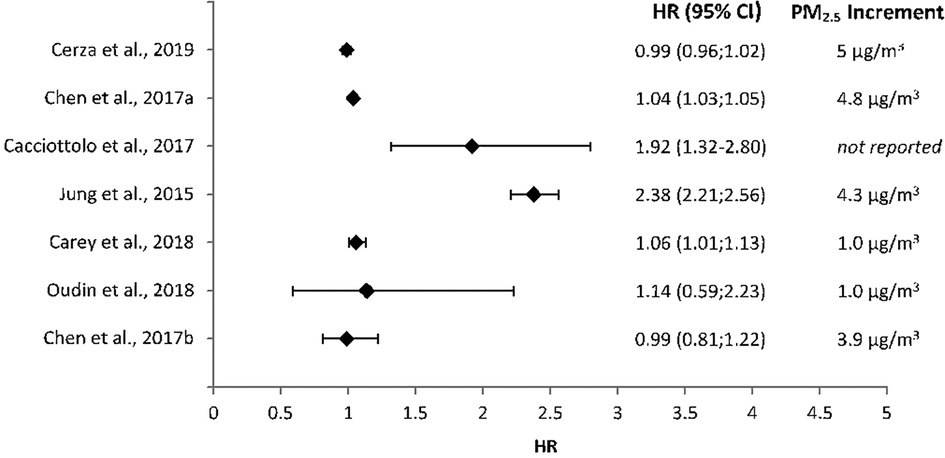
Figure 2. Forest plot of the effect of PM2.5 in dementia risk across all studies that evaluated their putative association, in terms of hazard ratios and their 95% confidence intervals.
Other pollutants
Fewer studies described the association between the other pollutants and dementia (Table 5). Three papers found a statistically significant increased risk of dementia with increasing exposure to NO2 (49, 57, 60). Paul et al. (45) reported rising levels of NOx to be associated with a significant increased risk of dementia. Four other papers discussed the impact of O3 on dementia risk; with two finding a positive association (48, 52).
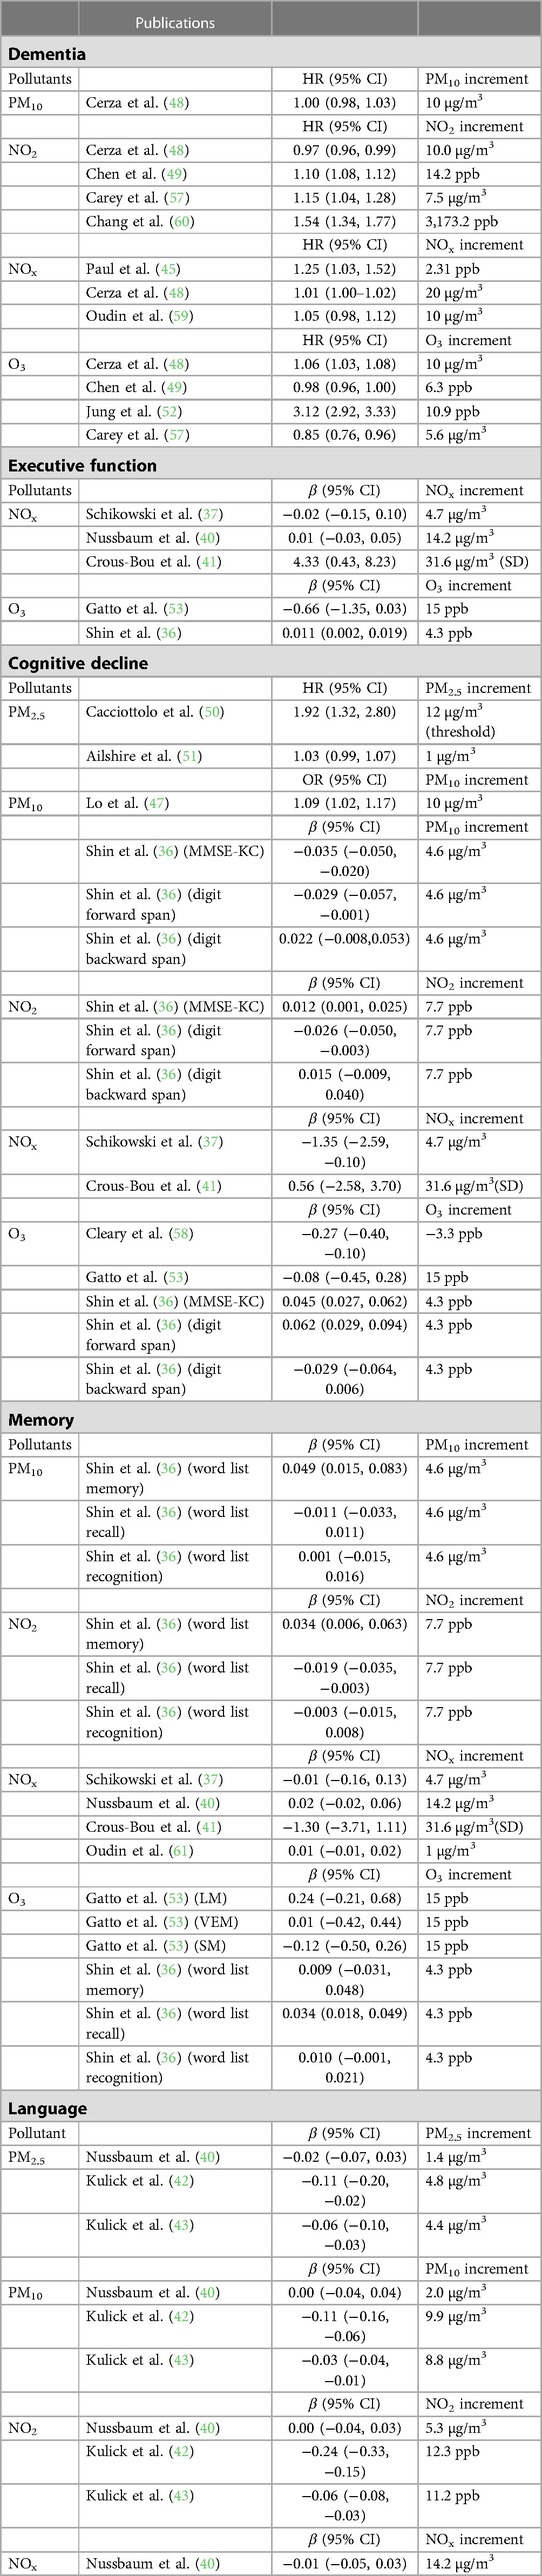
Table 5. Associations between long-term exposure to the different pollutants and cognitive functions or specific tests, reported by fewer than five studies, given either as hazard ratios or standardised beta coefficients, with 95% confidence intervals.
Association between pollutants and executive function
PM2.5
As Figure 3A illustrates, two of six papers reported a statistically significant decrease in executive function associated with increased levels of PM2.5 exposure (42, 43), but the samples of both publications had considerable overlap, as the Washington Heights Inwood Community Aging Project (WHICAP) provides data for both publications. Hence, these results are obtained from data from 5,330 residents in the northern Manhattan area of New York City. The total effect was small and not statistically significant (β = 0.0171, 95% CI [−0.745 to 0.108]).
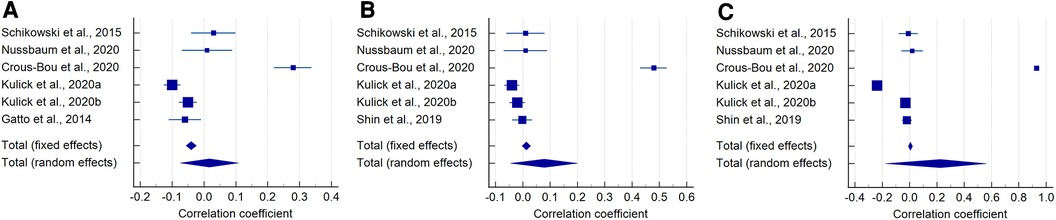
Figure 3. Forest plot of the effect of PM2.5 (A), PM10 (B), and NO2 (C) in executive function across all studies that evaluated their putative association.
PM10
For PM10, only one paper of six described a significant negative association between executive function and long term exposure (43) (Figure 3B). The total effect was small- to-moderate and not statistically significant (β = 0.0787, 95% CI [−0.0451 to 0.200]).
NO2
Seven papers discussed the impact of NO2 on executive function with little agreement found (Figure 3C). A negative association was described by the two papers from Kulick et al. (42) featuring 5,330 residents from northern Manhattan, and by Shin et al. (36) on 2,896 Korean older adults, whilst (41) reported a positive association from an analysis involving 958 Catalans participants in the ALzheimer and Families (ALFA) study. Although the total effect yielded a strong correlation coefficient (β = 0.225), it was not statistically significant (95% CI [−0.177 to 0.562]).
Other pollutants
The only other significant result described was by Crous-Bou et al. (41), who found a positive association between NOx and executive function (Table 5) in a study that uses data from 958 cognitively-normal individuals (MMSE > 26) from the City of Barcelona. The study concludes that urban environmental exposures, despite them being above the WHO annual guidelines, were not associated with cognitive performance, and suggests that the impact on executive function could be rather due to the environmental pollution effect on brain cortical thinning. The statistical analyses are adjusted for incidence of familial AD history, which is high in this cohort (84.7%), with 32.5% of the sample carrying the APOE ɛ4 allele.
Association between pollutants and general cognition
Statistically significant associations were mainly obtained from the two studies that used data from 5,330 residents in the northern area of Manhattan (42, 43), in measurements that combine a comprehensive battery of cognitive tests (Table 4), adjusted for individual (age, education, sex, race/ethnicity), neighbourhood sociodemographic variables (Census-based socioeconomic status z-score), and a cohort indicator to adjust for secular trends.
PM2.5
Three of seven papers reported an increasing PM2.5 level to have a significant negative impact on general cognition (38, 42, 43) (Figure 4A). But two (42, 43) use data from the same geographical area (i.e., northern Manhattan) and the other utilises a sample within-range of exposure to black carbon (38), which is a major contributor to PM2.5. The total effect was moderate, but statistically significant (β = −0.0899, 95% CI [−0.157 to −0.0224], P = 0.009).
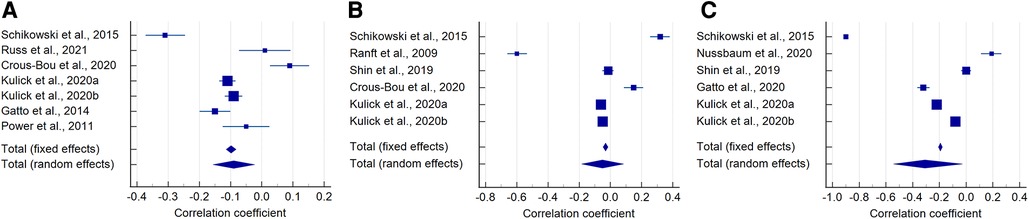
Figure 4. Forest plot of the effect of PM2.5 (A), PM10 (B), and NO2 (C) in general cognition across all studies that evaluated their putative association.
PM10
Three of six papers described a statistically significant negative association between PM10 and general cognition (36, 42, 43) (Figure 4B), while Lo et al. (47) obtained a relevant effect (OR = 1.09, 95% CI [1.02–1.17], Table 5). But overall, the total effect, although small-to-moderate, was not statistically significant (β = −0.0509, 95% CI [−0.185 to 0.0848]).
NO2
Similarly to PM10, the same authors also reported an increasing exposure to NO2 to have a significant negative association with cognitive function: Kulick et al. (42, 43), and Shin et al. (36), although in the latter this was only evident in one out of the three assessments of general cognition (i.e., the digit forward span test) (Figure 4C). The overall effect was strong and statistically significant (β = −0.308, 95% CI [−0.544 to −0.0274], P = 0.032).
Other pollutants and assessments of general cognitive function
Lo et al. (47) and Cacciottolo et al. (50) both reported an increased risk of cognitive decline with increasing levels of PM2.5 and PM10 respectively. Similarly, Schikowski et al. (37) and Cleary et al. (58) both revealed a negative association between cognitive function and NOx and O3 respectively (Table 5). The latter study also highlights the statistically significant association with traffic load in carriers of one or two APOE risk alleles (i.e., ɛ3, ɛ4). Shin et al. (36) found a positive association between O3 and the results from two (out of three) of the tests that assessed cognitive function (i.e., MMSE-KC and digit forward span), and a negative association of O3 and SO2, with the results from the digit backward span test (Table 5). Although the strengths of the associations in this relatively large study (n = 2,896) were small, it is worth nothing that they accounted for a large number of covariates, including age, sex, body mass index, smoking, alcohol intake, physical activity, education, household income, marital status, Carlson's comorbidity index, length of time at the same residence, meteorological data, and residence area, in addition to the average concentrations of each of the pollutants.
Association between pollutants and memory
PM2.5
A significant negative association between long-term exposure to PM2.5 and memory was described by only two of seven studies (43, 44) (Figure 5A). Therefore, the overall effect was not statistically significant (β = −0.279, 95% CI [−0.659 to 0.214]).
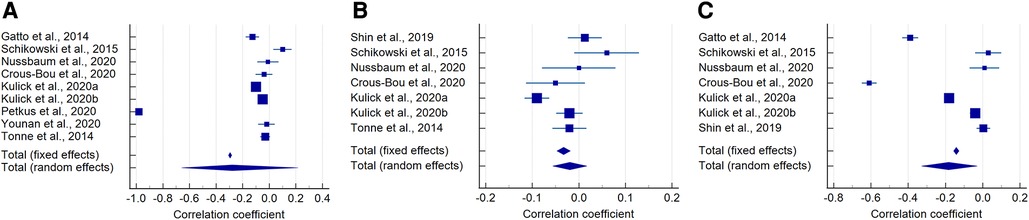
Figure 5. Forest plot of the effect of PM2.5 (A), PM10 (B), and NO2 (C) in memory across all studies that evaluated their putative association.
PM10
Just one of seven papers reported a significant negative association between memory and increasing PM10 exposure (43) (Figure 5B). The total effect was, as expected, also not statistically significant (β = −0.0194, 95% CI [−0.0562 to 0.0173]).
NO2
Four of seven studies found increasing NO2 exposure levels to be significantly negatively associated with memory (41–43, 53) (Figure 5C), from geographically distant samples in northern Manhattan, Los Angeles basin (both in opposite USA coasts), and the city of Barcelona in Spain. Shin et al. (36) obtained conflicting results all with small effects among the three tests that evaluated memory: word list memory, recall and recognition. Schikowski et al. (37) and Nussbaum et al. (40), both with the smallest samples within the group (n = 615 and n = 789 respectively), also obtained small and not statistically significant effects. Overall, the total effect between memory and NO2 exposure was moderate-to-strong and statistically significant (β = −0.183, 95% CI [−0.328 to −0.029], P = 0.019).
Other pollutants
No significant associations were found between memory and exposure to NOx or O3 (Table 5).
Association between pollutants and language
The two articles that used a sample from northern Manhattan also reported significant negative associations between the language domain and all three of PM2.5, PM10 and NO2 (42, 43) (Table 5).
Discussion
The present review meta-analyses data on long-term effect of environmental air pollutants in cognition in older adults, to inform environmental and developmental policies in an era of urbanisation and growth of the adult population. Evidence presented by the included studies suggested a link between long-term exposure to air pollutants, especially PM2.5 and NO2, and increased risk of dementia. Although tabulated and meta-analysed here for the first time, this is largely in congruence with existing literature. In a previous review (26), suggested increasing exposure to PM2.5, NO2 and NOx increased the risk of dementia. The adverse effect of PM2.5 in dementia, and, specifically in Alzhéimer's disease (AD) was also highlighted by Tsai et al. (64) in their meta-analysis, which also included sources that analysed short-term effects. Inflammation, oxidative stress, and microglial activation are implicated as key factors driving progressive neuron damage in AD. Although how the pathological neuroimmune process occurs remains a point of debate, the lung-brain axis hypothesis has shown encouraging results to answer this question. It holds that pulmonary response from inhaled pollutants causes circulating signals in serum, independent of traditional cytokines that elevate the neuroimmune response to augment central nervous system deterioration, process that is further augmented by age (65). For example, experimental animal studies have documented microglial activation due to diesel exhaustion (66) and O3 (65, 67) inhalation.
Although there is evidence to suggest exposure to all the pollutants analysed can have an adverse effect on cognitive functions independently, our results suggest the strongest link is seen with PM2.5 and NO2. For general cognition and memory, our results suggest a possible association between greater long-term exposure to these two pollutants and a decrease in both cognitive domains. Peters et al. (26) reported more ambiguous results from fewer sources, published until September 2018, covering effects from 1 to 15 years, and did not meta-analyse the data. Another relevant systematic review and meta-analysis (24) also obtained similar results, but it assesses the effect of ambient polycyclic aromatic hydrocarbons on cognitive functions in different lifetime periods of exposure combining different exposure times (i.e., not distinguishing between short and long-term exposure).
Our analyses could not confirm a correlation between the air pollutants analysed by the studies included and language or executive function. Although only three studies examined the effect of air pollution on language, the current evidence base suggests that again, long-term exposure to not only PM2.5 and NO2, but also to PM10, is negatively associated with language. But the studies that found this association are from the same geographical area, reported comparatively higher concentration of the air pollutants, and had a wider inclusion criteria, only excluding those with substantial cognitive problems or dementia diagnosis at baseline (42, 43). Whilst studies exploring O3 tended to point towards an increasing exposure causing a decrease in all cognitive domains, evidence was lacking and most results were not significant. Overall, pooled effects of the three main pollutants meta-analysed did not show statistically significant associations between them and executive function either.
Strengths and limitations
All similar reviews tend to have broader inclusion criteria, possibly as a result of the small body of evidence currently available, or focus on the effect of different confounds, for example, the income level in the affected areas (29). Only one, with differing methodology and inclusion/exclusion criteria, conducted a systematic search (26). This is the first systematic review and meta-analysis to look specifically at long-term air pollution exposure and cognition in older adults. Additionally, strict inclusion criteria combined with a thorough risk of bias analysis ensured only the most relevant and robust studies were included. Also, all outcome measures were standardised for meta-analysing the data, facilitating comparison and an objective assessment of the effects of the pollutants analysed in cognition in the elderly.
Aside from the publications that analyse dementia risk, which does indicate cognitive decline from an unknown baseline, most of the cognitive function measures are a conflation of differences in an unknown initial level and an unknown amount of age-related cognitive decline, the admixture of which is age moderated within a population. As age was adjusted for in all models from the publications analysed, it will be difficult to ascertain whether or not older adults are more susceptible to a larger effect/difference in cognitive ability due to exposure to the different pollutants. Despite the strengths of the present work mentioned above, the search strategy itself was somewhat limited due to time constraints and so although three popular databases were systematically searched, it is possible that other relevant publications not indexed in these databases were missed. Furthermore, assessing precise air pollution exposure, even when geocoded, is not an exact science and gives rise to limitations. For example, most pollutants (except ozone) will be highly spatially correlated and often implausible to separate effects. Therefore, our results must be interpreted with caution. Moreover, the sheer complexity in defining cognitive function and its domains combined with the plethora of tests that were used to examine them exposed incomparable data. Standardising increments of pollutant level as well as exploring the relationship between length of exposure and cognitive domains would make for more easily interpretable data.
The publications included are not representative of the most polluted countries and areas on the planet. Most publications were from the USA, followed by specific regions in Germany, Sweden, Spain, UK, and the isle of Taiwan. Highly populated countries and areas like mainland China, India, Mexico City with an increasing ageing population are not represented in the analysis. Entire continents like South America, Africa and Australia, are not represented, and neither are areas affected by ecological catastrophes that cause environmental pollution (e.g., wild fires). Global policies that foster research in these areas are, therefore, needed.
Conclusion and future work
Our results support a potential role for long-term exposure to air pollution and an increased risk of both dementia and cognitive function in the elderly. Further works are needed to improve exposure assessment—better specified pollution models and more geographically specific estimates that capture people's “activity spaces” (i.e., home/work/recreation/travel). Also, this review highlights the need for further understanding the interaction effects of environmental pollution and socioeconomic status and ethnicity in order to inform policies to improve the life of underserved population groups that may have greater susceptibility to environmental pollution. While this review suggests the most problematic pollutants are PM2.5 and NO2, the current evidence base requires strengthening before these associations are universally accepted. The global health burden of dementia and cognitive decline may be decreased if public health policies target to decrease air pollution levels, but further research will allow more specific recommendations to be made.
Author contributions
JMcL and MCVH equally participated in study conception, data extraction, data generation, data analysis, writing, revising and approving the manuscript SC and JP participated in data analysis, revising, editing and approving the manuscript.
Funding
JMcL is funded by the College of Medicine and Veterinary Medicine at The University of Edinburgh and MCVH is funded by The Row Fogo Charitable Trust (Grant No. BROD.FID3668413). The work was conducted at the Dementia Research Institute at the University of Edinburgh, which receives its funding from UK DRI Ltd Company No. 11045257|Charity No. 1179589, funded by the UK MRC, Alzheimer’s Society and Alzheimer’s Research UK. This work has been also supported by the EPSRC-funded project “Lifecourse of Place: how environments throughout life can support healthy ageing”, (Ref ES/T003669/1).
Conflict of interest
The author (MCVH) declared that they were an editorial board member of Frontiers, at the time of submission. This had no impact on the peer review process and the final decision.
The remaining authors declare that the research was conducted in the absence of any commercial or financial relationships that could be construed as a potential conflict of interest.
Publisher's note
All claims expressed in this article are solely those of the authors and do not necessarily represent those of their affiliated organizations, or those of the publisher, the editors and the reviewers. Any product that may be evaluated in this article, or claim that may be made by its manufacturer, is not guaranteed or endorsed by the publisher.
Supplementary material
The Supplementary Material for this article can be found online at: https://www.frontiersin.org/articles/10.3389/fenvh.2023.1205443/full#supplementary-material.
References
1. Kandel ER, Schwartz JH, Jessell TM, Siegelbaum SA, Hudspeth AJ. Principles of neural science. 5th ed. New York: McGraw Hill Medical (2013).
2. Ray S., Davidson S. (2014) Dementia and cognitive decline. Available at: https://www.ageuk.org.uk/globalassets/age-uk/documents/reports-and-publications/reports-and-briefings/health–wellbeing/rb_oct14_cognitive_decline_and_dementia_evidence_review_age_uk.pdf (Accessed March 21, 2021)
3. Harada CN, Natelson Love MC, Triebel KL. Normal cognitive aging. Clin Geriatr Med. (2013) 29(4):737–52. doi: 10.1016/j.cger.2013.07.002
4. Richardson C, Stephan BCM, Robinson L, Brayne C, Matthews FE. Two-decade change in prevalence of cognitive impairment in the UK. Eur J Epidemiol. (2019) 34:1085–92. doi: 10.1007/s10654-019-00554-x
5. Ward A, Arrighi HM, Michels S, Cedarbaum JM. Mild cognitive impairment: disparity of incidence and prevalence estimates. Alzheimers Dement. (2012) 8(1):14–21. doi: 10.1016/j.jalz.2011.01.002
6. Alzheimer’s Society (2021) Mild cognitive impairment: MCI. Available at: https://www.alzheimers.org.uk/about-dementia/types-dementia/mild-cognitive-impairment-mci (Accessed March 21, 2021)
7. WHO (2020) Dementia. Available at: https://www.who.int/news-room/fact-sheets/detail/dementia (Accessed March 21, 2021)
8. WHO (2020) The top 10 causes of death. Available at: https://www.who.int/news-room/fact-sheets/detail/the-top-10-causes-of-death (Accessed March 22, 2021)
9. Fuller R, Landrigan PJ, Balakrishnan K, Bathan G, Bose-O’Reilly S, Brauer M, et al. Pollution and health: a progress update. Lancet Planet Health. (2022) 6(6):e535–47. doi: 10.1016/S2542-5196(22)00090-0
10. Ritchie H., Roser M. (2017) Air pollution. Available at: https://ourworldindata.org/air-pollution (Accessed March 22, 2021)
11. WHO (2021) Ambient air pollution. Available at: https://www.who.int/teams/environment-climate-change-and-health/air-quality-and-health/ambient-air-pollution (Accessed March 22, 2021)
12. Davies S. (2018) Chief medical officer annual report 2017: health impacts of all pollution. Department of Health and Social Care. Independent Report. https://www.gov.uk/government/publications/chief-medical-officer-annual-report-2017-health-impacts-of-all-pollution-what-do-we-know (Accessed March 09, 2023)
13. Landrigan PJ, Fuller R, Acosta NJR, Adeyi O, Arnold R, Basu N, et al. The lancet commission on pollution and health. Lancet. (2018) 391(10119):462–512. doi: 10.1016/S0140-6736(17)32345-0
14. Hüls A, Vierkötter A, Sugiri D, Abramson MJ, Ranft U, Krämer U, Schikowski T. The role of air pollution and lung function in cognitive impairment. Eur Respir J. (2018) 51:2. doi: 10.1183/13993003.01963-2017
15. Saito S, Ihara M. Interaction between cerebrovascular disease and Alzheimer pathology. Curr Opin Psychiatry. (2016) 29(2):168–73. doi: 10.1097/YCO.0000000000000239
16. Calderón-Garcidueñas L, Franco-Lira M, Henríquez-Roldán C, Osnaya N, González-Maciel A, Reynoso-Robles R, et al. Olfactory dysfunction, olfactory bulb pathology and urban air pollution. Exp Toxicol Pathol. (2010) 62(1):91. doi: 10.1016/j.etp.2009.02.117
17. Zhang Q, Li Q, Ma J, Zhao Y. PM2.5 impairs neurobehavior by oxidative stress and myelin sheaths injury of brain in the rat. Environ Pollut. (2018) 242:994–1001. doi: 10.1016/j.envpol.2018.07.031
18. Woodward NC, Levine MC, Haghani A, Shirmohammadi F, Saffari A, Sioutas C, et al. Toll-like receptor 4 in glial inflammatory responses to air pollution in vitro and in vivo. J Neuroinflammation. (2017) 14(1):1–15. doi: 10.1186/s12974-017-0858-x
19. Calderón-Garcidueñas L, Solt AC, Henríquez-Roldán C, Torres-Jardón R, Nuse B, Herritt L, et al. Long-term air pollution exposure is associated with neuroinflammation, an altered innate immune response, disruption of the blood-brain barrier, ultrafine particulate deposition, and accumulation of amyloid β-42 and α-synuclein in children and young adults. Toxicol Pathol. (2008) 36(2):289–310. doi: 10.1177/0192623307313011
20. Olasehinde TA, Olaniran AO. Neurotoxicity of polycyclic aromatic hydrocarbons: a systematic mapping and review of neuropathological mechanisms. Toxics. (2022) 10(8):417. doi: 10.3390/toxics10080417
21. Kiely A. (2019) Report: is there a link between air pollution and dementia? Available at: https://www.alzheimers.org.uk/for-researchers/report-on-link-between-air-pollution-and-dementia (Accessed March 22, 2021)
22. Livingston G, Sommerlad A, Orgeta V, Costafreda SG, Huntley J, Ames D, et al. Dementia prevention, intervention, and care. Lancet. (2017) 390:2673–734. doi: 10.1016/S0140-6736(17)31363-6
23. WHO (2017) Global action plan on the public health response to dementia. Available at: https://apps.who.int/iris/bitstream/handle/10665/259615/9789241513487-eng.pdf;jsessionid=E5A6A03DA57BEC2C381D49D83706B728?sequence=1 (Accessed March 21, 2021)
24. Humphreys J, Valdés Hernández MDC. Impact of polycyclic aromatic hydrocarbon exposure on cognitive function and neurodegeneration in humans: a systematic review and meta-analysis. Front Neurol. (2023) 13:1052333. doi: 10.3389/fneur.2022.1052333
25. Delgado-Saborit JM, Guercio V, Gowers AM, Shaddick G, Fox NC, Love S. A critical review of the epidemiological evidence of effects of air pollution on dementia, cognitive function and cognitive decline in adult population. Sci Total Environ. (2021) 757:143734. doi: 10.1016/j.scitotenv.2020.143734
26. Peters R, Ee N, Peters J, Booth A, Mudway I, Anstey KJ. Air pollution and dementia: a systematic review. J Alzheimer’s Dis. (2019) 70(s1):S145–63. doi: 10.3233/JAD-180631
27. Kilian J, Kitazawa M. The emerging risk of exposure to air pollution on cognitive decline and Alzheimer’s disease—evidence from epidemiological and animal studies. Biomed J. (2018) 41(3):141–62. doi: 10.1016/j.bj.2018.06.001
28. Schikowski T, Altuğ H. The role of air pollution in cognitive impairment and decline. Neurochem Int. (2020) 136:104708. doi: 10.1016/j.neuint.2020.104708
29. Chandra M, Rai CB, Kumari N, Sandhu VK, Chandra K, Krishna M, et al. Air pollution and cognitive impairment across the life course in humans: a systematic review with specific focus on income level of study area. Int J Environ Res Public Health. (2022) 19(3):1405. doi: 10.3390/ijerph19031405
30. Raycaptiosus. (2020). Sources and effects of the 9 major air pollutants. Available at: https://soapboxie.com/social-issues/Sources-and-Effects-of-Major-Air-Pollutants-and-Their-Different-Pollution-Control-Systems#:∼:text=Sources%20and%20Effects%20of%20Carbon%20Monoxide%20as%20Air,%20%20Headaches%20%203%20more%20rows (Accessed March 24, 2021)
31. Eeftens M, Beelen R, de Hoogh K, Bellander T, Cesaroni G, Cirach M, et al. Development of land use regression models for PM2.5, PM2.5 absorbance, PM10 and PMcoarse in 20 European study areas; results of the ESCAPE project. Environ Sci Technol. (2012) 46(20):11195–205. doi: 10.1021/es301948k
32. Rossetti HC, Munro Cullum C, Hynan LS, Lacritz LH. The CERAD neuropsychologic battery total score and the progression of Alzheimer disease. Alzheimer Dis Assoc Disord. (2010) 24(2):138–42. doi: 10.1097/WAD.0b013e3181b76415
33. Altman DG, Bland JM. Standard deviations and standard errors. Br Med J. (2005) 331(7521):903. doi: 10.1136/bmj.331.7521.903
34. DerSimonian R, Laird N. Meta-analysis in clinical trials. Control Clin Trials. (1986) 7(3):177–88. doi: 10.1016/0197-2456(86)90046-2
35. Higgins JP, Thompson SG, Deeks JJ, Altmany DG. Measuring inconsistency in meta-analyses. Br Med J. (2003) 327(7414):557–60. doi: 10.1136/bmj.327.7414.557
36. Shin J, Han SH, Choit J. Exposure to ambient air pollution and cognitive impairment in community-dwelling older adults: the Korean frailty and aging cohort study. Int J Environ Res Public Health. (2019) 16(19):3767. doi: 10.3390/ijerph16193767
37. Schikowski T, Vossoughi M, Vierkötter A, Schulte T, Teichert T, Sugiri D, et al. Association of air pollution with cognitive functions and its modification by APOE gene variants in elderly women. Environ Res. (2015) 142:10–6. doi: 10.1016/j.envres.2015.06.009
38. Power MC, Weisskopf MG, Alexeeff SE, Coull BA, Spiro A III, Schwarts J. Traffic-related air pollution and cognitive function in a cohort of older men. Environ Health Perspect. (2011) 119(5):682–7. doi: 10.1289/ehp.1002767
39. Ranft U, Schikowski T, Sugiri D, Krutmann J, Krämer U. Long-term exposure to traffic-related particulate matter impairs cognitive function in the elderly. Environ Res. (2009) 109(8):1004–11. doi: 10.1016/j.envres.2009.08.003
40. Nussbaum R, Lucht S, Jockwitz C, Moebus S, Engel M, Jöckel K-H, et al. Associations of air pollution and noise with local brain structure in a cohort of older adults. Environ Health Perspect. (2020) 128(6):067012. doi: 10.1289/EHP5859
41. Crous-Bou M, Gascon M, Gispert JD, Cirach M, Sánchez-Benavides G, Falcon C, et al. Impact of urban environmental exposures on cognitive performance and brain structure of healthy individuals at risk for Alzheimer’s dementia. Environ Int. (2020) 138:105546. doi: 10.1016/j.envint.2020.105546
42. Kulick ER, Wellenius GA, Boehme AK, Joyce NR, Schupf N, Kaufman JD, et al. Long-term exposure to air pollution and trajectories of cognitive decline among older adults. Neurology. (2020) 94(17):e1782–92. doi: 10.1212/WNL.0000000000009314
43. Kulick ER, Elkind MSV, Boehme AK, Joyce NR, Schupf N, Kaufman JD, et al. Long-term exposure to ambient air pollution, APOE-ε4 status, and cognitive decline in a cohort of older adults in northern manhattan. Environ Int. (2020) 136:105440. doi: 10.1016/j.envint.2019.105440
44. Petkus AJ, Younan D, Widaman K, Gatz M, Manson JE, Wang X, et al. Exposure to fine particulate matter and temporal dynamics of episodic memory and depressive symptoms in older women. Environ Int. (2020) 135:105196. doi: 10.1016/j.envint.2019.105196
45. Paul KC, Haan M, Yu Y, Inoue K, Mayeda ER, Dang K, et al. Traffic-related air pollution and incident dementia: direct and indirect pathways through metabolic dysfunction. J Alzheimer’s Dis. (2020) 76(4):1477–91. doi: 10.3233/JAD-200320
46. Younan D, Petkus AJ, Widaman KF, Wang X, Casanova R, Espeland MA, et al. Particulate matter and episodic memory decline mediated by early neuroanatomic biomarkers of Alzheimer’s disease. Brain. (2020) 143(1):289–302. doi: 10.1093/brain/awz348
47. Lo Y-TC, Lu Y-C, Chang Y-H, Kao S, Huang H-B. Air pollution exposure and cognitive function in Taiwanese older adults: a repeated measurement study. Int J Environ Res Public Health. (2019) 16(16):2976. doi: 10.3390/ijerph16162976
48. Cerza F, Renzi M, Gariazzo C, Davoli M, Michelozzi P, Forastiere F, et al. Long-term exposure to air pollution and hospitalization for dementia in the Rome longitudinal study. Environ Health. (2019) 18(1):1–12. doi: 10.1186/s12940-019-0511-5
49. Chen H, Kwong JC, Copes R, Hystad P, van Donkelaar A, Tu K, et al. Exposure to ambient air pollution and the incidence of dementia: a population-based cohort study. Environ Int. (2017) 108:271–7. doi: 10.1016/j.envint.2017.08.020
50. Cacciottolo M, Wang X, Driscoll I, Woodward N, Saffari A, Reyes J, et al. Particulate air pollutants, APOE alleles and their contributions to cognitive impairment in older women and to amyloidogenesis in experimental models. Transl Psychiatry. (2017) 7(1):e1022. doi: 10.1038/tp.2016.280
51. Ailshire J, Karraker A, Clarke P. Neighborhood social stressors, fine particulate matter air pollution, and cognitive function among older US adults. Soc Sci Med. (2017) 172:56–63. doi: 10.1016/j.socscimed.2016.11.019
52. Jung C-R, Lin Y-T, Hwang B-F. Ozone, particulate matter, and newly diagnosed Alzheimer’s disease: a population-based cohort study in Taiwan. J Alzheimer’s Dis. (2015) 44(2):573–84. doi: 10.3233/JAD-140855
53. Gatto NM, Henderson VW, Hodis HN, St John JA, Lurmann F, Chen J-C, et al. Components of air pollution and cognitive function in middle-aged and older adults in Los Angeles. Neurotoxicology. (2014) 40:1–7. doi: 10.1016/j.neuro.2013.09.004
54. Russ TC, Cherrie MPC, Dibben C, Tomlinson S, Reis S, Dragosits U, et al. Life course air pollution exposure and cognitive decline: modelled historical air pollution data and the lothian birth cohort 1936. J Alzheimer’s Dis. (2021) 79(3):1063–74. doi: 10.3233/JAD-200910
55. Chen J-C, Wang X, Serre M, Cen S, Franklin M, Espeland M. Particulate air pollutants, brain structure, and neurocognitive disorders in older women. Res Rep Health Eff Inst. (2017) (193):1–65. PMID: 31898881.31898881
56. Tonne C, Elbaz A, Beevers S, Singh-Manoux A. Traffic-related air pollution in relation to cognitive function in older adults. Epidemiology. (2014) 25(5):674–81. doi: 10.1097/EDE.0000000000000144
57. Carey IM, Anderson HR, Atkinson RW, Beevers SD, Cook DG, Strachan DP, et al. Are noise and air pollution related to the incidence of dementia? A cohort study in London, England. BMJ Open. (2018) 8(9):e022404. doi: 10.1136/bmjopen-2018-022404
58. Cleary EG, Cifuentes M, Grinstein G, Brugge D, Shea TB. Association of low-level ozone with cognitive decline in older adults. J Alzheimer’s Dis. (2018) 61(1):67–78. doi: 10.3233/JAD-170658
59. Oudin A, Forsberg B, Adolfsson AN, Lind N, Modig L, Nordin M, et al. Traffic-related air pollution and dementia incidence in northern Sweden: a longitudinal study. Environ Health Perspect. (2016) 124(3):306–12. doi: 10.1289/ehp.1408322
60. Chang K-H, Chang M-Y, Muo C-H, Wu T-N, Chen C-Y, Kao C-H. Increased risk of dementia in patients exposed to nitrogen dioxide and carbon monoxide: a population-based retrospective cohort study. PLoS One. (2014) 9(8):e103078. doi: 10.1371/journal.pone.0103078
61. Oudin A, Forsberg B, Lind N, Nordin S, Oudin Åström D, Sundström A, et al. Is long-term exposure to air pollution associated with episodic memory? A longitudinal study from northern Sweden. Sci Rep. (2017) 7(1):1–7. doi: 10.1038/s41598-017-13048-1
62. Oudin A, Segersson D, Adolfsson R, Forsberg B. Association between air pollution from residential wood burning and dementia incidence in a longitudinal study in northern Sweden. PLoS One. (2018) 13(6):e0198283. doi: 10.1371/journal.pone.0198283
63. Lee BJ, Kim B, Lee K. Air pollution exposure and cardiovascular disease. Toxicol Res. (2014) 30(2):71–5. doi: 10.5487/TR.2014.30.2.071
64. Tsai TL, Lin YT, Hwang BF, Nakayama SF, Tsai CH, Sun XL, et al. Fine particulate matter is a potential determinant of Alzheimer’s disease: a systemic review and meta-analysis. Environ Res. (2019) 177:108638. doi: 10.1016/j.envres.2019.108638
65. Mumaw CL, Levesque S, McGraw C, Robertson S, Lucas S, Stafflinger JE, et al. Microglial priming through the lung-brain axis: the role of air pollution-induced circulating factors. FASEB J. (2016) 30(5):1880–91. doi: 10.1096/fj.201500047
66. Levesque S, Taetzsch T, Lull ME, Kodavanti U, Stadler K, Wagner A, et al. Diesel exhaust activates and primes microglia: air pollution, neuroinflammation, and regulation of dopaminergic neurotoxicity. Environ Health Perspect. (2011) 119(8):1149–55. doi: 10.1289/ehp.1002986
Keywords: air pollution, cognition, neurological, neurodegeneration, systematic review, dementia, particulate matter
Citation: McLachlan J, Cox SR, Pearce J and Valdés Hernández MdlC (2023) Long-term exposure to air pollution and cognitive function in older adults: a systematic review and meta-analysis. Front. Environ. Health 2:1205443. doi: 10.3389/fenvh.2023.1205443
Received: 19 April 2023; Accepted: 9 June 2023;
Published: 22 June 2023.
Edited by:
Omar Hahad, Johannes Gutenberg University Mainz, GermanyReviewed by:
Marin Kuntic, Johannes Gutenberg University Mainz, GermanyChau-Ren Jung, China Medical University, Taiwan
© 2023 McLachlan, Cox, Pearce and Valdés Hernández. This is an open-access article distributed under the terms of the Creative Commons Attribution License (CC BY). The use, distribution or reproduction in other forums is permitted, provided the original author(s) and the copyright owner(s) are credited and that the original publication in this journal is cited, in accordance with accepted academic practice. No use, distribution or reproduction is permitted which does not comply with these terms.
*Correspondence: Maria del C. Valdés Hernández TS5WYWxkZXMtSGVybmFuQGVkLmFjLnVr
Abbreviation 95% CI, 95% confidence interval; AD, Alzheimer's disease; B, regression coefficient; BC, black carbon; CDR, clinical dementia rating; CERAD, consortium to establish a registry for Alzheimer's disease; CHD, coronary heart disease; CO, carbon monoxide; CVD, cardiovascular disease; CVLT, california verbal learning test; DM, diabetes mellitus; DSM-IV, diagnostic and statistical manual of mental disorders, fourth edition; HR, hazard ratio; HTN, hypertension; ICD-9-CM, international classification of disease, ninth edition, clinical modification; IHD, ischaemic heart disease; IQ, intelligence quotient; LM, logical memory; MCI, mild cognitive impairment; MMSE, mini mental state examination; MS, multiple sclerosis; NH3, ammonia; NMVOC, non-methane volatile organic compounds; NOx, nitrogen oxide species; NO2, nitrogen dioxide; O3, ozone (trioxygen); OR, odds ratio; PD, Parkinson's disease; PM2.5, particulate matter with an aerodynamic diameter less than 2.5 micrometres; PM10, particulate matter with an aerodynamic diameter less than 10 micrometres; PNam, accumulation mode particle number; ppb, parts per billion; SM, semantic memory; SOx, sulfur oxide species; SPMSQ, short portable mental state questionnaire; TRAP, traffic related air pollution; µg/m3, micrograms per cubic metre; VEM, visual episodic memory; WAIS-IV, Wechsler Adult Intelligence Scale, fourth edition.