 C. Colombi
 L. D’Angelo1,2
- 1Air Quality Department, Environmental Protection Agency of Lombardy Region (ARPA Lombardia), Milan, Italy
- 2Institute for Atmospheric and Environmental Sciences, Goethe-University Frankfurt, Frankfurt am Main, Germany
Regarding secondary aerosols, in addition to the significant contribution of anthropogenic gases such as NOx and SO2, atmospheric ammonia (NH3) plays a crucial role as the primary basic gaseous species capable of neutralizing acidic compounds. This acid–base reaction is responsible for the formation of ammonium nitrate (NH4NO3), constituting up to 60% of PM10 within the Po River basin in Italy. Ion chromatographic analyses performed on offline samples indicate that this secondary inorganic species exhibits minimal concentration variability over the Po Valley because of limited air circulation due to orography and mesoscale air circulation. Therefore, investigating gaseous precursors becomes crucial. From the northern to the southern part of Lombardy—the region at the center of the basin—NH3 emission amounts account for 2.5, 11.1, and 27.7 t/y/km2, mainly due to agriculture and livestock activities (∼97%). To study NH3 temporal and spatial variability, the Environmental Protection Agency of Lombardy Region has been monitoring NH3 concentrations across its territory since 2007, with 10 active monitoring sites. Annual and seasonal cycles are presented, along with a focus on different stations, including urban, low-mountain background, high-impact livestock, and rural background, highlighting the impact of various sources. Measurements indicate that within the Po basin, NH3 concentrations can reach up to 700 µg/m3 (as an hourly average) in proximity to the main gaseous NH3 source. Instrument intercomparisons among online monitors and passive vials, as well as different online monitors, are presented. Therefore, this paper provides crucial data to understand the formation of secondary inorganic aerosols in one of the most important hotspot sites for air pollution.
1 Introduction
Despite its substantial size, the Po Valley, located in northern Italy, is essentially a semi-closed basin surrounded by the Alps, the Apennines, and the Adriatic Sea. The orographic barriers, including the Alps and the Apennines, restrict the entry of external air and precipitation events, hindering the mixing of the planetary boundary layer. These conditions are especially severe during wintertime when mixing layer heights are extremely low (1). Thermal inversion exacerbates the situation, trapping anthropogenic emissions close to the surface (2). Consequently, air quality in the region is significantly impacted by stagnant low-atmospheric conditions, coupled with high anthropogenic gases and particle emissions from the most industrialized and cultivated area in Italy. As a result, the Po Valley is among the most polluted areas in Europe (3).
Data from the Environmental Protection Agency of the Lombardy Region (L-EPA) highlight ongoing concerns regarding fine particles (particulate matter, PM10 and PM2.5), nitrogen dioxide (NO2), and O3. Italy has recently faced legal consequences, being sentenced by the European Court of Justice (4) for systematically and persistently exceeding the limit values for concentrations of PM10. Thanks to efforts by public authorities over the years, concentrations of these pollutants have gradually decreased (5). However, further reduction efforts are necessary, as even a lockdown during the COVID-19 pandemic in the spring of 2020 did not result in significant improvements (6, 7).
Regarding atmospheric particles, various studies (8–17) emphasize the significance of secondary inorganic aerosols (SIA) in mass contribution, including SO42−, NO3−, and NH4+, which can constitute up to 60% of the PM10 mass during wintertime in the Po Valley. Specifically, on days when the regulatory limit of 50 µg/m3 is exceeded, ammonium nitrate (NH4NO3) is a fraction that significantly varies (18).
In this context, the gaseous precursors are well-known. Sulfur dioxide (SO2) is no longer a critical issue, thanks to the ban on sulfur-containing gasoline, which has reduced the resulting SO42− concentrations. Furthermore, advancements in combustion technology, along with policy restrictions, have had a positive impact on NOx emissions from combustions. However, atmospheric ammonia (NH3) is the primary gaseous species capable of neutralizing inorganic acidic compounds resulting from the photochemistry of the aforementioned gases, with well-known reaction pathways (19). In cold and humid episodes, which often occur in the Po Valley, the equilibrium of the following reaction tends to shift to the particulate phase, leading to the formation of NH4NO3 (20, 21).
where NH3 and HNO3 are in the gas phase and NH4NO3 is in the aerosol phase. Nitric acid is a sticky gaseous compound whose formation during daylight hours is due to the reactivity between NO2 and OH radicals, and from N2O5 heterogeneous hydrolysis, and reaction of the nitrate radical during nighttime.
Various methods have been developed in an attempt to quantify NH3, including the filter-pack method, denuder, and tunable diode laser absorption (22), among others (23). However, these methods have exhibited limited agreement among themselves and a relative sensitivity to atmospheric concentrations that can range from a few parts per billion (ppbv) to a few parts per trillion (pptv), respectively, in polluted and clean air (24). For several decades, highly performant instruments like the Chemical Ionization Mass Spectrometer (CIMS) (25, 26) have been available. For instance, Hanke et al. (27) conducted a measurement campaign on Monte Cimone, at the southern border of the Po Valley, with such instruments, showing detection limits between 20 and 50 pptv. The authors demonstrated that, over a limited period (3 June to 6 July), nitric acid concentrations could vary significantly depending on the wind direction, ranging from 400 pptv under conditions of wind from Africa and dust to 1.2 ppbv with air from the boundary layer of NW-Europe. Although CIMSs have proven suitable for such measurements, they currently pose challenges in terms of management and maintenance and are unsuitable for a branched and continuous network.
Ammonia is also a sticky gas, primarily originating from various sources, including wastewater treatment plants, coal combustion, solid waste incineration, vehicular exhaust, biomass burning, fertilizer production, and emissions from humans and pets (28–30). A geospatial visualization of NH3 concentration along the vertical column is proposed in the study by Clarisse et al. (31), retrieved by the Infrared Atmospheric Sounding Interferometer sensor (installed on the meteorological platform MetOp-A) observation. According to the Regional Inventory Emission database (32), the major contributor to NH3 in the Po Valley is agriculture and livestock activities (∼97%). When Lombardy is divided longitudinally into three large areas, NH3 emissions amount to 2.5, 11.1, and 27.7 t/y/km2, decreasing from the north to south within the region. This is attributed to the catabolism of physiologic proteins, primarily ending in urea or uric acid and ultimately producing NH3, as summarized by Bussink and Oenema (33). Animal slurry, rich in nitrogen-containing and organic compounds, serves as a natural fertilizer for agricultural soil. However, NH3 volatilization from manure storage, as well as during and after spreading activities, occurs (34–41). Despite existing techniques aimed at reducing NH3 volatilization and losses in livestock farming and agriculture, many studies suggest that emissions are increasing due to rising demands for food production (42).
In addition to the availability of its gaseous precursors, i.e., NH3 and HNO3 (21), the formation of NH4NO3 is influenced by the thermodynamic conditions of the air, particularly high temperatures and low humidity (43).
The analysis of variability in NH3 concentrations is crucial for estimating the impacts of the agricultural sector on ecosystem health (44, 45) and understanding the dynamics of atmospheric particulate matter formation. This understanding is essential for supporting policymakers in identifying effective measures to reduce atmospheric aerosol burst events and the resulting exceedances of legal limits for the protection of health, to which NH4NO3 strongly contributes. Several studies have demonstrated the link between exposure to high and prolonged concentrations of fine PM and damage to the cardiovascular system (46). In addition, specific compounds within particulate matter have known toxic effects on human health (47).
While Pietrogrande et al. (48) recently demonstrated that secondary inorganic compounds formed with the contribution of atmospheric NH3 (e.g., NH4NO3) do not play a role in the oxidative potential of atmospheric aerosols, gaseous NH3 is known to participate in reactivity with volatile organic compounds, as shown by Bones et al. (49), Daellenbach et al. (50), and Wang et al. (51). Despite these findings, the role of NH3 in the toxicity of resulting compounds remains uncertain to date. Some authors [e.g., Babar et al. (52), Laskin et al. (53), Li et al. (2), Updyke et al. (54), and Smith et al. (55)] have identified the role of NH3 in the organic aerosol browning process, but its specific contribution to the toxicity of the resulting compounds requires further investigation.
In this study, we analyze a multi-year dataset of 1-h time resolution measurements of ambient air NH3 concentrations in various sites, investigating the spatial–temporal variability of NH3, its sources, and formation/transport processes in the middle of the Po Valley. The study presents annual and seasonal cycles, with a specific focus on different stations, including urban, low-mountain background, high-impact livestock, and rural background sites. This approach highlights the impact of various sources, such as air transport from the Po plain and traffic in Milan, the influence of livestock and agricultural activities in the southern part of the region, and the dominance of mixing layer height in the pre-alpine site.
The paper also provides additional data on NH4NO3 and NH3 concentrations, although an unambiguous relation between the two is not observed. The process of NH4NO3 formation in the Po Valley remains uncertain. Nonetheless, this paper offers a crucial overview of NH3 concentrations, laying the groundwork for further studies aiming to understand its role in PM bursts in this region.
2 Materials and method
Over the years, L-EPA has adjusted its monitoring network in response to updated regulations and with the objective of optimizing monitoring efficacy. Despite these modifications, the sampling sites conform to the European Regulation (56). The selection of sites with NH3 monitors was a compromise between source locations and existing regular monitoring sites, as detailed in Section 2.1. While no specific regulations pertain to gaseous NH3 measurements, L-EPA has implemented Quality Assurance/Quality Control (QA/QC) standards and a maintenance intervention schedule similar to other gas monitors, as outlined in Section 2.3.
To gain valuable insights into the connection between NH3 and secondary inorganic aerosol compounds, PM10 has been sampled and analyzed using ionic chromatographic techniques, as discussed in Section 2.4.
2.1 Monitoring sites
Since 2007, L-EPA has equipped a total of 14 stations with NH3 monitors, as detailed in Table 1. The classification of sites adheres to the European Directive, with six located in urban or suburban areas (BG, Co, CR-FbF, MI-PA, PV, and SnB), three in proximity to intensive livestock activities (CdC, Pi, and Be), three in rural agricultural areas (CR-GB, MV, and SKI), and one at an elevation of about 1,200 m in a grazing land (Mo). The site labeled MB-P is situated in the middle of one of the largest fenced parks in Europe, close to a small livestock farm within the park and police horse stables. The locations of these stations, which have been part of the NH3 monitoring network over the years, are depicted in Figure 1.
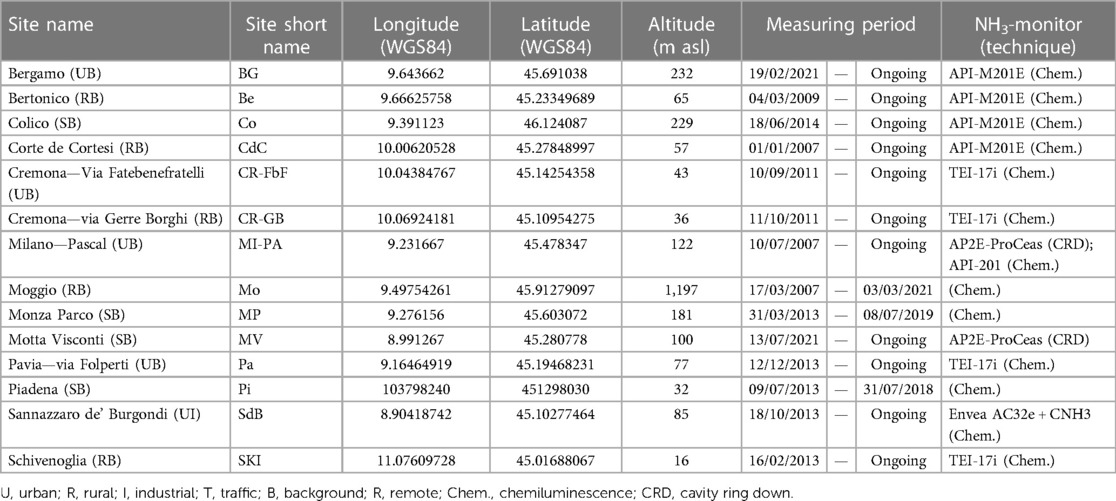
Table 1. Information on the L-EPA air quality network with regard to atmospheric NH3 monitoring.
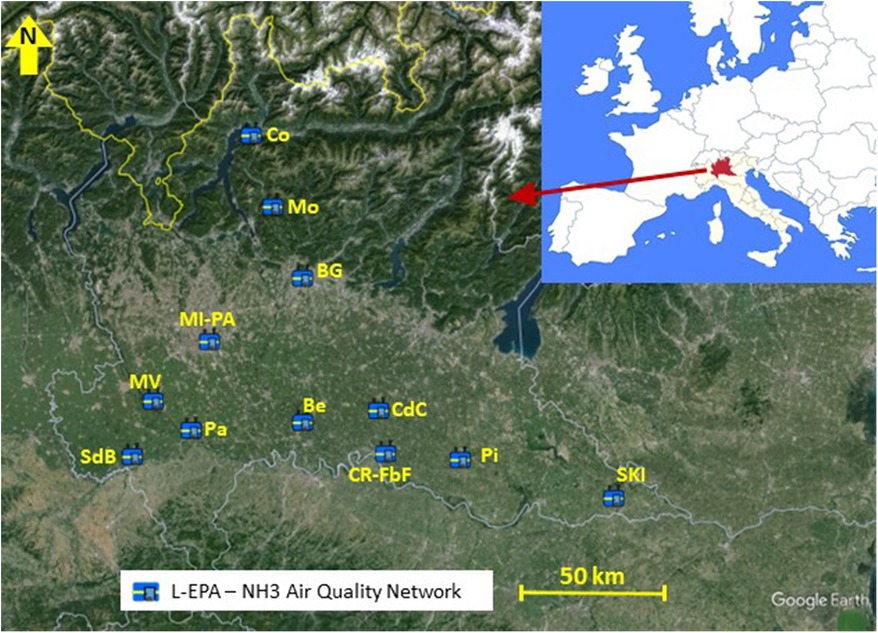
Figure 1. Location of stations belonging to the NH3 monitoring network. (Maps Data: Google, Image©2024 Airbus, Image©2024 Maxar Technologies. Lombardy regional area: © 2024 Cagle Online Enterprises, Inc.).
This paper focuses on four case studies involving the following sites: MI-PA[UB] (an urban background station in Milan, the largest city in the middle of the Po Valley), CdC[farmRB] (a site near a swine farm where commonly elevated concentrations are detected), SKI[RB] (under investigation in the LIFE Prepair project about aerosol chemical composition and source apportionment, along with MI-PA[UB] and other Po Valley sites), and Mo[Rem] (noteworthy for its position often above the mixing layer height). Acronyms in square brackets, denoting the site types, are provided alongside the site names. Refer to the caption in Table 1 for a complete explanation of the acronyms. For the Mo station, “Rem” is used to emphasize its more remote location compared to SKI. Similarly, CdC[farmRB] indicates the proximity of this site to a swine livestock facility.
2.2 Ammonia monitors
To detect ambient air concentrations of NH3, the L-EPA network is mainly equipped with chemiluminescence-based monitors (57, 58). Because chemiluminescence is identified as the reference method for NOx [UNI (59)], this technique is widely used in air quality networks.
However, over the years, L-EPA has improved its instrumentation with additional equipment such as cavity ring-down spectroscopy [CRDS (60, 61)]. Although every monitoring station listed in Table 1 is equipped with a chemiluminescence-based monitor, only MI-PA[UB] and MV[SB] allow a comparison between these two techniques (Section 2.3).
2.3 Quality assurance/quality control
Minimizing the error of measurements and correctly determining the uncertainty associated with the measurement means reducing both the stochastic and deterministic components; this is guaranteed by the application of QA/QC procedures, provided by 2008/50/CE and by the Italian ministerial decree (DM) of 30th March 2017 (62). In particular, QC activities consist of a series of procedural actions implemented by the L-EPA technicians according to the indications of the aforementioned DM and help ensure the quality control of the measured data in compliance with the quality objectives of European legislation. QA procedures consist of a series of scheduled activities through blind testing and performance auditing.
L-EPA applies QC procedures also to NH3 analyzers through scheduled preventive maintenance activities, other than regular calibrations and zero and span checks. NH3 measurements are affected by several positive artifacts, and a major source of interference is the presence of high and variable water vapor in the ambient air (63). As reported in the literature (64, 65) and, in particular, at low concentrations, other factors identified for affecting the measurements are the inlet design, the filter material and aging, and the quality of calibration standards. Based on own experience and knowledge of literature, L-EPA has developed further internal procedures. For that, in addition to the scheduled maintenance activities, various precautions have been taken during the installation of the instruments to minimize the interferers and maximize the efficiency of the measurement. Some of them are (i) all pneumatic connections must be made with chromatography-grade (passivated) stainless steel tubing, glass, Teflon®; (ii) it is preferred to avoid filters on the sample line or, at least, to use a PTFE filter; (iii) use of a siliconized glass fiber sleeve to minimize the condensation of water; (iv) short pneumatic connections are recommended; (v) diluters with capillaries (no Mass Flow Controller) for the production of the NH3 calibration sample are to be preferred; (vi) oscillations of the ambient working temperature have to stay within ±5°C; (vii) it is recommended to use three different lines for the zero sample and for the NO/GPT and NH3 calibration samples (manual switching); (viii) it is necessary to wait at least 12 h for the stabilization of the NH3 sample (rise time = 90% at 5 min). Finally, the calibration must be carried out in equipped laboratories; the CRDS also are checked in the laboratory with sample gas readings.
About QA procedures, several intercomparison campaigns have been conducted over the years to confirm the reliability of the measurements.
Using the reference method for analysis (66–68), radially symmetric diffusive samplers have been used compared to the online measurements (three in parallel for reproducibility). The use of diffusive or passive samplers for the study of air pollution in environments of work has been known since the 1970s (69, 70). Considering the high variability of the passive samplers used since 2007, the inherent variability of the method, and dependence on atmospheric conditions, the results shown in Supplementary Table S1 are to be considered acceptable. Within the same technology, i.e., chemiluminescence, tools from different brands have been also compared. In fact, despite being based on the same measurement principle, various manufacturers adopt small technological differences. These results are summarized in Supplementary Table S1.
In Supplementary Figure S1, a comparison is shown between the data collected from a CRDS monitor (Proceas AP2E) and a chemiluminescence monitor (TEI-17i) near an agricultural field. The time series, with a 10-min resolution in the graph, highlights the good agreement between the two instruments. The comparison campaign between the two technologies consists of approximately 7,900 h of measurement. The results of the linear regression are indicated in the text box of the figure.
2.4 PM analysis
Starting from 2013 for MI-PA[UB] and 2018 for SKI[RB], a time series for PM10 chemical composition is available. Aerosol samples are collected daily on quartz fiber filters (Pall TissuQuartz®, Ø = 47 mm) and Teflon filters (Pall, Ø = 47 mm, PMP ring, 2 µm porosity) by means of gravimetric samplers [Skypost PM, TCR-TECORA, Cogliate (MB), Italy, or Lifetek PMS, Megasystem, Bareggio (MI)] equipped with a PM10 sampling head (1 m3/h, 24 h). After collection, filters are stored in the darkness and at low temperature to prevent photochemical reactions and compound volatilizations. A punch of 1.5 cm2 is removed from each filter, and the water-soluble compounds are extracted through ultra-pure water (Sartorius® Arium Mini, resistivity 18.2 MΩ) in a sonic bath (20 min). The resultant solution is then filtrated (Nylon or PTFE Syringe Filter—pore size 0.45 µm) and injected into an ion chromatographer (Metrohm 930 and 881) for the determination of anions (Cl−, NO2−, Br−, NO3−, PO43−, SO42−) and cations (Na+, NH4+, K+, Mg2+, Ca2+). Another punch of 1.5 cm2 is removed from each filter for the determination of the carbonaceous fraction by means of thermal–optical analysis (Sunset Laboratory Inc., Tigard, OR, USA), according to the NIOSH-like and EUSAAR-2 protocols. Teflon filters are used for elemental composition determination by dispersive x-Ray fluorescence (ED-XRF, Epsilon 4, Malvern Panalytical) for elements with atomic number Z higher than 11 (Mg, Al, Si, P, S, Cl, K, Ca, Ti, V, Cr, Mn, Fe, Ni, Cu, Zn, As, Br, Rb, Cd, Pb, Sr, Sn, Sb, Ba). Starting from 2013, in MI-PA[UB], hourly Black Carbon measurements with a Multi-Angle Absorption Photometer (MAAP, Thermo Scientific Model 5012, PM2.5 cutoff, no dryer) that measures the aerosol absorption coefficient at a wavelength of 637 nm are also available (71), and from it, the BC is computed considering the deposit area and sampling air flow and using a mass-specific absorption coefficient of 6.6 m2/g. In addition, during the latter part of winter 2022 (from 22 February to 15 March), a higher time resolution sampling campaign was performed to observe the variability of secondary inorganic compounds and the role of gaseous NH3 at various sites in Lombardy. For this reason, PM10 samples were collected (Pall TissuQuartz®, Ø = 47 mm, 1 m3/h, 6 h) at six sites of the L-EPA air quality network and equipped with NH3 monitors, i.e., MI-PA[UB], SKI[RB], CdC[farmRB], MV[RB], Be[RB], and SdB[UI].
3 Results
In this section, data concerning NH3 concentrations are presented. An overview of the data collected at all the stations is provided in Table 2.
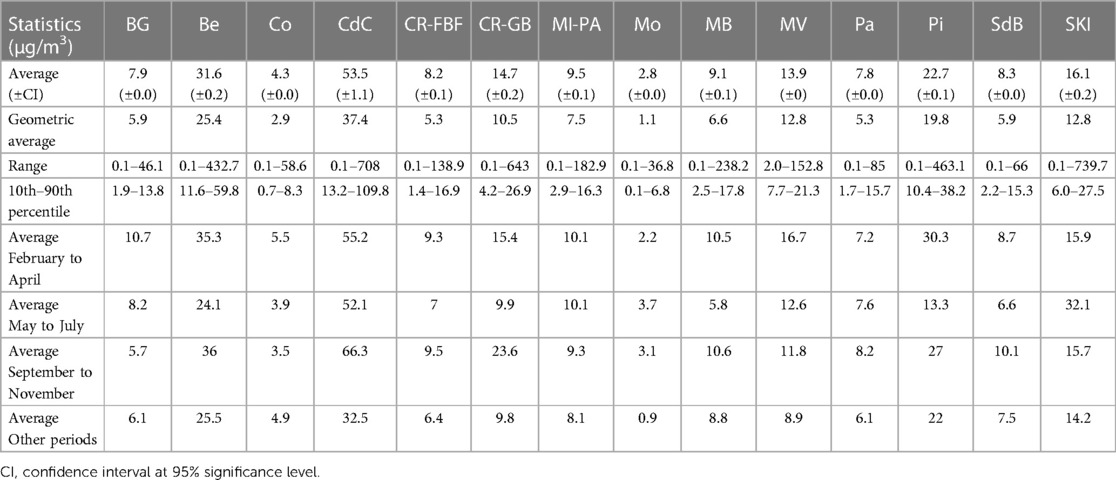
Table 2. Statistics concerning ammonia measurements based on hourly average native data since 2007.
The annual cycle of average NH3 concentrations is depicted in Figure 2, along with the maximum and minimum values, the 75th and 25th percentiles, and the number of stations measuring NH3 for each year. It is evident that the average concentration remains almost constant over the years. The overall average is impacted not only by rural stations but also by the one in a remote area, which exhibits very low concentrations (Supplementary Figure S2). The maximum values are always attributed to the rural station close to husbandry activity, described later (Section 3.3). We speculate that the decrease in maximum values over the years is due to an improvement in technologies used in zootechnical and agricultural activities or a decrease in the surrounding agricultural activities. This decrease is coherent with INEMAR's databases, which report a decline in NH3 emissions in this area from 101,779 t/y in 2014 to 90,727 t/y in 2019.
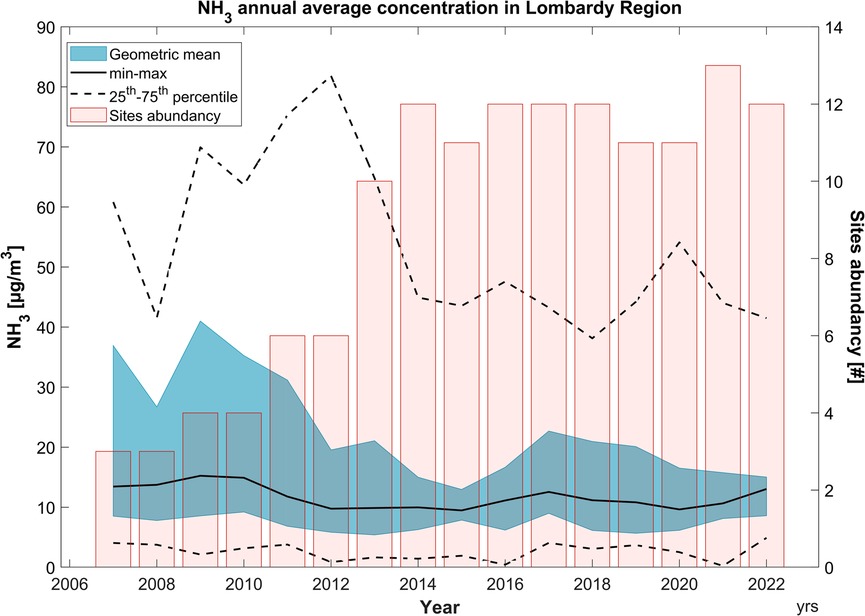
Figure 2. Summary of ammonia concentrations measured within the L-EPA air quality network. The geometric mean of the annual averaged trend is illustrated by the black line. The blue buffer and the dashed black line are utilized to depict the variability in annual ammonia concentrations among the measuring stations in the network. The red bars indicate the number of active stations in the same year.
The variability of the four case studies is described in further detail, as they exhibit characteristics representative of typical monitoring site classes. As mentioned earlier, MI-PA[UB] is a background station placed in an urban background area of Milan, the biggest city in the Po Valley. The nearest agricultural and livestock activities are approximately 5 km from the station. Therefore, MI-PA[UB] can be considered a background site also concerning the main NH3 sources. Conversely, the CdC[farmRB] site is a few tens of meters away from a swine farm and within an area primarily intended for agriculture. For this reason, this station could be considered an “industrial site” in relation to NH3 sources, especially when considering the presence of husbandry activity as an anthropic (industrial) influence. In a completely different context, the SKI[RB] station is placed in an agricultural area but with few animal husbandries in the surroundings. Therefore, it can be defined as an agricultural background site in the same manner that MI-PA[UB] is an urban background site. Finally, Mo[Rem] is located in an isolated small pre-alpine valley at 1,200 m a.s.l. Some nearby areas are sporadically and occasionally used as grazing land for small herds of bovines. For this reason, Mo[Rem] is rarely affected by NH3 emission, and the station may be regarded as a rural background and remotely located.
Ammonia concentrations measured at the four stations described above are presented in detail below, focusing on the cycle over the years.
3.1 Annual cycle
A valuable overview of NH3 concentrations is obtained by calculating the average daily concentrations (as the geometric mean) across the years for each day of the year. Figure 3 illustrates the annual cycle for the four selected monitoring sites as case studies, with dark lines representing the geometric mean. Generally, the arithmetic mean is more susceptible to spikes associated with local sources, whereas the geometric mean is more effective at representing background conditions (72).
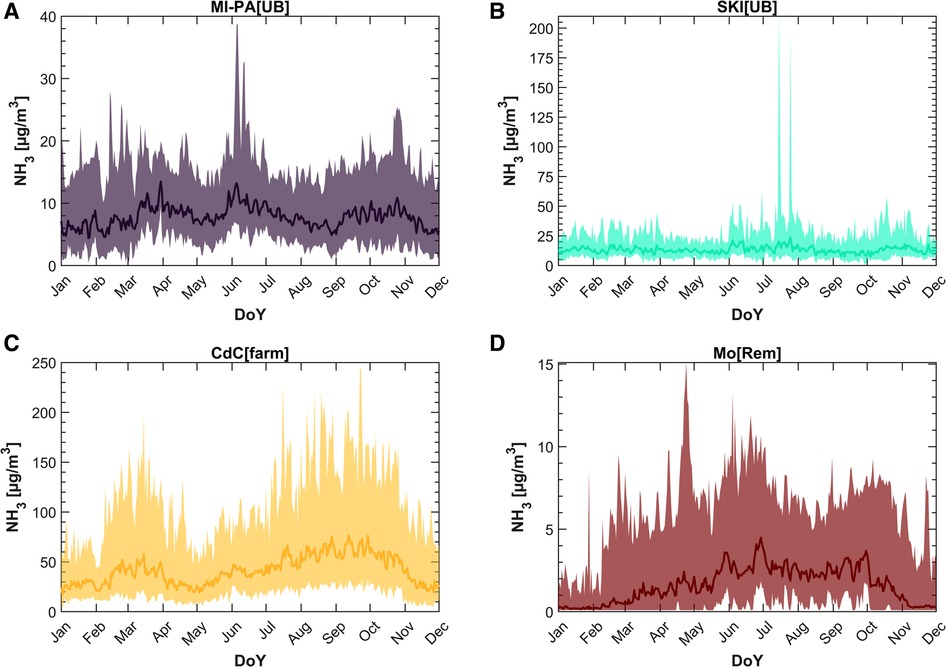
Figure 3. Annual cycle for (A) MI-PA[UB], (B) SKI[RB], (C) CdC[farmRB], and (D) Mo[Rem]. The darker lines represent the geometric mean, while the shaded buffers depict the range between the 10th and 90th percentile of the hourly concentrations.
Ammonia concentrations measured at the MI-PA[UB] station are depicted in Figure 3A, where values of the geometric mean comparable to the literature for measurements in urban areas (29, 63) are presented. Although the average annual cycle does not show significant variability throughout the year (the 10th–90th percentiles range is between 3 and 40 µg/m3, with a geometric mean value of 7.5 µg/m3), the measurements suggest three periods with an increase in NH3 concentrations: late winter/beginning of spring, late springtime, and autumn. At the SKI[RB] station (Figure 3B), as for MI-PA[UB], the time series shows higher values in three periods, albeit slightly different compared to the previously described site: winter/early springtime, from June to August, and from mid-October to early November. The growth in July of the annual cycle is dominated by high peaks: this is due to very high hourly average concentrations (up to 740 µg/m3) observed every second year since 2018. L-EPA technicians verified that fertilization operations of nearby agricultural fields were in progress during those events. Nevertheless, the geometric annual mean for the NH3 level amounts to 13 µg/m3.
The highest concentrations are recorded at the CdC[farmRB] station, as expected. At this site, the yearly geometric mean level reaches 37 µg/m3. Although the maximum concentration measured on an hourly basis is 708 µg/m3, comparable to that measured in SKI[RB], the CdC[farmRB] site significantly differs from SKI[RB]. This difference is evident when considering the 90th percentile value of the two sites (28 µg/m3 at SKI[RB] compared to 110 µg/m3 at CdC[farmRB]), as reported in Table 2. In addition, the annual cycle at CdC[farmRB] station shows two main periods of rising concentrations: from February to the beginning of April and from July to November, the latter one is preceded by 2 months of a modest increase in concentrations. At the Mo[Rem] site, the annual cycle shows a distinctly different behavior. Broadly speaking, NH3 concentrations are higher during summertime and very low (sometimes even below the detection limit) during winter, and the overall shape is an upside-down “U.” However, data collected at the Mo[Rem] station from 2007 to 2020 suggest even here the influence of NH3 in three distinct periods. Rises in NH3 concentration pattern are observed from February to April, during June and July, and during September and October. Nevertheless, the annual mean concentration is about 1 µg/m3.
Averaged concentrations during three representative periods, i.e., from mid-February to mid-April, from mid-May to mid-June, and from mid-September to mid-November, are calculated and shown for each site. Further statistics on an hourly basis are summarized in Table 2.
In Figure 4, the atmospheric NH3 concentrations are presented as weekly arithmetic means for the four sites previously described. The weekly time resolution allows appreciation of the variability of the shown data, avoiding excessive scatter. On the right axes, the maximum hourly data in the specific average week are also shown. Although two high values were detected in MI-PA[UB] in 2009 and 2012 (up to 180 µg/m3 as maximum hourly), NH3 weekly average concentrations typically remain within a range between 3 and 30 µg/m3. As shown with the dashed red line in the figure, the time series indicates a negligible cycle over the years for MI-PA[UB]. As previously mentioned, SKI[RB] confirms to be characterized by low variability as well, besides rare events connected to soil fertilization (the direct link between fertilization and high levels is shown in Section 3.3). For this site, a negligible cycle is observed too, even though a slight increase of the interannual trend is shown in this case. A more appreciable reduction of NH3 interannual trend levels is suggested by the time series of CdC[farmRB] site, also displayed by the mean annual cycle (Figure 5). The Mo[Rem] site, instead, clearly shows that values above the detection limit are mainly detected when the warmer season starts and again decrease after it.
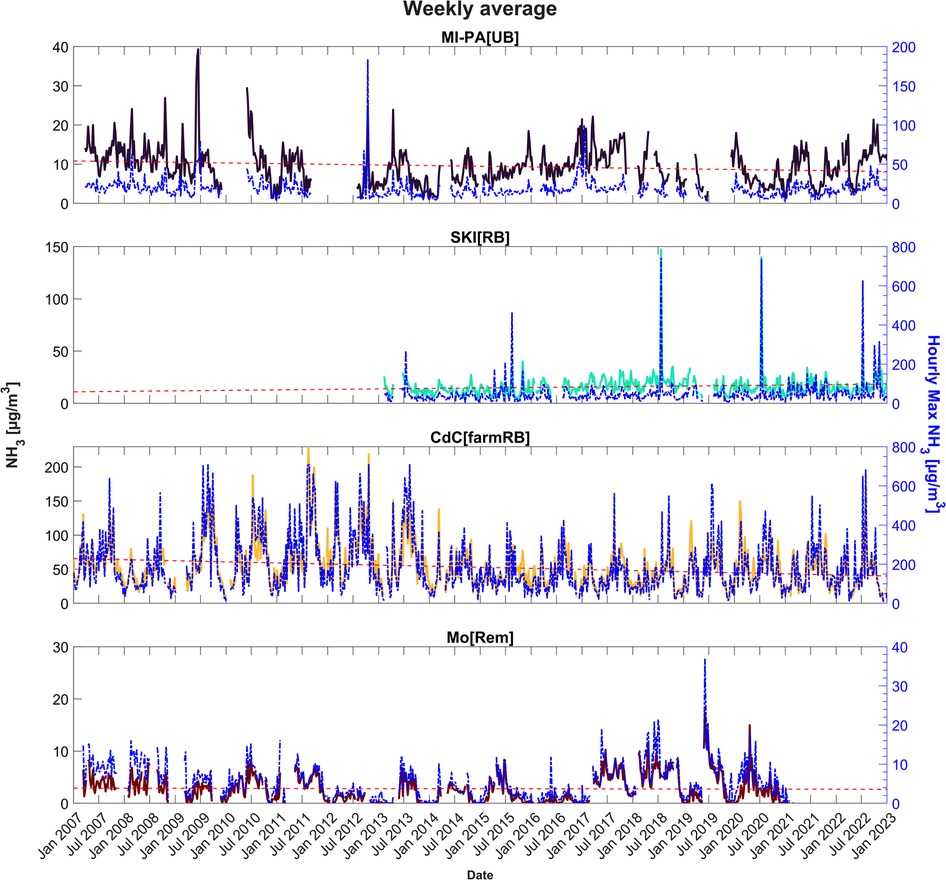
Figure 4. Arithmetic weekly average of gaseous ammonia in the four case study sites from 2007 to 2022. The maximum hourly values recorded during the week are shown with the blue line (right axes). The overall trend line is in red.
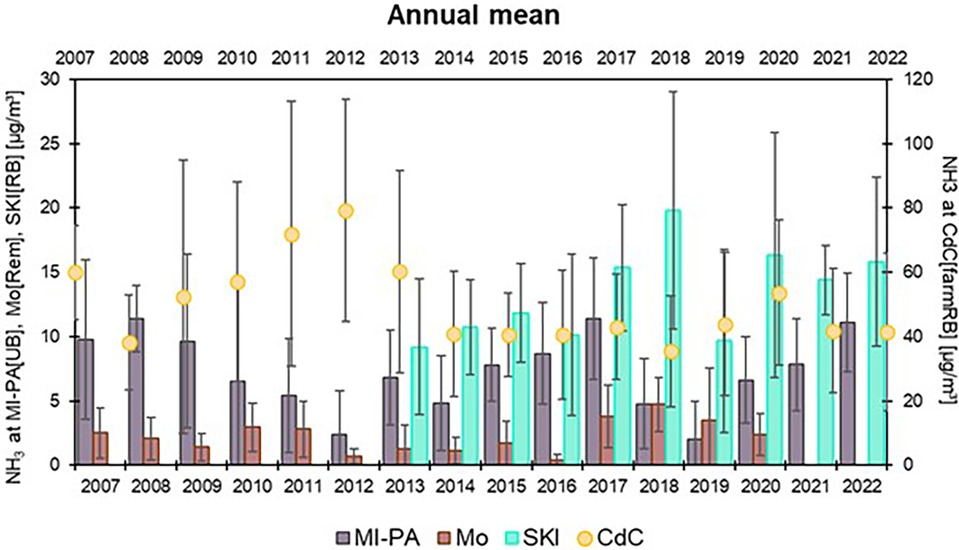
Figure 5. Arithmetic annual average (±standard deviation) of gaseous ammonia in the four case study sites from 2007 to 2022. CdC[farmRB] values are shown with the yellow dots (right axes).
In general, a clear interannual trend is not evident; on the whole, the NH3 values measured by the L-EPA Air Quality Network seem quite stable, as shown in Figures 4, 5. The data, therefore, suggest not great changes in the activities emitting NH3 into the atmosphere, over the years, with a few exceptions. As already mentioned, the reduction in annual average concentrations measured at CdC[farmRB], which affects the whole maximum hourly dataset depicted in Figure 2, can be attributed to local improvements in waste management practices and in a change in the number of pig livestock. On the other hand, the monthly average cycle (Figure 6) confirms the two main periods of rising concentrations, with the highest values in March and August to September. At SKI[RB], concentrations exhibit a slight positive pattern, although strongly influenced by high concentrations observed in July 2018, 2020, and 2022, as also highlighted in Figure 4. MI-PA[UB] is influenced by transport events that are unlikely to result in a similar increase in values as observed in locations near direct emissions. Mo[Rem] shows a completely different graph than other sites, showing a bell-trend: the highest concentrations are measured during warmer periods reaching the maximum value in June.
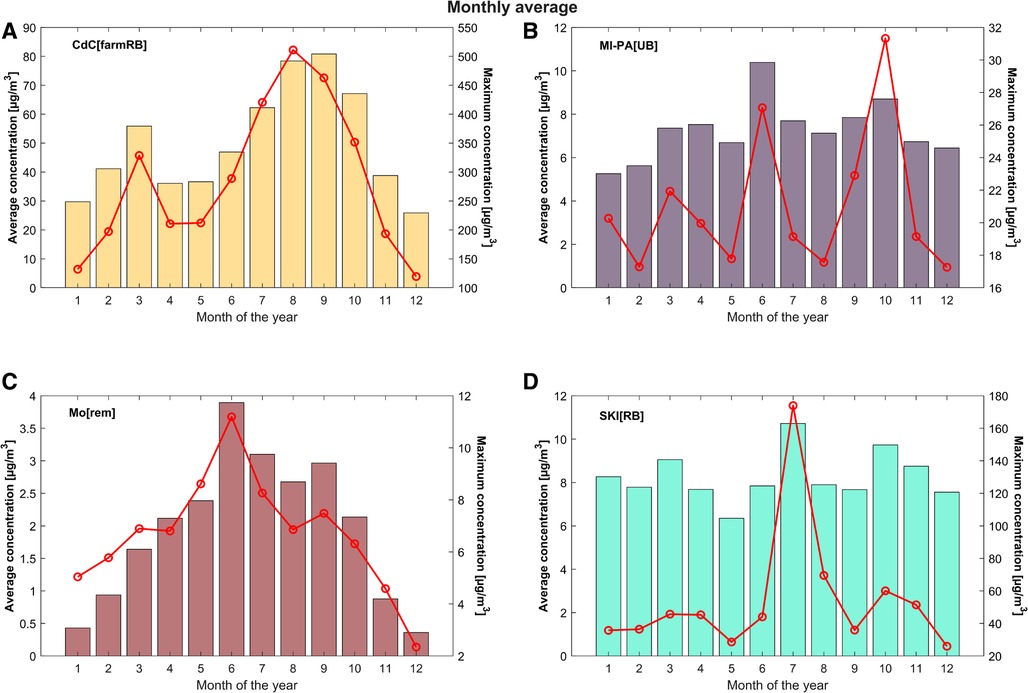
Figure 6. Arithmetic monthly average of gaseous ammonia in the four case study sites (CdC[farmRB] (A); MI-PA[UB] (B); Mo[Rem] (C); SKI[RB] (D)) from 2007 to 2022. The maximum monthly values recorded are shown with the red lines (right axes).
3.2 Impact of the agricultural sector on NH3 ambient air
As demonstrated in the previous section, specific periods of the year are typically marked by higher NH3 concentrations, particularly in agricultural areas. As suggested by emission inventory databases, these variations could indicate that some specific agricultural and zootechnical activities contribute significantly to NH3 emissions. For this reason, starting from 2017, an examination of the impact of the agricultural sector on NH3 concentrations has been conducted. In this context, four monitoring campaigns at different animal husbandry activities along the Lombardy region have been carried out to compare different fertilization techniques on agricultural fields. The considered techniques were (1) surficial spreading, (2) direct injection within the soil, (3) nebulization by means of a pivot 20 cm above the ground level of N-abate and micro-filtrated slurry, and (4) fertigation of N-abate and micro-filtrated slurry. Among these, the first two are the most used techniques in the Po Valley. In this section, we briefly describe the results of the first technique. The monitoring campaign was conducted in an agricultural area between Milan and Bergamo cities in September 2018. The comparison among the different techniques will be discussed in a work that is in progress.
Ammonia concentrations were measured by a chemiluminescence monitor installed on a mobile laboratory positioned near the border of the agricultural field (Figure 7A). Data were acquired with a 1-min time resolution starting from 3 days before the fertilization event, dated 26 September 2018. During this time range, observations displayed NH3 concentrations lower than 20 µg/m3. The superficial spreading fertilization used in this area consists of a rotating disk, which spreads the fertilizer on the soil from a height approximately 3 m above ground level. Due to the emission and strong volatilization caused by the spreading technique, atmospheric NH3 concentrations increased from the above-mentioned value up to 1,300 µg/m3. Conversely, when the monitor was upwind of the fertilized field, concentrations were lower than 50 µg/m3. In this regard, the polar plot in Figure 7B reports the probability that the measured concentrations above the 50th percentile come from the target fertilized area. Ammonia concentrations rapidly decreased during the following days, thanks to the regulations that order such fertilizers to be buried within 48 h after spreading. This led the concentrations to decrease below 100 µg/m3 on 29 September.
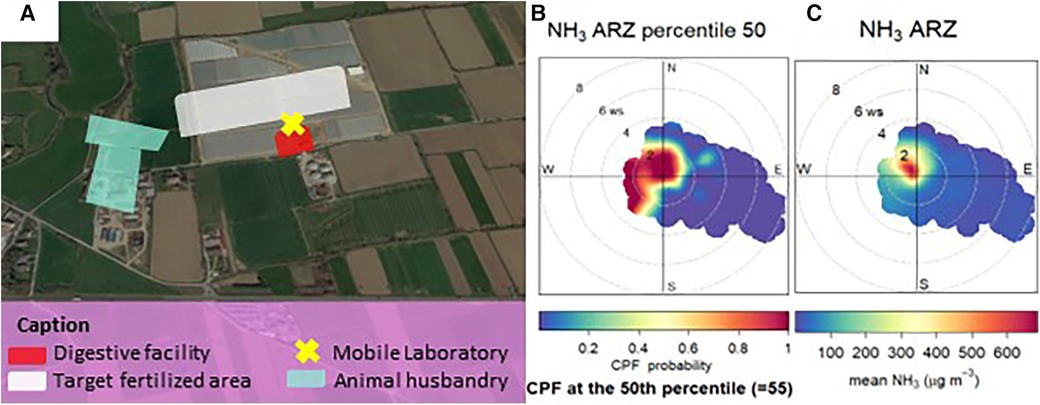
Figure 7. Monitoring during field fertilization. (A) Agricultural site designated for the evaluation of the impact of the surficial spreading fertilization technique on atmospheric ammonia concentration. The white area is the area that was fertilized on 26 September and position of the monitoring station. (B) Conditional bivariate probability function for ammonia data above 50th percentile. (C) Polar plot of the measured ammonia concentrations during the campaign.
3.3 Secondary inorganic compounds in the Po Valley
As already mentioned, the Po Valley is a hotspot regarding PM concentrations. Many studies focused their attention on the chemical characterization of atmospheric particles in this basin and provided averaged PM composition both on an annual (73–75) and seasonal (76–78) basis. Following the results shown in the Life PrepAIR—Interim Report (18), in Milan, the averaged composition of PM10 in the last 10 years is due to SIA (34%), organic carbon (OC) (20%), crustal matter (12%), elemental carbon (EC) (4%), and other trace elements (2%). Carbon compounds remain quite constant in percentage from summer to winter, while SIA increases up to 38% in the cold season. By focusing solely on the results of chemical analyses associated with days surpassing the 50 µg/m3 limit, the influence of NH4NO3 becomes distinctly evident. In instances where the limit is exceeded, NH4NO3 constitutes 28 ± 10% of the PM10, contrasting with the 17 ± 13% observed in cases below the limit. Beyond a mere distinction between below and above the limit, it is evident that NH4NO3 plays a crucial role in determining PM10 levels in the Po Valley. Thus, the study of NH3 concentrations in relation to its sources and meteorological phenomena is important to understand its role in secondary inorganic compounds formation. In this section, data regarding secondary inorganic compounds are presented. Figure 8 shows the results of the chromatographic analysis performed on about 4,000 PM10 samples. Daily concentrations were aggregated in monthly time resolution and then used to highlight the annual cycle. The ammonium sulfate compound shows very low variability, ranging from 2.0 to 3.5 µg/m3 and no seasonality (Figure 8C). It is worth noticing that MI-PA[UB] and SKI[RB] show the same annual cycle and the same absolute value of this compound.
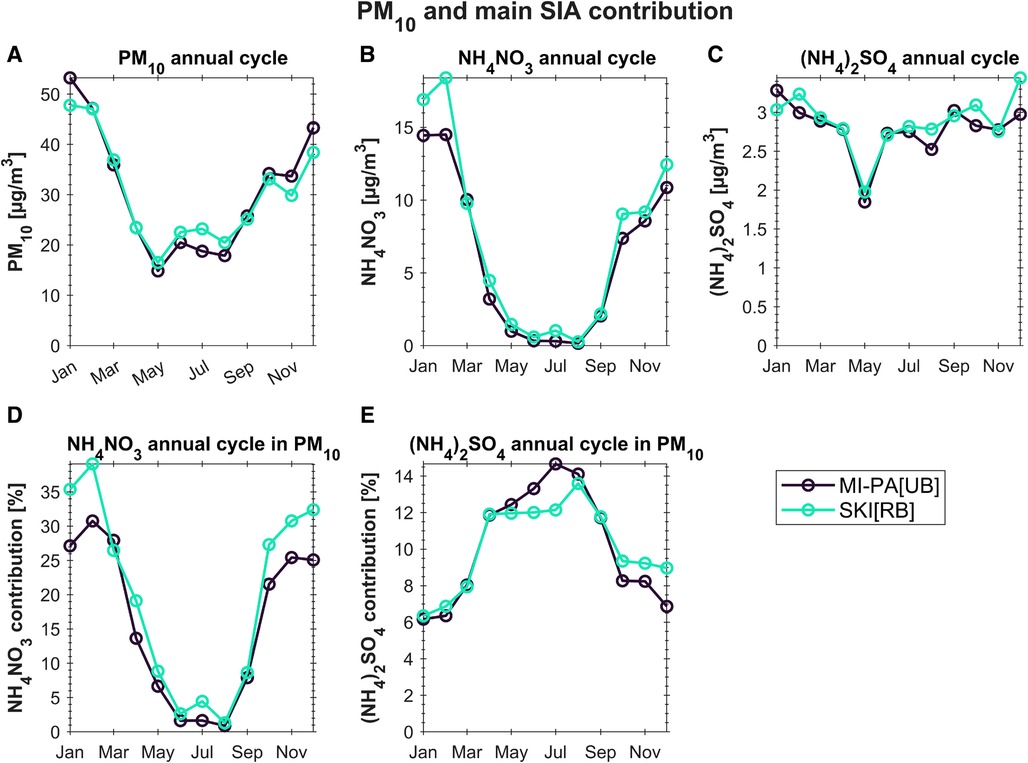
Figure 8. Mean annual cycle for PM10 (A), ammonium nitrate and ammonium sulfate concentrations (B-C) and their contribution in PM10 (D-E). Samples were collected in MI-PA[UB] and SKI[RB] from 2018 and 2022.
On the contrary, NH4NO3 is found to contribute up to 40% of PM10 mass on a monthly basis in colder periods, which can reach up to 60% of PM10 on a daily average basis (Figures 8D,E).
To identify a clearer relationship within the non-linear (20, 79) NH3–NOx–NH4NO3 system, further investigation was carried out to observe the cycle of NH4NO3 during one of the periods with the highest probability of elevated NH3 concentrations, based on the levels of the previous years. The investigation has been conducted through an intensive monitoring campaign between February and March 2022 at six different sites, as explained in Section 2.4. Figure 9 displays the variability of two parameters, gaseous NH3 and NH4NO3 on PM10, over a 6-h sampling period. Gaseous NH3 concentrations exhibit high variability among the monitoring sites (Figure 9A), suggesting that the emissive source and its distance from the measurement site have the greatest impact on the determination of atmospheric concentrations. Within the considered period, the CdC[farmRB] site shows the highest values (57 ± 35 µg/m3) followed by Be[RB] (47 ± 23 µg/m3), whereas the lowest ones are at MI-PA[UB] (9 ± 2 µg/m3) and SdB[UI] (6 ± 3 µg/m3) sites. On the contrary, NH4NO3 (Figure 9B) shows an extremely low variability. The mean concentrations are in a range from 7 ± 6 µg/m3 [at SKI(RB)] to 11 ± 7 µg/m3 [CdC(farmRB)]. Figure 10 allows us to observe the NH3 and NH4NO3 cycles during the intensive campaign in CdC[farmRB]. Although the determination coefficient is very low (R2 = 0.2), the data point out a common pattern in specific events. This pattern is observed across all individual measurement sites, indicating a potential direct relation between these two parameters.
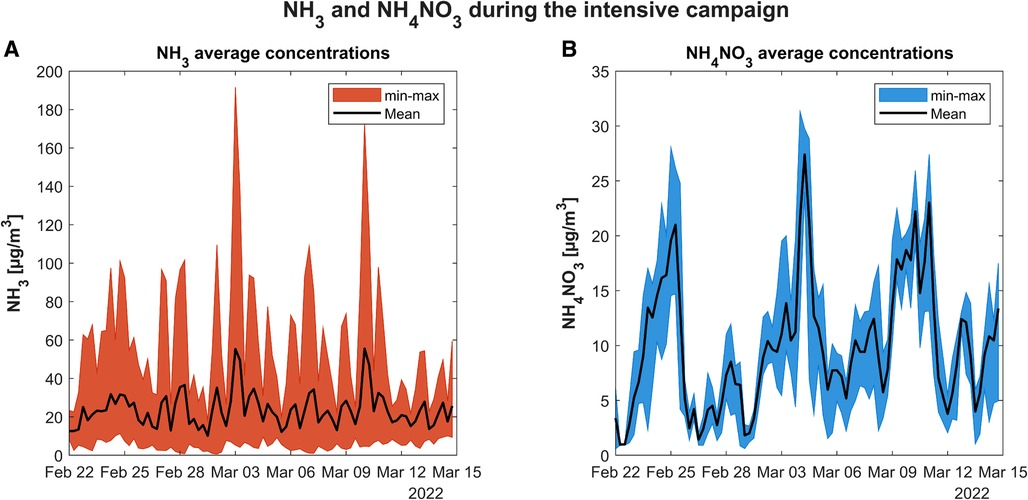
Figure 9. Variability during the intensive campaign for ammonia (A) and ammonium nitrate (B).
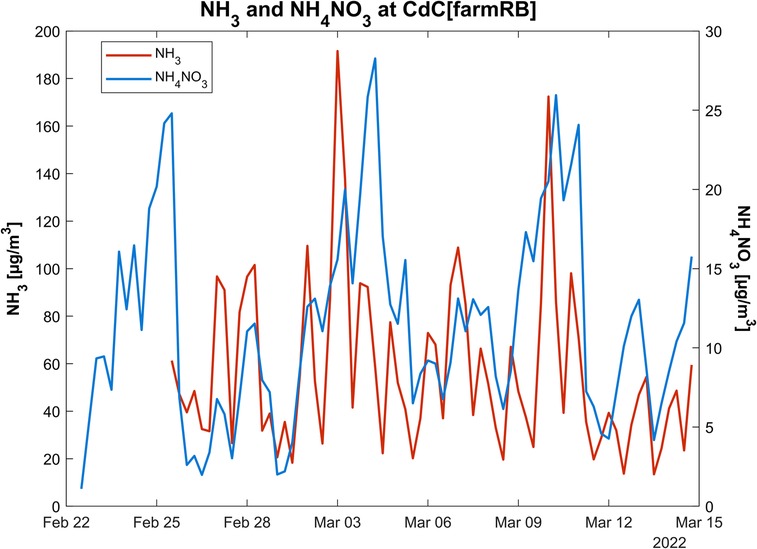
Figure 10. Comparison between maximum concentrations of ammonia and ammonium nitrate at the CdC site.
4 Discussion
In this section, we delve into the results of NH3 monitoring at the four selected sites, examining their cycle based on their sources. Subsequently, we compare the NH3 cycle with NH4NO3 concentrations and critically analyses them based on the results of chemical analyses of PM10 samples.
4.1 Concentrations of NH3 and their sources
The selected locations enable us to investigate how concentrations of this gaseous compound may vary depending on the proximity of the primary source identified by the emission inventory. Figure 11’s polar plots illustrate the relationship between NH3 levels, wind speed, and direction.
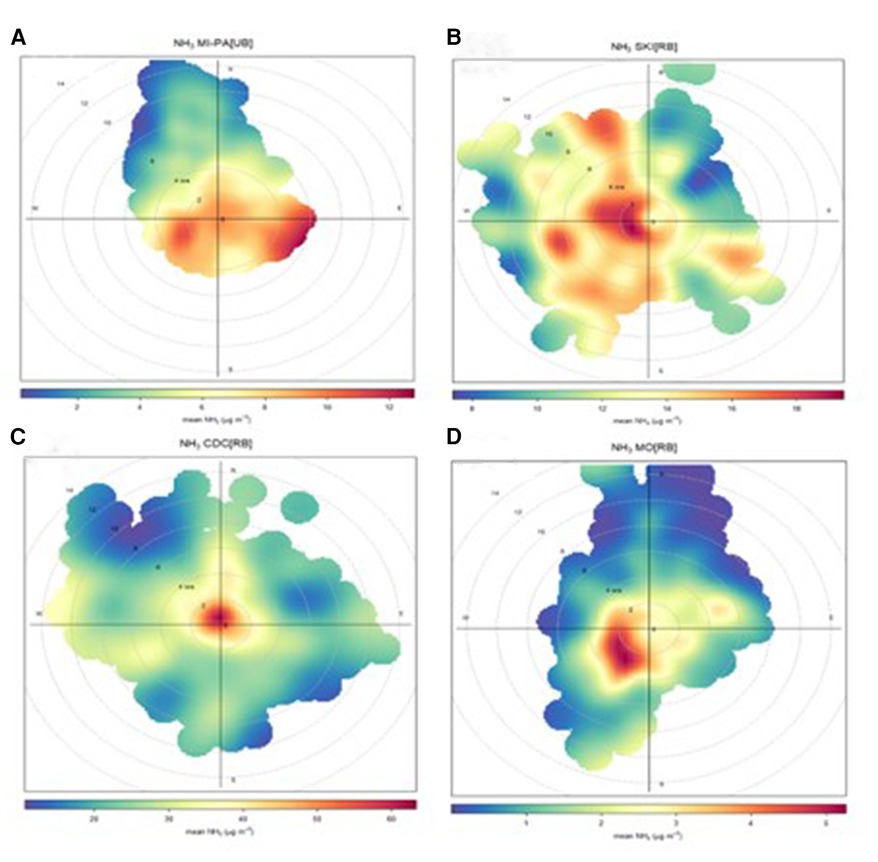
Figure 11. Polar plots for the four case study sites: (A) MI-PA[UB], (B) SKI[RB], (C) CdC[farmRB], and (D) Mo[Rem].
SKI[RB] and CdC[farmRB] sites are surrounded by agricultural fields. Source apportionment analysis at SKI[RB] suggests that traffic and/or industrial activities collectively contribute about 10% to the air quality impact. Monitoring at CdC[farmRB] in 2014 revealed low concentrations of SO2 and NOx, proxies for industrial and combustion sources. The regional emission inventory (INEMAR) emphasizes that these two sources contribute less than 5% of total NH3 emissions in the Schivenoglia and Corte de’ Cortesi administrative areas. Conversely, NH3 emissions are primarily attributed to the agricultural sector, particularly swine husbandries, accounting for over 75%. Thus, SKI[RB] and CdC[farmRB] sites reinforce the idea that NH3 concentration levels are strongly influenced by the proximity of the emissive source.
At CdC[farmRB], the polar plot indicates that the highest values are measured under no-wind or low-wind conditions, supporting a local source, such as animal husbandries. As wind speed increases, concentrations rapidly decline, though remaining high due to a persistent high background condition. Supplementary Figure S3 further supports this evidence.
The conditional functional plot, generated by eliminating extreme cases, enables the determination of the source of concentrations below the 80th percentile (Supplementary Figure S3A). This allows observation of the homogeneity of the probability of such concentrations across all wind directions and speeds, indicating that the calculated values are consistent with the local agricultural background in the Schivenoglia area. On the other hand, a local source is also suggested to affect the SKI[RB] site with high NH3 levels: the polar plot (Supplementary Figure S3B) displays the highest concentrations in low-wind conditions but also highlights that transport events can increase the background values. Limiting the observation only to the data over the 90th percentile, or 27 µg/m3, confirms that the source is indeed local, but also the concentrations in these cases are indicative of a transport process with wind speeds below 4 m/s. The little variability in the direction of origin of such concentrations suggests that the monitoring station detects activities carried out at west–northwest directions.
Figures 3, 4 demonstrate that hourly NH3 concentrations for SKI[RB] and CdC[farmRB] can reach 700 g/m3. This aligns with the findings of the campaign described in Section 3.2: soil fertilization by means of animal manure or slurry strongly affects the detected levels of NH3. Table 2 reports the arithmetical averages calculated on an hourly time resolution data in four periods, i.e., mid-February to mid-April, mid-May to mid-July, mid-September to mid-November, and the remaining periods of the year. Based on the information about agricultural practices, the observations found an explanation referring to the detected values. These are the periods in which soil fertilization occurs, although each agricultural area has its own particularity. In addition, meteorological parameters (such as temperature) affect resulting NH3 concentrations due to volatilization variability. Both these facts explain the lowest values detected for SKI[RB] and CdC[farmRB] during December and January (and for the entire L-EPA network): in these 2 months, spreading procedures are prohibited or heavily limited within the entire Po basin, and NH3 volatilization is prevented by the lower temperature that, at the same time, enhances gas-to-particles partitioning in the aerosol phase.
The Mo[Rem] site, as depicted in Figure 6D, shows distinct variability compared to other sites. In particular, the highest NH3 concentrations are measured during warmer periods and the lowest during colder ones. This observed pattern is attributed to the mixing layer height (Supplementary Figure S4): considering its location, i.e., about 1,200 m a.s.l, the site is always above the mixing layer from October to April, with the exception of some isolated events where meteorological conditions favor convective motions vertically, raising the mixing height to levels compatible with that of the site. Otherwise, during this period, the vertical stability of the atmosphere hinders compounds emitted by the Po basin from reaching altitudes above the mixing layer height. As a result, NH3 concentrations are frequently below the instrument's quantification limit. On the contrary, the maximum monthly average is in June (Figure 6D) when the site is within the mixing layer, allowing for the measurement of concentrations of air masses transported from the Po Basin (9, 14–16, 80, 81).
MI-PA[UB] (Figure 11A) demonstrates that the main source of atmospheric NH3 comes from the plain located ESE of the site, whereas the lowest values are detected in cases of wind reinforcement that cleans the atmosphere. The graph also indicates a slight increase in concentrations under light or gentle breezes (2–4 m/s) from the west, suggesting that these increases may originate from livestock activities on the opposite side of the city of Milan or from vehicular traffic.
It is known that in urban sites, a significant source of NH3 is vehicular traffic. NH3 emissions from gasoline vehicles equipped with a three-way catalyst (TWC) are an important source of NH3 in areas with heavy traffic (29, 82, 83), since it is generated as a side product in the NOx reduction process (84). Furthermore, the recent introduction of the selective catalytic reduction (SCR) system with the addition of urea or NH3 in heavy-duty vehicles (HDV), and mandatory since 2016 for Euro 5 and Euro 6 vehicles, resulted in increased NH3 emissions from traffic (85), which needs further investigation.
To verify that a fraction of the NH3 at the MI-PA[UB] site may be influenced by this source, the concentrations measured in December and January were compared with Black Carbon values (Section 2.4; Supplementary Figure S5), a well-known marker for vehicular combustion (86). In this period, regional limitations ban spreading activities according to the Nitrates Directive [and its Italian regulatory transposition DM 5046/2016 (87)]. The resulting correlation demonstrates a good level of agreement between these two parameters (R2adj = 0.661), confirming a relative contribution from this source. With the same hypotheses, an attempt was made to verify whether the addition of urea had repercussions on NH3 concentrations in Milan. The historical pattern (Figure 4) does not show an increase. It is necessary to remember that the restrictions introduced during the COVID-19 pandemic have certainly had a positive effect in reducing the impact of vehicular traffic. However, similar to before, taking into consideration the months of December and January when there is a good correlation between atmospheric NH3 and traffic, and excluding only December 2020 and January 2021, which suffered the restrictions of the second wave of COVID-19, the NH3 concentrations were averaged over the two periods: 2007–2016 and 2017–2022 with 6.4 and 11.8 µg/m3, respectively. This result cannot be used as verification of an increase in NH3 concentrations due to the addition of urea but suggests the possibility of further investigations.
4.2 Ammonia vs. ammonium nitrate in the Po Valley
The representative cycle of the six chosen monitoring sites, as detailed in Section 3.3, appears to confirm a qualitative correlation between gaseous NH3 and NH4NO3 in the aerosol phase. However, the low coefficient of determination equally indicates that the relationship between the two compounds is not linear (Section 3.3). The intensive period spans 21 days (from late February to mid-March) and is characterized by meteorological stability, with no rainfall, an average wind speed of 2 m/s, and atmospheric pressure of 1,014 hPa. In addition, thermodynamic air parameters, including humidity and temperature, are at levels that could favor the partitioning of NH4NO3 into the particulate phase.
The variability of NH4NO3 during this period (Figure 9B) highlights three events with a significant increase in concentrations occurring on (I) 25 February, (II) 4 March, and (III) 10–11 March. Compared to an average over the period of 22% of NH4NO3 in PM10, the contributions were 37%, 42%, and 33%, respectively. These three periods were investigated by analyzing the PM10 and NOx patterns, the mixing layer height, and relative humidity (Figure 12). The graphs present cycles as moving averages, helping to smooth out the time series curve by computing the average of all data points in a fixed-length window. It can be observed that in the first and third episodes, the increase in concentrations was followed by a significant decrease in the mixing layer height, reaching the lowest value in the campaign between 10 and 11 March. The second episode of increased NH4NO3 occurs instead in conjunction with an increase in the mixing layer height, which remained quite high even in the earlier time slots. The relative humidity also increases together with NH4NO3, while precursors decrease. These factors suggest the possible occurrence of an NH4NO3 formation event.
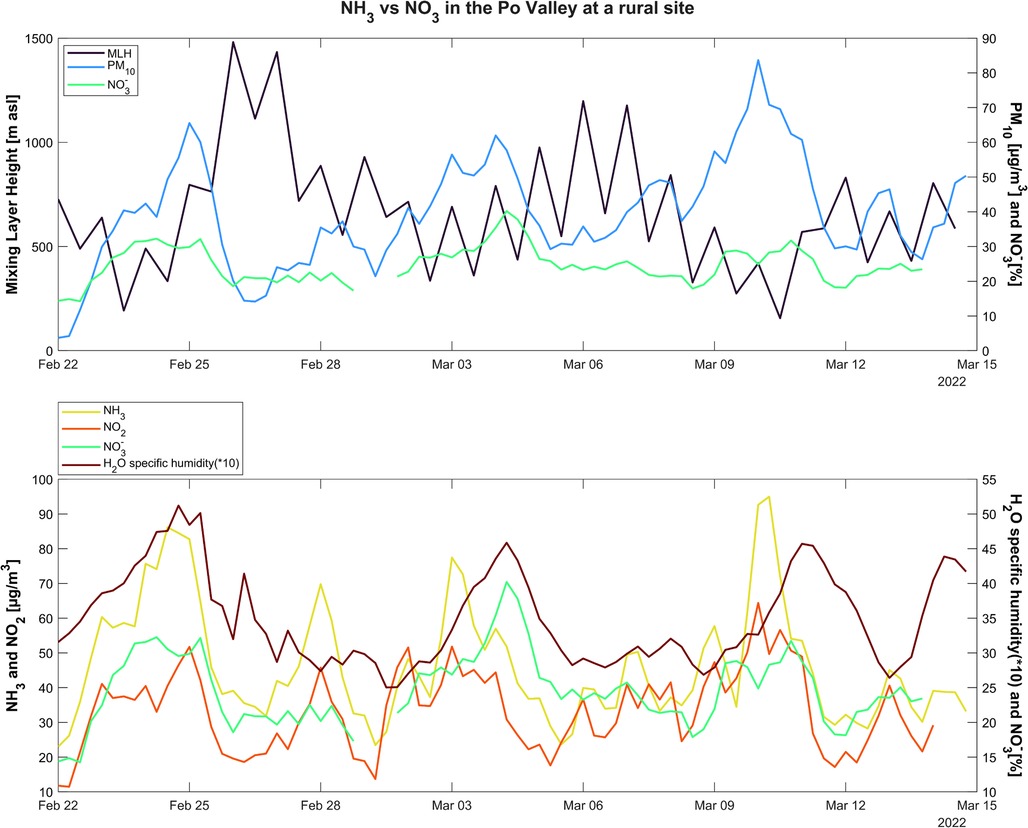
Figure 12. Moving average trend for mixing layer height (hmix) in blue, PM10 and ammonium nitrate 6-h concentrations in black and green, respectively, specific humidity (SH) (q) multiplied for 10 to be amplified in light blue, and gas precursors (NO2 in brown and NH3 in pink).
On the other hand, Figure 13 shows the average daily concentration cycle for both compounds for 1 year (2019 was chosen as an example). During the cold seasons, particularly for many peak episodes in spring and fall, it can be noticed that when NH3 increases, NH4NO3 also increases. However, several events contradict a direct cause–effect connection: in warmer periods, the condensation into NH4NO3 is inhibited by the temperature, which favors the evaporation of the nitrates. Moreover, the formation of NH4NO3 is also caused by accumulation phenomena, which occur frequently in the Po Valley, and by combustion sources. Ammonium nitrate formation, and secondary inorganic aerosol formation in general, is a complex process influenced not only by the concentration of its precursors but also by thermodynamics and meteorological conditions (20, 79), as already discussed. Nenes et al. (88) and Thunis et al. (89) published two different works about the PM2.5 response to HNO3 or NOx and NH3 emissions changes. Their modeling approaches converge to similar results, i.e., a variation in one of the two gaseous precursors does not lead to a linear change in PM2.5 concentrations and, in some cases, it could lead to the opposite result.
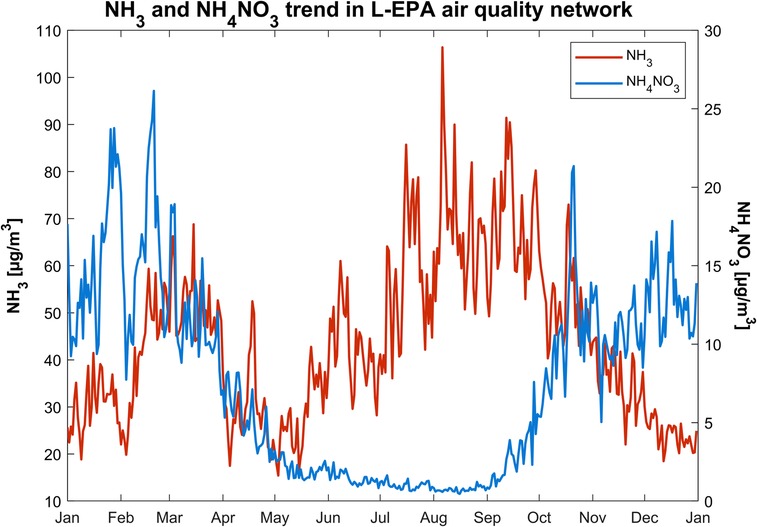
Figure 13. Average daily concentrations trend for gaseous ammonia (left axis) in black line and aerosol ammonium nitrate (right axis) in blue bar for the year 2019.
Nevertheless, it is worth noting that the findings presented in this study are based on offline analyses conducted on PM10 samples. These methodologies can be prone to negative artifacts, which may significantly underestimate the semi-volatile component of particulate matter. Past studies by Minguillón et al. (90) and Poulain et al. (91) have effectively compared offline and online analyses, the latter utilizing data from the Aerosol Chemical Speciation Monitor (ACSM, Aerodyne Research Inc.). Importantly, within the scope of this study, it is essential to highlight that offline and online nitrate correlations exhibit slopes greater than 6 during the summer months. This suggests that offline results obtained during sampling under high-temperature conditions could consistently underestimate NH4NO3 concentrations, thereby reducing the observable relationship between concentrations of gaseous precursors and the resulting particulate phase.
Data availability statement
The datasets presented in this study can be found in online repositories. The names of the repository/repositories and accession number(s) can be found in https://www.arpalombardia.it/temi-ambientali/aria/form-richiesta-dati-stazioni-fisse.
Author contributions
BB, LD, CC, EC and UD conceived and designed the study, acquired data and interpreted the results, and wrote the paper. CC, LD and BB analyzed the data. BB and UD supplied the meteorological observations. LD, UD, and CC produced the figures. LD and BB produced the tables. EC carried out the IC analyses and helped with the interpretation of the chemical speciation. GL and CC interpreted the data and reviewed and edited paper. All authors contributed to the article and approved the submitted version.
Funding
The intensive campaign reported in Section 3.3 was partially financed by the General Directorate of Agriculture of Region Lombardia.
Acknowledgments
The authors would like to thank all the technician colleagues who with their professionalism and effort make the measurement network efficient.
Conflict of interest
The authors declare that the research was conducted in the absence of any commercial or financial relationships that could be construed as a potential conflict of interest.
Publisher's note
All claims expressed in this article are solely those of the authors and do not necessarily represent those of their affiliated organizations, or those of the publisher, the editors and the reviewers. Any product that may be evaluated in this article, or claim that may be made by its manufacturer, is not guaranteed or endorsed by the publisher.
Supplementary material
The Supplementary Material for this article can be found online at: https://www.frontiersin.org/articles/10.3389/fenvh.2024.1249457/full#supplementary-material
References
1. Tang G, Zhang J, Zhu X, Song T, Münkel C, Hu B, et al. Mixing layer height and its implications for air pollution over Beijing, China. Atmos Chem Phys. (2016) 16:2459–75. doi: 10.5194/acp-16-2459-2016
2. Li X, Hu XM, Ma Y, Wang Y, Li L-G, Zhao Z, et al. Impact of planetary boundary layer structure on the formation and evolution of air-pollution episodes in Shenyang, northeast China. Atmos Environ. (2019) 214:116850. doi: 10.1016/j.atmosenv.2019.116850
3. EEA. Air Quality in Europe d 2016 Report, EEA Report No 28/2016. (2016). Available online at: https://www.eea.europa.eu/publications/air-quality-in-europe-2016 (accessed December 14, 2019).
4. Judgment of the Court (Grand Chamber) of 10 November 2020 – European Commission v Italian Republic. Case C-644/19.
5. Report ARPA Lombardia. La qualità dell'aria negli ultimi anni - Valutazione sul periodo 2016-2021. (2021). Available online at: https://www.arpalombardia.it/media/jvvll5o0/qa-milano-2016-2021.pdf (accessed May 02, 2023).
6. Life PrepAIR-Report 2 COVID-19 and air quality in the Po Valley. (2020). Available online at: https://www.lifeprepair.eu/wp-content/uploads/2021/02/Synthesis-Report_2_QA_Lockdown_Aug2020.pdf (accessed May 02, 2023).
7. Life PrepAIR-Report 3 COVID-19, The Effects of the Covid-19 Lockdown on the PM10 chemical composition in Po Valley. Available online at: https://www.lifeprepair.eu/wp-content/uploads/2021/05/summary_report3_prepair.pdf (accessed May 02, 2023).
8. Beekmann M, Prévôt ASH, Drewnick F, Sciare J, Pandis SN, Denier van der Gon HAC, et al. In situ, satellite measurement and model evidence on the dominant regional contribution to fine particulate matter levels in the Paris megacity. Atmos Chem Phys. (2015) 15:9577–91. doi: 10.5194/acp-15-9577-2015
9. Bernardoni V, Vecchi R, Valli G, Piazzalunga A, Fermo P. PM10 source apportionment in Milan (Italy) using time-resolved data. Sci Total Environ. (2011) 409(22):4788–95. doi: 10.1016/j.scitotenv.2011.07.048
10. De Meij A, Thunis P, Bessagnet B, Cuvelier C. The sensitivity of the CHIMERE model to emissions reduction scenarios on air quality in northern Italy. Atmos Environ. (2009) 43(11):1897–907, ISSN 1352-2310. doi: 10.1016/j.atmosenv.2008.12.036
11. Dimitriou K, Kassomenos P. Ionic composition of six-year daily precipitation samples collected at JRC-Ispra (Italy) in relation to synoptic patterns and air mass origin. Atmos Pollut Res. (2022) 13(12):101601. doi: 10.1016/j.apr.2022.101601
12. Larsen BR, Gilardoni S, Stenström K, Niedzialek J, Jimenez J, Belis CA. Sources for PM air pollution in the Po plain, Italy: II. Probabilistic uncertainty characterization and sensitivity analysis of secondary and primary sources. Atmos Environ. (2012) 50:203–13. doi: 10.1016/j.atmosenv.2011.12.038
13. Pathak RK, Wu WS, Wang T. Summertime PM2.5 ionic species in four major cities of China: nitrate formation in an ammonia-deficient atmosphere. Atmos Chem Phys. (2009) 9:1711–22. doi: 10.5194/acp-9-1711-2009
14. Perrino C, Catrambone M, Dalla Torre S, Rantica E, Sargolini T, Canepari S. Seasonal variations in the chemical composition of particulate matter: a case study in the Po valley. Part I: macro-components and mass closure. Environ. Sci Pollut Res. (2014) 2014(21):3999–4009. doi: 10.1007/s11356-013-2067-1
15. Sandrini S, Van Pinxteren D, Giulianelli L, Herrmann H, Poulain L, Facchini C, et al. Size-resolved aerosol composition at an urban and a rural site in the Po valley in summertime: implications for secondary aerosol formation. Atmos Chem Phys. (2016) 16(17):10879–97. doi: 10.5194/acp-16-10879-2016
16. Squizzato S, Masiol M, Brunelli A, Pistollato S, Tarabotti E, Rampazzo G, et al. Factors determining the formation of secondary inorganic aerosol: a case study in the Po valley (Italy). Atmos Chem Phys. (2013) 13:1927–39. doi: 10.5194/acp-13-1927-2013
17. Voutsa D, Samara C, Manoli E, Lazarou D, Tzoumaka P. Ionic composition of PM2.5 at urban sites of northern Greece: secondary inorganic aerosol formation. Environ Sci Pollut Res Int. (2013) 21:4995–5006. doi: 10.1007/s11356-013-2445-8
18. Life PrepAIR—Interim Report. (2021). Available online at: https://www.lifeprepair.eu/wp-content/uploads/2021/02/Synthesis-Report_2_QA_Lockdown_Aug2020.pdf. (accessed May 02, 2023).
19. Seinfeld JH, Pandis SN. Atmospheric Chemistry and Physics: From Air Pollution to Climate Change. 3rd ed. Wiley (2016). ISBN: 978-1-118-94740-1.
20. Renner E, Wolke R. Modelling the formation and atmospheric transport of secondary inorganic aerosols with special attention to regions with high ammonia emissions. Atmos Environ. (2010) 44(15):1904–12. doi: 10.1016/j.atmosenv.2010.02.018
21. Sharma M, Kishore S, Tripathi SN, Behera SN. Role of atmospheric ammonia in the formation of inorganic secondary particulate matter: a study at Kanpur, India. J Atmos Chem. (2007) 58(1):1–17. doi: 10.1007/s10874-007-9074-x
22. Gregory GL, Hoell JM Jr, Huebert BJ, van Bramer SE, LeBel PJ, Vay SA, et al. An intercomparison of airborne nitric acid measurements during CITE-2 J Geophys Res. (1990) 95(D7):10089–102. doi: 10.1029/JD095iD07p10089
23. Parrish DD, Fehsenfeld FC. Methods for gas-phase measurements of ozone, ozone precursors and aerosol precursors. Atmos Environ. (2000) 34(12–14):1921–57. doi: 10.1016/S1352-2310(99)00454-9
24. Goldan PD, Kuster WC, Albritton DL, Fehsenfeld FC, Connell PS, Norton RB, et al. Calibration and tests of the filter-collection method for measuring clean-air, ambient levels of nitric acid. Atmos Environ (1967). (1983) 17(7):1355–64. doi: 10.1016/0004-6981(83)90410-9
25. Harrison AG. Chemical Ionization Mass Spectrometry. 2nd ed. New York: Routledge (1992). p. 220. doi: 10.1201/9781315139128
26. Zhang Y, Liu R, Yang D, Guo Y, Li M, Hou K. Chemical ionization mass spectrometry: developments and applications for on-line characterization of atmospheric aerosols and trace gases. TrAC Trends Anal Chem. (2023) 168:117353. doi: 10.1016/j.trac.2023.117353
27. Hanke M, Umann B, Uecker J, Arnold F, Bunz H. Atmospheric measurements of gas-phase HNO3 and SO2 using chemical ionization mass spectrometry during the MINATROC field campaign 2000 on Monte Cimone. Atmos Chem Phys. (2003) 3(2):417–36. doi: 10.5194/acp-3-417-2003
28. Li Y, Bi M, Zhou Y, Zhang Z, Zhang K, Zhang C, et al. Characteristics of hydrogen-ammonia-air cloud explosion. Process Saf Environ Prot. (2021) 148:1207–16. doi: 10.1016/j.psep.2021.02.037
29. Reche C, Viana M, Karanasiou A, Cusack M, Alastuey A, Artiñano B, et al. Urban NH3 levels and sources in six major Spanish cities. Chemosphere. (2015) 119:769–77. doi: 10.1016/j.chemosphere.2014.07.097
30. Sutton MA, Dragosits U, Tang YS, Fowler D. Ammonia emissions from nonagricultural sources in the UK. Atmos Environ. (2000) 34:855–69. doi: 10.1016/S1352-2310(99)00362-3
31. Clarisse L, Clerbaux C, Dentener F, Hurtmans D, Coheur P-F. Global ammonia distribution derived from infrared satellite observations. Nat Geosci. (2009) 2(7):479–83. doi: 10.1038/ngeo551
32. INEMAR—ARPA Lombardia. INEMAR, Atmospheric Emissions Inventory: Emissions in the Lombardy Region in the Year 2019—Version Under Public Review. ARPA Lombardia Environmental Monitoring Sector (2022). Available online at: https://inemar.arpalombardia.it/inemar/webdata/main.seam. (accessed May 01, 2023).
33. Bussink D, Oenema O. Ammonia volatilization from dairy farming systems in temperate areas: a review. Nutr Cycl Agroecosyst. (1998) 51:19–33. doi: 10.1023/A:1009747109538
34. Backes AM, Aulinger A, Bieser J, Matthias V, Quante M. Ammonia emissions in Europe, part II: how ammonia emission abatement strategies affect secondary aerosols. Atmos Environ. (2016) 126:153–61. doi: 10.1016/j.atmosenv.2015.11.039
35. Carozzi M, Ferrara RM, Rana G, Acutis M. Evaluation of mitigation strategies to reduce ammonia losses from slurry fertilisation on arable lands. Sci Total Environ. (2013) 449:126–33. doi: 10.1016/j.scitotenv.2012.12.082
36. Ferrara RM, Loubet B, Decuq C, Palumbo AD, Di Tommasi P, Magliulo V, et al. Ammonia volatilisation following urea fertilisation in an irrigated sorghum crop in Italy. Agric For Meteorol. (2014) 195:179–91. doi: 10.1016/j.agrformet.2014.05.010
37. Morán M, Ferreira J, Martins H, Monteiro A, Borrego C, González JA. Ammonia agriculture emissions: from EMEP to a high-resolution inventory. Atmos Pollut Res. (2016) 7(5):786–98. doi: 10.1016/j.apr.2016.04.001
38. Skjøth CA, Geels C. The effect of climate and climate change on ammonia emissions in Europe. Atmos Chem Phys. (2013) 13(1):117–28. doi: 10.5194/acp-13-117-2013
39. Sutton MA, Place CJ, Eager M, Fowler D, Smith RI. Assessment of the magnitude of ammonia emissions in the United Kingdom. Atmos Environ. (1995) 29(12):1393–411. doi: 10.1016/1352-2310(95)00035-W
40. Xu J, Chen J, Zhao N, Wang G, Yu G, Li H, et al. Importance of gas-particle partitioning of ammonia in haze formation in the rural agricultural environment. Atmos Chem Phys. (2020) 20(12):7259–69. doi: 10.5194/acp-20-7259-2020
41. Zilio M, Orzi V, Chiodini ME, Riva C, Acutis M, Boccasile G, et al. Evaluation of ammonia and odour emissions from animal slurry and digestate storage in the Po Valley (Italy). Waste Manage. (2020) 103:296–304. doi: 10.1016/j.wasman.2019.12.038
42. Viatte C, Wang T, Van Damme M, Dammers E, Meleux F, Clarisse L, et al. Atmospheric ammonia variability and link with particulate matter formation: a case study over the Paris area. Atmos Chem Phys. (2020) 20:577–96. doi: 10.5194/acp-20-577-2020
43. Stelson AW, Seinfeld JH. Relative humidity and temperature dependence of the ammonium nitrate dissociation constant. Atmos Environ. (1982) 16(5):983–92. doi: 10.1016/0004-6981(82)90184-6
44. Dale VH, Polasky S. Measures of the effects of agricultural practices on ecosystem services. Ecol Econ. (2007) 64(2):286–96. doi: 10.1016/j.ecolecon.2007.05.009
45. Grout L, Hales S, French N, Baker MG. A review of methods for assessing the environmental health impacts of an agricultural system. Int J Environ Res Public Health. (2018) 15:1315. doi: 10.3390/ijerph15071315
46. Polichetti G, Cocco S, Spinali A, Trimarco V, Nunziata A. Effects of particulate matter (PM10, PM2. 5 and PM1) on the cardiovascular system. Toxicology. (2009) 261(1–2):1–8. doi: 10.1016/j.tox.2009.04.035
47. Kelly FJ, Fussell JC. Size, source and chemical composition as determinants of toxicity attributable to ambient particulate matter. Atmos Environ. (2012) 60:504–26. doi: 10.1016/j.atmosenv.2012.06.039
48. Pietrogrande MC, Biffi B, Colombi C, Cuccia E, Dal Santo U, Romanato L. Contribution of chemical composition to oxidative potential of atmospheric particles at a rural and an urban site in the Po Valley: influence of high ammonia agriculture emissions. Atmos Environ. (2023) 318:120203. doi: 10.1016/j.atmosenv.2023.120203
49. Bones DL, Henricksen DK, Man SA, Gonsior M, Bateman AP, Nguyen TB, et al. Appearance of strong absorbers and fluorophores in limonene-O3 secondary organic aerosol due to NH4+-mediated chemical aging over long time scales. J Geophys Res. (2010) 115(D5):D05203. doi: 10.1029/2009JD012864
50. Daellenbach KR, Uzu G, Jiang J, Cassagnes LE, Leni Z, Vlachou A, et al. Sources of particulate-matter air pollution and its oxidative potential in Europe. Nature. (2020) 587(7834):414–9. doi: 10.1038/s41586-020-2902-8
51. Wang Y, Cui S, Fu X, Zhang Y, Wang J, Fu P, et al. Secondary organic aerosol formation from photooxidation of C3H6 under the presence of NH3: effects of seed particles. Environ Res. (2022) 211:113064. doi: 10.1016/j.envres.2022.113064
52. Babar ZB, Park JH, Lim HJ. Influence of NH3 on secondary organic aerosols from the ozonolysis and photooxidation of α-pinene in a flow reactor. Atmos Environ. (2017) 164:71–84. doi: 10.1016/j.atmosenv.2017.05.034
53. Laskin J, Laskin A, Roach PJ, Slysz GW, Anderson GA, Nizkorodov SA, et al. High-resolution desorption electrospray ionization mass spectrometry for chemical characterization of organic aerosols. Anal Chem. (2010) 82(5):2048–58. doi: 10.1021/ac902801f
54. Updyke KM, Nguyen TB, Nizkorodov SA. Formation of brown carbon via reactions of ammonia with secondary organic aerosols from biogenic and anthropogenic precursors. Atmos Environ. (2012) 63:22–31. doi: 10.1016/j.atmosenv.2012.09.012
55. Smith AP, Christie KM, Harrison MT, Eckard RJ. Ammonia volatilisation from grazed, pasture based dairy farming systems. Agric Sys. (2021) 190:103119. doi: 10.1016/j.agsy.2021.103119
56. Directive 2008/50/EC of the European Parliament and of the Council of 21 May 2008 on ambient air quality and cleaner air for Europe. https://eur-lex.europa.eu/eli/dir/2008/50/oj (accessed May 02, 2023).
57. Hodgeson JA. A review of chemiluminescent techniques for air pollution monitoring. Toxicol Environ Chem Rev. (1974) 2(2):81–97. doi: 10.1080/02772247409356921
58. Joseph DW, Spicer CW. Chemiluminescence method for atmospheric monitoring of nitric acid and nitrogen oxides. Anal Chem. (1978) 50(9):1400–3. doi: 10.1021/ac50031a054
59. EN 14211:2005. Ambient air quality—standard method for the measurement of the concentration of nitrogen dioxide and nitrogen monoxide by chemiluminescence (2005). Available online at: https://store.uni.com/uni-en-14211-2005 (accessed September 02, 2005).
60. Berden G, Peeters R, Meier G. Cavity ring-down spectroscopy: experimental schemes and applications. Int Rev Phys Chem. (2000) 19(4):565–607. doi: 10.1080/014423500750040627
61. Kamp JN, Chowdhury A, Adamsen APS, Feilberg A. Negligible influence of livestock contaminants and sampling system on ammonia measurements with cavity ring-down spectroscopy. Atmos Meas Tech. (2019) 12:2837–50. doi: 10.5194/amt-12-2837-2019
62. Ministero Dell'ambiente E Della Tutela Del Territorio E Del Mare Decreto 30 Marzo 2017. Available online at https://www.gazzettaufficiale.it/eli/id/2017/04/26/17A02825/sg (accessed May 02, 2023).
63. Elser M, El-Haddad I, Maasikmets M, Bozzetti C, Wolf R, Ciarelli G, et al. High contributions of vehicular emissions to ammonia in three European cities derived from mobile measurements. Atmos Environ. (2018) 175:210–20. doi: 10.1016/j.atmosenv.2017.11.030
64. von Bobrutzki K, Braban CF, Famulari D, Jones SK, Blackall T, Smith TEL, et al. Field inter-comparison of eleven atmospheric ammonia measurement techniques. Atmos Meas Tech. (2010) 3:91–112. doi: 10.5194/amt-3-91-2010
65. Twigg MM, Berkhout AJ, Cowan N, Crunaire S, Dammers E, Ebert V, et al. Intercomparison of in situ measurements of ambient NH3: instrument performance and application under field conditions. Atmos Meas Tech. (2022) 15:6755–87. doi: 10.5194/amt-15-6755-2022
66. CEN TC 264 WG 11, N 17346:2020. Ambient air—standard method for the determination of the concentration of ammonia using diffusive samplers. Available online at: https://standards.iteh.ai/catalog/tc/cen/57d1f54b-a3d7-4732-89be-02acd73d3227/cen-tc-264-wg-11 (accessed June 20, 2023).
67. NIOSH. “Method 6015: Ammonia,” Issue 2. NIOSH Manual of Analytical Methods. 4th ed. Washington, DC: DHHS (NIOSH) (1994). (Publication No. 94-113).
68. NIOSH. “Method 6016: Ammonia by IC” Issue 1. NIOSH Manual of Analytical Methods. 4th ed. Washington, DC: DHHS (NIOSH) (1996).
69. Cuddeback JE, Saltzman BE, Burg WR. Solid absorbent method for sampling and analysis of nitrogen dioxide in ambient air. J Air Pollut Control Assoc. (1975) 25(7):725–9. doi: 10.1080/00022470.1975.10470132
70. Bishop RW, Belkin F, Gaffney R. Evaluation of a new ammonia sampling and analytical procedure. Am Ind Hyg Assoc J. (1986) 47(2):135–7. doi: 10.1080/15298668691389450
71. Müller T, Fiebig M. ACTRIS in situ aerosol: guidelines for manual QC of AE33 absorption photometer data. (2018). Available online at: https://www.actris-ecac.eu/ (accessed July 24, 2023).
72. Nair AA, Yu F. Quantification of atmospheric ammonia concentrations: a review of its measurement and modeling. Atmosphere (Basel). (2020) 11:1092. doi: 10.3390/atmos11101092
73. Vecchi R, Marcazzan G, Valli G, Ceriani M, Antoniazzi C. The role of atmospheric dispersion in the seasonal variation of PM1 and PM2.5 concentration and composition in the urban area of Milan (Italy). Atmos Environ. (2004) 38(27):4437–46. doi: 10.1016/j.atmosenv.2004.05.029
74. Amato F, Alastuey A, Karanasiou A, Lucarelli F, Nava S, Calzolai G, et al. AIRUSE-LIFEC: a harmonized PM speciation and source apportionment in five southern European cities. Atmos Chem Phys. (2016) 16:3289–309. doi: 10.5194/acp-16-3289-2016
75. Daellenbach KR, Manousakas M, Jiang J, Cui T, Chen Y, El Haddad I, et al. Organic aerosol sources in the Milan metropolitan area—receptor modelling based on field observations and air quality modelling. Atmos Environ. (2023) 307:1352–2310. doi: 10.1016/j.atmosenv.2023.119799
76. Lonati G, Giugliano M, Butelli P, Romele L, Tardivo R. Major chemical components of PM2.5 in Milan (Italy). Atmos Environ. (2005) 39:1925–34. doi: 10.1016/j.atmosenv.2004.12.012
77. Vecchi R, Marcazzan G, Valli G. A study on nighttime–daytime PM10 concentration and elemental composition in relation to atmospheric dispersion in the urban area of Milan (Italy). Atmos Environ. (2007) 41(10):2136–44. doi: 10.1016/j.atmosenv.2006.10.069
78. Belis CA, Cancelinha J, Duane M, Forcina V, Pedroni V, Passarella R, et al. Sources for PM air pollution in the Po plain, Italy: I. Critical comparison of methods for estimating biomass burning contributions to benzo(a)pyrene. Atmos Environ. (2011) 45:7266–75. doi: 10.1016/j.atmosenv.2011.08.061
79. Tang IN. On the equilibrium partial pressure of nitric acid and ammonia in the atmosphere. Atmos Environ. (1980) 14:819–28. doi: 10.1016/0004-6981(80)90138-9
80. Pietrogrande MC, Colombi C, Cuccia E, Dal Santo U, Romanato L. The impact of COVID-19 lockdown strategies on oxidative properties of ambient PM10 in the metropolitan area of Milan, Italy. Environments. (2022) 9(11):145. doi: 10.3390/environments9110145
81. Pietrogrande MC, Demaria G, Colombi C, Cuccia E, Dal Santo U. Seasonal and spatial variations of PM10 and PM2.5 oxidative potential in five urban and rural sites across Lombardia region, Italy, Italy. Environ Res Publ Health. (2022) 19:7778. doi: 10.3390/ijerph19137778
82. Perrino C, Catrambone M, Di Menno Di Bucchianico A, Allegrini I. Gaseous ammonia in the urban area of Rome, Italy and its relationship with traffic emissions. Atmos Environ. (2002) 36(34):5385–94. doi: 10.1016/S1352-2310(02)00469-7
83. Reche C, Viana M, Pandolfi M, Alastuey A, Moreno T, Amato F, et al. Urban NH3 levels and sources in a Mediterranean environment. Atmos Environ. (2012) 57:153–64. doi: 10.1016/j.atmosenv.2012.04.021
84. Huai T, Durbin TD, Miller JW, Pisano JT, Sauer CG, Rhee SH, et al. Investigation of NH3 emissions from new technology vehicles as a function of vehicle operating conditions. Environ Sci Technol. (2003) 37:4841–7. doi: 10.1021/es030403
85. Suarez-Bertoa R, Astorga C. Unregulated emissions from light-duty hybrid electric vehicles. Atmos Environ. (2016) 136:134–43. doi: 10.1016/j.atmosenv.2016.04.021
86. Liu Y, Yan C, Zheng M. Source apportionment of black carbon during winter in Beijing. Sci Total Environ. (2018) 618:531–41. doi: 10.1016/j.scitotenv.2017.11.053
87. Interministerial Decree No. 5046 of February 25, 2016, of the Italian State: Criteria and general technical regulations for the regional discipline of the agronomic utilization of livestock effluents and wastewater referred to in Article 112 of Legislative Decree April 3, 2006, No. 152, as well as for the production and agronomic utilization of digestate referred to in Article 52, paragraph 2-bis of the decree-law of June 22, 2012, No. 83, converted into law on August 7, 2012, No. 134.
88. Nenes A, Pandis SN, Weber RJ, Russell A. Aerosol pH and liquid water content determine when particulate matter is sensitive to ammonia and nitrate availability. Atmos Chem Phys. (2020) 20:3249–58. doi: 10.5194/acp-20-3249-2020
89. Thunis P, Clappier A, Beekmann M, Putaud JP, Cuvelier C, Madrazo J, et al. Non-linear response of PM2.5 to changes in NOx and NH3 emissions in the Po basin (Italy): consequences for air quality plans. Atmos Chem Phys. (2021) 21:9309–27. doi: 10.5194/acp-21-9309-2021
90. Minguillón MC, Ripoll A, Pérez N, Prévôt AS, Canonaco F, Querol X. Chemical characterization of submicron regional background aerosols in the western Mediterranean using an aerosol chemical speciation monitor. Atmos Chem Phys. (2015) 15(11):6379–91. doi: 10.5194/acp-15-6379-2015
91. Poulain L, Spindler G, Grüner A, Tuch T, Stieger B, van Pinxteren D, et al. Multi-year ACSM measurements at the central European research station Melpitz (Germany)—part 1: instrument robustness, quality assurance, and impact of upper size cutoff diameter. Atmos Meas Tech. (2020) 13(9):4973–94. doi: 10.5194/amt-13-4973-2020
Keywords: ammonia, animal husbandry, ammonium nitrate, Po Valley, PM, secondary aerosol, gaseous precursors
Citation: Colombi C, D’Angelo L, Biffi B, Cuccia E, Dal Santo U and Lanzani G (2024) Monitoring ammonia concentrations in more than 10 stations in the Po Valley for the period 2007–2022 in relation to the evolution of different sources. Front. Environ. Health 3:1249457. doi: 10.3389/fenvh.2024.1249457
Received: 28 June 2023; Accepted: 21 February 2024;
Published: 11 March 2024.
Edited by:
Xavier Querol, Spanish National Research Council (CSIC), SpainReviewed by:
Cristina Mangia, National Research Council (CNR), ItalySailesh Behera, Shiv Nadar University, India
© 2024 Colombi, D'Angelo, Biffi, Cuccia, Dal Santo and Lanzani. This is an open-access article distributed under the terms of the Creative Commons Attribution License (CC BY). The use, distribution or reproduction in other forums is permitted, provided the original author(s) and the copyright owner(s) are credited and that the original publication in this journal is cited, in accordance with accepted academic practice. No use, distribution or reproduction is permitted which does not comply with these terms.
*Correspondence: C. Colombi Yy5jb2xvbWJpQGFycGFsb21iYXJkaWEuaXQ=