 Harumi Ikei
 Chorong Song
 Yasuko Sagasaki3
 Yoshifumi Miyazaki
- 1Institute for Advanced Academic Research, Chiba University, Chiba, Japan
- 2Center for Environment, Health and Field Sciences, Chiba University, Kashiwa, Japan
- 3Nozaki Clinic, Tokyo, Japan
Depression rates have been rising globally, making it a significant public health concern. Increasing evidence suggests that exposure to natural environments has positive effects on mental health. However, most studies on the restorative effects of nature have focused on healthy individuals, with limited data available on vulnerable populations, such as patients with depression. This study examined the physiological and psychological relaxation effects of viewing a small urban green space (biotope) on outpatients with depression. Conducted in an urban clinical setting, this crossover study involved 28 adult male outpatients with major depressive disorder. The experimental condition involved viewing a biotope outside the clinic, while the control condition involved viewing a building facade. Heart rate variability was used as a physiological indicator, while subjective evaluations were conducted using the modified semantic differential method and the Profile of Mood States 2nd Edition (POMS 2) short version. Results indicated that biotope viewing significantly increased parasympathetic nervous activity while decreasing sympathetic nervous activity. Subjectively, participants reported increased comfort, relaxation, and naturalness. POMS 2 assessments further revealed a significant reduction in negative affect scores and an increase in positive affect scores. This study provides empirical evidence that integrating small-scale urban greenery into clinical environments can promote relaxation and well-being in individuals with depression. Given the high levels of stress in urban populations, particularly in overcrowded cities like Tokyo, incorporating accessible green spaces in urban planning may serve as a viable intervention to mitigate environmental health disparities and improve mental health outcomes.
1 Introduction
Depression has become a global issue, with approximately 246 million people presenting with major depressive disorder (1). The incidence of depression remarkably increased within the first year of the coronavirus disease 2019 pandemic, with the addition of 53.2 million people diagnosed with the condition (1). Moreover, depression can remain an issue in a stressful society, and its incidence can further increase in the future.
Physiologically, major depressive disorder has been associated with autonomic nervous system dysregulation, particularly a reduction in parasympathetic nervous activity and an increase in sympathetic nervous activity. Koch et al. (2) conducted a meta-analysis of 2,250 patients with major depressive disorder and 1,982 healthy controls, reporting significantly lower parasympathetic activity—measured by high-frequency (HF) heart rate variability—in the depressed group. Similarly, Kemp et al. (3) and Shinba (4) observed decreased HF components in patients with depression compared to age- and sex-matched healthy controls. Furthermore, multiple studies have demonstrated increased sympathetic nervous activity in depressed individuals, as indicated by a higher low-frequency (LF)/HF ratio (2–5).
Recent research has highlighted the potential of natural environments, such as forests and parks, to promote relaxation and improve mental health. Since the early 2000s, nature therapy studies using physiological indicators have gained traction, accumulating substantial scientific evidence (6–8). Exposure to natural settings has been shown increasing parasympathetic nervous activity while suppressing sympathetic nervous activity. For instance, participants who viewed forests for 15 minutes had increased parasympathetic nervous activity and decreased sympathetic nervous activity compared with those who viewed urban areas (9). Similar findings have been reported for individuals walking in forest (10), and parks during spring season (11) and fall season (12).
Nature-based interventions such as forest therapy and horticultural therapy are increasingly recognized as effective nonpharmacological treatments for depression. In a meta-analysis performed by Bettmann et al. (13), intentional exposure to natural environment was associated with substantially positive outcomes including enhanced emotional stability, reduced depression and anxiety, and improved quality of life in adults with mental illnesses. Similarly, based on a meta-analysis conducted by Rosa et al. (14), forest therapy was more effective in alleviating depressive symptoms compared with interventions focusing on hospital-based activities, exposure to urban environment, dietary therapy, and exercise therapy. Kotera et al. (15) performed a statistical review and meta-analysis. Results showed that forest therapy reduced mental health symptoms and anxiety in the short term. Mizumoto et al. (16) investigated the effects of visual stimuli from nature on patients with depression. Their study showed that exposure to natural landscape images for just 3 min resulted in a significant mood improvement.
Despite these findings, the physiological effects of visual contact with nature on patients with depression remain unclear. If proven effective, integrating natural elements into healthcare settings and urban planning could serve as a cost-effective, evidence-based intervention to support mental well-being. Therefore, the current study aimed to elucidate the effects of viewing a biotope situated in the small outdoor space between an urban clinic and the street on patients with depression, on patients with depression using parasympathetic and sympathetic nervous activities as indicators.
2 Materials and methods
2.1 Participants
This study included adult male patients with depression who were treated at the Nozaki Clinic. The inclusion criteria were as follows: individuals without chronic rhinitis or asthma, those without irregular heartbeats, and those who did not smoke.
The number of expected participants was set at 32. In total, 32 participants were initially recruited. However, four who were absent or returned home during the measurement due to illness or other reasons were excluded. Ultimately, 28 participants joined the study. The age, height, weight, and body mass index (mean ± standard deviation, minimum–maximum) of the participants were 43.8 ± 8.6, 20–59 years; 168.3 ± 5.3, 157–178 cm; 74.3 ± 10.5, 58–95 kg; and 26.3 ± 4.3, 19.6–38.5, respectively. Using the assessment using the Zung Self-Rating Depression Scale (17, 18), a self-rating scale for assessing the psychological and physical symptoms of depression, 9 participants were classified as having mild depression, 12 as having moderate depression, and 7 as having severe depression. The mean SDS score of the 28 participants was 51.6 ± 7.4 (which indicated moderate depression). Before measurement, all participants were fully informed about the purpose and procedures of the study, and a written informed consent was obtained from the participants. The current study was conducted according to the guidelines of the Declaration of Helsinki. The experimental protocol was approved by the Ethics Committee of the Center for Environment, Health and Field Sciences, Chiba University, Japan (approval number: 5). Further, it was registered in the University Hospital Medical Information Network (registration number: UMIN000028234).
2.2 Visual stimulation
In this study, the term “biotope” refers to a small, purposefully designed green space adjacent to the clinic, featuring a waterfall, a stream, and a variety of plant species. It was intended to serve as a therapeutic micro-environment.
A small green space with a waterfall and a stream (referred to as biotope) constructed on the side of the Nozaki Clinic in Tokyo was used as a visual stimulus (Figure 1a). The width and depth of the biotope were approximately 7.0 m and 0.7–2.5 m, respectively (Figures 1b,c). The waterscape elements included a waterfall with a height of approximately 1.2 m and a stream with a length of approximately 4.0 m. The trees included medium-sized trees such as Japanese maples (Acer palmatum), Japanese dogwood (Cornus kousa), fragrant orange-colored olive (Osmanthus fragrans), and Japanese knotweeds (Ilex pedunculosa). Further, there were low-lying trees such as snow willow (Ilex pedunculosa), Wisteria (Wisteria floribunda), Japanese silver leaf (Farfugium japonicum), lily of the valley (Convallaria majalis), urn orchid (Bletilla striata), saxifrage (Saxifraga stolonifera), and Chinese lucky grass (Reineckea carnea). The plants included Japanese sweet flag (Acorus gramineus), water lily (Nymphaea), native violet (Viola banksii), and Japanese horseradish (Eutrema japonicum) (Figure 1d).
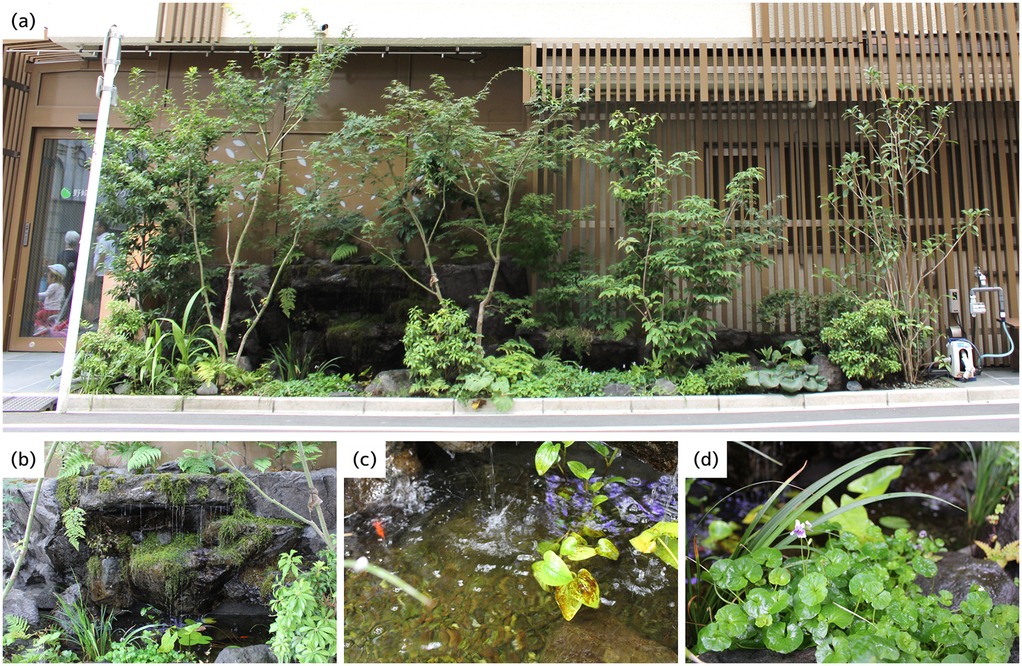
Figure 1. A small green biotope with a waterfall and a stream constructed on the side of the clinic: (a) entire biotope, (b) waterfall, (c) stream below the waterfall, (d) plants such as native violet (Viola banksii).
2.3 Study protocol
The intervention was visual stimulation, and the one-factor, two-condition (biotope and control) crossover comparison test (within-subject experiment) was conducted. The visual stimulus was a biotope (Figure 2a), and the control condition for comparison was a building wall across the street (Figure 2b).
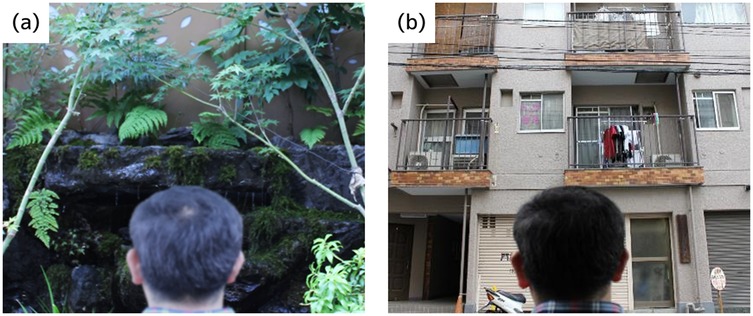
Figure 2. Scenery of visual exposure: (a) biotope, (b) control.
The experiment was conducted on three Sundays (July 11, 23, and 30, 2017) at the Nozaki Clinic in Tokyo. Weather conditions were generally sunny to partly cloudy, with a brief episode of rain in the afternoon on July 23 that cleared quickly. The average ambient temperature during the sessions was 28.6 ± 1.5°C, and the relative humidity was 70% ± 8%. Vertical illuminance (eye level) was measured under both experimental conditions. In the biotope condition, vertical illuminance was approximately 500 lx, whereas in the control condition (building wall), it was approximately 2,700 lx. These values reflect the natural lighting environments experienced by participants during visual stimulation.
Two participants each received an explanation of the measurement in the waiting room of the clinic. Then, they signed a consent form and moved to the outdoor measurement space, where one sat facing the biotope and the other the control. The participants looked at the view in front of them for 4 min (Figure 3). After answering the subjective evaluation, the participants switched seats and looked at the view in the same way as in the first session. Their physiological responses were measured continuously.
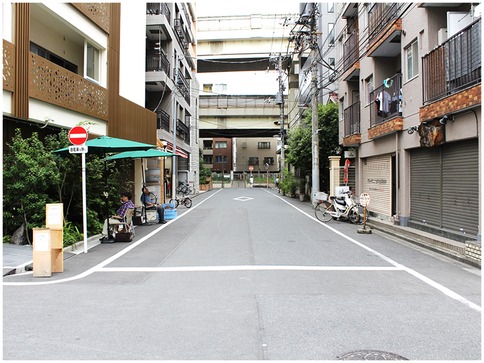
Figure 3. Overall view of the experimental setting. The image shows the spatial arrangement of participants and visual stimuli.
2.4 Physiological parameters
Heart rate variability, a measure of autonomic nervous activity, was used as a physiological index (19, 20). Data on R-R interval were acquired using a portable electrocardiogram monitor (Activtracer AC-301A, GMS). Frequency analysis was performed using the maximum entropy method (MemCalc/Win, GMS) to calculate power values for the HF component (0.15–0.40 Hz) and the LF component (0.04–0.15 Hz) (21). The HF component was used as an index of parasympathetic nervous activity, which increases during relaxation. The LF/HF component was utilized as an index of sympathetic nervous activity, which increases during stress and arousal. For normalization, these measurements were converted to natural logarithm-transformed values (22).
To remove the effects of movement from the waiting room to the measurement space and movement between seats, data obtained from immediately after the start of visual stimulation to the second minute were excluded. To evaluate the effects of biotope and control visual stimulation on autonomic nervous activity, the two-minute averages from the third to the fourth minute of visual stimulation were calculated.
2.5 Psychological parameters
The modified semantic differential (SD) method (23) and the Profile of Mood States 2nd Edition 2 (POMS 2) short version (24, 25) were used to assess impressions and changes in mood state induced by visual stimuli.
The modified SD method used three paired adjectives (comfortable–uncomfortable, relaxed–aroused, and natural–artificial) to subjectively rate impressions on a 13-point scale (–6 to 6). The abbreviated version of POMS 2 was used for 35 questions comprising five negative mood state scales (T–A: tension–anxiety, D–D: depression–dejection, A–H: anger–hostility, F–I: fatigue–inertia, and C–B: confusion–bewilderment) and two positive mood state scales (V–A: vigor–activity, F: friendliness). Mood state was assessed by responding on a 5-point scale, from extremely (4) to not at all (0). The total mood disturbance (TMD) score was calculated by subtracting the score for vitality–vigor from the total score of the five negative mood state scales. A smaller score on the TMD scale indicated a more positive mood state.
2.6 Statistical analysis
All statistical analyses were performed using the Statistical Package for the Social Sciences software (v29.0; IBM Corp., Armonk, NY, the USA), and a p value of <0.05 was considered statistically significant. The physiological and psychological indices were expressed as means ± standard error of the mean. The corresponding t-tests were utilized to determine the differences in physiological indices between the biotope and control. The Wilcoxon signed-rank sum tests were applied in the psychological evaluations. Effect sizes were determined using Cohen's d (d) (26) for the physiological indices and probability of superiority (PSdep) (27) for the psychological indices.
3 Results
3.1 Physiological parameters
Figure 4 shows the changes in lnHF values, a measure of parasympathetic nervous activity that increases during relaxation. The lnHF values after viewing the biotope significantly increased compared with those after viewing the control (3.60 ± 0.31 vs. 3.29 ± 0.32 lnms2) [t(27) = 2. 099, p = 0.045, d = 0.39].
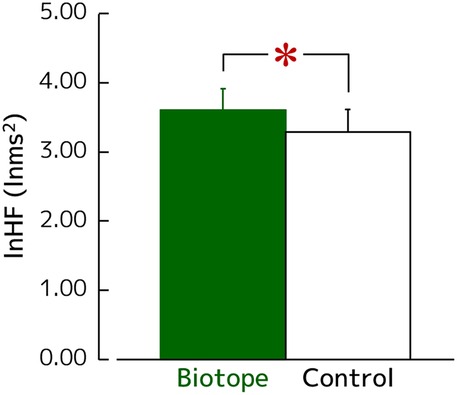
Figure 4. Changes in the lnHF, which reflect the parasympathetic nervous activity during visual exposure. N = 28, mean ± standard error. *p < 0.05 as determined using the paired t-test.
Figure 5 shows the changes in ln(LF/HF) values, a measure of sympathetic nervous activity that increases during stress and arousal. The ln(LF/HF) values after viewing the biotope significantly decreased compared with those after viewing the control (0.44 ± 0.18 vs. 0.87 ± 0.19) [t(27) = −2.232, p = 0.034, d = 0.42].
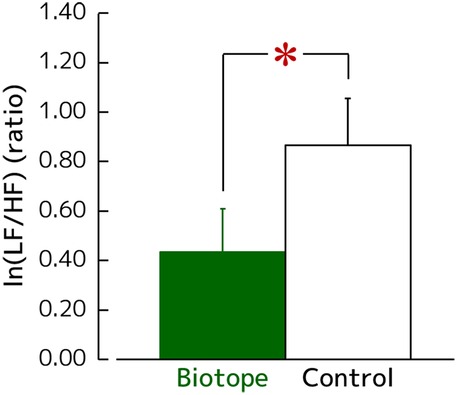
Figure 5. Changes in the ln(LF/HF), which reflect the sympathetic nervous activity during visual exposure. N = 28, mean ± standard error. *p < 0.05 as determined using the paired t-test.
By contrast, there was no significant difference in terms of heart rate between the participants who viewed the biotope and those who viewed the control (88.2 ± 3.3 vs. 88.6 ± 3.2 bpm) [t(27) = −0.765, p = 0.451, d = 0.12].
3.2 Psychological parameters
Figure 6 shows the results of the impression evaluation using the modified SD method. In terms of comfort, the biotope was rated as moderately comfortable (4.2 ± 0.2) and significantly more comfortable than the control. Meanwhile, the control was rated as indifferent to slightly uncomfortable (−1.7 ± 0.3) (Figure 6a; p < 0.001, PSdep = 1.000). In terms of relaxation, the biotope was rated as moderately relaxing (3.9 ± 0.3). The control was rated as indifferent to slightly awakening (−1.9 ± 0.4) (Figure 6a; p < 0.001, PSdep = 0.964). In terms of naturalness, the biotope was perceived as slightly to moderately natural (2.9 ± 0.5) and the control as moderately to extremely artificial (−4.5 ± 0.3). Hence, based on these findings, there was a significant difference between the biotope and control (Figure 6a; p < 0.001, PSdep = 0.929).
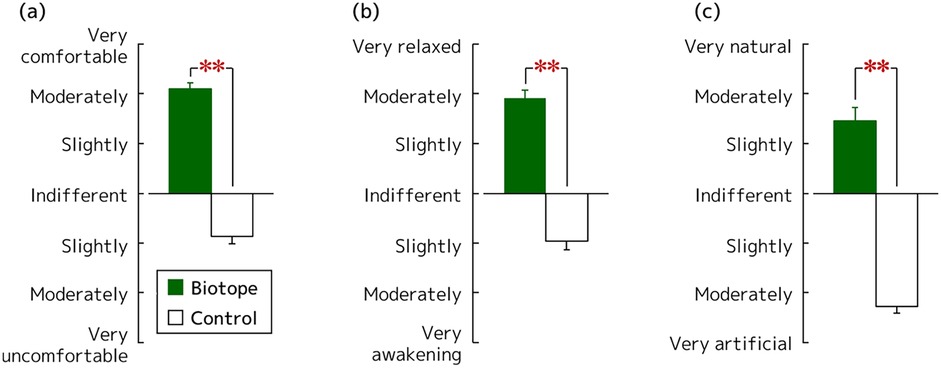
Figure 6. Impression evaluation of the biotope as a visual stimulus using the modified SD method: (a) comfortable feeling, (b) relaxed feeling, and (c) natural feeling. N = 28, mean ± standard error. **p < 0.01 as determined using the Wilcoxon signed-rank test.
Figure 7 shows the results of the POMS 2 short version. The A–H (biotope: 1.5 ± 0.6, control: 5.6 ± 1.0, p < 0.001, PSdep = 0.679), C–B (biotope: 2.6 ± 0.6, control: 6.5 ± 0.9, p < 0.001, PSdep = 0.750), D–D (biotope: 2.6 ± 0.6, control: 6.5 ± 1.0, p < 0.001, PSdep = 0.750), F–I (biotope: 1.6 ± 0.6, control: 6.6 ± 1.1, p < 0.001, PSdep = 0.821), and T–A (biotope: 2.4 ± 0.7, control: 7.6 ± 0.9, p < 0.001, PSdep = 0.857) scores after viewing the biotope were significantly lower than those after viewing the control. For the positive mood scales, the V–A (biotope: 7.9 ± 0.8, control: 2.5 ± 0.6, p < 0.001, PSdep = 0.839) and F (biotope: 7.7 ± 0.9, control: 3.6 ± 0.7, p < 0.001, PSdep = 0.714) score after viewing the biotope were significantly higher than those after viewing the control. The TMD score, which is a measure of overall mood, after viewing the biotope was significantly lower than that after viewing the control (biotope: 2.7 ± 3.0, control: 30.4 ± 4.2, p < 0.001, PSdep = 0.929).
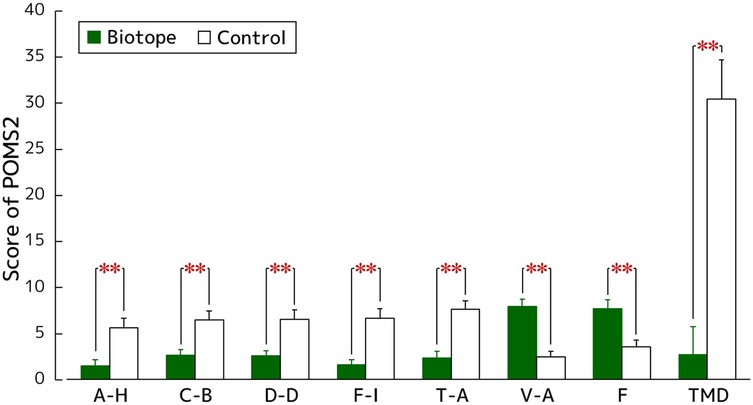
Figure 7. Mood assessment using the biotope as a visual stimulus using the POMS 2 short version: A–H, anger–hostility; C–B, confusion–bewilderment; D–D, depression–dejection; F–I, fatigue–inertia; T–A, tension–anxiety; V–A, vigor–activity; F, friendliness; TMD, total mood disturbance. N = 28, mean ± standard error. **p < 0.01 as determined using the Wilcoxon signed-rank test.
4 Discussion
This study investigated the physiological relaxation effects of viewing a biotope installed on the exterior wall of an urban clinic in Tokyo, one of the world's largest cities. Our findings demonstrated that biotope viewing significantly increased parasympathetic nervous activity and decreased sympathetic nervous activity in patients with depression.
The observed effect sizes for parasympathetic and sympathetic nervous activities (Cohen's d = 0.39 and 0.42, respectively) indicate small to moderate physiological effects. The observed directional changes in autonomic nervous activity—toward relaxation or reduced stress—suggest that even brief exposure to small-scale greenery may induce physiological relaxation. For the psychological indicators, the probability of superiority for dependent samples (PSdep) ranged from 0.679 to 1.000, demonstrating moderate to large effects across multiple subjective measures, including comfort, relaxation, and mood improvement. These findings reinforce the practical relevance of biotope exposure for psychological well-being in individuals with depression. It is noteworthy that measurable these physiological and psychological effects were observed after only four minutes of passive visual exposure.
Previous large-scale studies have examined the physiological relaxation effects of viewing forests using the same measurement system as in the present study, but in healthy individuals (9). These studies demonstrated that forest viewing, compared with urban viewing, significantly increased parasympathetic nervous activity, which is associated with relaxation, and decreased sympathetic nervous activity, which is associated with stress (9). Similar findings were reported in field experiments on forest walking (10) and park walking (11, 12), where parasympathetic nervous activity increased while sympathetic nervous activity decreased. The results of the present study align with these previous findings, indicating that exposure to natural elements—even in an urban setting—can induce physiological relaxation responses.
Patients with depression exhibit distinct autonomic nervous system characteristics compared with healthy individuals. A meta-analysis by Koch et al. (2) reported that parasympathetic nervous activity (HF component) is decreased in patients with depression, while sympathetic nervous activity (LF/HF component) is increased. Our study demonstrated that viewing a biotope had similar effects in patients with depression as those observed in healthy individuals exposed to forest or park environments. These findings suggest that biotope viewing may help modulate autonomic nervous function in patients with depression, potentially alleviating stress-related physiological responses.
Subjective evaluations further reinforced the physiological findings, highlighting the psychological benefits of biotope exposure. The SD method revealed that feelings of comfort, relaxation, and naturalness were enhanced when viewing the biotope. Additionally, POMS 2 short-form assessments indicated reductions in negative mood states, including tension–anxiety (T–A), depression–dejection (D–D), anger–hostility (A–H), fatigue–inertia (F–I), and confusion–bewilderment (C–B), alongside increases in positive mood states, such as vigor–activity (V–A) and friendliness (F). These results are consistent with previous research on forest therapy (28) and park exposure (11, 12) using the same psychological assessments in healthy individuals.
This study has several limitations. First, the participant group was limited to male patients, and further studies including female participants are necessary to generalize the findings. Second, simultaneous comparisons with age-matched healthy individuals would help clarify the effects of biotope viewing between healthy individuals and patients with depression.
Conducted in Tokyo, a densely populated and high-stress urban environment, this study provides empirical evidence that even small roadside biotopes can have a measurable physiological stress-reducing effect. These findings underscore the importance of integrating green spaces into the built environment, including residential areas and healthcare facilities, to enhance the well-being of urban residents, particularly those with mental health conditions.
5 Conclusions
Viewing an exterior biotope at a clinic increased parasympathetic nervous activity and decreased sympathetic nervous activity in patients with depression. These findings highlight the potential role of small-scale green spaces, such as biotopes, in promoting mental well-being in urban environments. Integrating small-scale greenery into healthcare settings and urban infrastructure may serve as a feasible, evidence-based strategy to support mental well-being, particularly in high-density urban areas.
Data availability statement
The raw data supporting the conclusions of this article will be made available by the corresponding authors, without undue reservation.
Ethics statement
The studies involving humans were approved by Ethics Committee of the Center for Environment, Health and Field Sciences, Chiba University, Japan. The studies were conducted in accordance with the local legislation and institutional requirements. The participants provided their written informed consent to participate in this study. Written informed consent was obtained from the individual(s) for the publication of any potentially identifiable images or data included in this article.
Author contributions
HI: Visualization, Data curation, Methodology, Formal analysis, Investigation, Writing – review & editing, Conceptualization, Writing – original draft. CS: Writing – review & editing, Investigation. YS: Writing – review & editing, Investigation, Resources. HN: Investigation, Writing – review & editing, Resources. YM: Writing – original draft, Funding acquisition, Project administration, Supervision, Methodology, Data curation, Conceptualization, Writing – review & editing, Investigation.
Funding
The author(s) declare that financial support was received for the research and/or publication of this article. This work was supported by the Vehicle Racing Commemorative Foundation.
Acknowledgments
We gratefully acknowledge the Vehicle Racing Commemorative Foundation for supporting this study as part of its project.
Conflict of interest
The authors declare that the research was conducted in the absence of any commercial or financial relationships that could be construed as a potential conflict of interest.
Generative AI statement
The author(s) declare that no Generative AI was used in the creation of this manuscript.
Any alternative text (alt text) provided alongside figures in this article has been generated by Frontiers with the support of artificial intelligence and reasonable efforts have been made to ensure accuracy, including review by the authors wherever possible. If you identify any issues, please contact us.
Publisher's note
All claims expressed in this article are solely those of the authors and do not necessarily represent those of their affiliated organizations, or those of the publisher, the editors and the reviewers. Any product that may be evaluated in this article, or claim that may be made by its manufacturer, is not guaranteed or endorsed by the publisher.
References
1. COVID-19 Mental Disorders Collaborators. Global prevalence and burden of depressive and anxiety disorders in 204 countries and territories in 2020 due to the COVID-19 pandemic. Lancet. (2021) 398:1700–12. doi: 10.1016/S0140-6736(21)02143-7
2. Koch C, Wilhelm M, Salzmann S, Rief W, Euteneuer F. A meta-analysis of heart rate variability in major depression. Psychol. Med. (2019) 49:1948–57. doi: 10.1017/s0033291719001351
3. Kemp AH, Quintana DS, Felmingham KL, Matthews S, Jelinek HF. Depression, comorbid anxiety disorders, and heart rate variability in physically healthy, unmedicated patients: implications for cardiovascular risk. PLoS One. (2012) 7:e30777. doi: 10.1371/journal.pone.0030777
4. Shinba T. Altered autonomic activity and reactivity in depression revealed by heart-rate variability measurement during rest and task conditions. Psychiatry Clin Neurosci. (2014) 68:225–33. doi: 10.1111/pcn.12123
5. Berger S, Kliem A, Yeragani V, Bär KJ. Cardio-respiratory coupling in untreated patients with major depression. J Affect Disord. (2012) 139:166–71. doi: 10.1016/j.jad.2012.01.035
6. Song C, Ikei H, Miyazaki Y. Physiological effects of nature therapy: a review of the research in Japan. Int J Environ Res Public Health. (2016) 13:781. doi: 10.3390/ijerph13080781
7. Miyazaki Y. Shinrin-Yoku: The Japanese Way of Forest Bathing for Health and Relaxation. London: Octopus Publishing Group (2018).
8. Denche-Zamorano A, Rodríguez-Redondo Y, Rojo-Ramos J, Miguel-Barrado V, Sánchez-Leal A, Pérez-Calderon E. Global review of literature on forest bathing. Austrian J Sci. (2024) 141(2):145–70. doi: 10.53203/fs.2402.3
9. Kobayashi H, Song C, Ikei H, Kagawa T, Miyazaki Y. Analysis of individual variations in autonomic responses to urban and forest environments. Evid Based Complement Alternat Med. (2015) 2015:671094. doi: 10.1155/2015/671094
10. Kobayashi H, Song C, Ikei H, Park BJ, Lee J, Kagawa T, et al. Forest walking affects autonomic nervous activity: a population-based study. Front Public Health. (2018) 6:278. doi: 10.3389/fpubh.2018.00278
11. Song C, Ikei H, Igarashi M, Miwa M, Takagaki M, Miyazaki Y. Physiological and psychological responses of young males during spring-time walks in urban parks. J Physiol Anthropol. (2014) 33:1–7. doi: 10.1186/1880-6805-33-8
12. Song C, Ikei H, Igarashi M, Takagaki M, Miyazaki Y. Physiological and psychological effects of a walk in urban parks in fall. Int J Environ Res Public Health. (2015) 12:14216–28. doi: 10.3390/ijerph121114216
13. Bettmann JE, Speelman E, Blumenthal E, Couch S, Schmalz DL. Nature exposure, even as little as 10 minutes, is likely to yield short-term benefits for adults with mental illness: a meta-analysis. Ecopsychology. (2024) 16:174–90. doi: 10.1089/eco.2023.0063
14. Rosa CD, Larson LR, Collado S, Profice CC. Forest therapy can prevent and treat depression: evidence from meta-analyses. Urban for. Urban Green. (2021) 57:126943. doi: 10.1016/j.ufug.2020.126943
15. Kotera Y, Richardson M, Sheffield D. Effects of Shinrin-Yoku (forest bathing) and nature therapy on mental health: a systematic review and meta-analysis. Int J Ment Health Addict. (2022) 20:337–61. doi: 10.1007/s11469-020-00363-4
16. Mizumoto T, Ikei H, Hagiwara K, Matsubara T, Higuchi F, Kobayashi M, et al. Mood and physiological effects of visual stimulation with images of the natural environment in individuals with depressive and anxiety disorders. J Affect Disord. (2024) 356:257–66. doi: 10.1016/j.jad.2024.04.025
17. Zung WW. A self-rating depression scale. Arch Gen Psychiatry. (1965) 12:63. doi: 10.1001/archpsyc.1965.01720310065008
18. Fukuda K, Kobayashi S. A study on a self-rating depression scale. Seishin Shinkeigaku Zasshi. (1973) 75(10):673–9. Japanese.4798819
19. Task Force of the European Society of Cardiology; The North American Society of Pacing and Electrophysiology. Heart rate variability: standards of measurement, physiological interpretation, and clinical use. Circulation. (1996) 93:1043–65. doi: 10.1161/01.CIR.93.5.1043
20. Kobayashi H, Ishibashi K, Noguchi H. Heart rate variability; an index for monitoring and analyzing human autonomic activities. Appl Hum Sci. (1999) 18:53–9. doi: 10.2114/jpa.18.53
21. Sawada Y, Ohtomo N, Tanaka Y, Tanaka G, Yamakoshi K, Terachi S, et al. New technique for time series analysis combining the maximum entropy method and non-linear least squares method: its value in heart rate variability analysis. Med Biol Eng Comput. (1997) 35:318–22. doi: 10.1007/bf02534083
22. Kobayashi H, Park BJ, Miyazaki Y. Normative references of heart rate variability and salivary alpha-amylase in a healthy young male population. J Physiol Anthropol. (2012) 31:9. doi: 10.1186/1880-6805-31-9
23. Osgood CE, Suci GJ, Tannenbaum P. The Measurement of Meaning. Urbana: University of Illinois Press (1957).
24. Heuchert JP, McNair DM. POMS 2, Profile of Mood States. New York: Multi-Health Systems Inc (2012).
25. Heuchert JP, McNair DM. In: Yokoyama K, Watanabe K, editors. Japanese Translation of POMS2: Profile of Mood States. Tokyo, Japan: Kaneko Shobo (2015). p. 172. Japanese.
27. Grissom RJ, Kim JJ. Effect Sizes for Research: Univariate and Multivariate Applications. New York: Routledge (2012).
Keywords: autonomic nervous activity, biotope, urban greenery, heart rate variability, major depressive disorder, nature therapy, physiological relaxation, well-being
Citation: Ikei H, Song C, Sagasaki Y, Nozaki H and Miyazaki Y (2025) Physiological effects of a small green space installed on the side of a clinic for outpatients with depression. Front. Environ. Health 4:1601838. doi: 10.3389/fenvh.2025.1601838
Received: 28 March 2025; Accepted: 5 August 2025;
Published: 20 August 2025.
Edited by:
Anna María Pálsdóttir, Swedish University of Agricultural Sciences, SwedenReviewed by:
Natalia Korcz, Forest Research Institute (IBL), PolandJakub Bil, Psychiatric Hospital in Frombork, Poland
Copyright: © 2025 Ikei, Song, Sagasaki, Nozaki and Miyazaki. This is an open-access article distributed under the terms of the Creative Commons Attribution License (CC BY). The use, distribution or reproduction in other forums is permitted, provided the original author(s) and the copyright owner(s) are credited and that the original publication in this journal is cited, in accordance with accepted academic practice. No use, distribution or reproduction is permitted which does not comply with these terms.
*Correspondence: Harumi Ikei, aGlrZWlAY2hpYmEtdS5qcA==; Yoshifumi Miyazaki, eW1peWF6YWtpQGZhY3VsdHkuY2hpYmEtdS5qcA==
†Present Address: Chorong Song, Department of Forest Science, Kongju National University, Chungcheongnam-do, Republic of Korea
‡These authors have contributed equally to this work