 Leona Hoffmann1*
 Ludmilla Viana Jacobson2
 Thilo Erbertseder3Moritz Berger4,5
 Jörn Rittweger1,6,†Rochelle Schneider7,8
- 1Institute of Aerospace Medicine, German Aerospace Center (DLR), Cologne, Germany
- 2Department of Statistics, Institute of Mathematics and Statistics, Fluminense Federal University, Niterói, Brazil
- 3German Remote Sensing Data Center, German Aerospace Center (DLR), Weßling, Germany
- 4Institute of Medical Biometry, Informatics and Epidemiology (IMBIE), University Hospital Bonn, Bonn, Germany
- 5Core Facility Biostatistics, Central Institute of Mental Health, Medical Faculty Mannheim, Heidelberg University, Mannheim, Germany
- 6Department of Pediatrics and Adolescent Medicine, University Hospital Cologne, Cologne, Germany
- 7Φ-lab, European Space Agency (ESA), Frascati, Italy
- 8Epidemiology and Population Health, London School of Hygiene and Tropical Medicine, London, United Kingdom
Background: Environmental stressors such as temperature (Temp), relative humidity (RHumid), and fine particulate matter (PM2.5) may influence the incidence of COVID-19. While many studies have examined these associations in Europe and Asia, research in Brazil—a country with diverse climatic zones and a high burden of COVID-19—remains limited.
Objective: This study aimed to assess the associations between environmental stressors and COVID-19 incidence at the municipality level across Brazil over a three-year period, differentiating between climate zones and pre-Omicron/Omicron periods.
Methods: We utilized a generalized additive model (GAM) framework to analyze monthly COVID-19 incidence while adjusting for population size, spatial structure, and temporal trends. Distributed lag nonlinear models (DLNM) were used to evaluate lagged exposure-response associations. Separate models were fitted for five climate zones to assess regional variations.
Results: In the overall analysis, Temp was positively associated with COVID-19 incidence [relative risk RR 2.47, 95% confidence interval (2.04, 2.91)], while PM2.5 [RR 1.03 (0.95, 1.11)] and RHumid [RR 1.02 (0.91, 1.13)] did not demonstrate clear effects. Climate zone-specific analyses revealed diverse effects: Temp had a positive association with COVID-19 in Temperado (TE) [RR 17.9 (15.26, 22.19)] and Tropical Brazil Central [RR 1.87 (1.57, 2.10)], but a negative association in Tropical Nordeste Oriental [RR 0.008 (0.004, 0.012)] and Tropical Zona Equatorial (TZE) [RR 0.12 (0.08, 0.15)] climate zones. RHumid showed varying positive and negative associations depending on the climate zone, while high levels of PM2.5 are positive associated with COVID-19 incidence in zones TE [RR 2.10 (1.93, 2.28)] and TZE [RR 1.87 (1.54, 2.31)]. DLNM results revealed parabolic lag response curves, with extreme values of Temp and RHumid raising risks in certain zones.
Significance: Our study provides a comprehensive, long-term analysis of environmental stressors and COVID-19 incidence across diverse climate zones in Brazil. The results reveal considerably spatial and temporal variations in how Temp, RHumid, and PM2.5 influence COVID-19 incidence. These findings emphasize the importance of considering regional climatic conditions when assessing environmental risk factors for COVID-19. Understanding these associations can inform targeted public health interventions and preparedness strategies for future respiratory disease outbreaks.
1 Introduction
The SARS-CoV-2 virus and the associated COVID-19 disease have had a deep impact on global health and society. Even years after the initial outbreak, continued analysis of the pandemic remains important to deepen our understanding of the virus and to inform strategies for managing potential future pandemics.
Various studies have shown an association between environmental stressors and new COVID-19 cases, consistently demonstrating a link across different timeframes and geographical areas (1–3). Air pollution as well as meteorological factors like temperature and relative humidity, significantly impacts on human health. Especially particulate matter which originates from natural and anthropogenic sources is known to be associated with respiratory diseases (4), including COVID-19 (5–7). In addition to the influence of environmental stressors, several studies have also shown the combined effects with socio-economic and demographic parameters like income, government health expenditure or population density on COVID-19 (8–10). A study in China highlighted the importance of considering socio-economic factors, such as population density, when analyzing particulate matter concentrations and their potential impacts (11).
Research has further demonstrated that the associations between environmental stressors and health outcomes differ considerably between tropical and non-tropical regions (12, 13). Brazil's extensive and diverse landscape encompasses a wide range of climatic zones and meteorological conditions, making it a particularly suitable setting for examining differential effects of the COVID-19 pandemic across varying ecological contexts.
On February 26, 2020, Brazil reported the first case of a SARS-CoV-2 infection in South America. Following the World Health Organization's declaration of SARS-CoV-2 as a pandemic on March 11, 2020, Brazil's government implemented various measures to curb the spread of the virus. These measures included social isolation, school closures, mandatory mask use, and event cancellations. Despite these interventions, travel between Brazilian federal states remained largely unrestricted (14). Like many countries, Brazil experienced various virus mutations called variants of concern. The Gamma variant was the dominant strain from March 2021 until the Delta variant replaced it in October 2021. As of January 2022, the Omicron variant became the dominant strain (15). Vaccinations in Brazil began on January 17, 2021, with a limited supply of doses. Several factors contributed to delays in vaccinating the Brazilian population, including the lack of a consistent national vaccination campaign, hesitancy among the population to receive the vaccine, distrust in the healthcare system, and political rivalries (16). In January 2022, the vaccination rate for the first dose was 75.6%, while the rate for the second dose was 67.4% (17).
Previous studies investigating exposure-response effects in Brazil primarily focused on the early stages of the pandemic and were mostly limited to urban areas (12, 13, 18). These studies utilized various methods, including generalized additive models (12), principal component analysis (13), and linear regression models (18). Another study analyzed the indirect response of temperature, humidity, and rainfall on the spread of COVID-19 across five cities in the Indian Monsoon region between April 26 and December 5, 2020, emphasizing humidity and temperature as key factors influencing the transmission of the virus (19). Sarkodie and Owusu (10) conducted a global assessment of the influence of air pollution, climatic variables, and socio-economic factors on the spread of the COVID-19 pandemic for 615 cities, but confined to the early period from Janurary 1 to June 11, 2020. A study of Turkey and all 12 NUTS level 1 regions highlighted the importance of considering environmental factors in pandemic management and investigated the relationship between air pollution (PM10 and SO2) and the number of COVID-19 cases during the early pandemic phase (June – November 2020) (20).
However, to achieve a more comprehensive understanding, it is essential to analyze data over a longer period and across a broader geographic scope. Our study provides a long-term (three-year), countrywide, municipality-level analysis of the association between environmental stressors and COVID-19 incidence in Brazil from 2020 to 2022. By systematically analyzing data from all municipalities, rather than from selected single cities, we gained a better understanding of how environmental factors link to COVID-19 incidence, including the effects of virus mutations. Our research utilizes monthly aggregated data and combines generalized additive models (GAM) and distributed lag nonlinear models (DLNM), providing a robust analysis of longer-term trends, lagged associations, and regional variability.
The specific research questions of this study are as follows:
1. How are meteorological factors (temperature and relative humidity) and air pollutants (PM2.5) associated with COVID-19 incidence across Brazilian municipalities and climate zones?
2. Do these associations differ between pre-Omicron and Omicron periods?
3. How do the lagged effects of environmental stressors contribute to trends in COVID-19 incidence?
This article is organized as follows: Section 2 describes the Materials and Methods, including health and environmental data, data processing and the statistical modeling framework. Section 3 presents the results of the analyses, divided into descriptive results, generalized additive model (GAM) findings and distributed lag nonlinear model (DLNM) results. Section 4 gives a short summary of the results, discusses the findings in relation to existing literature, addresses political implications and points out limitations. Finally, Section 5 concludes with the main contributions of the study.
2 Materials and methods
2.1 Health data
Notification records for COVID-19 cases for all Brazilian municipalities (from March 2020 to December 2022), as reported by State and Municipal Health Departments, were obtained at https://covid.saude.gov.br (last access March 2025). The Brazilian Ministry of Health provides an interactive dashboard with the number of new confirmed cases and deaths by epidemiological week of notification. For this study, we aggregated data by month.
2.2 Environmental data
To analyze the monthly mean concentration of particulate matter with a diameter of 2.5 µm or smaller (PM2.5, in µg/m3) over the three-year period, we utilized regional estimates from the Atmospheric Composition Analysis Group at the University of Wahington (21) and van Donkelaar (22). This high-resolution dataset (0.01° × 0.01°) is well-established in the literature for Brazilian data (23–25), and incorporates information from satellite, simulation, and monitor-based sources. The air temperature variable at two meters above ground level (Temp, in °C) was obtained from the ERA5-Land global reanalysis dataset provided by the Copernicus Climate Change Service of the European Centre of Medium-Range Weather Forecasts (26). The same data source was utilized to calculate relative humidity (RHumid, in %) using the Magnus equation (27), which incorporated dew point temperature and air temperature at two meters above ground level. The data was accessed through Google Earth Engine (28).
2.3 Data processing
All data processing was done in Python (29). The health dataset contained infection cases within month-municipality aggregates, and we added zero counts for those aggregate windows without cases to ensure completeness for subsequent analysis. In order to ensure compatibility between the health and environmental datasets, municipality codes were converted from 6-digit format to 7-digit format. For this matching, the official matching table provided by the Brazilian Statistics Institute was used, and code mismatches and exceptional cases were corrected manually (30). Three very small and sparsely populated municipalities were excluded due to missing environmental data; their omission is unlikely to affect the overall analysis because of their small population sizes and geographic isolation. Details on code conversions and exclusions are provided in Supplementary Material S1. To ensure precise alignment, the merging of the datasets was based on three key variables: the seven-digit municipality code, month, and year. The municipality shapefile based on 2020 and the national climate zone information are sourced from the Brazilian Institute of Geography and Statistics (30). The climate zone data showed three small climate zones near the coast, which we relabeled them according to their neighboring climate zones, resulting in five main climate zones: Equatorial (EQ), Tropical Zona Equatorial (TZE), Tropical Brasil Central (TBC), Tropical Nordeste Oriental (TNO), and Temperado (TE). In municipalities with multiple climate zones, we identified the largest and set it as the dominant climate zone. We converted the temperature from Kelvin to degrees Celsius.
Plausibility checks on the health dataset were conducted, revealing an anomalous high number of infections in June 2020. We decided that this particular month significantly deviated from expected trends and exceeded other records by an unrealistic margin. Therefore, given the lack of corroborating evidence and the high likelihood of a data entry error, we removed this record from the analysis to maintain data integrity.
2.4 Statistical methods
Statistical analysis was carried out using R version 4.4.2 (31). To examine the distribution of average Temp, RHumid, and PM2.5 concentrations across all municipalities, choropleth maps were created with the ggplot2 package in R as a prerequisite for the further statistical analyses. In addition, climate zones and population density were mapped as choropleth maps to provide a better context for understanding spatial patterns and regional variations. We created line plots for the temporal descriptive analysis with months on the x-axis and incidence, RHumid, Temp, and PM2.5 levels on the y-axis. The years 2020–2022 were color-coded. Descriptive metrics for the environmental stressors were summarized by means with standard deviations and median with ranges.
We used two different statistical methods to investigate the research question about the association between environmental stressors and COVID-19 incidence: A Generalized Additive Model (GAM) and a Distributed Lag Non-linear Model (DLNM). The GAM was mainly applied to determine the effect of the three aforementioned environmental stressors; the DLNM was additionally applied to determine a possible (non-linear) lagged functional association.
The GAM model was implemented with the “bam()” function from the mgcv package in R (32). We used the number of new COVID-19 cases per municipality as the dependent variable and applied the log-transformed population as an offset to express cases per 100,000 people. The exposure of interest included mean Temp, PM2.5, and RHumid per municipality. For each exposure we specified natural cubic splines with 3 degrees of freedom to capture potential nonlinear links. Additionally, we incorporated categorical variables for both month and year to adjust for temporal variations. To adjust for spatial dependencies between municipalities, we utilized a Markov Random Field based on geographic identifiers specific to each municipality (33). A stratified subgroup analysis was performed for the five climate zones. We fitted the models assuming a negative binomial distribution for the dependent variable, given substantial overdispersion in the outcome (variance-to-mean ratio > 10,000) and applied Restricted Maximum Likelihood for unbiased estimation of variance components, enhancing the model's reliability. The GAM model assumptions were confirmed using gam.check() plots of the mgvc package in R (32). We used the R's “predict()” function with the fitted GAM to make predictions and calculate confidence intervals based on standard error. Additionally, we stratified for the pre-Omicron and Omicron periods for each climate zone and the overall area to assess differences in environmental stressors. While the model structure remained the same, we reduced the number of kernels in the Markov Random Field from 100 to 75 for the stratified analysis of the climate zones over different periods. To enhance interpretation, we expressed predicted cases as incidence per 100,000 people per year. The GAM model for each analysis—stratified by climate zone, pre-Omicron and Omicron periods, and overall—can be expressed as:
Where denotes the COVID-19 incidence cases in month t for municipality i, denotes the set of independent variables, are natural cubic splines, is the Markov Random Field term, represents temporal effects, and is an offset for population size.
As a sensitivity analysis, the overall model was extended by including interaction terms between the period (Omicron/pre-Omicron) and the environmental stressors to formally assess potential differences in exposure–response relationships between the two periods.
As previously (4), we calculated relative risks (RR) for each environmental factor, defined as the ratio of predicted cases at the 95th percentile to those at the 5th percentile of the environmental variable. The percentile bootstrap method was applied with 1,000 repetitions to calculate 95% confidence intervals (CI) for the RR values, stratified by year and municipality (34).
We used a DLNM time series approach to analyze the lagged associations between environmental stressors and COVID-19 incidence. The model was implemented with the “crossbasis()” and “crosspred()” functions from the dlnm package in R (35) considering lag effects for up to 12 months. We applied natural splines to the exposure-response associations for temperature (knots at the 10th, 25th, 75th, and 90th percentiles), PM2.5 (10th, 50th, and 90th percentiles), and RHumid (50th and 90th percentiles). Lag response associations used natural splines with knots placed at equally-spaced values on the log scale. The crosspred function elements were optimized using the Akaike Information Criterion. We fitted the model utilizing the “bam()” function, similar to the GAM model, with the three aforementioned stressors considered as the crossbasis function elements. Separate models were fitted for each climate zone to capture region-specific associations between environmental stressors and COVID-19 incidence, as well as an overall model. The models can be expressed as:
Where is the COVID-19 incidence in month t for municipality i, denotes the expected number of cases given the independent variables, α is the intercept, ross-basis functions modeling nonlinear and lagged effects, is the Markov Random Field term, represents temporal effects, and is an offset for population size.
3 Results
3.1 Descriptive analysis
The descriptive analysis examined both spatial and temporal aspects. Figure 1 illustrates the spatial distribution of Brazilian data averaged over all years. Temp (Figure 1A) were lowest in the south, around 25°C in the north and west, and highest in the country's interior with a maximum of 28.55°C. The RHumid distribution (Figure 1B) indicated that northern Brazil and the east and southeast coast experienced an increased average monthly relative humidity, peaking at 88.59%. In contrast, RHumid was minimal in the central region with a minimum of 53.33%. The PM2.5 distribution (Figure 1C) indicated lower concentrations in the east and south of the country. A remarkably high concentration was recorded in the southwest, with a maximum level of 42.61 µg/m3. The population density map (Figure 1D) showed that the northwest of Brazil had the lowest population density. In contrast, population densities were higher in the eastern region, peaking in the southeast. Brazil was divided into five dominant climate zones (Figure 1E): EQ (433 municipalities), TZE (870), TBC (2,688), TNO (564), and TE (1,012). Population density varies across climate zones. The lowest population density was observed in EQ with 4.7 inhabitant/km2 (total population 19,662,557), followed by TZE with 31.3 inhabitant/km2 (total population 22,896,582), TBC with 40.3 inhabitant/km2 (total population 117,654,874), TE with 53.6 inhabitant/km2 (total population 26,498,324), and TNO with the highest population density with 151.7 inhabitant/km2 (total population 24,996,485). All population figures refer to the year 2020.
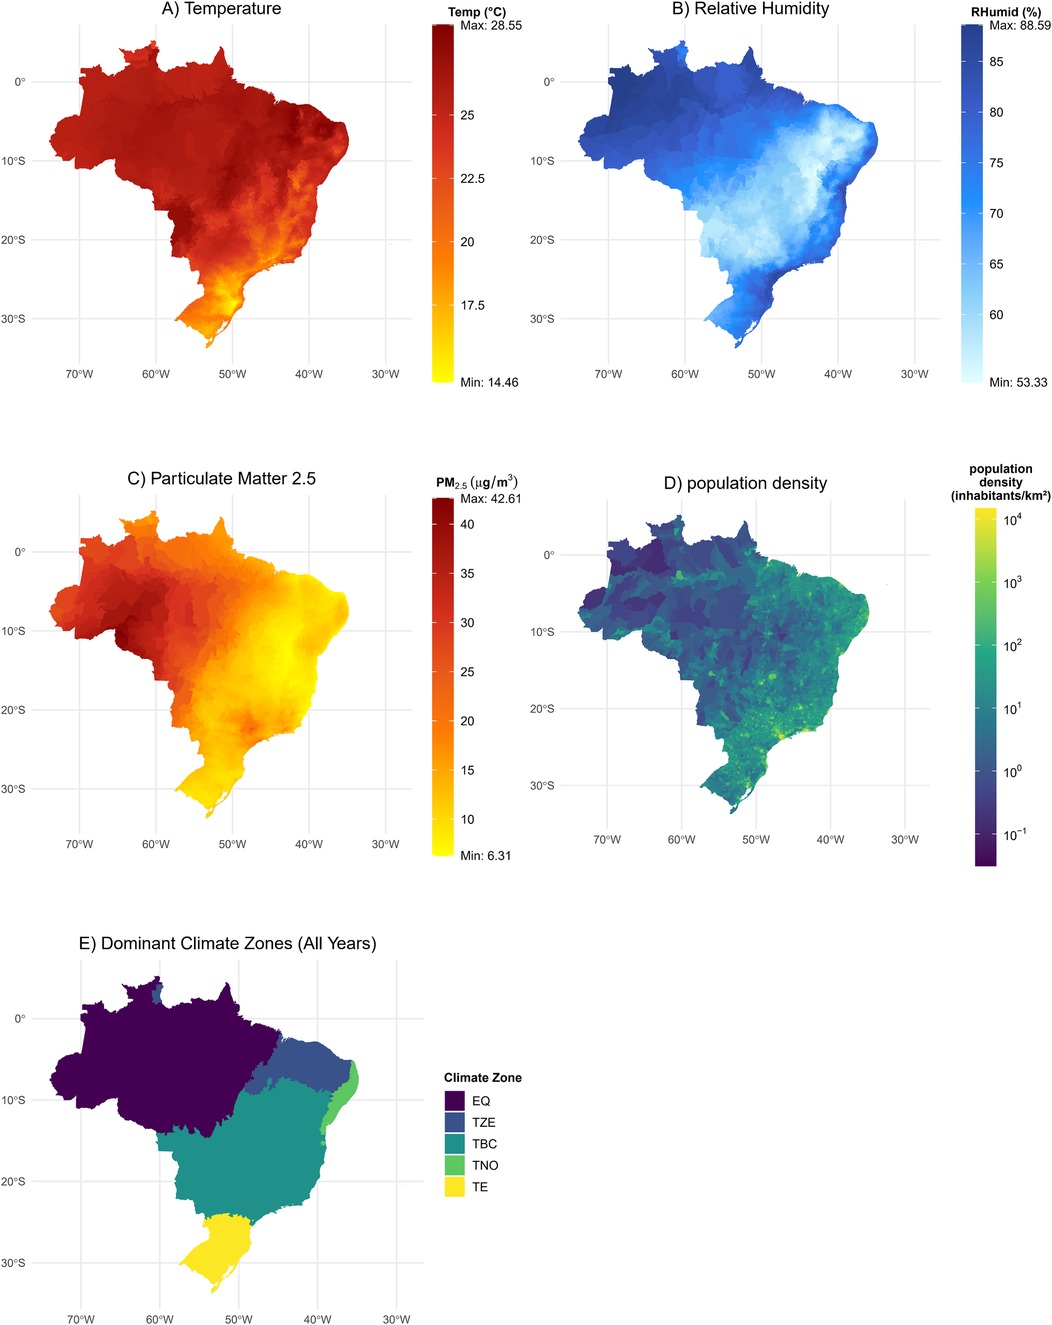
Figure 1. Spatial descriptive analysis maps of Brazil. The spatial distribution of the environmental stressors across all years is displayed for Temp (A), RHumid (B), and PM2.5 (C) The population density map is calculated by the number of inhabitants per square kilometer (D) Additionally, the five dominant climate zones Equatorial (EQ), Tropical Zona Equatorial (TZE), Tropical Brazil Central (TBC), Tropical Nordeste Oriental (TNO) and Temperado (TE) are color-coded by municipality in Brazil (E).
The temporal descriptive analysis for Brazil (Figure 2) illustrates the incidence of COVID-19 cases over the months (Figure 2A). The incidence rose until June 2021, then declined towards December 2021. In January 2022, it increased again, peaking in February. After a decrease, there was a spike in July 2022, followed by another low in October, with a slight increase in the last two months of the year. The incidence by climate zone (Figure 2B) was similar to the general trend (Figure 2A). TNO tended to have lower incidence rates, whereas TE generally showed higher rates than the average. The monthly average RHumid (Figure 2C) revealed that the EQ, TBC, and TZE climate zones reached lower RHumid levels in the first and fourth quarter (Q1 and Q4) and higher levels in the second and third quarter (Q2 and Q3). In contrast, the TNO and TE zones exhibited relatively consistent RHumid throughout the year, with only slight increases observed in Q2 and Q3. Average monthly Temp (Figure 2D) varied most in climate zone TE, followed by TBC and TNO, with the coldest temperatures typically in mid-year. In contrast, TZE and EQ had consistently high temperatures year-round, peaking in September and October across all years. Average monthly PM2.5 concentrations (Figure 2E) were highest in the EQ climate zone, particularly at the year's start and end, with a dip in the middle. Other climate zones were more stable: TBC and TNO showed slight increases from August to October, while TE had a minor peak in June. Meanwhile, TZE experienced higher levels in Q1, lower levels in Q2 and Q3, and an increase in the Q4.
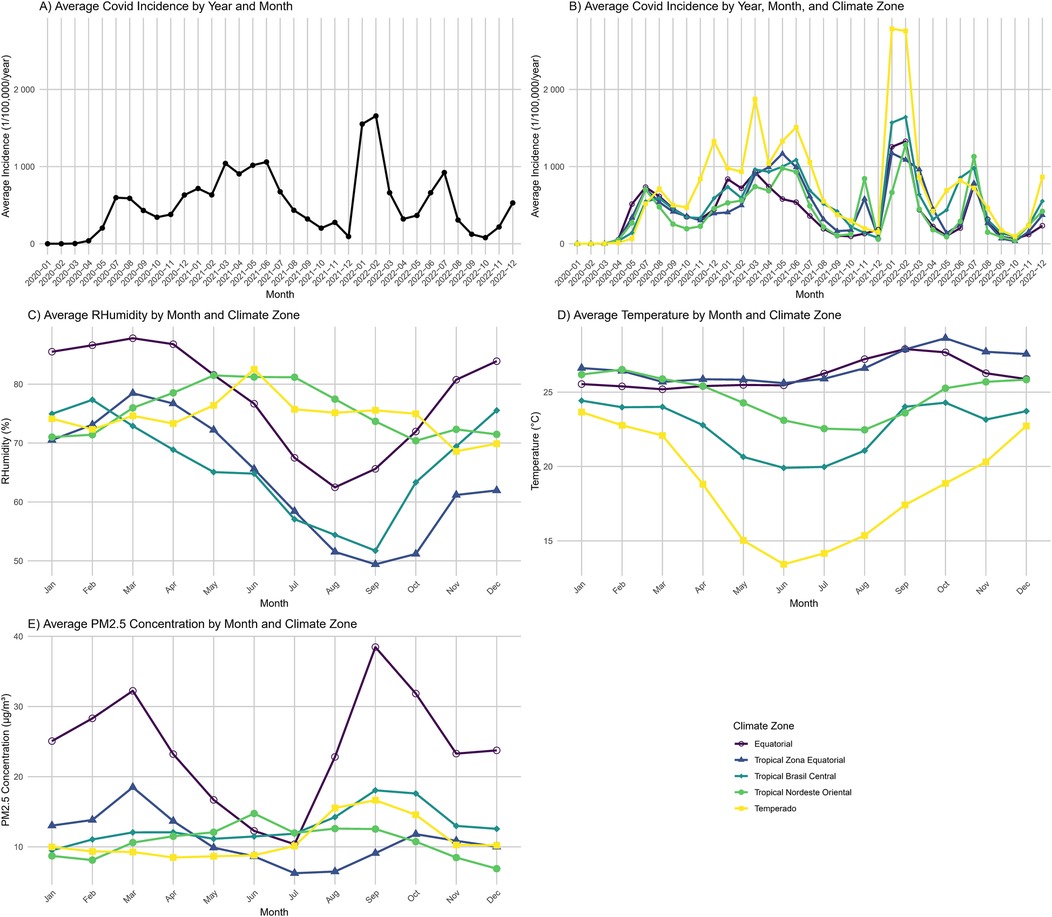
Figure 2. Temporal descriptive analysis of COVID-19 incidence and environmental stressors in Brazil. (A) Temporal distribution of COVID-19 incidence by year and month, defined as the number of cases per 100,000 people per year; (B) Incidence distribution stratified by climate zone; (C–E) Monthly averages of environmental stressors over the three-year study period: relative humidity (RHumid) (C), temperature (Temp) (D), and particulate matter (PM₂.₅) (E), with climate zones represented by distinct colors.
PM2.5 exhibited the highest mean concentration and considerable variation throughout the observation period, with an average of 24.4 µg/m3 in climate zone EQ (Table 1). The other climate zones had mean concentrations ranging from 10.6 to 12.9 µg/m3. The average Temp in the EQ, TNO, and TZE zones exceeded 24 °C, while TE recorded the lowest mean Temp at 18.9 °C. Regarding RHumid, TZE had the lowest average at 64.2%, followed by TBC at 66.3%, TE at 74.2%, TNO at 75.3%, and EQ at 78.1%. Although the mean temperatures in EQ (26.2 °C) and TZE (26.7 °C) were similar, the relative humidity in TZE (64.2%) was significantly lower than in EQ (78.1%). Conversely, while the relative humidity was comparable between TE (74.2%) and TNO (75.3%), TE had a lower mean temperature (18.9 °C) compared to TNO (24.8 °C).
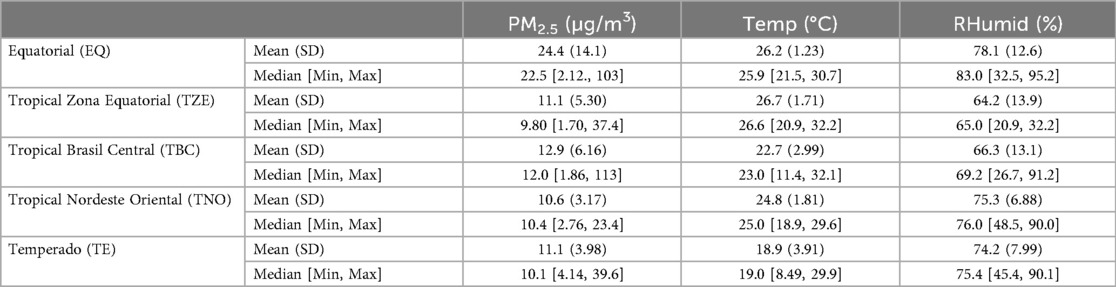
Table 1. Descriptive statistics [mean, standard deviation (SD), median, minimum (Min), and maximum (Max)] of the environmental stressors PM2.5, Temp, and RHumid across the five Brazilian climate zones.
3.2 GAM
The exposure-response curves between environmental stressors and COVID-19 incidence (Figure 3) and the related relative risk (RR) values (Table 2) varied by climate zone. Temp showed a strong positive association with estimated COVID-19 incidence in the TBC [RR 1.87, 95% confidence interval (1.57, 2.10)] and TE [RR 17.9 (15.26, 22.19)] zones, a strong negative association in the TNO [RR 0.008 (0.004, 0.012)] and TZE [RR 0.12 (0.08, 0.15)] zones, and no cut-off association in EQ zone. For PM2.5 levels, there was a positive trend in association with estimated COVID-19 incidence in the TE [RR 2.10 (1.93, 2.28)] and TZE [RR 1.87 (1.54, 2.31)] zones, while the EQ, TBC, and TNO zones did not show a clear association. Regarding RHumid, the estimated incidence of COVID-19 showed a negative association with the TZE [RR 0.01 (0.006, 0.014)], TBC [RR 0.66 (0.57, 0.73)] and TNO [RR 0.05 (0.03, 0.06)] zones, a positive relation with the TE [RR 3.69 (3.38, 4.12)] zone, and no significant association in the EQ zone. The overall model showed a positive link between COVID-19 incidence and Temp [RR 2.47 (2.04, 2.91)], but no statistically significant association with RHumid [RR 1.02 (0.91, 1.13)] and PM2.5 [RR 1.03 (0.95, 1.11)].
![A series of line charts displaying the estimated number of COVID-19 cases per 100,000 people across various conditions. Each chart shows a different variable: temperature (\\[°C\\]), PM. particulate matter (\\[μg/m³\\]), or relative humidity (\\[%\\]). Subgroups include EQ, TZE, TBC, TNO, TE, and ALL. Each subgroup is analyzed across the three conditions, with solid lines representing estimates and dashed lines indicating confidence intervals. Patterns vary, with some curves sloping upwards or downwards, illustrating different impacts under the respective conditions.](https://www.frontiersin.org/files/Articles/1635503/fenvh-04-1635503-HTML/image_m/fenvh-04-1635503-g003.jpg)
Figure 3. Estimated COVID-19 incidence per 100,000 people per year in response to each environmental stressor and climate zone. The five climate zones are: Equatorial (EQ), Tropical Zona Equatorial (TZE), Tropical Brasil Central (TBC), Tropical Nordeste Oriental (TNO), and Temperado (TE). All other parameters were kept constant, and were set to the following values: municipality code: 1100114 (EQ, ALL), 2107803 (TZE), 3500600 (TBC), 2610202 (TNO), 4122206 (TE), month: February, year: 2021 and environmental stressors: median. Estimates were obtained using the R function predict for Temp, RHumid, and PM2·5, including their 5th and 95th percentiles.
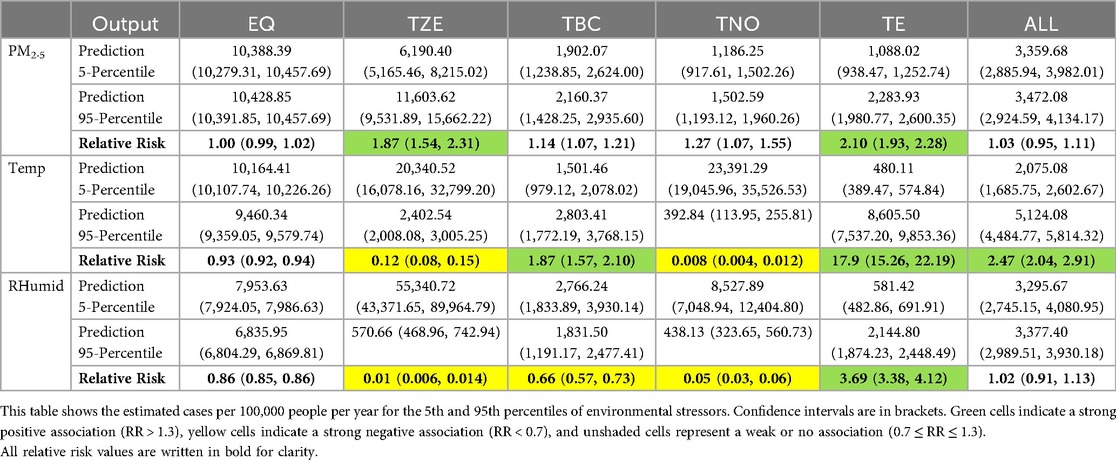
Table 2. Estimated COVID-19 incidence and associations with environmental stressors by climate zone.
The stratified models for the pre-Omicron (2020–2021) and Omicron periods (2022) showed some differences in the exposure-response curves (Supplementary Figure S1) and the RR values (Supplementary Table S1). During the Omicron period, the exposure-response curves for all stressors were higher than in the pre-Omicron period across all climate zones, while the trend in TZE was reversed. Most associations seen in the overall period were also present in the pre-Omicron period, except for the PM2.5 effect in TZE, which was minimal in that period [RR 0.84 (0.83, 0.85)]. Additionally, strong new associations identified in the pre-Omicron period include a negative correlation between COVID-19 incidence and PM2.5 levels in TNO [RR 0.27 (0.26, 0.27)] as well as with Temp [RR 0.64 (0.62, 0.65)] and RHumid [RR 0.47 (0.46, 0.47)] in EQ zone. During the pre-Omicron period, Temp showed in the overall model a positive association [RR 1.79 (1.65, 1.92)], while PM2.5 [RR 0.72 (0.69, 0.76)] and RHumid [RR 0.84 (0.80, 0.89)] had no specific links. In contrast, the RR values in the overall model showed no statistically significant threshold effect for all environmental stressors. TE showed no statistically significant link with the three environmental stressors during the Omicron period. The only consistent associations observed between the two periods were a negative association between COVID-19 incidence and RHumid in the EQ climate zone [pre-Omicron period RR 0.47 (0.46, 0.47), Omicron period RR 0.67 (0.66, 0.68)] and a positive association with Temp in the TBC climate zone [pre-Omicron period RR 1.42 (1.33, 1.54), Omicron period RR 2.21 (1.37, 2.89)]. New positive associations emerged during the Omicron period, specifically between Temp and the incidence of COVID-19 in the TZE [RR 2.73 (2.66, 2.79)], between RHumid and COVID-19 in the TZE [RR 2.26 (2.24, 2.27)] and TBC [RR 2.24 (1.35, 2.95)] zones, and between PM2.5 and COVID-19 in the TNO zone [RR 1.33 (1.29, 1.36)]. Supplementary Figure S2 displayed the exposure-response curves for all climate zones in one graph, with separate plots for the Omicron and pre-Omicron periods. The x-scaling and range of environmental stressors differed considerably by climate zone, making direct comparisons between these zones challenging.
In the sensitivity analysis based on the overall model, the interaction terms suggested that both the magnitude and shape of the associations differed between the pre-Omicron and Omicron periods, broadly consistent with the trends observed in the stratified analyses.
3.3 DLNM
Figure 4 shows distinct lag-response curves for Temp, PM2.5 and RHumid at the 1% and 99% quantiles within each climate zone. In TZE and TNO, relative risk (RR) was higher for extreme cold and below 1 for extreme heat compared to the median (for TZE 26.62°C, for TNO 25.05°C), peaking at lags 0 and 12 for hot temperatures and reaching the lowest values at the same lags for cold temperatures. In TE, the RR for hot temperatures peaked at 2.41 [95% confidence interval: (2.15,2.71)] at lag 0, while cold temperatures had an RR of 0.66 (0.59, 0.73). In TBC, RR was 1.10 (1.01, 1.19)) for hot and 0.91 (0.86, 0.98)) for cold temperatures, whereas in EQ, RR remained above 1, initially higher for cold than hot temperatures, reversing by lag 3.
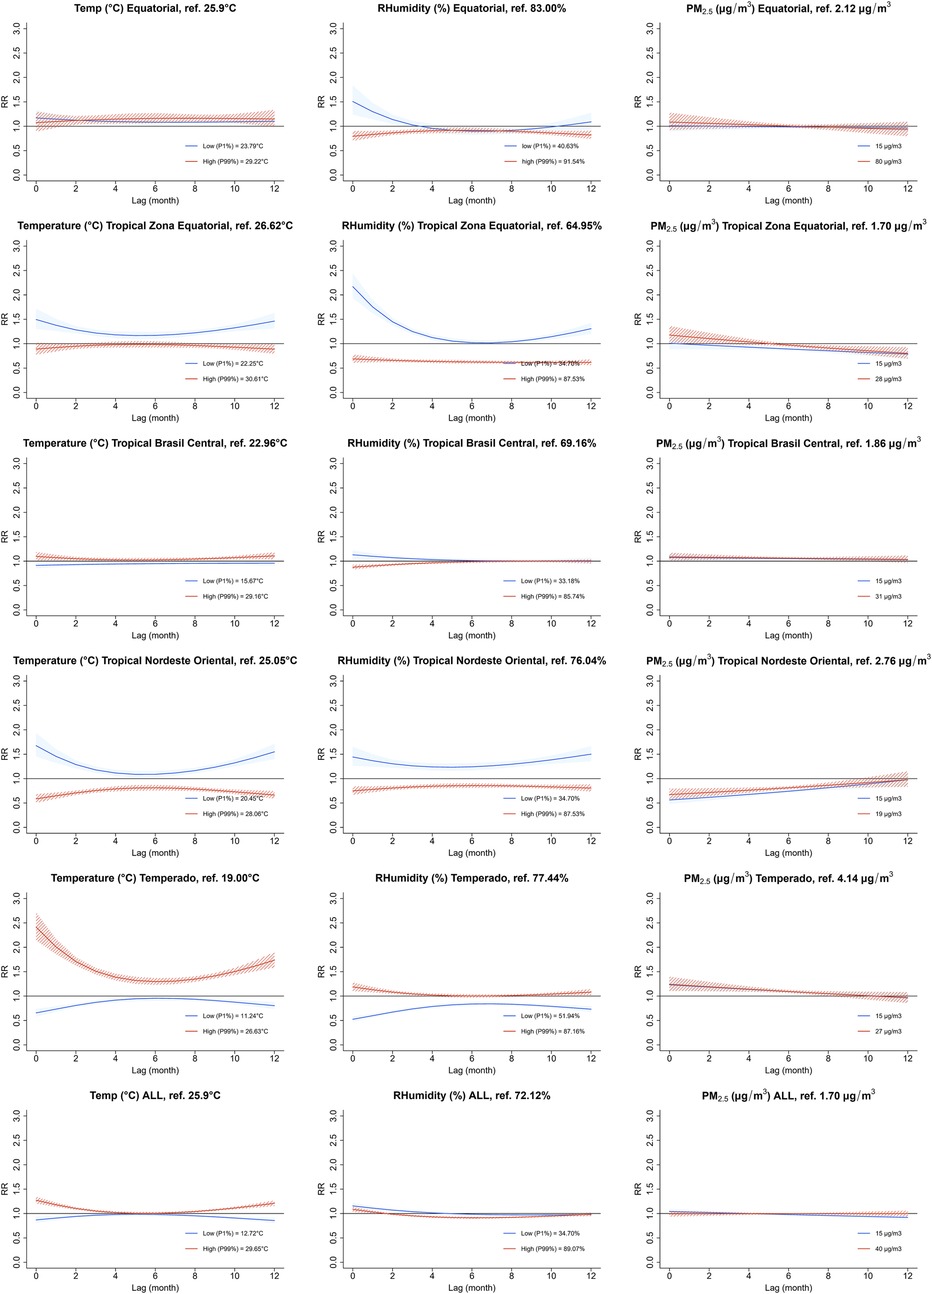
Figure 4. Lag-response plots of the distributed Lag nonlinear model (DLNM) for temp, PM2.5, and RHumid across different climate zones. Each plot displays the lagged effects (in months) of the 1% and 99% quantiles for Temp and RHumid, as well as the threshold of 15 µg/m3 and the 99% quantile for PM2.5. These effects are presented as relative risks (RR), which indicate the incidence risk in comparison to the median exposure for Temp and RHumid, and the minimum exposure for PM2.5 across the time lags. Exposure-response associations were modeled with natural splines (Temp knots: 10th, 25th, 75th, 90th percentiles; PM2.5: 10th, 50th, 90th percentiles; RHumid: 50th, 90th percentiles), and lag-response associations used natural splines with knots equally spaced on the log scale.
For RHumid, 1% quantile values in EQ, TZE, and TNO started with an RR above 1 at lag 0, dipping at lags 5–7 and following a parabolic curve. At the 99% quantile, extremely high RHumid resulted in RR <1 in EQ, TZE, and TNO, with minor fluctuations. In TBC, RR at lag 0 was >1 for extremely low and <1 for extremely high RHumid, with both curves converged at 1 by lag 6 and remained stable. In contrast, RR was >1 for high and <1 for low RHumid in TE.
Concering PM2.5, RR values were calculated relative to the minimum concentration in each zone. In TE, TZE, TBC, and EQ, RR at lag 0 was >1 and decreased over time. The 99% quantile curves exceeded the 15 µg/m3 threshold in TZE and EQ, with EQ reaching the highest value (80 µg/m3) and TNO the lowest (19 µg/m3). In TBC and TE, RR values were nearly identical at both levels. Unlike other zones, TNO had RR <1 at lag 0, approached 1 over time, and its 19-curve remained above 15 µg/m3.
The overall model indicated low Temp (12.71°C) below 1 and high Temp (29.65°C) above 1, both following parabolic curves. For RHumid, the low value (34.70%) is above the high value (89.07%). In PM2.5, the curves are nearly aligned with 1. At lag 0, the threshold (15 µg/m3) exceeds the 99th percentile (40 µg/m3), while an inverted structure appears at lag 12.
4 Discussion
4.1 Summary
Our analysis aimed to investigate the association between environmental stressors and COVID-19 incidence over a three-year period, using monthly data at municipality level across Brazil. The GAM modeling approach provides a robust framework for assessing the association between environmental factors and COVID-19 incidence, effectively accounting for population size, spatial structure, and temporal trends. To address regional variability, we developed an overall model and further adjusted for climatic differences by fitting separate models for each climate zone while maintaining consistent model parameters. We further disentangled two distinct periods, pre-Omicron and Omicron, to assess how environmental stressors link to COVID-19 incidences. In addition, we examined lag effects in the exposure-response association using DLNM. Our findings revealed a positive association between COVID-19 incidence and Temp in the overall model, while no statistically significant associations could be observed with PM2.5 or RHumid. In climate zone-specific models, only TE and TZE showed a positive association with PM2.5. RHumid effects varied: negative in TZE, TBC and TNO; positive in TE; and neutral in TBC. Temperature associations were positive in TE and TBC, negative in TNO and TZE, and neutral in EQ. The analysis revealed no consistent concentration-response pattern between the pre-Omicron and Omicron periods. The lag effects were modeled using a DLNM time series approach. In the TZE and TNO zones, high Temp and RHumid levels (99th percentiles) were linked to increased risk of COVID-19 incidence, while low values (1st percentile) were associated with decreased risk of incidence, with parabolic lag response curves. In the TE zone, the associations were reversed. The TBC and EQ zones showed minimal and consistent effects over lag periods for Temp and RHumid, except low RHumid in EQ reaching up to 1.5 at lag 0. For PM2.5, extreme exposures and the threshold 15 µg/m3 at lag 0 in the TE, TZE, TBC, and EQ zones were associated with higher incidence, decreasing with subsequent lags, while TNO showed the opposite trend.
4.2 Discussion of the results
The incidence of COVID-19 cases in Brazil was consistent with data from other sources (36). Many studies have explored the impact of environmental stressors on COVID-19 infections, primarily in Europe and Asia. However, Brazil, a large country with various climate types, was significantly impacted by the pandemic and has been less studied. To the best of our knowledge, our research is unique in both the duration of the observation period and the level of spatial resolution. We are not aware of other studies that have conducted similar analyses at municipality level over a three-year period in Brazil. While some studies have explored the association between COVID-19 cases and factors such as PM2.5 and Temp concentrations in Brazil, they often faced limitations regarding spatial and/or temporal scale. These studies typically analyzed shorter observation periods, focused on specific cities, or smaller geographic areas. Nevertheless, we will discuss the similarities and differences between the findings of these studies and our analysis, which examined Brazil as a whole, split into five climate zones.
Köppen's climate classification maps for Brazil indicate comparable patterns for high and low temperatures (37). However, our analysis revealed that highest temperatures were concentrated in central Brazil, specifically, between the northeastern and southwestern region. This discrepancy may be attributed to differences in data periods, as the literature-based climate data ended in 2013, while our study data began in 2020 (38). Two previous studies investigated the association between temperature and COVID-19 incidence in Brazilian state capitals, with one study including Brasília, focusing on the initial phase of the pandemic. These studies found an inverse association between the number of COVID-19 cases and mean temperatures below 25.8°C. However, this association was not observed in cities where the mean temperature was equal to or greater than 25.8°C (39, 40). In our climate zone-specific analysis, EQ and TZE, which had mean temperatures exceeding 25.8°C, showed no significant association with estimated COVID-19 cases. In contrast, TE and TBC, where mean temperatures were below 25.8°C, demonstrated a positive association with COVID-19 incidence. These findings are consistent with the results reported in the previously mentioned studies. The TNO climate zone, with a mean temperature of 24.7°C, is an exception, as it showed a negative exposure-response association. The literature indicated a difference between tropical and non-tropical regions in relation to temperature and COVID-19 associations. In tropical areas, high temperatures and relative humidity were risk factors, while in subtropical regions, both high and low temperatures were risk factors (13, 41). Other early pandemic research of capital cities showed a positive correlation between mean temperature and COVID-19 cases in tropical regions but an inverse link in subtropical areas (12). Köppen's climate classification indicates that northern and central Brazil are primarily tropical, while the south is subtropical (37). We found a positive association between temperature and COVID-19 cases in the TE (subtropical) region, a negative association in the TNO (tropical) region, and no statistically significant association in the EQ (tropical) region, which contrasts with previous findings. Research conducted from April 2022 to July 2023 in a temperate subtropical region supported our results, finding a positive correlation between temperature and SARS-CoV-2 (42). It is essential to examine the temperature range in different areas. The TZE, TNO, and EQ regions had a slight temperature range and predominantly high temperatures, while the TBC and TE zones exhibited both high temperatures and a wider range. Our results suggested that consistently high temperatures may not correlate positively with COVID-19 incidence, whereas high temperatures in areas with lower temperatures were positively associated with COVID-19 cases.
The study on the initial phase of the Covid-19 pandemic in Brasília found additionally that lower mean relative humidity was associated with lower case numbers, especially when relative humidity was 65% or lower (39). In the TZE climate zone, our GAM indicated that lower relative humidity was linked to increased COVID-19 incidence, which contradicts the findings for the same humidity range reported in the Brasília study. Our analysis of the TBC climate zone (including Brasília) revealed similar results. Additionally, our DLNM showed that extreme RHumid levels below 65% raised infection risk across most climate zones, which contradicted the papers results with focus on Brasília. A study conducted in 2020, focusing on the municipalities of Mato Grosso (in TBC and EQ) and Cuiaba Varzea (in TBC), found that RHumid had a significant negative correlation with the number of confirmed daily COVID-19 cases (43). We also observed a negative association in TBC and no consistent pattern across the range of relative humidity in EQ.
PM2.5 concentrations in Brazil were highest in the western and northern regions (Figure 1C), which aligns with existing research (44). This pollution was in general caused by human activities such as traffic, industry, and agriculture, along with wildfires. The central-western region of Brazil experienced the highest annual average of PM2.5 related to wildfires (44).
A study using DLNM found that COVID-19 morbidity is nearly twice as high among individuals exposed to high levels of wildfire-generated PM2.5 (45). Our DLNM model aligned with that finding and showed a higher incidence risk for high PM2.5 levels across all climate zones except TNO. This Research over two years in five Brazilian states—Acre (AC), Rondônia (RO), Mato Grosso (MT), Pará (PA), and Amazonas (AM)—found that AC and PR had a higher risk of COVID-19 morbidity linked to PM2.5 concentrations, while MT, RO, and PA showed a decreasing trend (45). AC, PA, and RO were classified in the EQ climate zone, PR in the TE zone, and MT was both EQ and TBC zones. Our GAM indicated a positive exposure-response association between PM2.5 and COVID-19 incidence for TE, aligning with the literature, while showing a weak or unclear association for EQ and TBC. A study examined the link between COVID-19 and PM2.5 levels in the cities Curitiba and Araucaria using sensor data. From March to November 2021, a positive correlation was observed between PM2.5 and COVID-19 incidence (46). The areas studied are in climate zone TE, where our GAM aligned with the literature and showed a RR of 2.03.
Brazil's climatic conditions differed considerably from those in Europe, affecting the influence of environmental stressors on COVID-19 incidence. A study in Germany showed a strong negative association between temperature and COVID-19 incidence: as temperatures dropped, COVID-19 incidence rose (6). A global multi-city study found that the risk of COVID-19 infection was 1.22 times higher at 5°C compared to 17°C (47). In contrast, for temperatures above 25.8°C, a strong positive correlation was observed, indicating that higher temperatures lead to increased COVID-19 incidence (39, 40). Our models found these patterns in the TE, TZE, and TBC climate zones and the overall data. For TNO, the association began negatively, but weakened at higher temperatures, unlike the consistent positive correlation seen in other zones. The EQ zone showed no statistically significant temperature effect, differing from other climate zones.
These findings suggest that both low and high temperatures may boost COVID-19 infections. While this may appear counterintuitive, there are plausible pathophysiological explanations. Exposure to both cold and hot ambient temperatures can cause physiological stress (48, 49), and the negative impact of chronic stress on immune function is well-documented (50). Additionally, behavioral adaptations, such as increased indoor time and the use of heating or air conditioning, may alter exposure to indoor air pollution, further influencing infection resk. The delayed effects observed in the DLNM lag-response curves likely reflect a combination of direct environmental exposures, stress-mediated immune responses, and behavioral patterns. Future research should continue to investigate the underlying mechanisms to gain a better understanding of the causal implications of these findings.
4.3 Policy implications
The findings of this study have implications for public health and environmental policy, particularly in tropical and subtropical regions like Brazil. First, the dual role of high and low temperatures in exacerbating infection risk supports the need for temperature-sensitive public health strategies and risk communication. Second, the findings reinforce the need of regional environmental surveillance systems that monitor pollution and weather in real-time, allowing for adaptive response measures during high-risk periods.
Moreover, policymakers should consider integrating environmental data into epidemic and pandemic preparedness frameworks. For instance, incorporating temperature and air quality thresholds into early warning systems may improve the timing and targeting of public health interventions. In urban planning and housing policies, strategies to reduce indoor air pollution exposure—such as promoting natural ventilation, regulating air conditioning use, and improving insulation—could mitigate the compounding effects of environmental stressors on health.
Finally, public health policies must acknowledge the regional variability in environmental risks and avoid one-size-fits-all approaches. Tailored interventions considering local climatic realities, particularly in vulnerable populations and under-resourced regions, are critical for achieving equitable health outcomes in the face of both infectious disease threats and ongoing climate change.
4.4 Limitations
The availability of PCR tests fluctuated significantly over the weeks, peaking during the second wave (2021), followed by the first (2020) and third (2022) waves (51). This inconsistency and the lack of tests have led to a substantial number of unreported COVID-19 infections, causing a significant underestimation of incidence rates (16). Moreover, socioeconomic inequality among Brazilian municipalities impacted COVID-19 detection and the occurrence of negative outcomes. In poorer areas, access to health services is often precarious and fewer COVID-19 tests are performed, so there might be a detection bias that could reduce the number of cases in poorer areas (52). Some limitations of the PM2.5 dataset include uncertainties in Aerosol Optical Depth (AOD) measurements, limited validation due to sparse ground monitoring in Brazil, and a reduced temporal resolution that affects short-term analyses (18, 22, 53). On the other hand, the van Donkelaar PM2.5 dataset offers high resolution, effectively filling gaps in PM2.5 coverage when ground stations cannot ensure continuous reporting (22, 54). Well-documented in Brazilian studies (23–25), it combines satellite-derived AOD data with chemical transport models, providing reliable coverage even in areas without monitoring infrastructure (21). The reanalysis data from the ERA5-land products serve as a reliable source for climate data (55). Our analysis used a monthly aggregation level due to the availability of our PM2.5 dataset. While imposing some temporal limitations, this approach is meaningful for examining the longer-term health impacts of PM2.5, Temp, and RHumid on COVID-19 incidence rates. Monthly data helps to reduce short-term fluctuations caused by reporting delays, allowing for a more robust analysis of these associations. The month June 2020 has been excluded from the data due to plausibility checks revealing an unrealistically high number of infections. We focused on environmental stressors without considering age group and gender information, which is a limitation of our work. Literature showed that from March 2020 to September 2021 in Brazil, the disease was more common in men (55.6%), with the highest prevalence in the 50–59 age group (20.2%) (56). A study from February to November 2020 examined Brazil's 27 state capitals and discovered that meteorological conditions influenced COVID-19 in periodic ways, with a positive effect from March to May and a negative effect from June to August (57). A possible extension and future work of our analysis would be to examine interaction terms between months and environmental stressors to reach similar analysis.
5 Conclusion
Our study provides a comprehensive and systematic analysis of the association between selected environmental stressors and COVID-19 incidence in Brazil from 2020 to 2022. The findings reinforce existing evidence that air pollution, particularly particulate matter, as well as meteorological factors such as temperature and relative humidity, play a significant role in influencing respiratory health and the spread of COVID-19. By examining data across Brazil's diverse climatic regions, we observe that the impact of these environmental variables differs between climate zones, in particular, tropical and non-tropical areas, highlighting the importance of considering regional differences in epidemiological assessments. Furthermore, our study underscores the necessity of long-term analyses beyond the early stages of the pandemic to fully capture the evolving relationships between environmental exposures and COVID-19 outcomes. The influence of virus mutations, shifting public health measures, and vaccination efforts further emphasize the complex interplay between environmental and epidemiological factors. These insights contribute to a broader understanding of the environmental determinants of infectious diseases and can inform future public health policies aimed at mitigating the effects of pandemics in varying ecological contexts. Specifically, the findings emphasize the importance of implementing continuous environmental surveillance systems, which guide interventions in areas with high pollution or extreme climate conditions. Additionally, integrating environmental data into pandemic preparedness strategies is essential to reducing health risks.
Data availability statement
The original contributions presented in the study are included in the article/Supplementary Material, further inquiries can be directed to the corresponding author.
Author contributions
LH: Writing – original draft, Formal analysis, Visualization, Data curation, Methodology, Conceptualization, Writing – review & editing, Software, Investigation. LV: Data curation, Writing – review & editing, Formal analysis, Methodology. TE: Writing – review & editing. MB: Formal analysis, Writing – review & editing. JR: Funding acquisition, Conceptualization, Supervision, Writing – review & editing, Methodology. RS: Supervision, Conceptualization, Writing – review & editing, Methodology.
Funding
The author(s) declare that financial support was received for the research and/or publication of this article. This work was supported by the Deutsche Forschungsgemeinschaft (DFG, German Research Foundation) [Grant no 458531714].
Acknowledgments
COVID-19 data is freely available at https://covid.saude.gov.br. PM2.5 data is freely available from the Atmospheric Composition Analysis Group at the Washington University in St. Louis (21). Meteorological data is freely available from the ERA5-Land global reanalysis dataset provided by the Copernicus Climate Change Service of the European Centre of Medium-Range Weather Forecasts (26).
Conflict of interest
The authors declare that the research was conducted in the absence of any commercial or financial relationships that could be construed as a potential conflict of interest.
Generative AI statement
The author(s) declare that no Generative AI was used in the creation of this manuscript.
Any alternative text (alt text) provided alongside figures in this article has been generated by Frontiers with the support of artificial intelligence and reasonable efforts have been made to ensure accuracy, including review by the authors wherever possible. If you identify any issues, please contact us.
Publisher's note
All claims expressed in this article are solely those of the authors and do not necessarily represent those of their affiliated organizations, or those of the publisher, the editors and the reviewers. Any product that may be evaluated in this article, or claim that may be made by its manufacturer, is not guaranteed or endorsed by the publisher.
Supplementary material
The Supplementary Material for this article can be found online at: https://www.frontiersin.org/articles/10.3389/fenvh.2025.1635503/full#supplementary-material
Abbreviations
AOK, Allgemeine Ortskrankenkasse; BW, Baden-Württemberg; COVID-19, Corona Virus Disease 2019; DLNM, Distributed Lag Nonlinear Model; EQ, Equatorial; GAM, Generalized Additive Model; PM2.5, Fine Particulate Matter with a diameter of 2.5 μm or smaller; RHumid, Relative Humidity; Temp, Temperature; TBC, Tropical Brasil Central; TE, Temperado; TNO, Tropical Nordeste Oriental; TZE, Tropical Zona Equatorial; WHO, World Health Organization.
References
1. Marques M, Domingo JL. Positive association between outdoor air pollution and the incidence and severity of COVID-19. A review of the recent scientific evidences. Environ Res. (2022) 203:111930. doi: 10.1016/j.envres.2021.111930
2. Zang S-T, Luan J, Li L, Yu H-X, Wu Q-J, Chang Q, et al. Ambient air pollution and COVID-19 risk: evidence from 35 observational studies. Environ Res. (2022) 204:112065. doi: 10.1016/j.envres.2021.112065
3. Copat C, Cristaldi A, Fiore M, Grasso A, Zuccarello P, Santo Signorelli S, et al. The role of air pollution (PM and NO2) in COVID-19 spread and lethality: a systematic review. Environ Res. (2020) 191:110129. doi: 10.1016/j.envres.2020.110129
4. Rittweger J, Gilardi L, Baltruweit M, Dally S, Erbertseder T, Mittag U, et al. Temperature and particulate matter as environmental factors associated with seasonality of influenza incidence - an approach using earth observation-based modeling in a health insurance cohort study from Baden-Wurttemberg (Germany). Environ Health-Glob. (2022) 21(1):131. doi: 10.1186/s12940-022-00927-y
5. Carballo IH, Bakola M, Stuckler D. The impact of air pollution on COVID-19 incidence, severity, and mortality: a systematic review of studies in Europe and North America. Environ Res. (2022) 215:114155. doi: 10.1016/j.envres.2022.114155
6. Hoffmann L, Gilardi L, Antoni T, Baltruweit M, Bittner M, Breitner S, et al. Modulation of COVID-19 incidence by environmental stressors is variant between pre-omicron and omicron periods. Sci Rep. (2025) 15(1):27636. doi: 10.1038/s41598-025-13521-2
7. Bianconi V, Bronzo P, Banach M, Sahebkar A, Mannarino M, Pirro M. Particulate matter pollution and the COVID-19 outbreak: results from Italian regions and provinces. Arch Med Sci. (2020) 16(1):985–92. doi: 10.5114/aoms.2020.95336
8. Han Y, Zhao W, Pereira P. Global COVID-19 pandemic trends and their relationship with meteorological variables, air pollutants and socioeconomic aspects. Environ Res. (2022) 204:112249. doi: 10.1016/j.envres.2021.112249
9. Mehmood K, Bao Y, Abrar MM, Petropoulos GP, Soban A, Saud S, et al. Spatiotemporal variability of COVID-19 pandemic in relation to air pollution, climate and socioeconomic factors in Pakistan. Chemosphere. (2021) 271:129584. doi: 10.1016/j.chemosphere.2021.129584
10. Sarkodie SA, Owusu PA. Global effect of city-to-city air pollution, health conditions, climatic & socio-economic factors on COVID-19 pandemic. Sci Total Environ. (2021) 778:146394. doi: 10.1016/j.scitotenv.2021.146394
11. Bhatti UA, Marjan S, Wahid A, Syam M, Huang M, Tang H, et al. The effects of socioeconomic factors on particulate matter concentration in China’s: new evidence from spatial econometric model. J Cleaner Prod. (2023) 417:137969. doi: 10.1016/j.jclepro.2023.137969
12. Prata D, Rodrigues W, Bermejo PHDS, Moreira M, Camargo W, Lisboa M, et al. The relationship between (sub) tropical climates and the incidence of COVID-19. PeerJ. (2021) 9:e10655. doi: 10.7717/peerj.10655
13. Auler A, Cássaro F, Da Silva V, Pires L. Evidence that high temperatures and intermediate relative humidity might favor the spread of COVID-19 in tropical climate: a case study for the most affected Brazilian cities. Sci Total Environ. (2020) 729:139090. doi: 10.1016/j.scitotenv.2020.139090
14. Giovanetti M, Slavov SN, Fonseca V, Wilkinson E, Tegally H, Patané JSL, et al. Genomic epidemiology of the SARS-CoV-2 epidemic in Brazil. Nature Microbiology. (2022) 7(9):1490–500. doi: 10.1038/s41564-022-01191-z
15. Alcantara LCJ, Nogueira E, Shuab G, Tosta S, Fristch H, Pimentel V, et al. SARS-CoV-2 epidemic in Brazil: how the displacement of variants has driven distinct epidemic waves. Virus Res. (2022) 315:198785. doi: 10.1016/j.virusres.2022.198785
16. Martins JP, Siqueira BA, Sansone NMS, Marson FAL. COVID-19 in Brazil: a three-year update. Diagn Microbiol Infect Dis. (2023) 107(4):116074. doi: 10.1016/j.diagmicrobio.2023.116074
17. Yang J, Cordeiro G, Longato M, Vaghela S, Kyaw MH, Mendoza CF, et al. Burden of COVID-19 during the omicron predominance in Brazil: a nationwide retrospective database study. J Med Econ. (2023) 26(1):1201–11. doi: 10.1080/13696998.2023.2262323
18. Leirião LFL, Debone D, Miraglia SGEK. Does air pollution explain COVID-19 fatality and mortality rates? A multi-city study in São Paulo state, Brazil. Environ Monit Assess. (2022) 194(4):275. doi: 10.1007/s10661-022-09924-7
19. Mehta SK, Ananthavel A, Reddy TR, Ali S, Mehta SB, Kakkanattu SP, et al. Indirect response of the temperature, humidity, and rainfall on the spread of COVID-19 over the Indian monsoon region. Pure Appl Geophys. (2023) 180(1):383–404. doi: 10.1007/s00024-022-03205-7
20. Yıldırım E. The relationship between PM10 and SO2 exposure and COVID-19 infection rates in Turkey using nomenclature of territorial units for statistics level 1 regions. Heliyon. (2023) 9(11):e21795. doi: 10.1016/j.heliyon.2023.e21795
21. Atmospheric Composition Analysis Group. Satellite-derived PM2.5 (2024). Available online at: https://sites.wustl.edu/acag/datasets/surface-pm2-5/ (Accessed 06/01/2024).
22. Van Donkelaar A, Hammer MS, Bindle L, Brauer M, Brook JR, Garay MJ, et al. Monthly global estimates of fine particulate matter and their uncertainty. Environ Sci Technol. (2021) 55:15287–300. doi: 10.1021/acs.est.1c05309
23. Couto LO, Jacobson LSV, Périssé ARS, Hacon SS. Identifying high occurrence areas of hospitalization and mortality from respiratory diseases in the Brazilian legal Amazon: a space-time analysis. Cad Saúde Pública. (2024) 40:e00148023. doi: 10.1590/0102-311XEN148023
24. Fleischer NL, Merialdi M, van Donkelaar A, Vadillo-Ortega F, Martin RV, Betran AP, et al. Outdoor air pollution, preterm birth, and low birth weight: analysis of the world health organization global survey on maternal and perinatal health. Environ Health Persp. (2014) 122(4):425–30. doi: 10.1289/ehp.1306837
25. Gouveia N, Rodriguez-Hernandez JL, Kephart JL, Ortigoza A, Betancourt RM, Sangrador JLT, et al. Short-term associations between fine particulate air pollution and cardiovascular and respiratory mortality in 337 cities in Latin America. Sci Total Environ. (2024) 920:171073. doi: 10.1016/j.scitotenv.2024.171073
26. Hersbach H, Bell B, Berrisford P, Hirahara S, Horányi A, Muñoz-Sabater J, et al. The ERA5 global reanalysis. Q J R Metereol Soc. (2020) 146:1999–2049. doi: 10.1002/qj.3803
27. Alduchov OA, Eskridge RE. Improved Magnus form approximation of saturation vapor pressure. J Appl Meteorol. (1996) 35(4):601–9. doi: 10.1175/1520-0450(1996)035%3C0601:IMFAOS%3E2.0.CO;2
28. Gorelick N, Hancher M, Dixon M, Ilyushchenko S, Thau D, Moore R. Google earth engine: planetary-scale geospatial analysis for everyone. Remote Sens Environ. (2017) 202:18–27. doi: 10.1016/j.rse.2017.06.031
29. Python Software Foundation. Python (Version 3.12.1, packaged by conda-forge) (2023). Available online at: https://www.python.org/ (Accessed 05/10/2025).
30. Brazilian Institute of Geography and Statistics. Instituto Brasileiro de Geografia e Estatística (2024). Available online at: https://www.ibge.gov.br/en/home-eng.html (Accessed 07/05/2024).
31. R Core Team. R: A Language and Environment for Statistical Computing. R Foundation for Statistical Computing (2023).
33. Wood S. Generalized Additive Models: An introduction with R. 2nd ed. New York: Chapman and Hall/CRC (2017).
34. Hastie T, Tibshirani R, Friedman JH, Friedman JH. The Elements of Statistical Learning: Data Mining, Inference, and Prediction. 2nd ed. New York: Springer (2009).
35. Gasparrini A. Distributed lag linear and non-linear models in R: the package dlnm. J Stat Softw. (2011) 43(8):1. doi: 10.18637/jss.v043.i08
36. Mathieu E, Ritchie H, Lucas R-G, Appel C, Gavrilov D, Giattino C, et al. Coronavirus (COVID-19) Cases (2020). Available online at: https://ourworldindata.org/covid-cases (Accessed 20/01/2025).
37. Alvares CA, Stape JL, Sentelhas PC, Gonçalves JM, Sparovek G. Köppen’s climate classification map for Brazil. Meteorol Zeitschrift. (2013) 22(6):711–28. doi: 10.1127/0941-2948/2013/0507
38. Curado LFA, de Paulo SR, de Paulo IJC, de Oliveira Maionchi D, da Silva HJA, de Oliveira Costa R, et al. Trends and patterns of daily maximum, minimum and mean temperature in Brazil from 2000 to 2020. Climate. (2023) 11(8):168. doi: 10.3390/cli11080168
39. Olinto MTA, Garcêz AS, Brunelli G, Olinto FA, Fanton M, Canuto R. Relationship between temperature and relative humidity on initial spread of COVID-19 cases and related deaths in Brazil. J Infect Dev Ctries. (2022) 16(5):759–67. doi: 10.3855/jidc.15324
40. Prata DN, Rodrigues W, Bermejo PH. Temperature significantly changes COVID-19 transmission in (sub) tropical cities of Brazil. Sci Total Environ. (2020) 729:138862. doi: 10.1016/j.scitotenv.2020.138862
41. Martins LD, da Silva I, Batista WV, de Fátima Andrade M, de Freitas ED, Martins JA. How socio-economic and atmospheric variables impact COVID-19 and influenza outbreaks in tropical and subtropical regions of Brazil. Environ Res. (2020) 191:110184. doi: 10.1016/j.envres.2020.110184
42. Decker SRR, Wolf JM, Pille A, Freese L, Petek H, de Oliveira Rocha B, et al. Temporal trends in respiratory pathogens following the COVID-19 pandemic and climate variables: a unicentric retrospective evaluation of 24 pathogens in a temperate subtropical region. J Med Virol. (2024) 96(7):e29797. doi: 10.1002/jmv.29797
43. Brunelli TC, Paiva S, Siqueira AY, Santana CE, Curvo LO, Marques JB, et al. Environmental parameters and relationships with COVID-19 cases in Central South America. Química Nova. (2021) 44(10):1236–44. doi: 10.21577/0100-4042.20170786
44. Ye T, Xu R, Yue X, Chen G, Yu P, Coêlho MS, et al. Short-term exposure to wildfire-related PM2. 5 increases mortality risks and burdens in Brazil. Nat Commun. (2022) 13(1):7651. doi: 10.1038/s41467-022-35326-x
45. Gonçalves KS, Cirino GG, Costa MO, Couto LO, Tortelote GG, Hacon SS. The potential impact of PM2. 5 on the COVID-19 crisis in the Brazilian Amazon region. Rev Saúd Pública. (2023) 57:67. doi: 10.11606/s1518-8787.2023057005134
46. da Costa G, Pauliquevis T, Heise EFJ, Potgieter-Vermaak S, Godoi AFL, Yamamoto CI, et al. Spatialized PM2. 5 during COVID-19 pandemic in Brazil’s most populous southern city: implications for post-pandemic era. Environ Geochem Hlth. (2024) 46(1):29. doi: 10.1007/s10653-023-01809-z
47. Feurer D, Riffe T, Kniffka MS, Acosta E, Armstrong B, Mistry M, et al. Meteorological factors, population immunity, and COVID-19 incidence: a global multi-city analysis. Environ Epidemiol. (2024) 8(6):e338. doi: 10.1097/EE9.0000000000000338
48. McMorris T, Swain J, Smith M, Corbett J, Delves S, Sale C, et al. Heat stress, plasma concentrations of Adrenaline, noradrenaline, 5-hydroxytryptamine and cortisol, mood state and cognitive performance. Int J Psychophysiol. (2006) 61(2):204–15. doi: 10.1016/j.ijpsycho.2005.10.002
49. Leppäluoto J, Westerlund T, Huttunen P, Oksa J, Smolander J, Dugué B, et al. Effects of long-term whole-body cold exposures on plasma concentrations of ACTH, beta-endorphin, cortisol, catecholamines and cytokines in healthy females. Scand J Clin Lab Invest. (2008) 68(2):145–53. doi: 10.1080/00365510701516350
50. Zefferino R, Di Gioia S, Conese M. Molecular links between endocrine, nervous and immune system during chronic stress. Brain Behav. (2021) 11(2):e01960. doi: 10.1002/brb3.1960
51. Barberia LG, Boing A, Gusmão J, Miyajima F, Abud A, Kemp B, et al. An assessment of the public health surveillance strategy based on molecular testing during three major pandemic waves of COVID-19 in Brazil. PLoS Glob Public Health. (2023) 3(8):e0002164. doi: 10.1371/journal.pgph.0002164
52. Boing AF, Boing AC, Veras MA, de Lacerda JT, da Silva RLP, Barbato PR, et al. Area-level inequalities in COVID-19 outcomes in Brazil in 2020 and 2021: an analysis of 1,894,165 severe COVID-19 cases. Prev Med. (2022) 164:107298. doi: 10.1016/j.ypmed.2022.107298
53. Van Donkelaar A, Martin RV, Brauer M, Kahn R, Levy R, Verduzco C, et al. Global estimates of ambient fine particulate matter concentrations from satellite-based aerosol optical depth: development and application. Environ Health Persp. (2010) 118(6):847–55. doi: 10.1289/ehp.0901623
54. Wei J, Li Z, Lyapustin A, Wang J, Dubovik O, Schwartz J, et al. First close insight into global daily gapless 1 km PM2. 5 pollution, variability, and health impact. Nat Commun. (2023) 14(1):8349. doi: 10.1038/s41467-023-43862-3
55. Mistry MN, Schneider R, Masselot P, Royé D, Armstrong B, Kyselý J, et al. Comparison of weather station and climate reanalysis data for modelling temperature-related mortality. Sci Rep-Uk. (2022) 12(1):5178. doi: 10.1038/s41598-022-09049-4
56. Raymundo CE, Oliveira MC, de Araujo Eleuterio T, de Arruda Santos Junior ÉC, da Silva MG, André SR, et al. Spatial–temporal distribution of incidence, mortality, and case-fatality ratios of coronavirus disease 2019 and its social determinants in Brazilian municipalities. Sci Rep. (2023) 13(1):4139. doi: 10.1038/s41598-023-31046-4
Keywords: COVID-19, temperature, PM2.5, relative humidity, DLNM, Brazil
Citation: Hoffmann L, Viana Jacobson L, Erbertseder T, Berger M, Rittweger J and Schneider R (2025) Associations between COVID-19 incidence and environmental stressors in Brazil: a nationwide study from 2020 to 2022. Front. Environ. Health 4:1635503. doi: 10.3389/fenvh.2025.1635503
Received: 26 May 2025; Accepted: 17 September 2025;
Published: 3 October 2025.
Edited by:
Mehdi Hazari, United States Environmental Protection Agency (EPA), United StatesReviewed by:
Sanjay Kumar Mehta, SRM Institute of Science and Technology (Deemed to be University) Research Kattankulathur, IndiaElif Yıldırım, Konya Technical University, Türkiye
Copyright: © 2025 Hoffmann, Viana Jacobson, Erbertseder, Berger, Rittweger and Schneider. This is an open-access article distributed under the terms of the Creative Commons Attribution License (CC BY). The use, distribution or reproduction in other forums is permitted, provided the original author(s) and the copyright owner(s) are credited and that the original publication in this journal is cited, in accordance with accepted academic practice. No use, distribution or reproduction is permitted which does not comply with these terms.
*Correspondence: Leona Hoffmann, bGVvbmEuaG9mZm1hbm5AZGxyLmRl
†Deceased