 Alma Kokhmetova1,2*
 Deepmala Sehgal3*
 Shaukat Ali4
 Makpal Atishova1
 Madina Kumarbayeva1,2
 Irina Leonova5
 Susanne Dreisigacker3
- 1Laboratory of Breeding and Genetics, Institute of Plant Biology and Biotechnology (IPBB), Almaty, Kazakhstan
- 2Faculty of Agronomy, Kazakh National Agrarian University, Almaty, Kazakhstan
- 3Global Wheat Program, International Maize and Wheat Improvement Center (CIMMYT), Texcoco, Mexico
- 4Department of Agronomy, Horticulture & Plant Science, South Dakota State University, Brookings, SD, United States
- 5Institute of Cytology and Genetics of the Siberian Branch of the Russian Academy of Sciences, Novosibirsk, Russia
Tan spot, caused by Pyrenophora tritici-repentis, is a serious foliar disease of wheat in Kazakhstan with reported yield losses as high as 50% during epidemic years. Here, we report the evaluation of a collection of 191 hexaploid spring and winter wheat lines for tan spot resistance and its underlying genetic architecture using genome-wide association study (GWAS). Our wheat collection comprised candidate varieties from Kazakhstan, Russia, and CIMMYT. It was genotyped using the DArTseq technology and phenotyped for resistance to tan spot at seedling and adult plant stages in Kazakhstan. DArTseq SNPs revealed high genetic diversity (average polymorphic information content = 0.33) in the panel and genome-wide linkage disequilibrium decay at 22 Mb (threshold r2 = 0.1). Principal component analysis revealed a clear separation of Eurasian germplasm from CIMMYT and IWWIP lines. GWAS identified 34 marker-trait associations (MTA) for resistance to tan spot and the amount of phenotypic variation explained by these MTA ranged from 4% to 13.7%. Our results suggest the existence of novel valuable resistant alleles on chromosomes 3BS, and 5DL and 6AL for resistance to Race 1 and Race 5, respectively, in addition to known genes tsn1 and tsc2. On chromosome 6AL, a genomic region spanning 3 Mb was identified conferring resistance to both Race 1 and Race 5. Epistatic interaction of associated loci was revealed on chromosomes 1B, 5B, 7B, 5A, and 6A contributing to additional variation of 3.2–11.7%. Twenty-five lines with the best allele combinations of SNPs associated with resistance to both races have been identified as candidates for future variety release and breeding. The results of the present study will be further validated in other independent genetic backgrounds to be able to use markers in breeding.
Introduction
Bread wheat (Triticum aestivum L.) is grown in more than 85 countries with a gross annual production of 761.5 million tons (FAO, 2020). Consumed by more than 40% world population, it is the primary source of calories for millions of people worldwide. Central Asia, including Kazakhstan, plays a significant role in regional and global food security as most of the grain produced is traded in these regions (Morgounov et al., 2014). The total area sown to wheat in Kazakhstan represents over 85% of total cereal production. Tan spot caused by Pyrenophora tritici-repentis (Died.) is an economically important disease in most wheat-growing regions worldwide, including Europe, North and South America, Australia, and Asia (Duveiller et al., 2005). In Central Asia, the disease was discovered in the 1980s in Tajikistan (Khasanov, 1988), and since then, it has spread throughout Central Asia and Kazakhstan (Postnikova and Khasanov, 1998; Lamari et al., 2005; Koyshibaev, 2018). On an average, losses due to tan spot vary from 10% to 15% but may reach up to 50% during epidemic years (Rees et al., 1982; Shabeer and Bockus, 1988). Tan spot reduces total yield, grain weight, number of grains per head, total biomass, and grain quality (Shabeer and Bockus, 1988; Fernandez et al., 1994).
Currently, eight races of P. tritici-repentis (PTR) have been identified based on necrosis and chlorosis symptoms induced by host-selective toxins (HST) on a set of differential wheat varieties (Lamari et al., 2003). Races 2, 3, and 5 can be designated as basic races, while Races 1, 6, 7, and 8 are combinations of the three basic races except for Race 4, which is avirulent (Lamari et al., 2003). To date, three host-specific toxins, Ptr ToxA, Ptr ToxB, and Ptr ToxC, of P. tritici-repentis have been identified and well characterized. Ptr ToxA is produced by Races 1, 2, 7, and 8 (Lamari et al., 2003) and associated with necrotic symptoms in Ptr ToxA-sensitive cultivars. Ptr ToxB is produced by Races 5, 6, 7, and 8 and is responsible for the induction of chlorosis in Ptr Tox-B-sensitive cultivars. Both Ptr ToxA and Ptr ToxB are proteins in nature, while Ptr ToxC (produced by Race 1 and Race 3) is a non-ionic, polar non-protein (Effertz et al., 2002).
There are a number of studies conducted on the racial composition of P. tritici-repentis worldwide (Lamari and Bernier, 1989; Ali and Francl, 2002, 2003; Lamari et al., 2003, 2005; Maraite et al., 2006; Gamba et al., 2012; Kokhmetova et al., 2016, 2017). The greatest diversity in the pathogen population was observed in Azerbaijan, where Races 1, 2, 3, 5, 7, and 8 were identified, and in Syria, where Races 1, 3, 5, 7, and 8 were observed. Race 1 is the most widespread race in Central Asia and Kazakhstan (87%), and Races 2, 3, and 4 are prevalent infrequently (Maraite et al., 2006). Recently, Race 8 was also found in high frequency in Kazakhstan (Kokhmetova et al., 2016, 2017).
The inheritance of resistance to tan spot is both qualitative and quantitative; toxicity resistance genes and quantitative trait loci (QTL) are known (Faris et al., 1996, 2013; Gamba and Lamari, 1998; Anderson et al., 1999; Faris and Friesen, 2005; Tadesse et al., 2006a,b; Chu et al., 2008, 2010; Singh et al., 2008, 2010, 2016; Li et al., 2011; Hu et al., 2019). Qualitative genes identified through conidial inoculations have been given the designation “Tsr” for “tan spot resistance,” and genes associated with reaction to HST-containing cultures are designated as “Tsc” or “Tsn” depending on the necrosis or chlorosis symptom exhibited by the HST (McIntosh et al., 2008). To date, eight major Tsr genes (Tsrl, Tsr2, Tsr3, Tsr4, Tsr5, Tsr6, TsrHar, and TsrAri) located on chromosomes 2BS, 3AS, 3BL, 3DS, and 5BL have been identified (McIntosh et al., 2013). Two Tsc genes (Tsc1 and Tsc2), conferring sensitivity to Ptr ToxC and Ptr ToxB, have been mapped on chromosomes 1AS (Effertz et al., 2002) and 2BS (Friesen and Faris, 2004; Abeysekara et al., 2010), respectively.
With the availability of millions of single-nucleotide polymorphisms (SNPs) in almost all crops, genome-wide association study (GWAS) has become a common approach in dissecting genetic architecture of traits and in identifying beneficial alleles for use in marker-assisted selection (Santure and Garant, 2018). In wheat, GWAS has been conducted for several diseases, including resistance to Stagonospora nodorum blotch (Tommasini et al., 2007), stem rust (Bajgain et al., 2016; Elbasyoni et al., 2017), stripe rust (Yu et al., 2011, 2012; Sehgal et al., 2016), fusarium head blight (Miedaner et al., 2011), and Septoria tritici blotch (Gerard et al., 2017). GWAS studies for tan spot resistance have led to significant advances in the identification of loci on chromosomes 2B, 3B, 4A, 6B, 6A, and 7B (Gurung et al., 2011; Patel et al., 2013; Kollers et al., 2014; Singh et al., 2016; Hu et al., 2019). However, hitherto, the genetic basis of tan spot resistance in wheat germplasm from Kazakhstan has not been yet investigated. Our objectives were therefore (1) to evaluate a Kazakhstan collection of winter and spring wheat cultivars/breeding lines for tan spot resistance, (2) to identify genetic loci associated with tan spot resistance via GWAS, (3) to explore gene-by-gene interactions among significant genetic loci, and (4) to identify best combinations of alleles and lines for future phenotyping trials and breeding.
Materials and Methods
Plant Materials
A total of 191 spring and winter hexaploid wheat accessions (Triticum aestivum L.) were evaluated in this study. The collection included 111 cultivars and breeding lines from Kazakhstan, 17 cultivars from Russia, 1 cultivar from Brazil, 30 lines released by CIMMYT, and 31 lines released by CIMMYT-ICARDA-IWWIP (International Maize and Wheat Improvement Center-International Center for Agricultural Research in the Dry Areas–International Winter Wheat Improvement Program) (Supplementary Table 1). The collection comprised important wheat genotypes that have been widely used as parental lines in breeding programs across the Kazakhstan and Central Asian countries. The 111 cultivars from Kazakhstan included in the collection were chosen based on their contrasting phenotypic expression for traits of agronomic and disease resistance. Three differential lines, cultivar “Glenlea” carrying the Tsc1 gene, line “6B662” carrying Tsc2, and cultivar Salamouni resistant to all known races and insensitive to toxins Ptr ToxA, Ptr ToxB, and Ptr ToxC were included as checks.
Fungal Isolates, Inoculum Production, and Inoculations
The isolates Pti2 and DW7 used in this study were previously obtained from bread wheat (T. aestivum L.) and durum wheat (Triticum durum Desf), respectively, and stored as dried mycelial plugs at −20°C (Jordahl and Francl, 1992). The isolate Pti2 was from spring wheat and the isolate DW7 was collected from a durum wheat field in North Dakota (Ali and Francl, 2003), and they were used for inoculum production in this study. The inoculum and inoculations were carried out as described in Ali and Francl (2001). To prepare the inoculum, a single mycelial plug (0.5 cm in diameter) was placed on V8PDA (150 ml of V8 juice, 10 g of Difco PDA, 10 g of Difco agar, 3 g of calcium carbonate, and 850 ml of sterile distilled water) (Lamari and Bernier, 1989) in 9-cm petri plates. After placing the mycelia plug of both isolates individually in petri plates, the plates were wrapped with aluminum foil and incubated at 21°C for 5 days. Thereafter, the petri plates were filled with sterilized distilled water, and hyphal growth was knocked down with a flamed-sterilized glass test tube. After suppressing the hyphae, excess water was removed from the plates, and then they were incubated in an alternate cycle of 24 h light at 22°C and 24 h dark at 16°C to induce conidiophores and conidia. The conidia were dislodged with an inoculating loop wired needle. The conidial suspension was obtained by adding 30 ml of distilled sterile water in each plate, and conidia were dislodged with a looped wire needle. The conidial suspension was adjusted to 3,000 spores/ml using the hemocytometer. One drop of Tween 20 was added/100 ml of conidial suspension before inoculation. Inoculated seedlings were moved to a mist chamber at 21°C with a 16-h photoperiod for 24 h to enhance the chances of infection. The chamber was misted for 16 s at 3-min intervals to keep 100% RH. The plants then were moved to a growth chamber at 22°C.
Seedling Test
Seedlings of all 191 wheat accessions were raised in containers (3.8 cm in diameter and 20 cm long) as described in Ali and Francl (2001). For each race of P. tritici-repentis (Races 1 and 5), separate experiments were conducted in the growth chamber. Three seeds were planted in a plastic container (Stuewe & Sons, Inc., OR) filled with Sunshine Mix #1 (Fison Horticulture, Vancouver, BC, Canada). All containers were placed in 96-slot racks to hold them straight. Each container was considered as an experimental unit, and each single plant in a container with three seedlings served as an entry. All entries were arranged in a randomized complete design with three replications. Thus, nine seedlings of each genotype were evaluated individually at the two-leaf stage against Race 1 (isolate Pti2) and Race 5 (isolate DW7). In each experiment, replications were treated as random effect and the wheat accessions as fixed effects. All experiments were conducted in growth chambers at South Dakota State University (SDSU), Brookings, SD, in 2015. Seedlings were rated 8 days post-inoculation using the rating scale 1–5 (Lamari and Bernier, 1989) where 1–2 is resistant to moderately resistant, 3 is moderately susceptible, and 4–5 is susceptible. BLUE (best linear unbiased estimators) across replications were calculated in META-R (Vargas et al., 2013).
Phenotyping for Sensitivity to Ptr ToxA and Ptr ToxB
The 191 wheat entries and three checks were tested for their reaction to purified toxins Ptr ToxA and Ptr ToxB at a concentration of 10 μg/ml. Ptr ToxA and Ptr ToxB were kindly provided by Dr. Steven Meinhardt, North Dakota State University, Fargo, and Dr. Timothy Friesen, USDA, Fargo, ND. Four leaves (second leaf fully expanded), of each genotype were infiltrated as described by Faris et al. (1996) with pure Ptr ToxA and Ptr ToxB culture filtrates separately. After infiltration, the plants were kept in a growth chamber at 21°C during the day and 18°C at night with 16 h photoperiod in the growth chamber. Leaves evaluated 4 days post infiltration and scored as insensitive (−) or sensitive (+). This experiment was repeated twice. Wheat genotypes “Glenlea” (ToxA sensitive), “6B662” (ToxB sensitive), and “Salamouni” (ToxA and ToxB insensitive) were also included in the experiment to verify the results and toxin viability (Ali and Francl, 2003; Lamari et al., 2003).
Field Phenotyping
The experimental material was phenotyped at the Kazakh Research Institute of Agriculture and Plant Growing (KRIAPG), Almalybak (43°13′09′′ N, 76°36′17′′ E) in Southeast Kazakhstan, Almaty region, during the 2016 to 2018 cropping seasons. Experiments were conducted as a completely randomized design with three replicates. Individual plot size was 1 m2. Fertilizer treatments, 60 and 30 kg/ha of N and P2O5, respectively, and other management practices were corresponded to those normally recommended for the region (Dospekhov, 1985).
Experiments were planted in mid-September and were harvested in mid-August the following year for 3 years. The weather conditions at Almalybak were characterized annually by over 400 mm of rainfall. The irrigated foothill zone, where KRIAPG is located, is a relatively high moistured location; the experimental wheat materials were irrigated thrice during the growing season and were kept free from weeds.
The field evaluation was carried out under natural epidemic conditions in 2016 and 2017, whereas in 2018, it was carried out under natural conditions as well as using artificial inoculation. Ten Flag-1 leaves were evaluated for each disease assessment of genotypes. The disease was assessed three times. The experiments on an artificial infectious background were made with naturally infected straw stubbles. In October, before sowing, the infected straw (1 kg/m2) was incorporated into the soil. For evaluation of field response, disease severities were assessed on first leaves and flag leaves in GS 65–69, Zadoks scale (Zadoks et al., 1974). The percentage of Ptr-infected leaf area was determined on each leaf, and the average value for all evaluated leaves was calculated for each wheat entry in order to determine the PTR score. A rating system based on% leaf area infected developed for appraising the foliar intensity of diseases (Kremneva and Volkova, 2007) was used to categorize host reaction to P. tritici-repentis. This scale of disease severity was rated numerically based on% necrotic or chlorotic area as follows: 0–10%—resistant (R), 11–20%—moderately resistant (MR), 21–30%—moderately susceptible (MS), and 31–100%—susceptible (S). The standard wheat differentials included “Glenlea” (susceptible check) and “Salamouni” (resistant check) and were included in the field trials. Plant height (PH) was recorded in centimeters from the soil surface to the tip of the spike of 10–15 plants per plot in GS 90–99. Days to heading (DH) were recorded as the number of days from planting to the 50% spike emergence in GS 49–50 (Zadoks et al., 1974).
Analysis of phenotypic resistance ratings to tan spot based on the area under disease progress curve (AUDPC) was performed. AUDPC was calculated annually by summarizing the progress of disease severity. AUDPC values from double digit and AUDPC from flag leaf (F) and penultimate leaf (F-1) were separately calculated by using the following formula described by Das et al. (1992). ANOVA analyses of phenotypic data was done using linear mixed effect model with package lme4 in R using replications as fixed effect and entries as random effect. The package reshape was used to transform the data for ANOVA analysis. Broad-sense-heritability was estimated using the formula: h2 = Vg/(Vg + Verr/r), where Vg is the genotypic variance, Verr is the error variance, and r = the number of replications.
DNA Extraction and Genotyping
Genomic DNA was extracted from fresh leaves collected from a single individual plant using a modified CTAB (cetyltrimethylammonium bromide) method described in the CIMMYT laboratory protocols (Dreisigacker et al., 2012, 2016) and quantified using a NanoDrop 8000 spectrophotometer V 2.1.0. Genotyping was performed using the DArTseqTM technology provided by the Genetic Analysis and Service for Agriculture (SAGA) laboratory in Mexico. Briefly, the genotypes were sequenced at 192-plexing on Illumina HiSeq2500 with 1 × 77-bp reads. A proprietary analytical pipeline developed by DArT P/L was used to generate allele calls for SNP and presence/absence variation (PAV) markers (Sansaloni et al., 2011). A 100K consensus map provided by SAGA was used to obtain genetic positions of the SNPs (Sansaloni et al. unpublished). To obtain physical positions of SNPs, sequence reads of the SNPs were blasted to the reference genome of RefSeq V1.0 in the Ensemble Plants database1.
Diversity, Population Structure, and Linkage Disequilibrium Analysis
Polymorphic information content (PIC) (Botstein et al., 1980) was calculated to characterize the genetic diversity of the panel using PowerMarker version 3.25 (Liu and Muse, 2005). Population structure was investigated by principal component analysis (PCA) using the STATS package in R and using STRUCTURE v 2.3.4 (Pritchard et al., 2000). The STRUCTURE program was run by setting replication number to 50,000 for the burn-in and the Markov Chain Monte Carlo (MCMC) periods. K values were run from 1 to 7 using “admixture” and “correlated allele frequency” models. The correct estimation of K was provided by an ad hoc statistic delta K, calculated using the program STRUCTURE HARVESTER2. A weighted neighbor joining tree was constructed in DARwin version 6.03.
GAPIT v. 2.0 (Lipka et al., 2012) was used to obtain squared correlation coefficient (r2), a measure of linkage disequilibrium (LD), for all pairwise comparisons among markers. Pattern of LD decay was visualized in individual subpopulations and in the whole panel by plotting pair-wise r2 values against the physical distance. A smooth line was fit to the data using second-degree locally weighted scatterplot smoothing, LOESS (Breseghello and Sorrells, 2006) as implemented in SAS. For the LOESS estimation of LD decay, genetic distance was estimated as the point where the LOESS curve first crosses the baseline r2 of 0.1.
Genome-Wide Association Analysis
The BLUE and average scores for disease severity at seedling stage and AUDPC values at adult plant stage in the field were used for conducting GWAS. To map Ptr ToxA and Ptr ToxB resistance loci, all insensitive genotypes were scored as 1 and all sensitive genotypes as 5, and the average of the two scores was used for GWAS. VanRaden algorithm (VanRaden, 2008) was used to calculate the kinship matrix in the GAPIT package vs. 2.0 (Lipka et al., 2012). GWAS was conducted in the TASSEL software vs. 5 (Bradbury et al., 2007). A mixed linear model (MLM) was applied in which PCA was a fixed variate (first three PCs) and kinship as random. A false-discovery rate (FDR) was used to assess the significance of the p value (<0.05). The allelic effect of significant marker-trait associations was estimated as the difference between the mean value of lines with and without favorable allele and was presented as box plots. A second GWAS analysis was conducted in which we included 8,947 unmapped markers along with a filtered set of markers. Interestingly, eight unmapped markers crossed the FDR threshold, but these showed very low R2 values, ranging from 2.2 to 3.1%. We have not shown these results.
Epistatic Interaction Analysis
Two- and three-locus epistatic interactions among associated SNPs and among genome-wide SNPs were explored using a custom-made in-house script described in Sehgal et al. (2017). Briefly, a stepwise multiple regression was performed using a linear regression model to calculate P values for pairwise marker interactions. A threshold of P < 0.0001 was used to declare significant marker–marker interactions. The parameter R2 was used to describe percentage variation explained by the significant interactions. The interactions showing percentage variation <10% were discarded from the output.
Results
Resistance to Pyrenophora tritici-repentis Race 1 and Race 5 at Seedling Stage
Uniform and consistent tan spot development was observed in the seedling evaluation in growth chambers. ANOVA showed significant differences among genotypes (P < 0.001) for the reaction scores to both races (Supplementary Table 2). The checks Glenlea and 6B662 developed necrosis and chlorosis to Race 1 and Race 5, respectively, and verified the Race identity and the success of inoculation. Salamouni did not develop any symptoms and exhibited resistant reaction. Salamouni and Glenlea showed scores of 1.0 and 4.5 for Race 1, whereas for Race 5, Salamouni and 6B-662 showed scores of 1.1 and 4.3.
Of the 191 genotypes, 50 genotypes (26.2%) revealed a disease score of less than 2 and were considered resistant to Race 1, whereas 130 wheat accessions (68.6%) were resistant to Race 5 (Figure 1A). Sixty-two accessions showed resistance against both races.
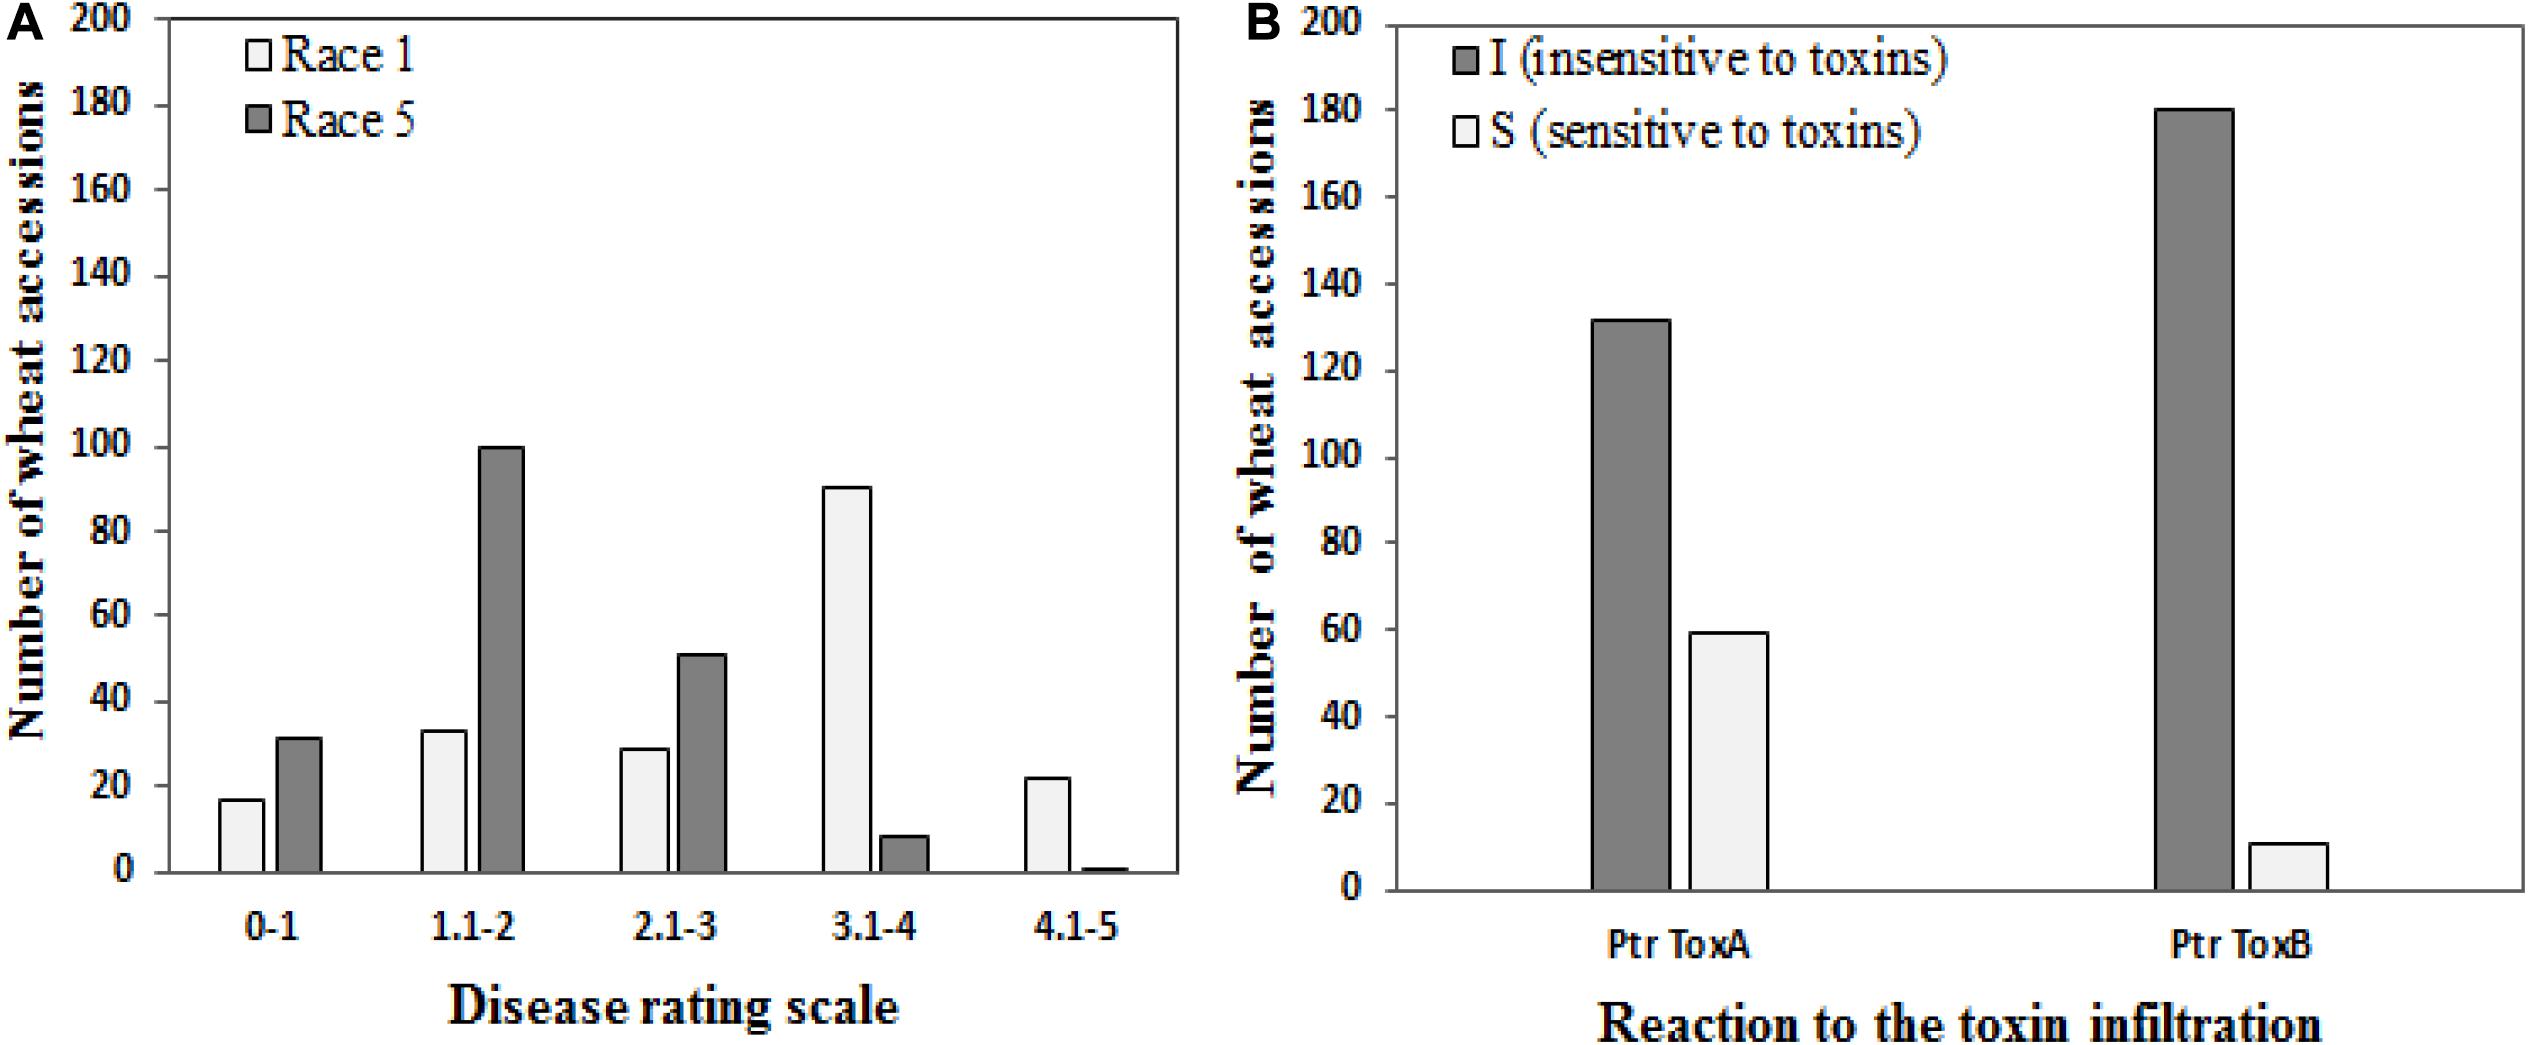
Figure 1. Frequencies of 191 wheat genotypes in different disease score groups (A) to tan spot (Pyrenophora tritici-repentis Race 1 and Race 5) and (B) host-selective Ptr ToxA and Ptr ToxB.
Sensitivity to Ptr ToxA and Ptr ToxB
One hundred thirty-two genotypes (69.1%) showed no symptoms of necrosis and were determined to be Ptr ToxA insensitive, while the remaining 59 genotypes (30.9%) were scored as sensitive (Figure 1B). Salamouni and Glenlea exhibited insensitive and sensitive reactions to Ptr ToxA, respectively. Ptr ToxA sensitivity was associated with disease susceptibility in field conditions in all years (Pearson’s correlation r = 0.22 to 0.38, P < 0.001).
For Ptr ToxB, Salamouni and 6B-662 exhibited insensitive and sensitive reactions, respectively. Twelve genotypes (6.3%) exhibited chlorosis in the toxin-infiltrated leaf area and were rated to be Ptr ToxB sensitive. The remaining 93.7% (179) did not develop chlorosis symptoms and were rated as Ptr ToxB insensitive (Figure 1B). The correlation of Ptr Tox B sensitivity with disease susceptibility in the field was not significant (r = 0.03–0.11, P = 0.3029).
Field Resistance to Pyrenophora tritici-repentis
Of the three field experiments conducted in 2016, 2017, and 2018 under natural epidemic conditions, the disease pressure was minimum in 2017, and more than 95% of lines were resistant. Hence, phenotypic data from 2017 was not used for any further analysis, i.e., calculating AUDPC scores or GWAS. There were significant (P < 0.001) differences for tan spot response in the field in 2016 and 2018 (under both natural conditions and under artificial inoculation in 2018). Days to heading (DH) and plant height (PH) also showed significant variation (P < 0.001) (Supplementary Table 3). Field severity of tan spot varied between three experiments (2016–2018). The disease severity was generally higher under artificial inoculation conditions (2018_infect) than under natural inoculum conditions in 2016 and 2018. The number of accessions in each reaction class across three experiments is presented in Figure 2. On an average, 9, 27, 44, and 25% of genotypes were resistant (R), moderately resistant (MR), moderately susceptible (MS) and susceptible (S) in the field. Under artificial inoculation conditions in 2018 (2018_infect), the number of accessions in class S increased to 73%. Six genotypes, i.e., Tungysh, JAC161/TEMU51.80, TOO11/TOOOO7, SOMO/SORA/ACTS5, NANJING 82149/KAUZ, and ALTAR 84/AE. SQUARROSA exhibited the highest level of resistance. A significant number of wheat entries from CIMMYT (13%) demonstrated high or moderate level of resistance. Correlation of days to heading and plant height with AUDPC scores was not significant in all field seasons (Supplementary Table 4).
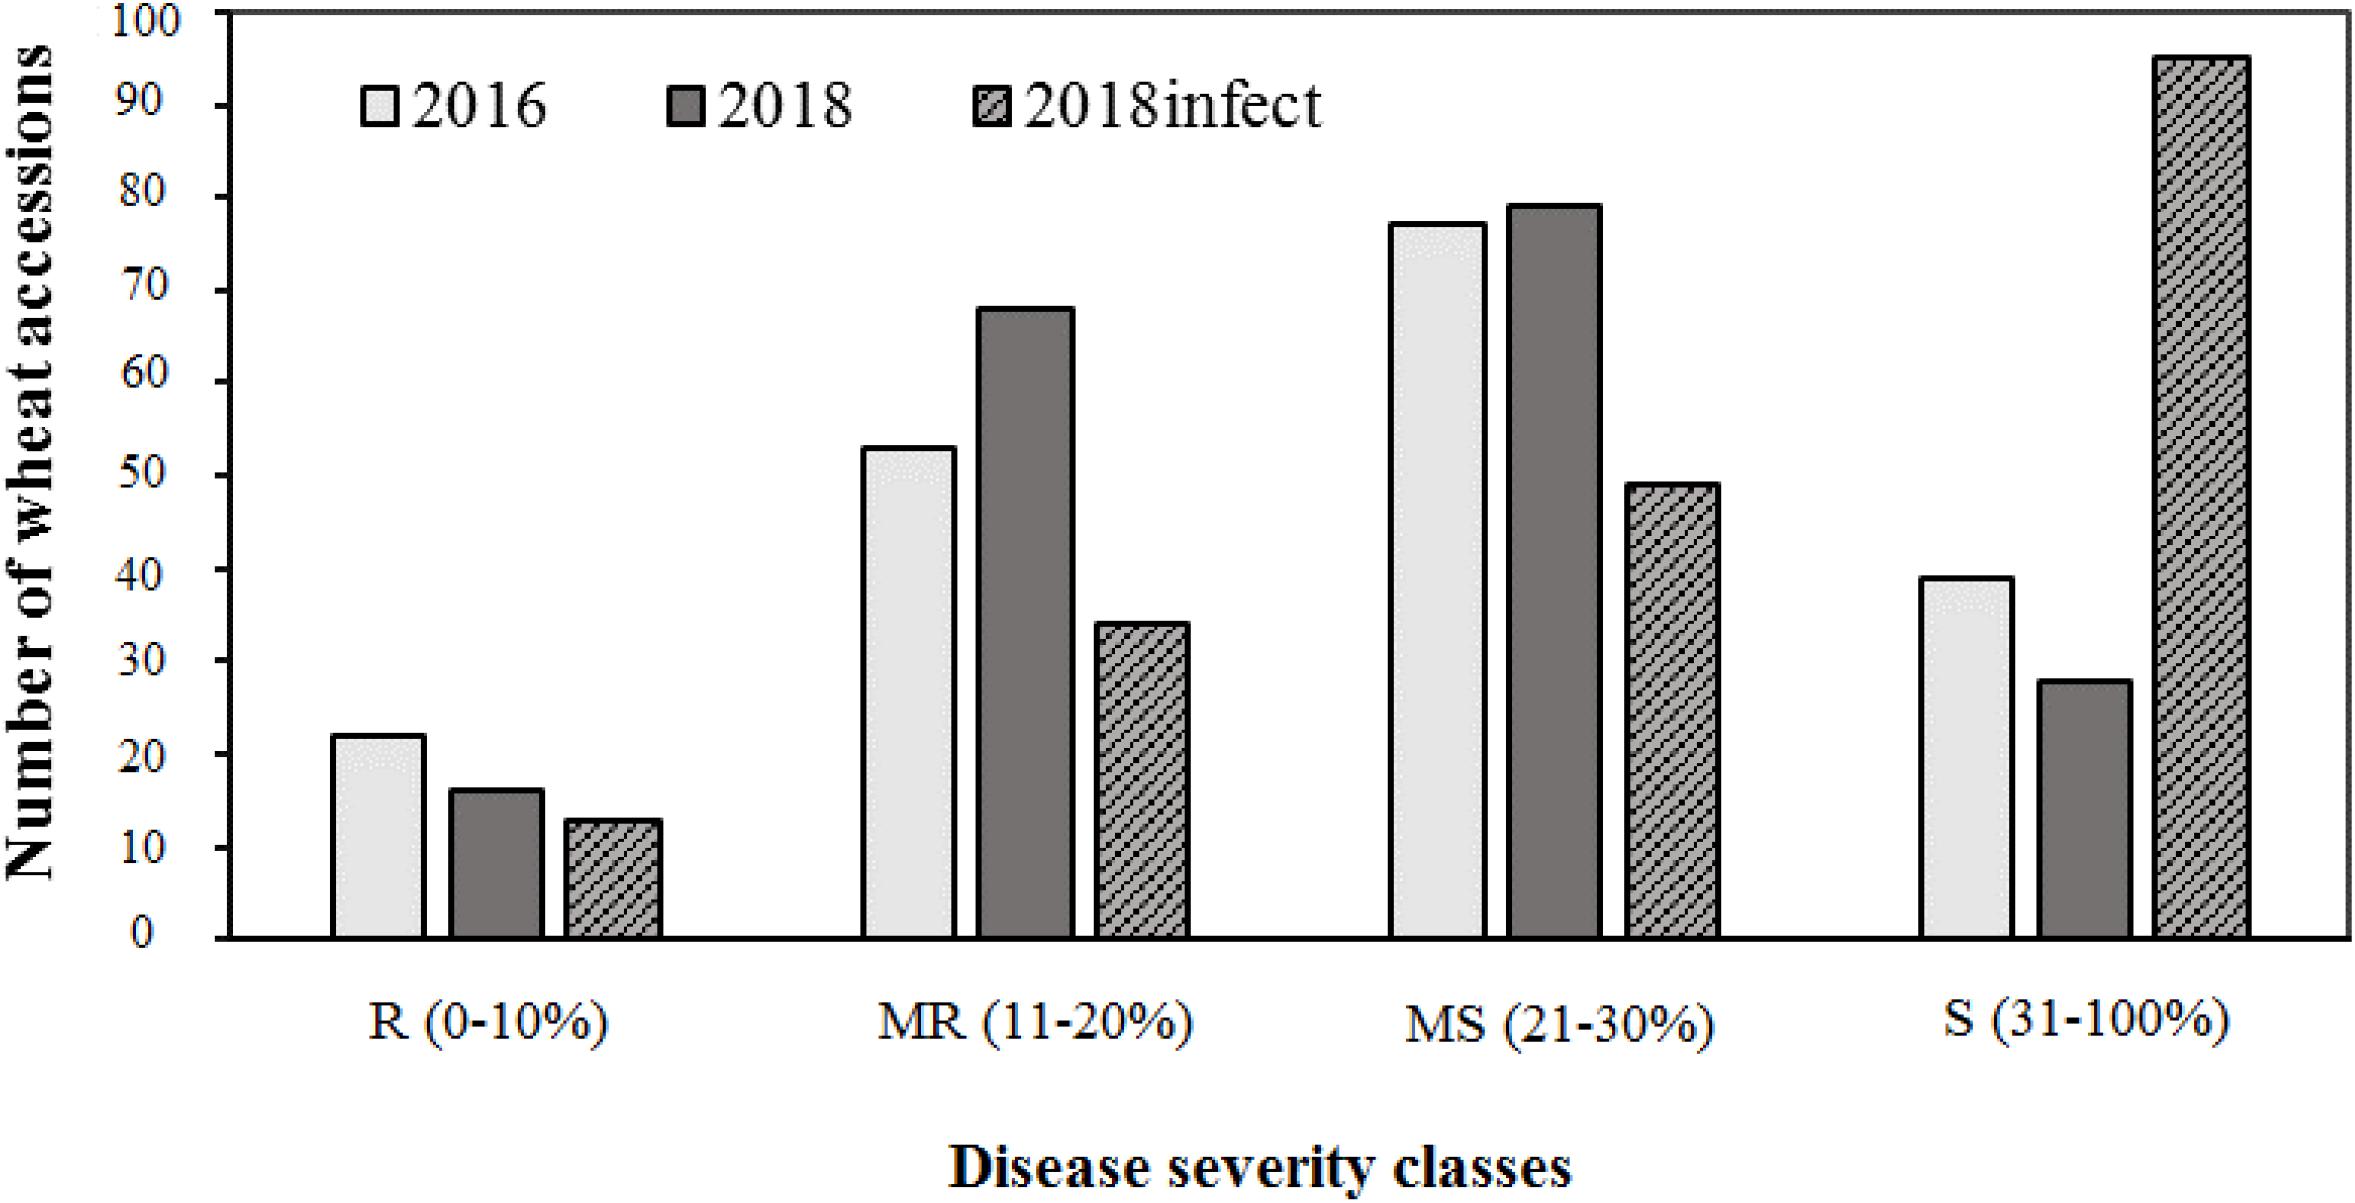
Figure 2. Frequencies of 191 wheat genotypes reaction to tan spot in field.
Comparison of the phenotypic data under field conditions with the green house experiment showed that out of 69 entries that showed R and MR response in field, 31 and 62 genotypes had disease scores less than 2 for Race 1 and Race 5, respectively.
Marker Distribution and Diversity
A total of 40,429 SNPs were obtained across the 191 genotypes after allele calling. Of these, 10,186 markers with missing data >20% and 8,947 unmapped markers were removed from the dataset. Further, markers with minor allele frequency (MAF) <0.05 and >0.95 were culled. Three lines, CATBIRD, BR35/BR14, and KR12-5001, showing more than 25% missing data were also culled, and a final filtered set of 8,154 SNPs on 187 lines was utilized for further analyses. Marker distribution on the 21 wheat chromosomes, PIC, and LD statistics are shown in Table 1. The least number of markers were distributed on the D genome (11.2%). The highest numbers of markers were found on chromosome 2B (870; 10.7%), followed by chromosome 5B (769; 9.4%) and 3B (762; 8.1%) (Table 1).
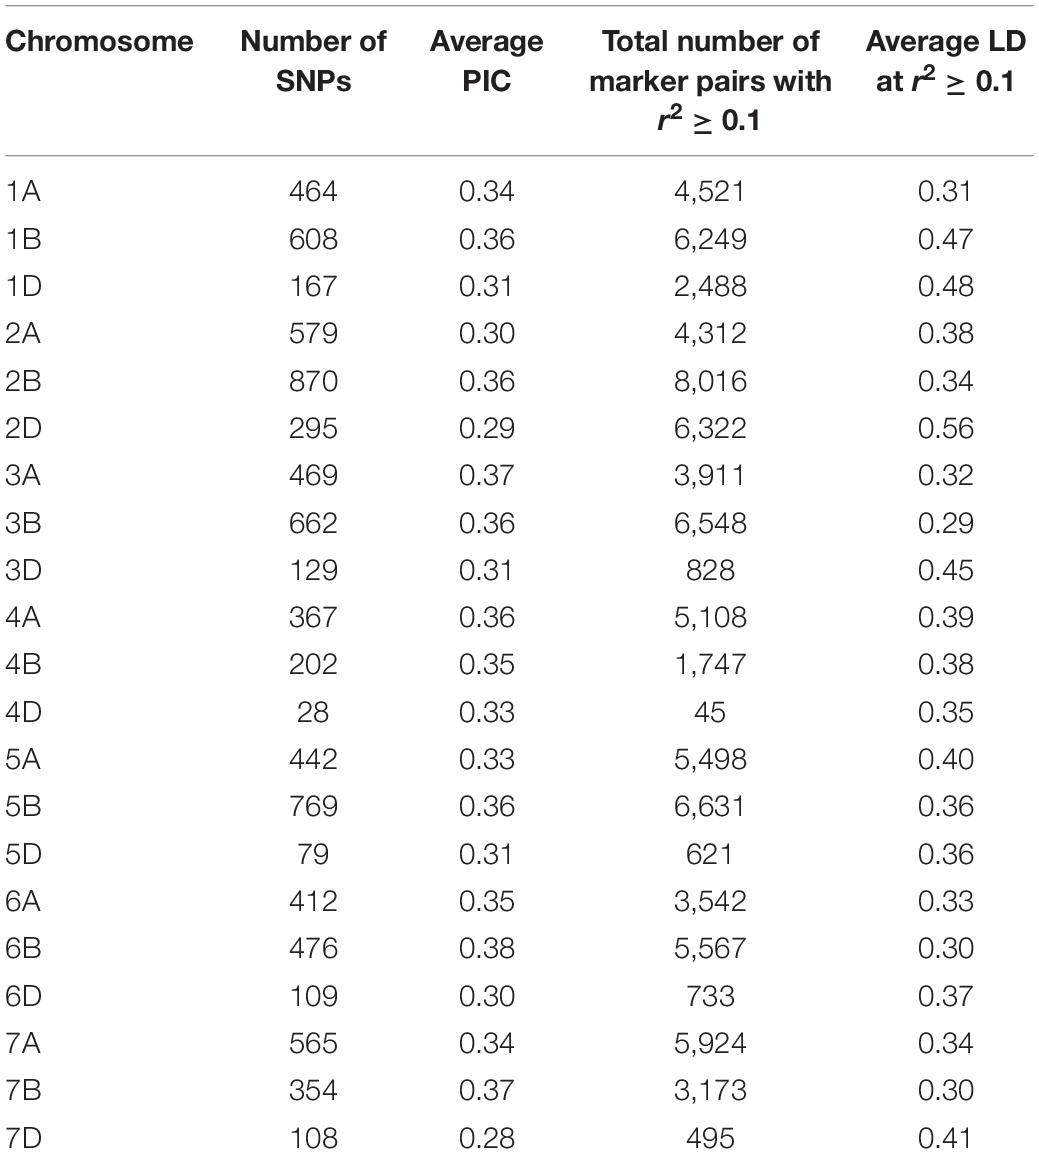
Table 1. Polymorphic information content (PIC) and linkage disequilibrium (LD) estimated for all chromosomes using 8,154 GBS markers.
The average PIC for the 8,154 SNPs was 0.33. Comparison of the average PIC of winter versus spring wheat lines showed that diversity was lower in winter wheat (0.38) compared to spring wheat germplasm (0.41).
Population Structure and Linkage Disequilibrium Decay
Principal component analysis (PCA) revealed three broad groups in the panel, and the first three principal components explained 11.8, 9.9, and 5.5% of the genetic variation, respectively (Figure 3A). Groups 1 and 2 containing Eurasian germplasm with winter and spring wheat lines, respectively, were separated from the group of lines developed by the CIMMYT and CIMMYT-ICARDA-IWWIP program (Group 3). The weighted neighbor-joining (NJ) dendrogram confirmed the three groups obtained in PCA (Figure 3B). Further ΔK vs. K plot, based on results obtained in Bayesian model-based STRUCTURE analysis, showed the highest likelihood at K = 3 (Figure 3C). At K = 3, the three subpopulations corresponded with both PCA and NJ-based groups (Figure 3D).
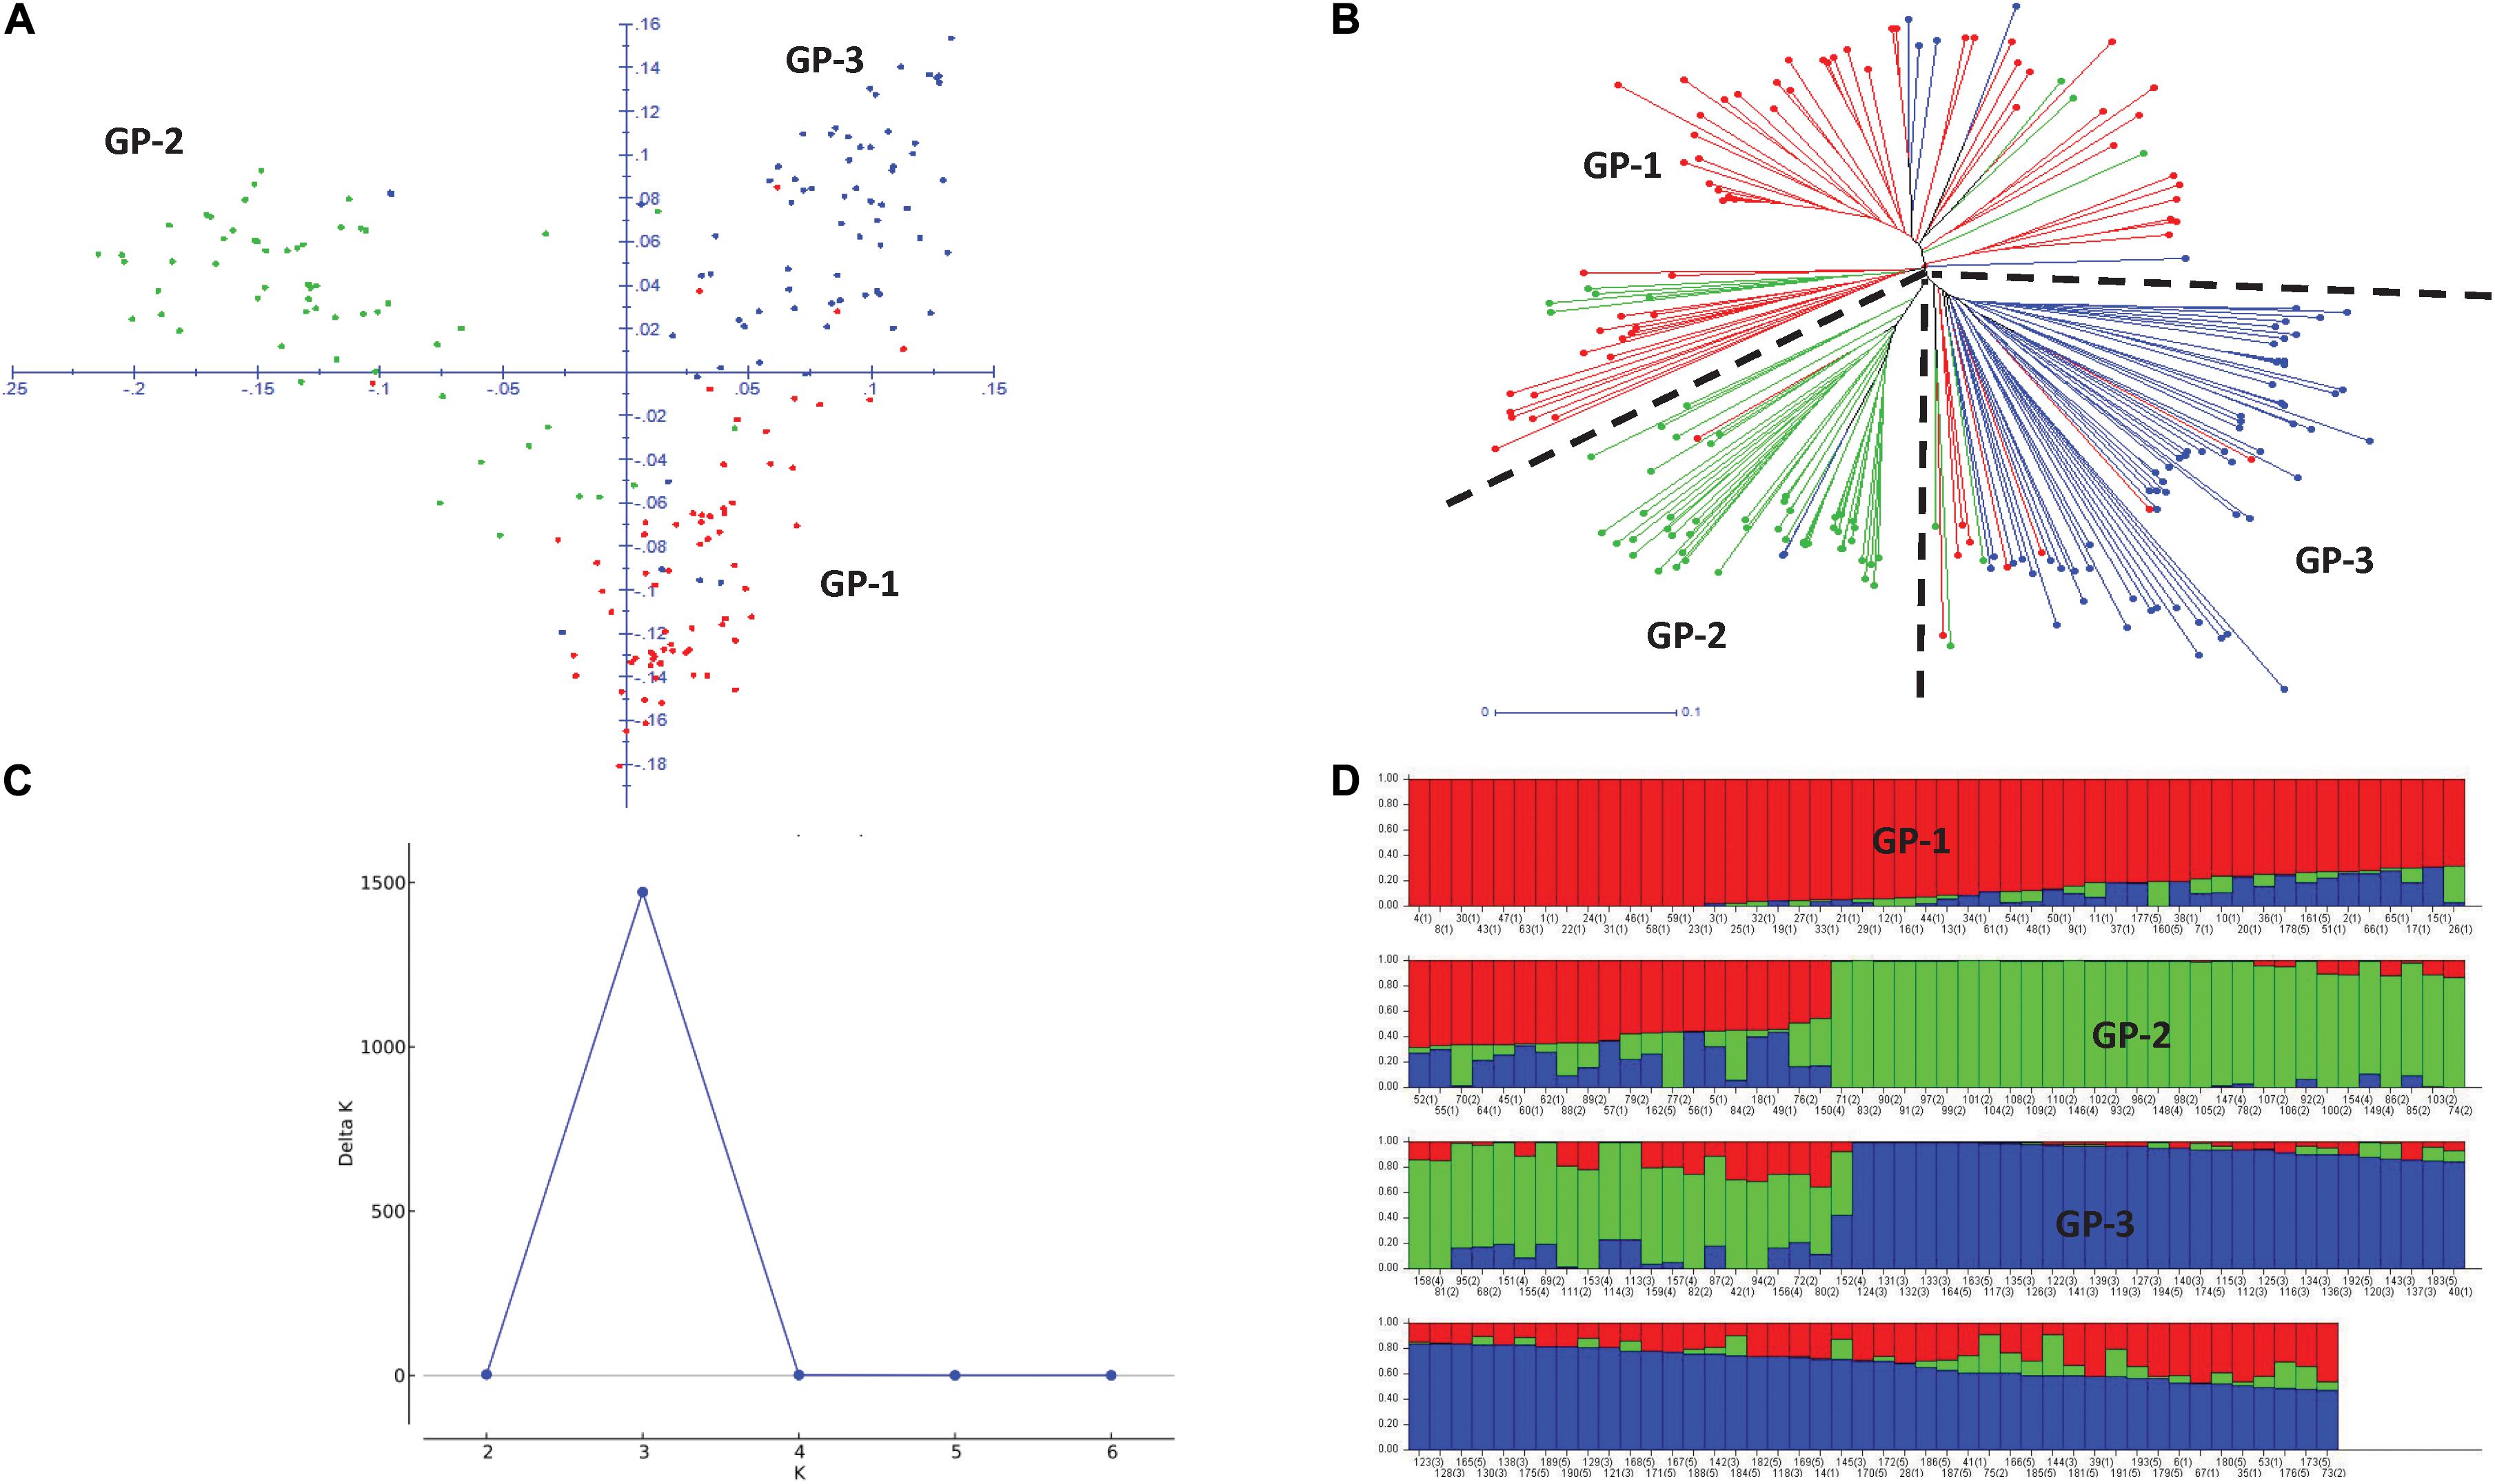
Figure 3. Two-dimensional principal component analysis plot (A) and weighted neighboring-joining dendrogram (B) of panel showing three groups with both analyses. GP1, Winter type from Kazakhstan; GP2, Spring type from Kazakhstan and Russia; GP3, Spring and winter types from the CIMMYT and CIMMYT-ICARDA-IWWIP program. Delta K vs. K plot showing the best K at 3 (C) and bar plot showing subpopulation division at K = 3 (D).
The average LD was highest in the D genome (0.42) and was higher compared to A (0.35) and B (0.34) genomes. Genome-wide LD decay patterns were investigated in the three subpopulations individually and in the whole panel (Supplementary Figure 1). The results revealed that LD decay was faster in the CIMMYT and IWWIP germplasm, i.e., Group 3 (18 Mb at cut off r2 = 0.1) compared to Eurasian lines (30 and 25 Mb in groups 1 and 2, respectively). The LD decayed at 22 Mb in the whole panel (Supplementary Figure 1D).
Marker-Trait Associations
MTA for Resistance to Race 1 and Race 5 at Seedling Stage
Ten SNPs on chromosomes 1B (3), 3B (1), 4B (1), 5A (1), 5B (1), 6A (1), and 7B (2) were associated with resistance to Race 1 of P. tritici-repentis with 7.3–10.5% variation explained (Table 2 and Supplementary Figures 2A,B). The phenotypic mean difference between the alleles for the significant SNPs ranged from 0.2 to 1.3. The SNP identified on chromosome 6A with clone ID 1004240 showed the strongest allele effect followed by SNPs on chromosomes 4B (ID 3958510) and 3B (ID 1147153). Favorable alleles at these loci were present in 5–9% frequencies.
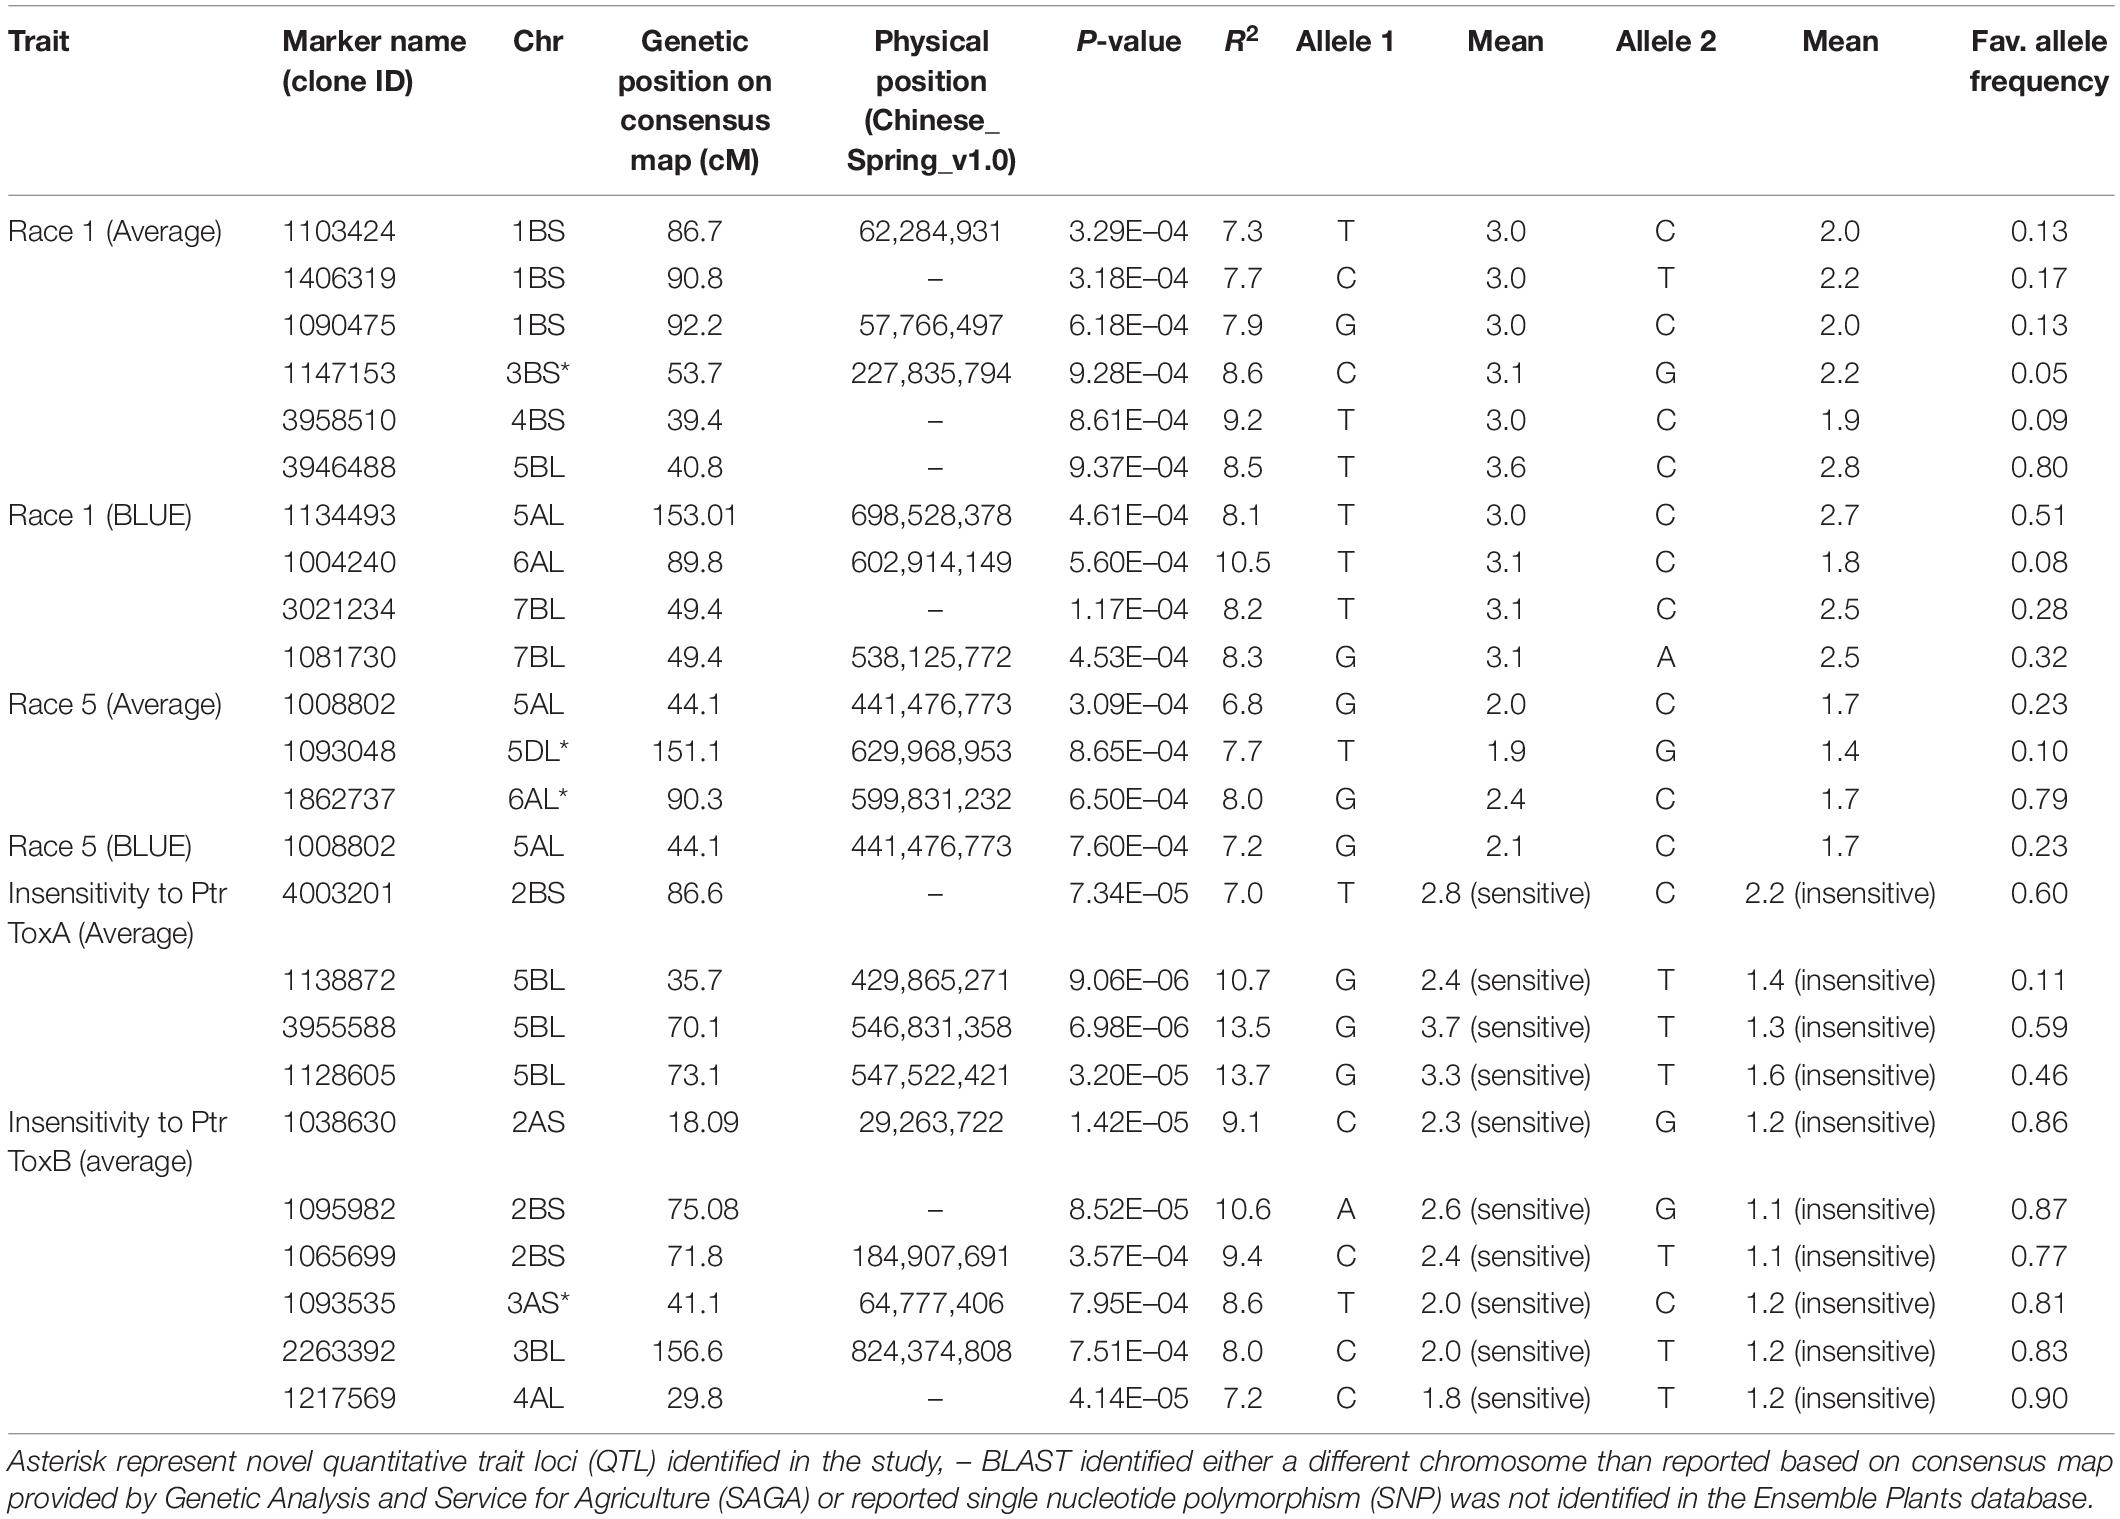
Table 2. Markers associated with resistance to Race 1, Race 5, and insensitivities to Ptr ToxA and Ptr ToxB at seedling stage.
For Race 5, three genomic regions on chromosomes 5A, 5D, and 6A were identified to be associated with percentage variation from 6.8 to 8.0% (Table 2 and Supplementary Figures 2C,D). Compared to associations identified for Race 1, markers associated with Race 5 showed lower phenotypic mean differences between alleles. Interestingly, the genomic region spanning 3 Mb on chromosome 6AL was identified to be associated with resistances to both races, Race 1 and Race 5. This indicates the importance of chromosome 6AL in imparting race-specific resistance to P. tritici-repentis. In silico analysis of the genomic region identified on chromosome 6A revealed two candidate gene hits, TraesCS6A02G37880 and TraesCS6A02G384600 with SNPs 1004240 and 1862737, respectively, both with oxidoreductase activity. Oxidoreductase family proteins are known as important components of pathogen-associated molecular pattern-triggered immunity via production of reactive oxygen species in response to pathogen attack (Heiser and Elstner, 2002). Of the two candidate genes, TraesCS6A02G384600 has been investigated for expression analysis (Expression Atlas4), and it is known to express in outer pericarp layer of developing grain.
Allelic effects of important associations identified for resistance to Races 1 and 5 are shown in Figure 4. Twenty-five tan spot resistant lines have been identified with different allelic combinations for seedling resistance to Race 1 and Race 5 (Supplementary Table 5).
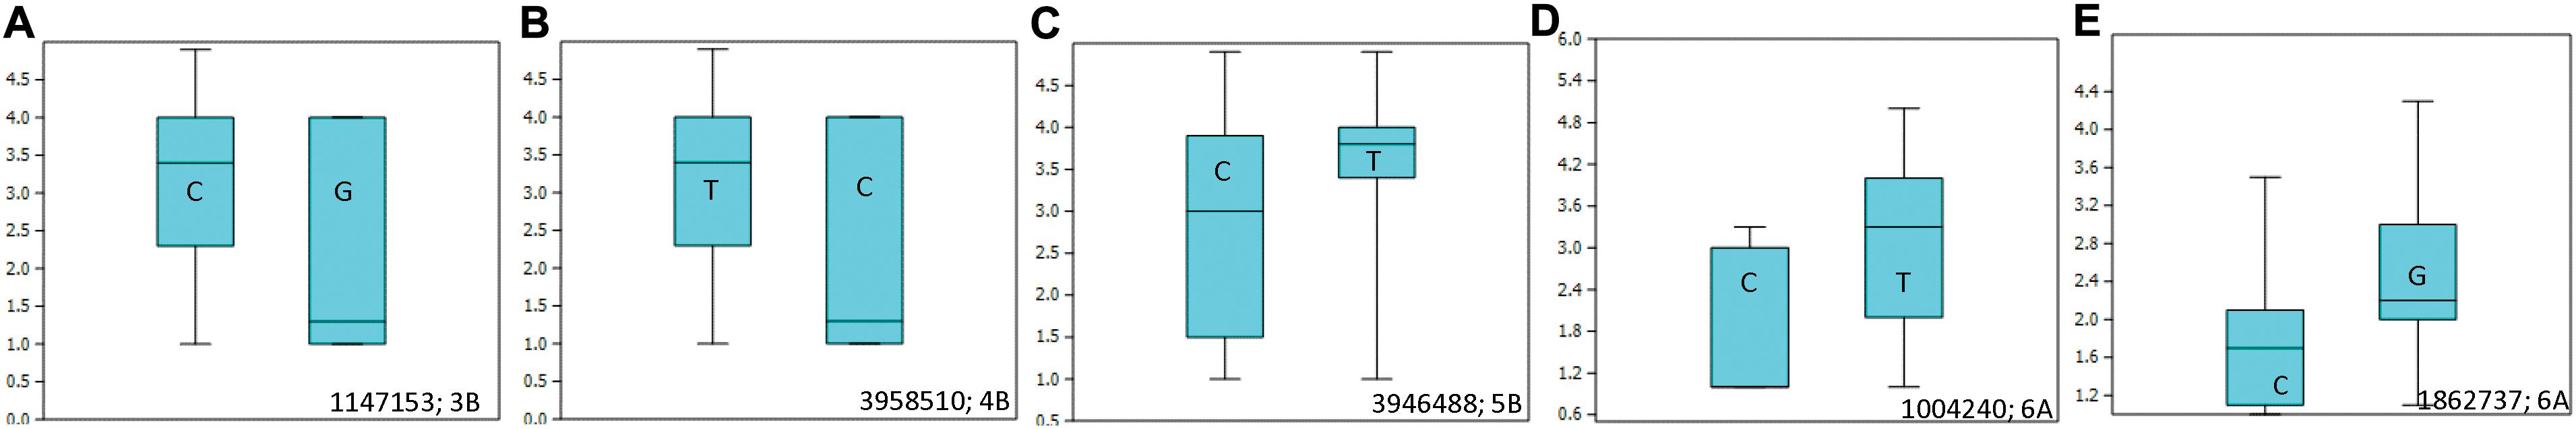
Figure 4. Box plots showing allelic effects of important associations identified for resistance to Race 1 with average (A–C) and best linear unbiased estimator (BLUE) scores (D) and for resistance to Race 5 with average scores (E). The number on the right side below shows the name of the associated marker and chromosome number.
Marker-Trait Associations for Insensitivity to Toxins Ptr ToxA and Ptr ToxB
Four MTA were identified associated with insensitivity to Ptr ToxA on chromosomes 2B (1) and 5B (3) with percentage variation explained by them ranging from 7.0 to 13.7% (Table 2). The phenotypic mean difference between the alleles for the three significant SNPs on chromosome 5B ranged from 1.0 to 2.4, whereas for the SNP on chromosome 2B, the allelic difference in alleles was 0.6. For insensitivity to Ptr ToxB, important loci were identified on chromosomes 2A (1), 2B (2), 3A (1), 3B (1), and 4B (1) with percentage variation from 7.2 to 10.6%. The QTL identified on chromosome 2B related to SNPs 1095982 and 1065699 had the strongest allelic effect among all (Table 2).
Marker-Trait Associations for Area Under Disease Progress Curve Scores From Three Field Experiments
Analysis of AUDPC for two seasons (2016 and 2018) under natural epidemic conditions revealed eight associations on chromosomes 1B (1), 2B (4), 3B (1), 4A (1), and 6B (1) (Table 3). On chromosome 2B, four MTA were identified, which were delineated into two QTL, one between 18.5 and 28.0 cM associated with 2018 AUDPC scores and the second between 86.5 and 89.8 cM associated with 2016 AUDPC scores. The second QTL located 86.5–89.8 cM explained higher (8.7–11.9%) percentage variation compared to the other 2BS QTL (4.0–7.3%). In addition, the association identified on 1B also explained high percentage variation (11.6%). Under artificial inoculation conditions in 2018, two associations were identified on chromosomes 3A (1) and 5B (1), both explaining moderate percentage variation. QQ plots for all traits investigated by GWAS are shown in Supplementary Figure 3.
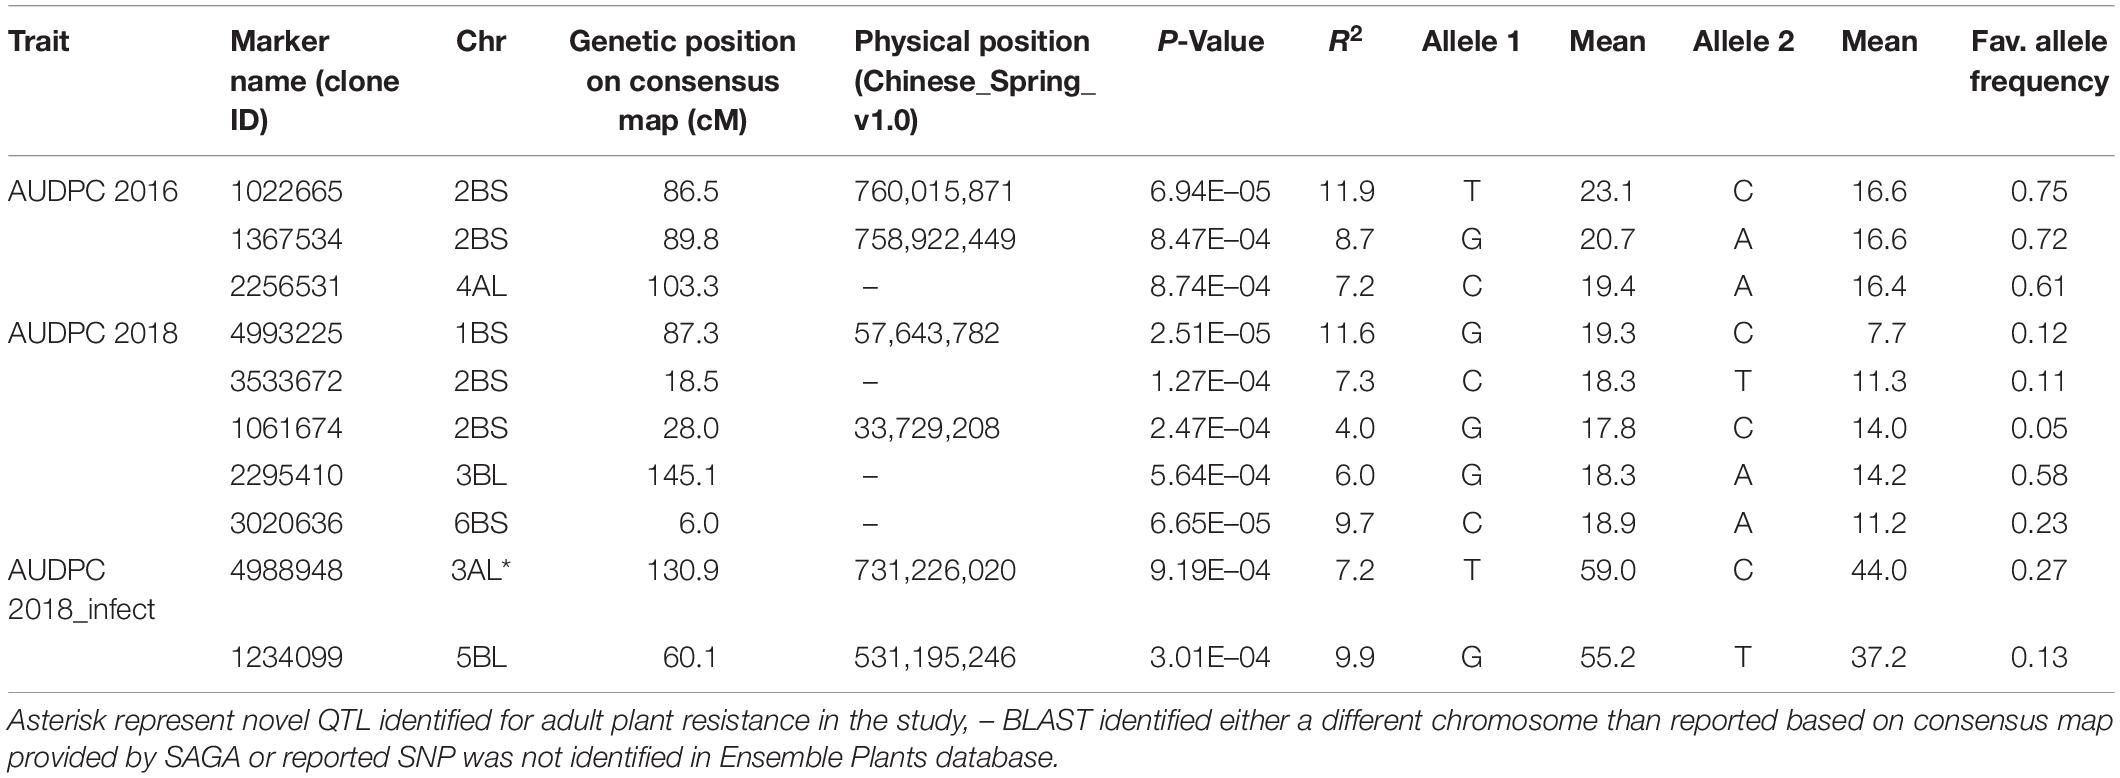
Table 3. Markers associated with area under disease progress curve (AUDPC) scores under natural epidemic conditions in two field seasons (2016 and 2018) and by artificial inoculation in 2018 (AUDPC 2018_infect).
Epistatic Interactions
Two- and three-locus interactions were estimated among associated loci, and among associated and genome wide loci (Figure 5, Supplementary Table 6, and Supplementary Figures 4–6). For Race 1 and Race 5, associated loci showed epistatic interactions among them with R2 explained from 10.7 to 18.7% for Race 1 and 16.0–21.1% for Race 5, respectively (Figure 5). The R2 explained by marker combinations was higher than individual markers for both Race 1 and Race 5. Further, the three-marker combination resulted in the highest additive interactions explained by R2 of 18.7 and 21.1% for Race 1 and Race 5, respectively. For other traits, no significant interactions were observed among associated loci. However, significant interactions among unassociated genome-wide markers were observed for all traits except insensitivity to Ptr ToxB (Supplementary Figures 4–6).
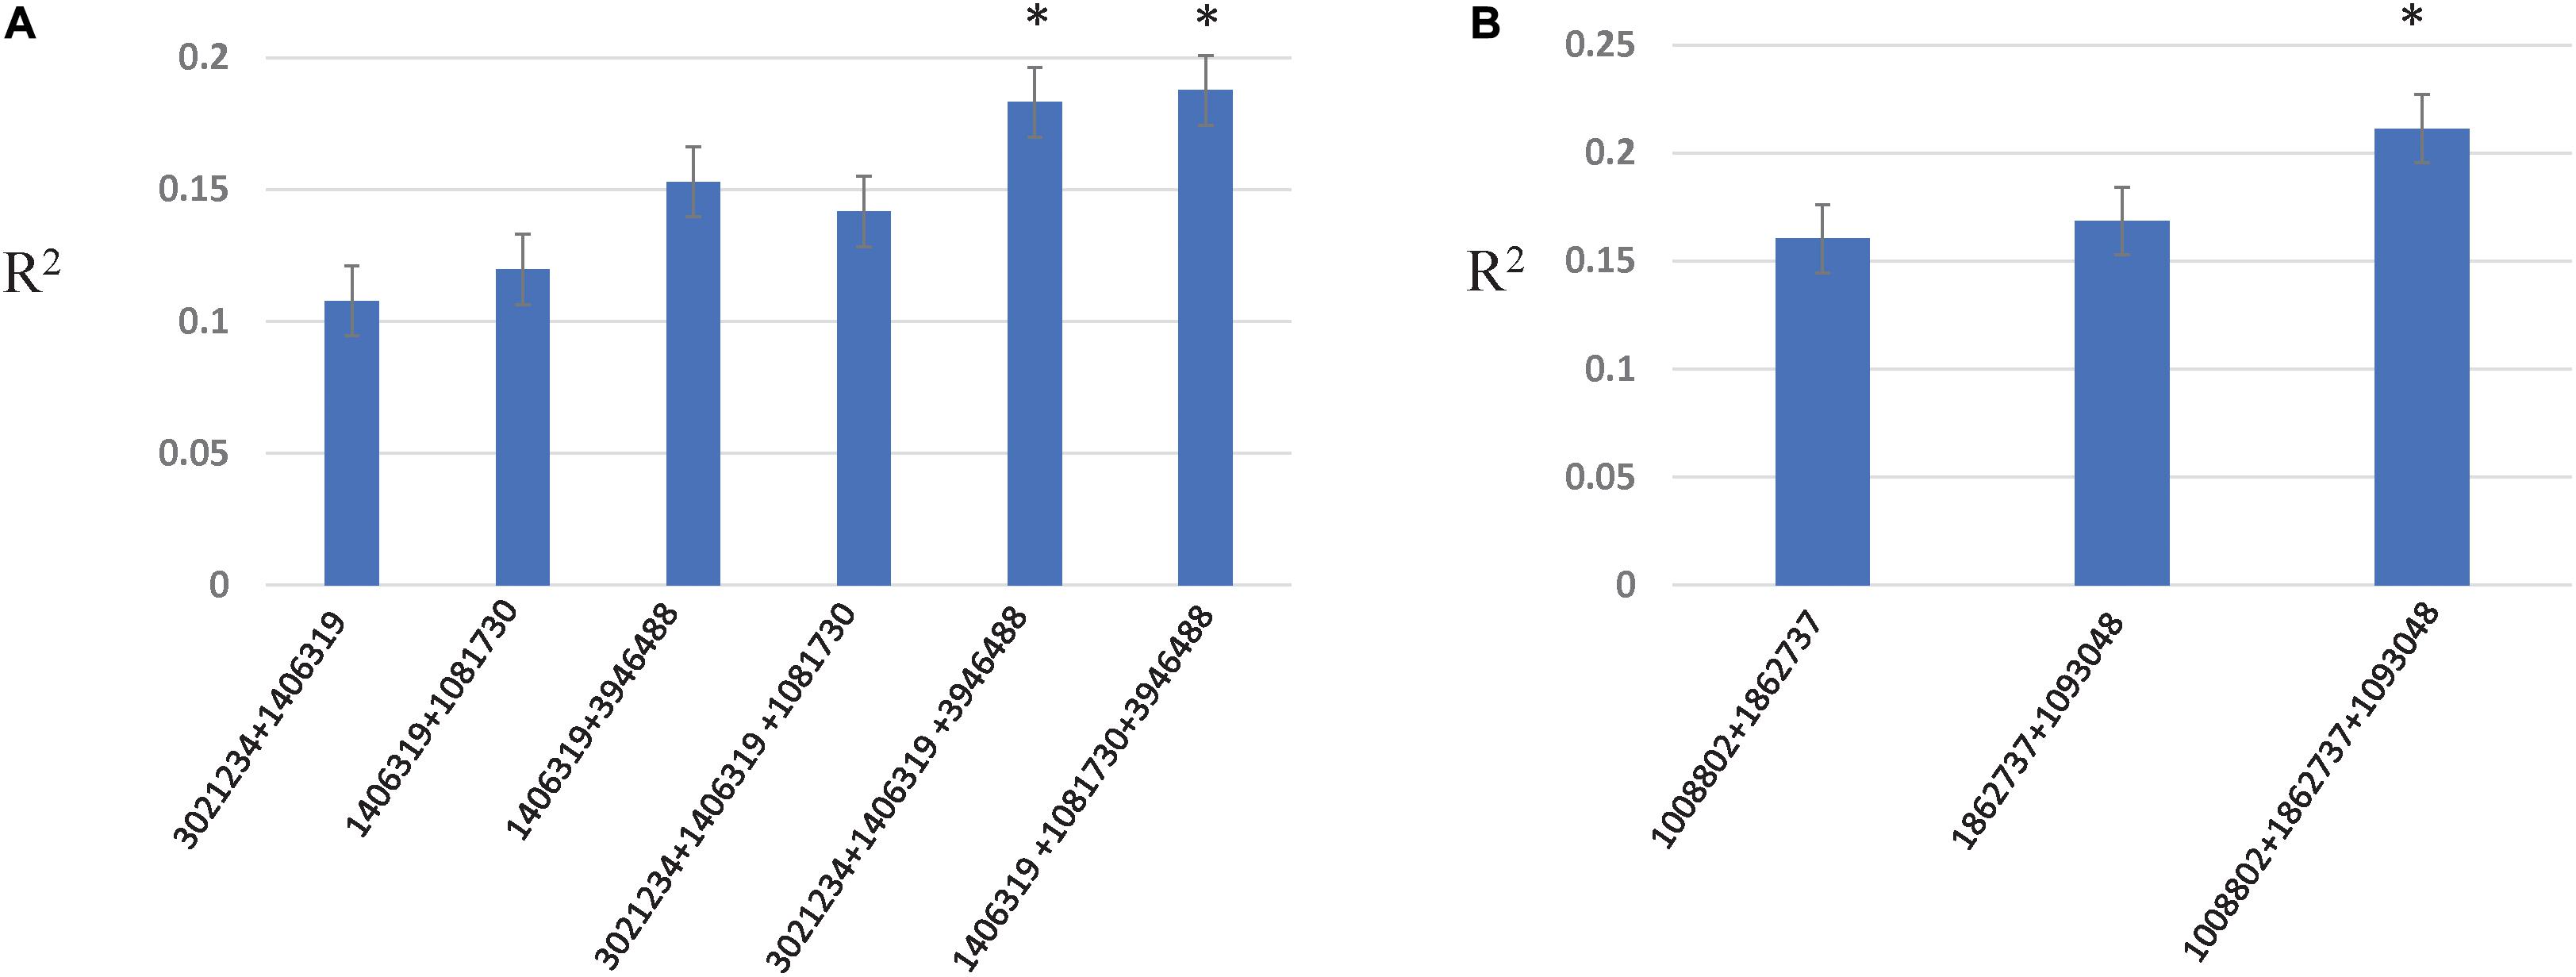
Figure 5. Additive epistatic interactions among associated loci for resistance to Race 1 (A) and Race 5 (B). The X-axis represents two- and three-marker combinations interacting epistatically. The Y-axis represents the percentage variation as R2 explained by marker combinations. The asterisk represents the marker combinations that resulted in the highest R2.
Discussion
Tan spot, caused by P. tritici-repentis, is a serious foliar disease affecting wheat production in Kazakhstan, especially in the northern region of the country where farmers lose anywhere from 10% to as much as 50% of their crop due to this disease (Koyshibaev, 2018). It has been predicted that outbreaks of this disease in Kazakhstan are likely to increase in severity and frequency due to an increase in mean annual temperatures and altered precipitation patterns (Salnikov et al., 2015). Characterization of the current germplasm for resistance to prominent races of the pathogen in Kazakhstan has therefore become more imperative than ever before (Kokhmetova et al., 2018, 2019). Here, we evaluated registered cultivars and lines from Kazakhstan and Russia representing promising spring and winter wheat germplasm along with lines released by the CIMMYT and CIMMYT-ICARDA-IWWIP program.
Most wheat entries evaluated in the study showed a susceptible response to Race 1 (72.6%), whereas for Race 5, 67.5% of lines were resistant. It is a common observation in most germplasm collections (Liu et al., 2015; Halder et al., 2019), and our results reinforce that finding resistance against Ptr Race 1 is very challenging compared to other races. Race 1 is the most prevalent worldwide (Ali and Francl, 2003; Abdullah et al., 2017) and is reported to contain the virulence of Races 2 and 3, making it more aggressive than other races (Lamari et al., 2003). Nevertheless, 25 lines (13%) resistant to both races (Race 1 and Race 5) have been identified in the present study. Regarding toxin sensitivities of the genotypes, a low but positive correlation was observed between Ptr ToxA sensitivity of the genotypes and disease susceptibility in the field, which is in contrast with the observations made by Friesen et al. (2003); Faris and Friesen (2005), Noriel et al. (2011), and Halder et al. (2019). We did not obtain any significant correlations between days to heading and plant height with Ptr resistance in field, suggesting that none of these phenological traits significantly affected tan spot resistance in the germplasm investigated. Li et al. (2011) and Pandey et al. (2018) obtained similar results, i.e., no association of tan spot resistance with phenological traits. Many previous studies have detected a negative correlation between heading date or plant height with disease resistance (Srinivasachary et al., 2009; Mao et al., 2010; Kollers et al., 2013a,b), including tan spot resistance (Kollers et al., 2014). The broad sense heritability (h2) estimates for tan spot across years and different infectious background were high (from 0.83 to 0.91) indicating that resistance to tan spot can be improved by selection (Supplementary Table 3). Similar heritability estimates for tan spot disease reaction have been reported by Singh et al. (2016, 2019). Heritability ranged from 0.70 to 0.96 for DH and was 0.98 for PH in different years. Jamil et al. (2019) reported heritability estimates for these traits in a similar range.
The mean PIC of the panel based on 8,154 SNPs was 0.33, which is in the same range as observed recently in wheat cultivars from China (Gao et al., 2016) and higher than those obtained in United States wheat cultivars (Chao et al., 2009, 2010) or other germplasm sets (Somers et al., 2007; Alemu et al., 2020). The higher diversity can be explained by the diverse origin of the lines included in the panel such as those from CIMMYT. CIMMYT germplasm has shown substantial genetic diversity in previous studies (Dreisigacker et al., 2005; Reif et al., 2005; Warburton et al., 2006; Sehgal et al., 2015). Population structure through PCA, NJ, and STRUCTURE analyses of the panel revealed a clear distinction of spring and winter wheat types from Kazakhstan. Chao et al. (2010) also obtained distinct groups of spring and winter wheat from the US. A third group of spring and winter wheat was exclusive to lines released by the CIMMYT and IWWIP program, thus clearly separating CIMMYT germplasm from Eurasian lines. The panel, therefore, shows a moderate population structure along with high diversity rendering it fit for trait dissection using the GWAS approach.
The pattern of LD across the three genomes revealed the highest LD in the D genome followed by the A and B genomes. This pattern is common in wheat and reflects the recombination history of the three genomes and population bottleneck accompanying the origin of hexaploid wheat (Akhunov et al., 2010; Chao et al., 2010). Genome-wide LD decay was observed at 22 Mb in the whole panel, which is in the same range as reported recently in a CIMMYT spring wheat collection (Jamil et al., 2019) and in a composite collection made of CIMMYT and South Asian genotypes (Phuke et al., 2020). It was not possible to compare the LD decay of the panel with other germplasms because LD decay has been reported as a measure of genetic distance (in cM) in previous studies (Somers et al., 2007; Benson et al., 2012; Chen et al., 2012; Würschum et al., 2013; Edae et al., 2014; Zegeye et al., 2014; Sehgal et al., 2017; Erginbas-Orakci et al., 2018). A comparison of LD decay among three subpopulations of the present study revealed a faster decay in the subpopulation composed by CIMMYT and IWWIP lines compared to the two subpopulations of Eurasian lines, which is attributed to higher diversity of CIMMYT and IWWIP germplasm vis-à-vis Eurasian germplasm. Breeders at CIMMYT have successfully broadened the genetic diversity of the elite germplasm through incorporation of primary synthetics into the breeding programs and consistent introductions of additional materials from all over the world (Sehgal et al., 2015). Similarly, the pedigree of IWWIP lines incorporates diverse CIMMYT parents and a wide range of genetically un-related winter wheat from Turkey and Iran, Russia, Ukraine, Romania, Bulgaria, Hungary, and United States winter wheat.
Genome-wide association study identified a total of 34 MTA for tan spot resistance. Of all the MTA identified for seedling resistance to Races 1 and 5, the genomic region on chromosome 6AL showed the biggest phenotypic effect. In fact, two MTA were identified within a 3-Mb genomic region on 6AL for resistance to both Race 1 (Clone ID 1004240) and 5 (Clone ID 1862737) (Table 2). The favorable allele of the SNP with Clone ID 1004240 was predominantly present in CIMMYT lines and three Kazakhstani winter wheat types (Naz/GF55-5, 428 g/MK-122A-2 and Almaly/Obri), while the favorable allele of the SNP with Clone ID 1862737 was predominant in Kazakhstani winter and spring wheat lines. Singh et al. (2016) reported two QTL on 6AL (6AL1 and 6AL2) for tan spot resistance in CIMMYT germplasm for resistance to Race 1, and the SNP with clone ID 1004240 represents 6AL2 QTL. The allelic effect obtained by this SNP is, however, three times larger than reported by Singh et al. (2016). The second marker on chromosome 6AL (Clone ID 1862737) represents a novel QTL for resistance to Race 5 because the only QTL reported on 6A for resistance to Race 5 (Gurung et al., 2014) is on 6AS. For resistance to Race 1, MTA on chromosomes 4BS and 3BS also showed strong effects. Halder et al. (2019) recently reported a novel QTL on 4BS for resistance to Race 1 in the United Kingdom Watkins core collection, and the associated marker identified here on chromosome 4BS corresponds to this QTL. No gene or QTL has so far been reported on chromosome 3BS for resistance to Race 1. Hence, MTA obtained on chromosome 3BS is likely to be novel.
The collection investigated was comprised of 12% spring wheat lines distributed by CIMMYT and evaluated to be resistant to both Septoria tritici blotch and tan spot. In CIMMYT’s germplasm, a large QTL on chromosome 1BS (∼19 cM based on consensus map and ∼130 Mb based on physical position) has contributed significantly for resistance to Race 1, which was suggested due to the 1B.1R translocation harboring several resistance genes including Lr26, Yr9, Sr31, Pm8, and others (Singh et al., 2016; Juliana et al., 2018). The three MTA identified here on chromosome 1BS covered ∼5 Mb on reference genome and were in the middle of 1BS QTL. Similarly, MTA identified on other chromosomes for resistance to Race 1 and Race 5 coincided with known QTL except the one on chromosome 5DL for resistance to Race 5 (Faris et al., 2013; Singh et al., 2016; Hu et al., 2019). The only reported QTL on chromosome 5DL is for resistance to Race 1 (Faris et al., 2012). Therefore, the associated marker identified on chromosome 5DL for resistance to Race 5 represents a new QTL.
Isolates of Race 1 and Race 5 are known to produce toxins Ptr ToxA and Ptr ToxB, respectively. Qualitative resistance in the host has been reported to be manifested by two toxin insensitivity genes on chromosomes 5BL (tsn1) and 2BS (tsc2), conferring resistance against Ptr ToxA and Ptr ToxB, respectively (Singh et al., 2010; Faris et al., 2013). We obtained three MTA on chromosome 5BL associated with insensitivity to Ptr Tox A, which were within the same genomic region as the tsn1 gene (Faris et al., 2010). Of the three, two SNPs (Clone ID 3955588 and 1128605) had higher allelic effects on toxin insensitivity compared to the third SNP (Clone ID 1138872). An additional locus for insensitivity to Ptr ToxA was identified on chromosome 2BS, which coincided with previous QTL reported for resistance to Race 1 (Gurung et al., 2014). For insensitivity to Ptr ToxB, important associations were obtained on chromosomes 2AS, 2BS, 3AS, 3BL, and 4AL. Of all associations, two SNPs (clone IDs 1095982 and 1065699) on 2BS showed the strongest allelic effect and were in the same genomic region as the cataloged tsc2 gene. The SNP on chromosome 2AS was the second most important genomic region with a strong allelic effect on insensitivity to Ptr ToxB. Previous studies till date have reported only minor effect QTLs on 2AS for insensitivity to Ptr Tox B and/or resistance to Race 5 (Friesen and Faris, 2004; Chu et al., 2008). On chromosome 3AS, tsr4 has been mapped, and the associated marker obtained here on chromosome 3AS is around 70 cM from tsr4 locus and hence unlikely to be in the location of tsr4 gene. The known genes on chromosome 3BL are tsn2 and tsn5 that confer resistance to the necrosis induced by Race 3 and Race 5, respectively (Singh et al., 2008). The locus obtained on chromosome 3BL is of moderate effect and corresponds to minor QTL reported by Faris and Friesen (2005) and Chu et al. (2010) on the same chromosome. The locus identified on chromosome 4AL also represents another minor effect QTL as also previously reported for resistance to Race 5 (Friesen and Faris, 2004).
Regarding MTA identified for AUDPC scores, most associations except the one on chromosome 3AL were identified within 2–3 Mb genomic region of the markers associated with seedling resistance to Races 1 and 5 or insensitivities to toxins Ptr ToxA and Ptr ToxB in the present study, thus confirming to be major genes (tsn 1, tsc2). Three associations on chromosomes 2BS, 4AL, and 6BS overlap with minor QTL reported for tan spot resistance in previous studies (Gurung et al., 2011; Halder et al., 2019). The QTL found on chromosome 3AL is likely new for adult plant resistance, which was identified only at adult plant stage in the present study.
The role of epistasis in the genetic architecture of disease resistance has been investigated for stem rust resistance and stripe rust resistance in wheat using both biparental and GWAS designs (Kolmer et al., 2011; Yu et al., 2011). However, investigations on the contribution of epistatic interactions to the genetic architecture of tan spot resistance have been rarely investigated (Singh et al., 2019). Singh et al. (2019) revealed epistatic interactions between QTL on chromosomes 1B and 5B and between QTL on chromosomes 1A and 6A for seedling resistance to Race 1 in a biparental population, however, with small effects. We confirm significant epistatic interactions between associated loci on chromosomes 1B and 5B in the present study with even larger percentage variation explained (up to 18.7%). In addition, we obtained significantly higher interactions between associated loci on chromosomes 1B and 7B with a percent variation explained as large as 14.1% for resistance to Race 1. The associated locus on 7B (SNP 1081730) was also involved in genome-wide interactions with other loci on chromosomes 7A, 2D, and 3B, and contributed to additional 4% variation. For seedling resistance to Race 5, associated loci on chromosomes 5A, 5D, and 6A contributed to additive epistatic interactions of 21.1%. These results indicated that both additive and epistatic effects are important for tan spot resistance to both races, Race 1 and Race 5. The results also suggest that three marker combinations identified for resistance to Race 1 and Race 5 can be used efficiently in marker-assisted selection.
Conclusion
Our results suggest the existence of valuable resistant alleles on chromosomes 3AS, 3AL, 3BS, and 6AL for tan spot resistance in the investigated germplasm in addition to known genes tsn1 and tsc2. The study therefore confirms that resistance to tan spot in the collection is attributed to both the known toxin insensitivity genes with major effects as well as broad-spectrum and race-non-specific genes, which have minor effects. Twenty-five tan spot-resistant lines have been identified with different allelic combinations for resistance to Race 1 and Race 5 for future variety release. The candidate genes identified on 6A are important targets for future validation studies for tan spot resistance.
Data Availability Statement
The genotyping data is available at the CIMMYT Research Data and Software Repository Network: https://hdl.handle.net/11529/10548482.
Author Contributions
AK conceived the manuscript and designed the research. DS and AK analyzed the data and wrote the manuscript. SA, IL, MA, and MK generated the phenotypic data. DS and SD generated the allele called GBS marker data. All authors reviewed the manuscript.
Conflict of Interest
The authors declare that the research was conducted in the absence of any commercial or financial relationships that could be construed as a potential conflict of interest.
Funding
This work was supported by the Kazakhstan Ministry of Education and Sciences, project #AP05132540.
Acknowledgments
We thank Z. Sapakhova and the staff of Laboratory Genetics and Breeding, Institute of Plant Biology and Biotechnology for their technical assistance.
Supplementary Material
The Supplementary Material for this article can be found online at: https://www.frontiersin.org/articles/10.3389/fgene.2020.581214/full#supplementary-material
Supplementary Figure 1 | Linkage disequilibrium decay plot for the three subpopulations; CIMMYT and IWWIP lines (A), Spring wheat from Kazakhstan and Russia (B), Winter wheat from Kazakhstan (C) and across all panel (D). X-axis represents physical distance in Mb; Y-axis represents correlation coefficient.
Supplementary Figure 2 | Manhattan plots showing significant markers associated with BLUE (left) and average (right) scores for resistance to Race 1 (A,B) and Race 5 (C,D), respectively.
Supplementary Figure 3 | QQ plots of all traits used in GWAS analysis with mixed linear model by using first three principal components as a fixed variate and kinship as a random variate.
Supplementary Figure 4 | Genome wide epistatic interactions for resistance to Race 1 (A), Race 5 (B), and sensitivity to Ptr Tox A (C). For sensitivity to Ptr ToxB, no significant interactions were observed.
Supplementary Figure 5 | Genome wide epistatic interactions for AUDPC scores in field seasons in 2016 (A) and 2018 (B).
Supplementary Figure 6 | Genome wide epistatic interactions for AUDPC 2018_infect; 1 associated SNP on 3A showed genome wide and explained 5.5%.
Supplementary Table 1 | Cultivars and breeding lines used in the present study.
Supplementary Table 2 | Analysis of variance for tan spot (TS) disease scores for resistance to Race 1 and Race 5 and distribution of tan spot score in checks and the panel.
Supplementary Table 3 | Analysis of variance (ANOVA) for tan spot severity and phenological traits under natural conditions and under artificial inoculation conditions and summary statistics.
Supplementary Table 4 | Correlations of days to heading (DH) and plant height (PH) with AUDPC scores in field seasons.
Supplementary Table 5 | Kazakhstani and Russian entries with resistances to Race 1 and Race 5 with best allele combinations.
Supplementary Table 6 | Epistatic interactions among associated loci for tan spot resistance.
Footnotes
- ^ https://plants.ensembl.org/Triticum_aestivum/Info/Index
- ^ http://taylor0.biology.ucla.edu/structureHarvester/
- ^ https://darwin.cirad.fr/product.php
- ^ https://www.ebi.ac.uk/gxa/home
References
Abdullah, S., Sehgal, S. K., Jin, Y., Turnipseed, B., and Ali, S. (2017). Insights into tan spot and stem rust resistance and susceptibility by studying the pre-green revolution global collection of wheat. Plant Pathol J. 33, 125–132. doi: 10.5423/ppj.oa.07.2016.0157
Abeysekara, N. S., Friesen, T. L., Liu, Z., McClean, P. E., and Faris, J. D. (2010). Marker development and saturation mapping of the tan spot Ptr ToxB sensitivity locus Tsc2 in hexaploid wheat. Plant Gen. 3, 179–189.
Akhunov, E. D., Akhunova, A. R., Anderson, O. D., Anderson, J. A., Blake, N., Clegg, M. T., et al. (2010). Nucleotide diversity maps reveal variation in diversity among wheat genomes and chromosomes. BMC Genomics 11:702. doi: 10.1186/1471-2164-11-702
Alemu, A., Feyissa, T., Letta, T., and Abeyo, B. (2020). Genetic diversity and population structure analysis based on the high-density SNP markers in Ethiopian durum wheat (Triticum turgidum ssp. durum). BMC Genet. 21:18. doi: 10.1186/s12863-020-0825-x
Ali, S., and Francl, L. J. (2001). Recovery of Pyrenophora tritici-repentis from barley and reaction of 12 cultivars to five Races and two host-specific toxins. Plant Dis. 85, 580–584. doi: 10.1094/pdis.2001.85.6.580
Ali, S., and Francl, L. J. (2002). A new race of Pyrenophora tritici-repentis from Brazil. Plant Dis. 86:1050. doi: 10.1094/pdis.2002.86.9.1050c
Ali, S., and Francl, L. J. (2003). Population Race structure of Pyrenophora tritici-repentis prevalent on wheat and non-cereal grasses in the Great Plains. Plant Dis. 87, 418–422. doi: 10.1094/pdis.2003.87.4.418
Anderson, J. A., Effertz, R. J., Faris, J. D., Francl, L. J., Meinhardt, S. W., and Gill, B. S. (1999). Genetic analysis of sensitivity to a Pyrenophora tritici-repentis necrosis inducing toxin in durum and common wheat. Phytopathology 89, 293–297. doi: 10.1094/phyto.1999.89.4.293
Bajgain, P., Rouse, M. N., Tsilo, T. J., Macharia, G. K., Bhavani, S., Jin, Y., et al. (2016). Nested association mapping of stem rust resistance in wheat using genotyping by sequencing. PLoS One 11:e0155760. doi: 10.1371/journal.pone.0155760
Benson, J., Brown-Guedira, G., Murphy, J. P., and Sneller, C. (2012). Population structure, linkage disequilibrium, and genetic diversity in soft winter wheat enriched for fusarium head blight resistance. Plant Genome 5, 71–80. doi: 10.3835/plantgenome2011.11.0027
Botstein, D., White, R. L., Skolnick, M., and Davis, R. W. (1980). Construction of a genetic linkage map in man using restriction fragment length polymorphisms. Am. J. Hum. Genet. 32, 314–331.
Bradbury, P. J., Zhang, Z., Kroon, D. E., Casstevens, T. M., Ramdoss, Y., and Buckler, E. S. (2007). TASSEL: software for association mapping of complex traits in diverse samples. Bioinformatics 23, 2633–2635. doi: 10.1093/bioinformatics/btm308
Breseghello, F., and Sorrells, M. E. (2006). Association mapping of kernel size and milling quality in wheat (Triticum aestivum L.) cultivars. Genetics 172, 1165–1177. doi: 10.1534/genetics.105.044586
Chao, S., Dubcovsky, J., Dvorak, J., Luo, M. C., Baenziger, S. P., Matnyazov, R., et al. (2010). Population - and genome-specific patterns of linkage disequilibrium and SNP variation in spring and winter wheat (Triticum aestivum L). BMC Genomics 11:727. doi: 10.1186/1471-2164-11-727
Chao, S., Zhang, W., Akhunov, E., Sherman, J., Ma, Y., Luo, M. C., et al. (2009). Analysis of gene-derived SNP marker polymorphism in US wheat (Triticum aestivum L) cultivars. Mol. Breed. 23, 23–33. doi: 10.1007/s11032-008-9210-6
Chen, X., Min, D., Yasir, T. A., and Hu, Y. G. (2012). Genetic diversity, population structure and linkage disequilibrium in elite Chinese winter wheat investigated with SSR markers. PLoS One 7:e44510. doi: 10.1371/journal.pone.0044510
Chu, C. G., Chao, S., Friesen, T. L., Faris, J. D., Zhong, S., and Xu, S. S. (2010). Identification of novel tan spot resistance QTLs using and SSR-based linkage map of tetraploid wheat. Mol. Breed. 25, 327–338. doi: 10.1007/s11032-009-9335-2
Chu, C. G., Friesen, T. L., Faris, J. D., and Xu, S. S. (2008). Evaluation of seedling resistance to tan spot and Stagnosphora nodorum blotch in tetraploid wheat. Crop Sci. 48, 1107–1118. doi: 10.2135/cropsci2007.09.0516
Das, M. K., Rajaram, S., Mundt, C. C., and Kronstad, W. E. (1992). Inheritance of slow rusting resistance to leaf rust in wheat. Crop Sci. 32, 1452–1456. doi: 10.2135/cropsci1992.0011183x003200060028x
Dospekhov, B. A. (1985). Methods of Field Experience (With the Basics of Statistical Processing of Research Results), 5th Edn. Kovalivka: Kolos.
Dreisigacker, S., Sehgal, D., Reyes Jaimez, A. E., Luna Garrido, B., Muñoz Zavala, S., Núñez Ríos, C., et al. (2016). Laboratory Protocols and Applications to Wheat Breeding, Version 1, Mexico, DF.
Dreisigacker, S., Shewayrga, H., Crossa, J., Arief, V. N., DeLacy, I. H., Singh, R. P., et al. (2012). Genetic structures of the CIMMYT international yield trial targeted to irrigated environments. Mol. Breed. 29, 529–541. doi: 10.1007/s11032-011-9569-7
Dreisigacker, S., Zhang, P., Warburton, M. L., Skovmand, B., Hoisington, D., and Melchinger, A. E. (2005). Genetic diversity among and within CIMMYT hexaploid wheat landrace accessions and implications for plant genetic resource management. Crop Sci. 45, 653–661. doi: 10.2135/cropsci2005.0653
Duveiller, E., Kandel, Y. R., Sharma, R. C., and Shrestha, S. M. (2005). Epidemiology of foliar blights (spot blotch and tan spot) of wheat in the plains bordering the Himalayas. Phytopathology 95, 248–256. doi: 10.1094/phyto-95-0248
Edae, E. A., Byrne, P. F., Haley, S. D., Lopes, M. S., and Reynolds, M. P. (2014). Genome-wide association mapping of yield and yield components of spring wheat under contrasting moisture regimes. Theor. Appl. Genet. 127, 791–807. doi: 10.1007/s00122-013-2257-8
Effertz, R. J., Meinhardt, S. W., Anderson, J. A., Jordahl, J. G., and Francl, L. J. (2002). Identification of a chlorosis-inducing toxin from Pyrenophora tritici-repentis and the chromosomal location of an insensitivity locus in wheat. Phytopathology 92, 527–533. doi: 10.1094/phyto.2002.92.5.527
Elbasyoni, I. S., El-Orabey, W. M., Baenziger, P. S., and Eskridge, K. M. (2017). Association mapping for leaf and stem rust resistance using worldwide spring wheat collection. AJÎB 4, 1–25. doi: 10.9734/ajob/2017/38120
Erginbas-Orakci, G., Sehgal, D., Sohail, Q., Ogbonnaya, F., Dreisigacker, S., Pariyar, S. R., et al. (2018). Identification of novel quantitative trait loci linked to crown rot resistance in spring wheat. Int. J. Mol. Sci. 19:2666. doi: 10.3390/ijms19092666
Faris, J. D., Abeysekara, N. S., McClean, P. E., Xu, S. S., and Friesen, L. T. (2012). Tan spot susceptibility governed by the Tsn1 locus and Race-nonspecific resistance quantitative trait loci in a population derived from the wheat lines Salamouni and Katepwa. Mol. Breed. 30, 1669–1678. doi: 10.1007/s11032-012-9750-7
Faris, J. D., Anderson, J. A., Francl, L. J., and Jordahl, J. G. (1996). Chromosomal location of a gene conditioning insensitivity in wheat to a necrosis-inducing culture filtrate from Pyrenophora tritici-repentis. Phytopathology 86, 459–463. doi: 10.1094/phyto-86-459
Faris, J. D., and Friesen, T. L. (2005). Identification of quantitative trait loci for Race-nonspecific resistance to tan spot in wheat. Theor. Appl. Genet. 111, 386–392. doi: 10.1007/s00122-005-2033-5
Faris, J. D., Liu, Z., and Xu, S. S. (2013). Genetics of tan spot resistance in wheat. Theor. Appl. Genet. 126, 2197–2217. doi: 10.1007/s00122-013-2157-y
Faris, J. D., Zhang, Z., Lu, H., Lu, S., Reddy, L., Cloutier, S., et al. (2010). A unique wheat disease resistance-like gene governs effector-triggered susceptibility to necrotrophic pathogens. Proc. Nat. Acad. Sci. U.S.A. 107, 13544–13549. doi: 10.1073/pnas.1004090107
Fernandez, M. R., Clarke, J. M., and DePauw, R. M. (1994). Response of durum wheat kernels and leaves at different growth stages to Pyrenophora tritici-repentis. Plant Dis. 78, 597–600. doi: 10.1094/pd-78-0597
Friesen, T. L., Ali, S., Kianian, S., Francl, L. J., and Rasmussen, J. B. (2003). Role of host sensitivity to Ptr ToxA in development of tan spot of wheat. Phytopathology 93, 397–401. doi: 10.1094/phyto.2003.93.4.397
Friesen, T. L., and Faris, J. D. (2004). Molecular mapping of resistance to Pyrenophora tritici-repentis Race 5 and sensitivity to Ptr ToxB in wheat. Theor. Appl. Genet. 109, 464–471. doi: 10.1007/s00122-004-1678-9
Gamba, F. M., and Lamari, L. (1998). Mendelian inheritance of resistance to tan spot (Pyrenophora tritici-repentis) in selected genotypes of durum wheat (Triticum turgidum). Can. J. Plant Pathol. 20, 408–414. doi: 10.1080/07060669809500412
Gamba, F. M., Strelkov, S. E., and Lamari, L. (2012). Virulence of Pyrenophora tritici-repentis in the southern cone region of South America. Can J. Plant Pathol. 34, 545–550. doi: 10.1080/07060661.2012.695750
Gao, L., Turner, M. K., Chao, S., Kolmer, J., and Anderson, J. (2016). Genome wide association study of seedling and adult plant leaf rust resistance in elite spring wheat breeding lines. PLoS One 11:e0148671. doi: 10.1371/journal.pone.0148671
Gerard, G. S., Borner, A., Lohwasser, U., and Simon, M. R. (2017). Genome-wide association mapping of genetic factors controlling Septoria tritici blotch resistance and their associations with plant height and heading date in wheat. Euphytica 213:27.
Gurung, S., Mamidi, S., Bonman, J. M., Jackson, E. W., del Rio, L. E., Acevedo, M., et al. (2011). Identification of novel genomic regions associated with resistance to Pyrenophora tritici-repentis Races 1 and 5 in spring wheat landraces using association analysis. Theor. Appl. Genet. 123, 1029–1041. doi: 10.1007/s00122-011-1645-1
Gurung, S., Mamidi, S., Bonman, J. M., Xiong, M., Brown-Guedira, G., and Adhikari, T. B. (2014). Genome-wide association study reveals novel quantitative trait loci associated with resistance to multiple leaf spot diseases of spring wheat. PLoS One 9:e108179. doi: 10.1371/journal.pone.0108179
Halder, J., Zhang, J., Ali, S., Jagdeep, S. S., Harsimardeep, S. G., Shyamal, K. T., et al. (2019). Mining and genomic characterization of resistance to tan spot, Stagonospora nodorum blotch (SNB), and Fusarium head blight in Watkins core collection of wheat landRaces. BMC Plant Biol. 19:480. doi: 10.1186/s12870-019-2093-3
Heiser, I., and Elstner, E. F. (2002). Biochemical mechanisms of plant defense a central role for reactive oxygen species. Plant Protect. Sci. 38, 76–S86.
Hu, W., He, X., Dreisigacker, S., Sansaloni, C. P., Juliana, P., and Singh, P. K. (2019). A wheat chromosome 5AL region confers seedling resistance to both tan spot and Septoria nodorum blotch in two mapping populations. Crop J. 7, 809–818.
Jamil, M., Ali, A., Gul, A., Ghafoor, A., Napar, A. A., Ibrahim, A. M. H., et al. (2019). Genome-wide association studies of seven agronomic traits under two sowing conditions in bread wheat. BMC Plant Biol. 19:149.
Jordahl, J. G., and Francl, L. J. (1992). “Increase and storage of cultures of Pyrenophora tritici-repentis,” in Advances in Tan Spot Research, eds L. J. Francl, J. M. Krupinsky, and M. P. McMullen (Fargo, ND: North Dakota Agric. Exp. Station).
Juliana, P., Singh, R. P., Singh, P. K., Poland, J. A., Bergstrom, G. C., Huerta-Espino, J., et al. (2018). Genome-wide association mapping for resistance to leaf rust, stripe rust and tan spot in wheat reveals potential candidate genes. Theor. Appl. Genet. 131, 1405–1422. doi: 10.1007/s00122-018-3086-6
Khasanov, B. A. (1988). Yellow spotting of cereals caused by Pyrenopliora tritici-repentis. II Mycol. Phytopathol. 1, 78–84.
Kokhmetova, A., Atishova, M., Kumarbayeva, M., and Leonova, I. N. (2019). Phytopathological screening and molecular marker analysis of wheat germplasm from Kazakhstan and CIMMYT for resistance to tan spot. Vavilov J. Genet. Breed. 23, 879–886. doi: 10.18699/vj19.562
Kokhmetova, A., Kremneva, O., Volkova, G., Atishova, M., and Sapakhova, Z. (2017). Evaluation of wheat cultivars growing in Kazakhstan and Russia for resistance to tan spot. J. Plant Pathol. 99, 161–167.
Kokhmetova, A. M., Ali, S., Sapakhova, Z., and Atishova, M. N. (2018). Identification of genotypes-carriers of resistance to tan spot Ptr ToxA and Ptr ToxB of Pyrenophora tritici-repentis in common wheat collection. Vavilov J. Genet. Breed. 22, 978–986. doi: 10.18699/vj18.440
Kokhmetova, A. M., Kremneva, O., Keyshilov, Z. H. S., and Sultanova, N. Z. H. (2016). Race structure and virulence of isolates Pyrenophora tritici-repentis in the Republic of Kazakhstan and north Caucasus region of Russia. Eur. J. Appl. Biotech. 3, 57–66.
Kollers, S., Rodemann, B., Ling, J., Korzun, V., Ebmeyer, E., Argillier, O., et al. (2013a). Genetic architecture of resistance to Septoria tritici blotch (Mycosphaerella graminicola) in European winter wheat. Mol. Breed. 32, 411–423. doi: 10.1007/s11032-013-9880-6
Kollers, S., Rodemann, B., Ling, J., Korzun, V., Ebmeyer, E., Argillier, O., et al. (2013b). Whole genome association mapping of fusarium head blight resistance in European winter wheat (Triticum aestivum L.). PLoS One 8:e57500. doi: 10.1371/journal.pone.0057500
Kollers, S., Rodemann, B., Ling, J., Korzun, V., Ebmeyer, E., Argillier, O., et al. (2014). Genome-wide association mapping of tan spot resistance (Pyrenophora tritici-repentis) in European winter wheat. Mol. Breed. 34, 363–371. doi: 10.1007/s11032-014-0039-x
Kolmer, J. A., Garvin, D. F., and Jin, Y. (2011). Expression of a Thatcher wheat adult plant stem rust resistance QTL on chromosome arm 2BL is enhanced by Lr34. Crop Sci. 51, 526–533. doi: 10.2135/cropsci2010.06.0381
Kremneva, O. Y., and Volkova, G. V. (2007). The structure of Pyrenophora tritici-repentis population in north Caucasus by morphological and cultural characteristics and virulence. Mikol. Fitopatol. 41, 356–361.
Lamari, L., and Bernier, C. C. (1989). Evaluation of wheat lines and cultivars to tan spot (Pyrenophora tritici-repentis) based on lesion type. Can. J. Plant Pathol. 11, 49–56. doi: 10.1080/07060668909501146
Lamari, L., Strelkov, S. E., Yahyaoui, A., Amedov, M., Saidov, M., Djunusova, M., et al. (2005). Virulence of Pyrenophora tritici-repentis in the countries of the Silk Road. Can. J. Plant Path. 27, 383–388.
Lamari, L., Strelkov, S. E., Yahyaoui, A., Orabi, J., and Smith, R. B. (2003). The identification of two new Races of Pyrenophora tritici-repentis from the host center of diversity confirms a one-to-one relationship in tan spot of wheat. Phytopathology 93, 391–396. doi: 10.1094/phyto.2003.93.4.391
Li, H. B., Yan, W., Liu, G. R., Wen, S. M., and Liu, C. J. (2011). Identification and validation of quantitative trait loci conferring tan spot resistance in the bread wheat variety Ernie. Theor. Appl. Genet. 122, 395–403. doi: 10.1007/s00122-010-1455-x
Lipka, A. E., Tian, F., Wang, Q., Peiffer, J., Li, M., Bradbury, P. J., et al. (2012). GAPIT: genome association and prediction integrated tool. Bioinformatics 28, 2397–2399. doi: 10.1093/bioinformatics/bts444
Liu, K., and Muse, S. V. (2005). Power Marker: integrated analysis environment for genetic marker data. Bioinformatics 21, 2128–2129. doi: 10.1093/bioinformatics/bti282
Liu, Z., El-Basyoni, I., Kariyawasam, G., Zhang, G., Fritz, A., Hansen, J., et al. (2015). Evaluation and association mapping of resistance to tan spot and Stagonospora nodorum blotch in adapted winter wheat germplasm. Plant Dis. 99, 1333–1341. doi: 10.1094/pdis-11-14-1131-re
Mao, S. L., Wei, Y. M., Cao, W., Lan, X. J., Yu, M., Chen, Z. M., et al. (2010). Confirmation of the relationship between plant height and Fusarium head blight resistance in wheat (Triticum aestivum L.) by QTL meta-analysis. Euphytica 174, 343–356. doi: 10.1007/s10681-010-0128-9
Maraite, H., Mercado-Vergnes, D., Renard, M. E., Zhanarbekova, A., and Duveiller, E. (2006). Relevance of pathogen diversity in management of leaf spot and leaf blight diseases on wheat in Central Asia. Agromeridian 2, 105–114.
McIntosh, R. A., Yamazaki, Y., Dubcovsky, J., Rogers, J., Morris, C., Appel, R., et al. (2013). Catalogue of Gene Symbols for Wheat. Available online at: www.shigen.nig.ac.jp/wheat/komugi/genes/ (accessed June 16, 2020).
McIntosh, R. A., Yamazaki, Y., Dubcovsky, J., Rogers, J., Morris, C., Somers, D. J., et al. (2008). Catalogue of Gene Symbols For Wheat. MacGene 2008. Available online at: http://wheat.pw.usda.gov/GG2/Triticum/wgc/2008/ (accessed June 16, 2020).
Miedaner, T., Wiirschum, T., Maurer, H. P., Korzun, V., Ebmeyer, E., and Reif, J. C. (2011). Association mapping for Fusarium head blight resistance in European soft winter wheat. Mol. Breed. 28, 647–655. doi: 10.1007/s11032-010-9516-z
Morgounov, A., Abugalieva, A., and Martynov, S. (2014). Effect of climate change and variety on long-term variation of grain yield and quality in winter wheat in kazakhstan. Cereal Res. Commun. 42, 163–172. doi: 10.1556/crc.2013.0047
Noriel, A. J., Sun, X., Bockus, W., and Bai, G. (2011). Resistance to tan spot and insensitivity to Ptr ToxA in wheat. Crop Sci. 51, 1059–1067. doi: 10.2135/cropsci2010.08.0464
Pandey, A. K., Burlakoti, R. R., Kenyon, L. C., and Nair, R. M. (2018). Perspectives and challenges for sustainable management of fungal diseases of mungbean [Vigna radiata (L.) R. Wilczek var. radiata]: a review. Front. Environ. Sci. 6:53. doi: 10.3389/fenvs.2018.00053
Patel, J. S., Mamidi, S., Bonman, J. M., and Adhikari, T. B. (2013). Identification of QTL in spring wheat associated with resistance to a novel isolate of Pyrenophora tritici-repentis. Crop Sci. 53, 842–852. doi: 10.2135/cropsci2012.01.0036
Phuke, R. M., He, X., Juliana, P., Bishnoi, S. K., Singh, G. P., Kabir, M. R., et al. (2020). Association mapping of seedling resistance to tan spot (Pyrenophora tritici-repentis race 1) in CIMMYT and South Asian wheat germplasm. Front. Plant Sci. 11:1309. doi: 10.3389/fpls.2020.01309
Postnikova, E. N., and Khasanov, B. A. (1998). “Tan spot in central Asia,” in Helminthosporium Blights of Wheat: Spot Blotch and Tan Spot. Proceedings of an International Workshop held at CIMMYT (El Batan: CIMMYT), 107–113.
Pritchard, J. K., Stephens, M., and Donnelly, P. (2000). Inference of population structure using multilocus genotype data. Genetics 155, 945–959.
Rees, R. G., Platz, G. J., and Mayer, R. J. (1982). Yield losses in wheat from yellow spot: Comparison of estimates derived from single tillers and plots. Austr. J. Agric. Res. 33, 899–908. doi: 10.1071/ar9820899
Reif, J. C., Zhang, P., Dreisigacher, S., Warburton, M. L., Ginkel, M. V., Hoisington, D., et al. (2005). Wheat genetic diversity trends during domestication and breeding. Theor. Appl. Genet. 110, 859–864. doi: 10.1007/s00122-004-1881-8
Salnikov, V., Turulina, G., Polyakova, S., Petrova, Y., and Skakova, A. (2015). Climate change in Kazakhstan during the past 70 years. Quaternary Int. 358, 77–82. doi: 10.1016/j.quaint.2014.09.008
Sansaloni, C., Petroli, C., Jaccoud, D., Carling, J., and Detering, F. (2011). Diversity arrays technology (DArT) and next-generation sequencing combined: genome-wide, high throughput, highly informative genotyping for molecular breeding of Eucalyptus. BMC Proc. 5:54. doi: 10.1186/1753-6561-5-S7-P54
Santure, A. W., and Garant, D. (2018). Wild GWAS-association mapping in natural populations. Mol. Ecol. Res. 18, 729–738. doi: 10.1111/1755-0998.12901
Sehgal, D., Autrique, E., Singh, R., Ellis, M., Singh, S., and Dreisigacker, S. (2017). Identification of genomic regions for grain yield and yield stability and their epistatic interactions. Sci. Rep. 7:41578.
Sehgal, D., Dreisigacker, S., Belen, S., Küçüközdemir, Ü, Mert, Z., Özer, E., et al. (2016). Mining centuries old in situ conserved Turkish wheat landRaces for grain yield and stripe rust resistance genes. Front. Genet. 7:201.
Sehgal, D., Vikram, P., Sansaloni, C. P., Ortiz, C., Pierre, C. S., Payne, T., et al. (2015). Exploring and mobilizing the gene bank biodiversity for wheat improvement. PLoS One 10:e0132112. doi: 10.1371/journal.pone.0132112
Shabeer, A., and Bockus, W. W. (1988). Tan spot effects on yield and yield components relative to growth stage in winter wheat. Plant Dis. 72, 599–602. doi: 10.1094/pd-72-0599
Singh, P. K., Crossa, J., Duveiller, E., Singh, R. P., and Djurle, A. (2016). Association mapping for resistance to tan spot induced by Pyrenophora tritici-repentis Race 1 in CIMMYTs historical bread wheat set. Euphytica 207, 515–525. doi: 10.1007/s10681-015-1528-7
Singh, P. K., Mergoum, M., Gonzalez-Hernandez, J. L., Ali, S., Adhikari, T. B., Kianian, S. F., et al. (2008). Genetics and molecular mapping of resistance to necrosis inducing Race 5 of Pyrenophora tritici-repentis in tetraploid wheat. Mol. Breed. 21, 293–304. doi: 10.1007/s11032-007-9129-3
Singh, P. K., Singh, R. P., Duveiller, E., Mergoum, M., Adhikari, T. B., and Elias, E. M. (2010). Genetics of wheat - Pyrenophora tritici-repentis interactions. Euphytica. 171, 1–13. doi: 10.1007/s10681-009-0074-6
Singh, P. K., Singh, S., Deng, Z., He, X., Kehel, Z., and Singh, R. P. (2019). Characterization of QTLs for seedling resistance to tan spot and septoria nodorum blotch in the PBW343/kenya nyangumi wheat recombinant inbred lines population. Int. J. Mol. Sci. 20:5432. doi: 10.3390/ijms20215432
Somers, D. J., Banks, T., DePauw, R., Fox, S., Clarke, J., Pozniak, C., et al. (2007). Genome-wide linkage disequilibrium analysis in bread wheat and durum wheat. Genome 50, 557–567. doi: 10.1139/g07-031
Srinivasachary, S., Gosman, N., Steed, A., Hollins, T. W., Bayles, R., Jennings, P., et al. (2009). Semi-dwarfing Rht-B1 and Rht-D1 loci of wheat differ significantly in their influence on resistance to Fusarium head blight. Theor. Appl. Genet. 118, 695–702. doi: 10.1007/s00122-008-0930-0
Tadesse, W., Hsam, S. L. K., Wenzel, G., and Zeller, F. J. (2006a). Identification and monosomic analysis of tan spot resistance genes in synthetic wheat lines (Triticum turgidum L. × Aegilops tauschii Coss.). Crop Sci. 46, 1212–1217. doi: 10.2135/cropsci2005.10-0396
Tadesse, W., Hsam, S. L. K., and Zeller, F. J. (2006b). Evaluation of common wheat cultivars for tan spot resistance and chromosomal location of a resistance gene in the cultivar ‘Salamouni’. Plant Breed. 125, 318–322. doi: 10.1111/j.1439-0523.2006.01243.x
Tommasini, L., Schnurbusch, T., Fossati, D., Mascher, F., and Keller, B. (2007). Association mapping of Stagonospora nodorum blotch resistance in modern European winter wheat varieties. Theor. Appl. Genet. 115, 697–708. doi: 10.1007/s00122-007-0601-6
VanRaden, P. M. (2008). Efficient methods to compute genomic predictions. J. Dairy Sci. 91, 4414–4423. doi: 10.3168/jds.2007-0980
Vargas, M., Combs, E., Alvarado, G., Atlin, G., Mathews, K., and Crossa, J. (2013). META: a suite of SAS programs to analyze multi-environment breeding trials. Agron. J. 105, 11–19. doi: 10.2134/agronj2012.0016
Warburton, M. L., Crossa, J., Franco, J., Kazi, M., Trethowan, R., Rajaram, S., et al. (2006). Bringing wild relatives back into the family: recovering genetic diversity in CIMMYT improved wheat germplasm. Euphytica 149, 289–301. doi: 10.1007/s10681-005-9077-0
Würschum, T., Langer, S. M., Longin, C. F., Korzun, V., Akhunov, E., Ebmeyer, E., et al. (2013). Population structure, genetic diversity and linkage disequilibrium in elite winter wheat assessed with SNP and SSR markers. Theor. Appl. Genet. 126, 1477–1486. doi: 10.1007/s00122-013-2065-1
Yu, L. X., Lorenz, A., Rutkoski, J., Singh, R. P., Bhavani, S., Huerta-Espino, J., et al. (2011). Association mapping and gene–gene interaction for stem rust resistance in CIMMYT spring wheat germplasm. Theor. Appl.Genet. 123, 1257–1268. doi: 10.1007/s00122-011-1664-y
Yu, L. X., Morgounov, A., Wanyera, R., Keser, M., Singh, S. K., and Sorrells, M. (2012). Identification of Ug99 stem rust resistance loci in winter wheat germplasm using genome-wide association analysis. Theor. Appl.Genet. 125, 749–758. doi: 10.1007/s00122-012-1867-x
Zadoks, J. C., Chang, T. T., and Konzak, M. M. (1974). A decimal code for the growth stages of wheat. Weed Res. 14, 415–421. doi: 10.1111/j.1365-3180.1974.tb01084.x
Keywords: DArTseq, genome-wide association study, Pyrenophora tritici-repentis, tan spot, wheat
Citation: Kokhmetova A, Sehgal D, Ali S, Atishova M, Kumarbayeva M, Leonova I and Dreisigacker S (2021) Genome-Wide Association Study of Tan Spot Resistance in a Hexaploid Wheat Collection From Kazakhstan. Front. Genet. 11:581214. doi: 10.3389/fgene.2020.581214
Received: 08 July 2020; Accepted: 09 December 2020;
Published: 11 January 2021.
Edited by:
Vijay Kumar Tiwari, University of Maryland, College Park, United StatesReviewed by:
Vikas Belamkar, University of Nebraska–Lincoln, United StatesZe Peng, University of Florida, United States
Copyright © 2021 Kokhmetova, Sehgal, Ali, Atishova, Kumarbayeva, Leonova and Dreisigacker. This is an open-access article distributed under the terms of the Creative Commons Attribution License (CC BY). The use, distribution or reproduction in other forums is permitted, provided the original author(s) and the copyright owner(s) are credited and that the original publication in this journal is cited, in accordance with accepted academic practice. No use, distribution or reproduction is permitted which does not comply with these terms.
*Correspondence: Alma Kokhmetova, akokhmetova@gmail.com; gen_kalma@mail.ru; Deepmala Sehgal, d.sehgal@cgiar.org