 Jan Karbowski1,2,3*
- 1Nalecz Institute of Biocybernetics and Biomedical Engineering, Polish Academy of Sciences, Warsaw, Poland
- 2Department of Mathematics, Informatics and Mechanics, Institute of Applied Mathematics and Mechanics, University of Warsaw, Warsaw, Poland
- 3Division of Biology, Caltech, Pasadena, CA, USA
Mammalian brains span about four orders of magnitude in cortical volume and have to operate in different environments that require diverse behavioral skills. Despite these geometric and behavioral diversities, the examination of cerebral cortex across species reveals that it contains a substantial number of conserved characteristics that are associated with neuroanatomy and metabolism, i.e., with neuronal connectivity and function. Some of these cortical constants or invariants have been known for a long time but not sufficiently appreciated, and others were only recently discovered. The focus of this review is to present the cortical invariants and discuss their role in the efficient information processing. Global conservation in neuroanatomy and metabolism, as well as their correlated regional and developmental variability suggest that these two parallel systems are mutually coupled. It is argued that energetic constraint on cortical organization can be strong if cerebral blood supplied is either below or above a certain level, and it is rather soft otherwise. Moreover, because maximization or minimization of parameters associated with cortical connectivity, function and cost often leads to conflicts in design, it is argued that the architecture of the cerebral cortex is a result of structural and functional compromises.
Introduction
Bigger mammals tend to have bigger brains (Jerison, 1973; Haug, 1987; Hofman, 1988; Allman, 1999). There exists five orders of magnitude difference in brain volume between the smallest mammal (Etruscan pygmy shrew with 0.04 g brain; McNab and Eisenberg, 1989) and the largest (sperm whale with ~10 kg brain; Haug, 1987). Despite such a big span in size, brains of different species share common structures with similar properties (Hofman, 1988, 1989; Finlay and Darlington, 1995; Barton and Harvey, 2000; Clark et al., 2001; De Winter and Oxnard, 2001). This similarity in structure and function is presumably an indication of the same basic mechanism governing the developmental process in all mammals (Striedter, 2005). Some departures from a common plan can be explained by interactions of genetic (molecular) and environmental factors(Krubitzer, 1995).
Cerebral cortex, which is responsible for processing sensory, behavioral, and cognitive informations (Kandel et al., 1991), can also differ vastly in mass and geometric dimensions across mammals (Hofman, 1988, 1989), and yet it contains neuroanatomical characteristics that are roughly independent of brain size (Braitenberg and Schüz, 1988; DeFelipe et al., 2002). The first purpose of this review is to systematically present and discuss these structural constants or invariants, and to show that a similar remarkable conservation is also associated with cortical metabolism and its underlying hemodynamics and microvasculature.
It seems that the presence of invariants in the structure and dynamics of cortical networks has not been fully appreciated in the neuroscience community. There exists a vast literature focused much more on differences than on similarities in the cerebral structure and morphology in order to explain behavioral and cognitive diversities among mammals (e.g., Krubitzer, 1995; Herculano-Houzel et al., 2008; Rakic, 2009; Herculano-Houzel, 2011a). However, cortical conservation is an important empirical fact (Braitenberg and Schüz, 1998; DeFelipe et al., 2002; Karbowski, 2003; Douglas and Martin, 2004), which deserves more analysis. Such analysis may provide clues regarding basic principles of anatomical and functional organization of the cerebral cortex. This knowledge may be useful in expanding our general understanding of brain evolution and development. It is rather unlikely that cortical invariants are the result of an evolutionary accident. Instead, their existence suggests a certain universality in cortical design. In this context, the challenging questions are: (1) what is the cause of cortical invariants, (2) how are they inter-related, and (3) what are the possible benefits they might bring for efficient functioning of the brain?
The second aim of this review is to show that cortical neuroanatomy and metabolism are mutually interrelated, in such a way that cortical invariants lead to various functional and energetic trade-offs. Related to this is the issue of an extent to which metabolism restricts cortical architecture, which will be also briefly discussed.
That energy should play some role in constraining the evolution of brain size (Martin, 1981; Isler and van Schaik, 2006; Navarrete et al., 2011) and neural information processing (Laughlin et al., 1998; Balasubramanian et al., 2001; Niven and Laughlin, 2008) is generally accepted. This is mainly because cerebral tissue is metabolically expensive (Aiello and Wheeler, 1995; Attwell and Laughlin, 2001; Karbowski, 2007). This cerebral expensiveness is particularly visible in the allometric scaling of brain energetics across species: energy consumption of the brain grows with brain size faster than a corresponding energy use of the whole body increase with body size (Karbowski, 2007). For this reason, it may seem that cortical design should be related to the economy of energy expenditure, similar to the design of circulatory system in animals (Weibel et al., 1991).
Neuroanatomical Invariants
One has to realize that neurobiological constancy does not mean an exact mathematical constancy. Rather, it is meant statistically. In biology there is always some variability of “constant” parameters across individuals or species, and therefore we usually take average values for statistical analysis across species. In this study, by constant or invariant parameters we mean characteristics whose average values do not change significantly with brain size. Most cortical invariants are associated with synapses and neuronal wiring.
Synaptic Size
Synapses in the cerebral cortex play a special role. They are thought to encode, through some structural changes, information that is vital for animal's living and survival (Kasai et al., 2010; Bourne and Harris, 2011). Without these plastic changes animals would be unable to learn and remember events occurring in the environments. Because of the plasticity, synaptic sizes vary widely and can differ even by a factor of ~30 within the same cortical area of an individual (Loewenstein et al., 2011). However, in spite of this geometric variability the average size of excitatory synapses stays roughly constant across different species (Table 1, Figures 1A,B). Specifically, the length of postsynaptic density is essentially independent of cortical volume, and is in the range 0.27–0.46 μm (Table 1, Figure 1A). What is even more interesting, this average length does not seem to change much during postnatal development or even aging, at least in primates (Zecevic and Rakic, 1991; Huttenlocher and Dabholkar, 1997; Peters et al., 2008). The spine length of excitatory synapses (combined length of spine neck and head) is also conserved across mammals (Table 1, Figure 1B). The invariance of the average synaptic dimensions indicates that structural synaptic machinery (different receptors) and design is very similar among mammals.
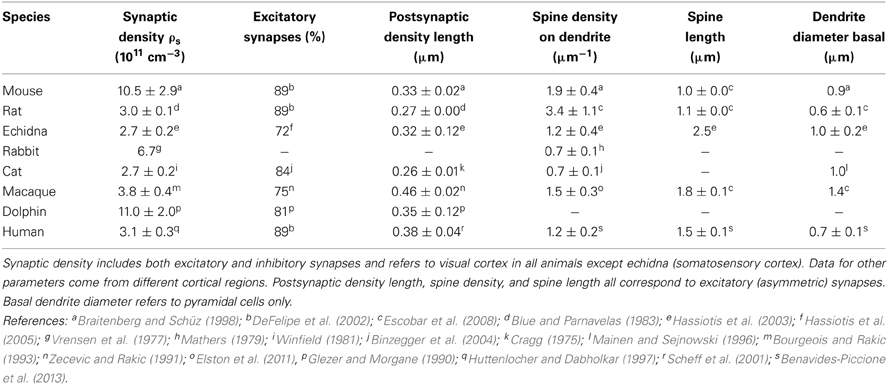
Table 1. Synaptic and wiring characteristics for mammalian cerebral cortex.
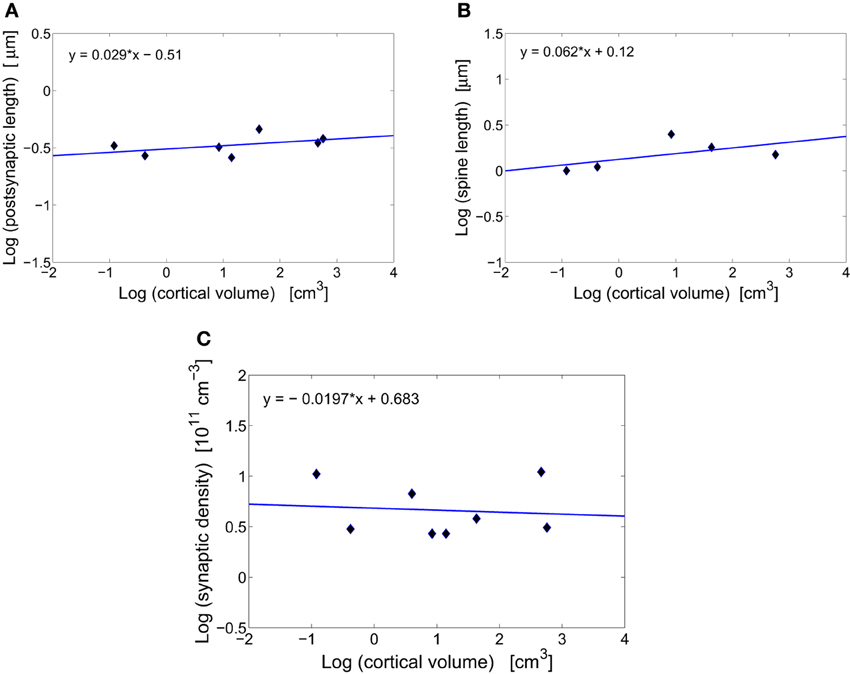
Figure 1. Scaling of synaptic characteristics with cortical volume. (A) Conservation of postsynaptic density length of excitatory synapses across mammals. The log–log fit to the data points yields a scaling exponent close to zero (y = 0.029x − 0.51), with non-significant moderate correlations (r = 0.480, p = 0.275). (B) Conservation of spine length of excitatory synapses across mammals. The scaling exponent is close to zero (y = 0.062x+ 0.12) with non-significant moderate correlations (r = 0.576, p = 0.310). (C) Conservation of the total synaptic density across mammals. The log–log fit gives a scaling exponent close to zero (y = −0.020x + 0.683) with non-significant weak correlations (r = −0.099, p = 0.815).
Synaptic Density
Total number of excitatory and inhibitory synapses per unit cortical volume or synaptic density changes non-monotonically during animal's lifetime, taking maximal values often early in the development (Winfield, 1981; Zecevic and Rakic, 1991; Bourgeois and Rakic, 1993; Huttenlocher and Dabholkar, 1997). However, at adulthood synaptic density stabilizes and its mean value (~ 5· 1011 cm−3) is approximately independent of brain size (Table 1, Figure 1C). There exists some variability across mammals and cortical areas, but it does not depend systematically on cortical volume (Figure 1C). This may suggest that neural plasticity can have an additional role, namely to find optimal and species independent values for synaptic density and size that are needed for efficient and universal cerebral function (Chklovskii, 2004).
Ratio of Excitatory to Inhibitory Synapses
A related quantity to synaptic density is the ratio of the number of excitatory to inhibitory synapses (i.e., the ratio of asymmetric to symmetric synapses, respectively). Data for adult mammals of different sizes show that this ratio is conserved, and excitatory synapses comprise about 80–90% of all synapses in the cerebral cortex (DeFelipe et al., 2002; Table 1). The degree of this conservation is remarkable (average 0.83 ± 0.03), suggesting that the excitatory to inhibitory ratio is somehow an important parameter for brain operation. One can suspect that the constancy may be necessary for maintaining a dynamical balance in cortical circuits. Probably because of that, neural activities cannot be too high or too low for an efficient cortical function. There have been several experimental reports supporting the notion of a dynamic balance between discharges of cortical excitatory and inhibitory neurons (Haider et al., 2006; Vogels et al., 2011), which might be related to the neuroanatomical constancy of synaptic polarity. Interestingly, this phenomenon and its consequences have been predicted almost two decades ago in a theoretical study (Van Vreeswijk and Sompolinsky, 1996).
Diameter of Unmyelinated Axons and Dendrites
The vast majority of cortical excitatory synapses are made between presynaptic axonal boutons and postsynaptic dendritic spines (Blue and Parnavelas, 1983; Glezer and Morgane, 1990; Zecevic and Rakic, 1991). It has been suggested that diameters of intra-cortical axons and dendrites do not change systematically with brain size (Braitenberg and Schüz, 1998). The data gathered in Table 1 for diameters of basal dendrites of pyramidal cells in the cortex of different mammals support this prediction (Figure 2A). The issue is slightly different for white matter long-range axons whose average diameters tend to increase weakly with brain volume, mostly due to the thickest 5% (Olivares et al., 2001; Wang et al., 2008). The constancy of the diameter of intracortical wiring may have something to do with the constancy of synaptic parameters, as these two anatomical processes are mutually coupled. That is, synapses need resources and molecular signaling from axons and dendrites to grow and maintain their size. The flow of different molecules, and thus information between these two subsystems is perhaps optimized if both have similar sizes. Indeed, axon diameter of pyramidal cells in gray matter is about 0.2–0.3 μm (Braitenberg and Schüz, 1998), which is close to the average length of synaptic boutons of about 0.25 μm (Escobar et al., 2008). Moreover, the diameter of pyramidal basal dendrites is three to four times larger than that of axons, which is close to the length of dendritic spines (Table 1).
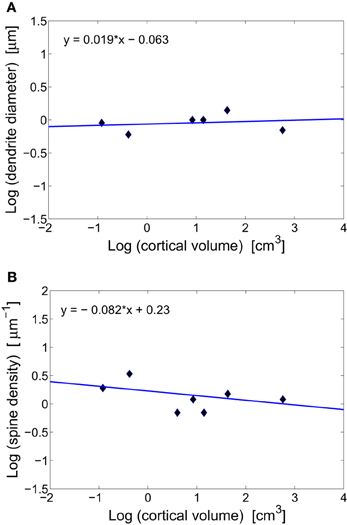
Figure 2. Scaling of dendritic characteristics of pyramidal cells with cortical volume. (A) Conservation of basal dendrite diameter across species. The log–log fit gives a scaling exponent around zero (y = 0.019x − 0.063), with non-significant weak correlations (r = 0.202, p = 0.702). (B) Conservation of spine density on a dendrite across mammals. The log–log fit gives a scaling with a small non-significant exponent (y = −0.082x + 0.23, r = −0.477, p = 0.338).
Fraction of Volume Occupied by Axons and Dendrites
Data for volumes of axons and dendrites in the mouse and cat cortex indicate that they are approximately equal, and each of them takes about 1/3 of the cortical volume (Braitenberg and Schüz, 1998; Chklovskii et al., 2002). Given the invariants associated with synaptic, axonal, and dendritic sizes, one can guess that cortical space is compactly filled, and there is not much room for dimensional variability. This may be a result of economical wiring in the cerebral cortex, and competition for space among different neural components (Budd and Kisvarday, 2012; Bullmore and Sporns, 2012). A direct consequence of the wiring volume conservation and the fact that axons are thinner than dendrites is that axons are additionally much longer. This enables neurons to send signals to remote regions to facilitate neural communication. However, the smallness of axonal diameter has also a downside, because it limits the speed of signal propagation (see Discussion).
Another consequence of having invariant synaptic density, dendrite diameter, and the fraction of volume taken by dendrites, is that the density of spines along dendrites of pyramidal cells should be also invariant (this can be easily verified by dividing synaptic density through dendrite fractional volume, both of which are constants). This conclusion agrees well with the data in Table 1 and Figure 2B. From this, it follows that dendritic length and number of synapses per neuron are strongly correlated and should scale with brain size the same way.
Density of Glial Cells
Apart from neurons the cortical tissue contains non-neuronal cells called glia. There are different types of glia, each with a specific role in the nervous system. The most numerous are astrocytes (O'Kusky and Colonnier, 1982), which are mainly involved in recycling neurotransmitters (they are mechanically coupled to synapses) and in transport of different nutrients and metabolites between circulating blood and neurons (Nedergaard et al., 2003). Thus astrocytes play an important active regulatory role in cortical metabolism (Magistretti, 2006; Belanger et al., 2011). Less numerous glia, oligodendrocytes and microglia, are involved in providing mechanical support and insulation for neural processes, and in immunological protection, respectively (Kandel et al., 1991).
Studies performed across several mammals indicate that volume density of glia in the cerebral cortex is independent of brain size, and about 2· 104 mm−3 (Herculano-Houzel, 2012; Carlo and Stevens, 2013). Considering that synaptic density is also invariant across species, suggests that synapses and glia are mutually coupled not only anatomically but also functionally. Interestingly, in the mouse cortex glia and synapses occupy a similar percentage of cortical volume ~10% (Braitenberg and Schüz, 1998). However, in bigger brains glia could take even more cortical space, because in contrast to synapses, astrocytes increase in size and complexity as brain gets larger (Oberheim et al., 2006). Moreover, the number of glia per neuron in the cortex grows steady with brain size (Oberheim et al., 2006; Herculano-Houzel, 2012), which probably reflects higher metabolic needs of larger brains (Karbowski, 2007). In contrast, number of synapses per glia is independent of brain size, because synaptic and glia densities are invariant across mammals.
Neuroanatomical Parameters Weakly Dependent on Brain Size
Cerebral cortex can be also characterized by other parameters, some of which are not precisely conserved across mammals, but nevertheless change with brain size so weakly that can be roughly regarded as almost constant. The most prominent of these are: cortical thickness and elementary cortical module size. The first parameter is associated with the cortical geometry, which is essentially two dimensional, as the cortex grows much more tangentially than radially. For instance, cortical thickness in mouse is 0.8 mm (Braitenberg and Schüz, 1998), whereas in a convoluted elephant cortex it is about 3 mm (Shoshani et al., 2006). These values differ by a modest factor of ~4, despite 104 difference in their cortical mass (Braitenberg and Schüz, 1998; Hakeem et al., 2005).
A similar situation occurs for cortical micro modularity. These micro-modules, known as columns, are thought of as elementary functional units in the cerebral cortex (Mountcastle et al., 1957; Szentagothai, 1978; Buxhoeveden and Casanova, 2002). There is some variability in the column size across species, in the range 200–1000 μm (Buxhoeveden and Casanova, 2002), but it is unclear if it depends systematically on brain size, as there is no universal definition of a column. Another manifestation of cortical modularity is the presence of the so-called patches in the visual cortex (visible with staining methods). Patches have diameters in the range 200–500 μm, and their sizes are roughly independent of brain size (Karbowski, 2003). This approximate constancy or limited variability of elementary cortical modules processing information may have some functional role. However, it should be mentioned that small rodent brains are an exception, as their cortices do not exhibit intra-area patches (Van Hooser et al., 2006; Muir and Douglas, 2011).
Metabolic and Hemodynamic Invariants
Brain as a physical object needs energy for its operations (see Box 1, and Figure 3). In a nutshell, without its sufficient supply by cerebral blood flow, neurons and their processes would not grow to nominal sizes, cortical circuits would not be rightly connected, and the whole system would not function properly (Martin et al., 1994). For instance, a sharp reduction in blood supply to the brain for just several seconds leads to a loss of consciousness, and causes irreversible damage to neural structures if blood flow is stopped for few minutes (Raichle, 1983). Given the presence of neuroanatomical invariants, it is interesting to review corresponding invariants associated with cortical energetics and blood circulation.
Box 1
Cerebral blood flow (CBF) in capillaries provides two critically important metabolic substrates, oxygen and glucose, to neurons, synapses, and astrocytes (Figure 3). ATP molecule is an universal “currency” for metabolic activity within cells in all living organisms (Erecinska and Silver, 1989). In the brain tissue ATP is produced in three main ways (Figure 3): either locally through glycolysis pathway and through oxidation of glucose in mitochondria (Attwell et al., 2010), or non-locally through the involvement of lactate (from glycolysis) in astrocytes and its transport and subsequent oxidation in glutamatergic presynaptic terminals (Magistretti, 2006; Belanger et al., 2011). Thus, oxygen and glucose utilizations are strictly related to the metabolic energy (ATP) production, and therefore they are regularly used as measures of cerebral metabolic rate, i.e., CMRO2 and CMRglu, respectively. Depending on their metabolic needs, neurons and synapses during normal function can regulate to some extent the amount of oxygen and glucose supplied by blood either directly or by active signaling to astrocytes, which then modulate capillaries by changing their diameter (Attwell et al., 2010).
The energy released from hydrolysis of ATP is used to maintain the brain in a state that is far from thermodynamic equilibrium, which is mainly characterized by differences in intra- and extra-cellular concentrations of various ions (chiefly Na+, K+, Cl−, and Ca++; Ames, 2000). The ionic gradients across membrane are required for keeping negative resting voltages of neurons and for the ability to generate action potentials, which are necessary for inter-neuronal communication.
The majority of the energy goes for pumping ions across neural membrane and for recycling neurotransmitters, in which astrocytes are involved (Attwell and Laughlin, 2001; Magistretti, 2006); Figure 3). The most important and the most energy demanding is Na+/K+ pump that maintains Na+ and K+ concentration gradients through the membrane (Erecinska and Silver, 1989; Ames, 2000). The Na+/K+ pump performs an electrochemical work by pumping out 3 Na+ ions and pumping in 2 K+ ions per one pump's cycle, using energy generated by hydrolysis of 1 ATP molecule, and the process is called Na+/K+-ATPase (Figure 3). In general, neural and synaptic activities cause Na+ influx through voltage-gated channels and through ionotropic glutamate receptors (iGluR) at postsynaptic terminals of glutamatergic synapses. Na+ influx and corresponding K+ efflux counteract the ionic gradients and pull the whole system closer to a thermodynamic equilibrium (concentration of Na+ inside neurons and glia is much lower than outside, and the opposite for K+). A single action potential has only a marginal influence on the neural gradients, yet, a cumulative effect of many action potentials in a short period of time may significantly alter the gradients because the pump kinetics are slow (Karbowski, 2009). Therefore a continuous electrical and chemical communication between neurons in a non-equilibrium cerebral state requires a restoration of ionic gradients through a permanent pumping, which costs metabolic energy (the rate of ATP generation and hydrolysis). This process makes the mammalian brain one of the most energetic organs (Aiello and Wheeler, 1995; Attwell and Laughlin, 2001; Isler and van Schaik, 2006; Karbowski, 2007; Navarrete et al., 2011). For instance, the adult human brain constitutes of only 1–2% of the total body volume but consumes an excessive amount of 20% of the total body metabolic rate (Mink et al., 1981).
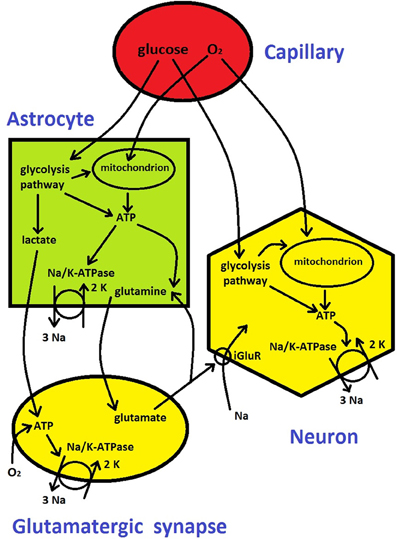
Figure 3. Metabolic energy flow in the brain (see description in Box 1). It is based on diagrams from Attwell et al. (2010) and Belanger et al. (2011).
Global Scaling of Brain Metabolism
Brain metabolic energy consumption grows relatively fast with brain size. Oxygen and glucose utilization per time unit by the whole cerebral tissue increase allometrically with mammalian brain volume with an exponent about 0.85 or 5/6 (Karbowski, 2007, 2011). The important point is that this scaling exponent is significantly larger than a corresponding exponent relating whole body metabolism with body volume, which is 3/4, and is known as the “Kleiber law” (Kleiber, 1947; Schmidt-Nielsen, 1984; West et al., 1997). The implication of this is that as brain increases in mass, its metabolic cost grows faster than the metabolic cost of the rest of the mammalian body. For instance, if brain volume increases 100 times, its energetic cost increases 50 times, whereas a corresponding enlargement of body volume increases the body energetic demand by a substantially smaller factor of 31. This expensive neural energetics can have important consequences for the brain design, i.e., the way evolution has built the mammalian brain and its cortical structure.
Local Scaling of Volume-Specific Cortical Metabolism
Given the above scaling for total brain metabolism, it is easy to notice that brain metabolism per volume, i.e., CMR (volume specific cerebral metabolic rate) decreases with brain volume, with an exponent about −0.15 or close to −1/6 (Karbowski, 2007). Interestingly, this volume-specific exponent is also conserved locally across all investigated regions of the cerebral cortex (and most of subcortical structures of gray matter) despite regional heterogeneity of CMR (Karbowski, 2007). This means that the energy utilization of 1 mm3 of different cortical areas (e.g., visual and frontal) diminish with increasing brain size in a similar allometric pattern across brains of different species. From this, it follows that 1 mm3 of human visual cortex uses about four times less energy than 1 mm3 of mouse visual cortex, and similarly for other cortical areas. These facts may suggest a common mechanism of energy utilization in different brain regions that is evolutionary conserved from small to large mammals.
Metabolic Energy Per Neuron
The conserved mechanism of energy use may have something to do with the question of how energy is distributed globally among neurons. Data analysis of cerebral metabolic rates and neuron density across several mammals reveals that their ratio is almost invariant, both for whole brain and cerebral cortex (Herculano-Houzel, 2011b). This implies that energy utilization per cortical neuron is on average conserved across different species, regardless of their size (Herculano-Houzel, 2011b). This constancy is even more remarkable if one realizes that neurons in larger brains are generally larger, i.e., they have longer axons and dendrites (Braitenberg and Schüz, 1998). Interestingly, neurons in large brains are on average less electrically active than neurons in small brains (Karbowski, 2009), and yet their metabolism is approximately conserved.
Cortical Blood Flow Per Neuron
Cerebral blood flow is strictly related to cerebral metabolism. Generally, the former is a driving force of the latter (Buxton and Frank, 1997; Hyder et al., 1998). The data for several mammalian species show that under regular conditions the average values of these two parameters are linearly correlated (Klein et al., 1986; Noda et al., 2002). Consequently, cerebral blood flow CBF in the cortex scales allometrically with cortical volume with the same exponent as does cortical CMR, which is approximately −1/6 (Karbowski, 2011).
Proportionality of CMR and CBF, together with the above fact that cerebral metabolic rate per neuron density is almost constant (Herculano-Houzel, 2011b), implies that cerebral blood flow should be proportional to neuron density. In other words, a mean blood flow per neuron should be roughly constant as well. Indeed, the data for cortical tissue confirms this constancy of brain circulation (Karbowski, 2011). Typically, there is about 1.45· 10−8 mL/min of blood flow per neuron in the cortex (Karbowski, 2011).
Ratio of CMR/CBF Across Species and Cortical Regions
Conservation of cerebral metabolic energy and blood flow per neuron across mammals (Herculano-Houzel, 2011b; Karbowski, 2011) implies that their ratio should be also brain size independent. This observation is consistent with the data for several mammals (Table 2), i.e., the ratio CMR/CBF is approximately constant in different parts of the cortex (Figure 4). This constancy shows that the cerebral supply of energy and its utilization are strongly coupled and the nature of this coupling is evolutionary conserved.
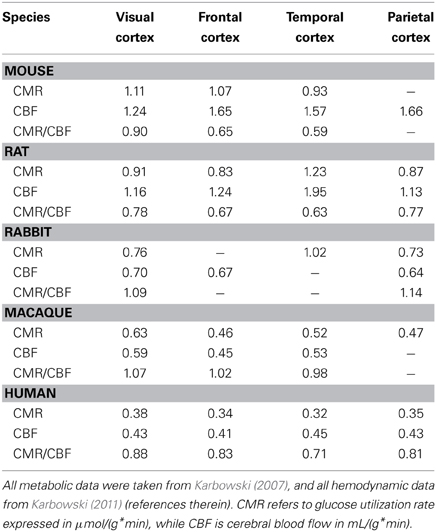
Table 2. Metabolic and hemodynamic characteristics for mammalian cerebral cortex.
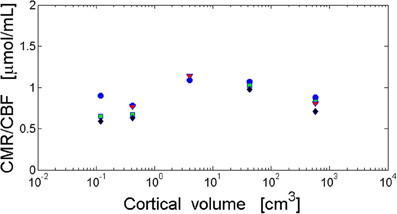
Figure 4. Invariance of the ratio of cortical metabolism to cortical blood flow (CMR/CBF) with respect to brain size. The ratio CMR/CBF is independent of cortical volume and cortical area. The log–log fit gives non-significant scaling exponents close to zero. Visual cortex (blue circles): y = 0.012x − 0.037 and r = 0.288, p = 0.638. Frontal cortex (green squares): y = 0.041x − 0.14 and r = 0.774, p = 0.226. Temporal cortex (black diamonds): y = 0.036x − 0.17 and r = 0.626, p = 0.374. Parietal cortex (red triangles): y = −0.006x − 0.044 and r = −0.094, p = 0.940. Data from Table 2.
Conserved Characteristics of Cortical Capillaries
A combination of theoretical and empirical analysis has provided some clues about a mechanism underlying the above metabolic and hemodynamic invariants (Karbowski, 2011). Energy available in the cortex is constrained by a geometric design of the microvascular system (Blinder et al., 2013). In particular, based on the Krogh model (Krogh, 1929; Boero et al., 1999), oxygen cerebral metabolic rate CMRO2 is proportional to volume density of capillary length (Karbowski, 2011). The empirical data across adult mammals in cortical gray matter show that capillary length density and neuron density scale similarly with brain size (Karbowski, 2011). This means that both of these parameters are allometrically proportional, from which it follows that CMRO2 and neuron density are proportional as well. In that way one can phenomenologically explain the constancy of the metabolic energy per neuron that is observed in adult mammals (Herculano-Houzel, 2011b).
The fact that capillary length density is proportional to neuron density implies the constancy of capillary length per cortical neuron among adult mammals (Karbowski, 2011). On average, there is approximately 10 μm of capillaries per cortical neuron (Karbowski, 2011). For human cortex with 2· 1010 neurons (Pakkenberg and Gundersen, 1997), this gives about 200 km of capillaries within cortical tissue!
Another invariant associated with capillaries is the portion of cortical space they occupy. Capillary volume comprises about 1–2% of cortical volume, regardless of brain size in adult mammals (Karbowski, 2011). This percentage is more than an order of magnitude smaller than a corresponding figure, ~66%, for a total neuronal wiring (Braitenberg and Schüz, 1998; Chklovskii et al., 2002), which may suggest an economical design of the microvascular system in the cortex.
Metabolic Energy Per Synapse During Development
It has been known for some time that cerebral metabolic rate correlates qualitatively with synaptogenesis (Huttenlocher and Dabholkar, 1997; Chugani, 1998). Synaptic density (Winfield, 1981; Zecevic and Rakic, 1991; Bourgeois and Rakic, 1993; Huttenlocher and Dabholkar, 1997), and glucose metabolic rate (Chugani and Phelps, 1986; Chugani et al., 1991; Chugani, 1998) both exhibit similar and non-monotonic dependence on developmental time, which suggests some coupling between synaptic number and consumed metabolic energy. This simple qualitative observation has recently been generalized and made more quantitative, by finding that during the time course of brain development (from birth to adulthood) the metabolic energy per synapse within a given cortical region is essentially conserved (Karbowski, 2012). More precisely, the metabolic rate per synapse can differ among mammals and cerebral locations, but it is approximately constant during developmental time for a given cortical region of a given species (four species and nine cortical areas investigated). For example, a typical synapse in the macaque monkey and human cerebral cortex consume about 7000 glucose molecules per second (Karbowski, 2012). The regional metabolic constancy during synaptic development suggests an active regulation of cortical metabolic rates that are closely tied to synaptic density. One can speculate that this mechanism is in some sense evolutionary optimized, i.e., each cortical region sets its optimal energy levels for a typical synapse to perform economically its function (see Discussion).
Distribution of Energy Use Among Neural Components
How the large amounts of energy consumed by the brain are distributed among neural components, or equivalently, which neural processes are the most energy demanding? Recent study by Hyder et al. (2013) indicate that the ratio of signaling (associated with neural and synaptic activities) and non-signaling (resting activity) components of the cerebral metabolic rate are conserved across different activity levels in rats and humans. The non-signalingpart is about four times smaller than the signaling part. The signaling component can be decomposed into spiking activity and synaptic activity (Attwell and Laughlin, 2001; Karbowski, 2009). Early phenomenological calculations indicated that neural action potentials require more energy than synaptic transmission (Attwell and Laughlin, 2001; Lennie, 2003). However, later experimental studies, using fMRI (Logothetis, 2008) and electrophysiology (Alle et al., 2009), implicated dendrites with their synapses as the major users of energy even when there was no apparent postsynaptic spiking activity. It seems that the likely cause of the discrepancy between theoretical and experimental results was too small probability of neurotransmitter release that was assumed in the theoretical calculations (Attwell and Laughlin, 2001; Lennie, 2003). A recent correction in the phenomenological calculations (Harris et al., 2012) agrees with the idea that synapses cost the most energy. This conclusion is also consistent with theoretical calculations based on developmental data across several mammals, which indicate that synapses utilize more than 50% of CMR not only in adulthood but also during most of the postnatal period of synaptogenesis (Karbowski, 2012).
Discussion
Cortical Neuroanatomy and Metabolism are Mutually Interrelated as Implicated by Conservation and Correlated Variability in their Parameters
It is important to stress that cortical metabolism and neuroanatomy must be related because building and maintaining a functional structure requires some level of energy utilization. This simply follows from a physicality of the brain (Laughlin and Sejnowski, 2003; Karbowski, 2007; Niven and Laughlin, 2008; Bullmore and Sporns, 2012). This paper provides an additional support for this notion by showing that there exists conservation in both neuroanatomical (Braitenberg and Schüz, 1998) and energetic global cortical characteristics (Herculano-Houzel, 2011b; Karbowski, 2011, 2012; Hyder et al., 2013). Specifically, cortical metabolism and structure are coupled through inter-relations between metabolic rates, capillaries and glia on one hand, and synapses and neurons on the other. These couplings take place on three different levels: global allometric, regional, and developmental. Each of them is discussed below.
Allometric coupling means that global metabolic (hemodynamic) and microvascular parameters such as CMR, CBF, and capillary length density scale with cortical volume V the same way as does neuron volume density, i.e., as V−1/6, which was discussed in the previous sections (Karbowski, 2011). This implies that there are allometric correlations between metabolism/microvasculature and neuroanatomy across species. From these empirical facts, it follows that metabolic rate, blood flow, and capillary length per neuron are brain size independent, and thus allometrically conserved. Constant is also the average number of synapses per glia, since densities of synapses and glia are invariant with respect to brain size. Thus, there exists a strong structural coupling between the most energetic neuroanatomical elements (synapses) and energy delivery elements (glia) across mammals.
Values of parameters used in allometric scalings are always mean values averaged over different cortical areas. However, usually there is some small local variability in all parameters. Regional coupling between metabolism and neuroanatomy means that regional and laminar variabilities in metabolic/microvascular and structural parameters should be correlated. Data for visual cortex in adult primates (human and macaque monkey) indicate that capillary length density is the largest in the middle layers 4 and 2/3, and the smallest in boundary layers 1 and 5/6 (Bell and Ball, 1985; Weber et al., 2008). This distribution of capillaries correlates qualitatively with laminar variability in synaptic density, which is typically the highest in the middle layers 2/3 and 4, although laminar differences for synapses are less pronounced than those for capillaries (O'Kusky and Colonnier, 1982; Bourgeois and Rakic, 1993; Huttenlocher and Dabholkar, 1997; Scheff et al., 2001). Data for adult rodents are similar. For rat (parietal and visual cortex) and mouse (somatosensory cortex) both capillary length density and synaptic density assume the largest values in the layers 2/3 and 4, and the smallest in the boundary zones (for rat: Bar, 1980; Blue and Parnavelas, 1983; for mouse: DeFelipe et al., 1997; Blinder et al., 2013). Additionally, for mouse cortex there exists an inter-area correlation between neuron density and density of vascular length and its fractional volume (Tsai et al., 2009). Similarly for macaque monkey visual cortex, neuron density as well as basal oxidative metabolism both correlate with vascular length density and with vascular fractional volume (Weber et al., 2008). There is also some evidence regarding glia-microvasculature coupling. Specifically, the density of astrocytes correlates with capillary density across cortical layers in the mouse somatosensory cortex (McCaslin et al., 2011).
Developmental data for different mammals also show that cortical metabolism is coupled to neuroanatomy. In particular, cortical metabolic rate is strongly correlated with synaptic density, such that the ratio CMR/ρs is approximately conserved from birth to adulthood for a given species and cortical area, despite several-fold variabilities in CMR and ρs (Karbowski, 2012). Moreover, data for cat visual cortex indicate that changes in capillary length density closely follow changes in synaptic density during the whole development (Tieman et al., 2004). Specifically, capillary density decreases slightly from juvenile to adult values as synaptogenesis wanes (Tieman et al., 2004).
How Strong is Metabolic Influence on Cortical Neuroanatomy?
To what extent do metabolism and hemodynamics constrain cortical design? Is metabolic energy a strong or a weak constraint on the underlying neuroanatomy? This issue is far from resolved and, in some cases, it is unclear what is the direction of causality between metabolic and neuroanatomical changes (e.g., Chetelat et al., 2013). Below we consider these questions.
The traditional view of neuro-hemodynamic coupling has been that although CBF supplies neurons with nutrients and metabolites, their amounts are strictly controlled by neurons depending on neuronal metabolic needs. This suggests an active signaling in one direction from neurons to microvasculature and blood flow (Iadecola, 2004; Attwell et al., 2010). However, there are also some indications that hemodynamics can modulate neural activity and play a role in information processing, which is called hemo-neural hypothesis (Moore and Cao, 2008). According to this hypothesis, the signaling between neurons and blood flow is likely bidirectional. The general theme of this review is somewhat related to the hemo-neural coupling proposed by Moore and Cao (2008), in the sense that hemodynamics can constrain (or modulate) the structure of cortical circuits. However, there are also several key differences. First, the original hemo-neural hypothesis was applied to information processing in sensory systems, which is characterized by time scales of msec to tens of seconds. In the current review, we consider developmental or even evolutionary time scales, which are orders of magnitude slower. Second, energetic or hemodynamic constraints considered here act mainly on neural structure (synaptic and wiring invariants), and to a lesser degree on neural activities as it is in the hemo-neural hypothesis (Moore and Cao, 2008).
Non-monotonic temporal behavior of synaptic density associated with synapses overproduction early in the development and a similar behavior of metabolic rates, discussed above, may suggest that formation of neural connections in the cortex is not overly restricted by global energetic considerations. However, at the single synapse level the issue is more subtle. Because metabolic rate per synapse is approximately conserved from birth to adulthood within a given species and cortical area (Karbowski, 2012), then there must be some regulation of energy expenditure on a typical synapse (connection) during development. Thus, it seems that in this case energy supplied meets cortical functional demands, but at the same time this demand is somehow restricted.
Similarly, some data on cortical structure show that axons connecting remote neurons do not necessarily choose the shortest paths, at least a fraction of them, which means that wiring length and thus metabolic energy consumed is not always minimized (Raj and Chen, 2011). The reason for these axonal deviations as well as for synaptic overproductions is probably that energy is not the only constraint acting on cortical circuits. In fact, these circuits have to perform some functional operations that are facilitated by the underlying connectivity, which require not only energy but also some other resources (see below). Therefore, it seems that metabolism may be a soft constraint on the developing connectivity in the cortex.
On the other hand, it is well known that too small levels of CBF (and energy) cause neuron death in the process known as neurodegeneration (Martin et al., 1994). In adult human, normal CBF is between 0.45–0.60 mL/(g·min) (Erecinska and Silver, 2001). Irreversible neuronal damage occurs if CBF falls permanently below 0.18 ml/(g·min) (Heiss, 1983; Erecinska and Silver, 2001). Thus apparently, there exist a threshold for CBF below which cortical structure does not survive. Additionally, even relatively mild reduction of CBF during development (carotid artery occlusion) can significantly alter neuron density, cortical vascularization, and the pattern of cortico-cortical connectivity (Miller et al., 1993), indicating that metabolism is a serious restriction on the developing neuroanatomy. These developmental abnormalities usually have a negative influence on behavioral and cognitive abilities during adulthood.
Similarly, too high levels of CBF and CMR can also be disadvantageous for cortical circuits. Prolonged neuronal hyperactivity, such as observed during epilepsy, fueled by excessive supply of blood flow can induce processes (e.g., excitotoxicity) leading to neuron damage (Ingvar, 1986; Olney et al., 1986). Although there are some mechanisms preventing a developing brain from seizure-induced brain damage, the adult brain seems to lack them (de Vasconcelos et al., 2002). These observations imply that in extreme situations neurons are unable to control the amount of energy they need, even for their survival. In these cases energy supplied does not meet neural demands because it is either too small or too large in relation to the needs. As a consequence, metabolism and hemodynamics can place a very strong constraint on cortical organization.
Given a possible brain damage associated with epilepsy, one can ask how much energy can be supplied to the cortex? Is there any upper limit? Theoretical arguments indicate that indeed capillary dimensions (capillary length density) set such a limit (Karbowski, 2011). Thus, metabolic rates are not physically attainable above a certain level. Because of that upper limit, and since synapses use a large portion of the overall brain metabolic energy (Harris et al., 2012; Karbowski, 2012), neural connectivity cannot be too dense and must be in some way restricted.
Combining the above considerations, one can note that there likely exist a “metabolic window of opportunity” in the cortex within which energy places a soft influence on neuroanatomy (Figure 5). In this regime, energy supplied seems to meet cortical demands, which is possible due to various signaling pathways from neurons to capillaries (Iadecola, 2004; Attwell et al., 2010). However, outside this window, metabolism places strong constraints on cortical architecture and its neuroanatomical processes. Specifically, too low levels of energy are not viable for functioning, and too large energy amounts promote and sustain pathological conditions, both of which can lead to structural damage if prolonged. Moreover, extremely high metabolic demands are not physically feasible, because of capillary geometric limitations.
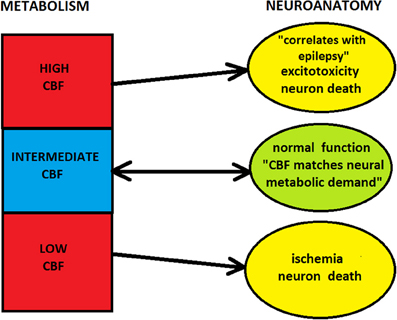
Figure 5. Influence of cerebral metabolism (hemodynamics) on neuroanatomy. Too low or too high levels of CBF can lead to the damage of cortical structure. In these regimes blood flow or metabolism strongly constrain neuroanatomy, and neuro-vascular coupling is effectively one-directional, from microvasculature to neurons (i.e., neurons cannot control blood flow). However, for the intermediate level of CBF there is a “window of metabolic opportunity,” where energy supplied by blood flow meets neuronal demands. In this regime, energetic constraint on neuroanatomy is soft, and there is a two-way signaling between microvasculature and neurons (i.e., neurons can control blood flow).
Conserved Parameters and Optimal Brain Function
Cerebral cortex has increased its volume and surface area during evolution, but its general neuroanatomical design is essentially conserved across mammals. Many cortical processes associated with connectivity and metabolism look very similar not only qualitatively but also quantitatively from the smallest to the largest species (Tables 1, 2). The fact that some parameters describing the brain are conserved may suggest that they are critical for the cerebral function, and thus may be optimal in some sense. However, we have only a vague clue about how this optimization works, despite several theoretical attempts (Ruppin et al., 1993; Cherniak, 1994; Murre and Sturdy, 1995; Karbowski, 2001, 2003; Chklovskii et al., 2002; Wen and Chklovskii, 2005; Kaiser and Hilgetag, 2006; Bassett et al., 2010). Specifically, we are uncertain about general principles governing cortical structure and function, and how to derive the cortical invariants from these principles. The possibilities range from minimization of temporal delays (Ringo et al., 1994; Chklovskii et al., 2002; Wen and Chklovskii, 2005), minimization of wiring length (Cherniak, 1994; Karbowski, 2001, 2003; Klyachko and Stevens, 2003), minimization of both wiring length and temporal delays (Wen et al., 2009; Budd et al., 2010), minimization of brain volume (Ruppin et al., 1993; Murre and Sturdy, 1995), minimization of both communication path and wiring length (Karbowski, 2001; Kaiser and Hilgetag, 2006), to maximization of information transfer under the energy constraint (Laughlin et al., 1998; Balasubramanian et al., 2001; Perge et al., 2011). It is likely that a single global principle does not exist, and instead cortical (brain) evolution is driven by a combination of “rules”, or evolutionary constraints of different sorts (Kaas, 2000; Laughlin and Sejnowski, 2003; Striedter, 2005). Such constraints often lead to conflicting outputs, which is associated with various trade-offs between structural and functional organization (Karbowski, 2001, 2003; Achard and Bullmore, 2007; Wang et al., 2008; Budd and Kisvarday, 2012; Bullmore and Sporns, 2012). Some of the emerging trade-offs are discussed further.
Cortical Connectivity and Allometric Scaling
Apart from a general functional role that cortical invariants might play, they also have interesting scaling consequences. As an example, we analyze the scaling of cortical connectivity, both microscopic and macroscopic, with brain size.
Let us start with the microscopic connectivity between neurons. We define an average probability of connection between two neurons as p = M/N, where M is the average number of synapses per neuron, and N is the total number of neurons in the cortex (Karbowski, 2001). An average synaptic density ρs is defined as ρs = NM/V, where V is the cortical volume, and an average neuron density ρn is defined as ρn = N/V. Thus, ρs/ρn = M and we can write that p = ρs/(ρnN) = ρs/(ρ2nV). Neuron density ρn decreases with cortical volume V as ρn ~ V−α, where the scaling exponent α is generally different for different mammalian orders, and takes values: α = 0.37 for rodents and α = 0.12 for primates (Herculano-Houzel, 2011b). Combining these results with the fact that ρs is scale invariant, we obtain that neural connectivity p scales with cortical volume as p ~ V2α − 1. In particular, for rodents we get p ~ V−0.26, while for primates we obtain p ~ V−0.76. These results imply that cortical networks at a microscopic level become sparser as they increase in size. The effect is more pronounced for very large primate brains. For example, for human cortex with N ~ 2· 1010 (Pakkenberg and Gundersen, 1997), and M ~ 3· 104 (DeFelipe et al., 2002) we get p ~ 10−6, whereas for mouse with N ~ 107 and M ~ 7· 103 (Braitenberg and Schüz, 1998) we obtain p ~ 7· 10−4. Thus, the average microscopic connectivity in the human cortex is about 1000 times smaller than that in the mouse cortex.
Interestingly, the number of capillaries per cortical volume and capillary length density also decline allometrically with brain size across mammals, although not that dramatically (Karbowski, 2011). The density of capillary number decreases as V−1/3, whereas the density of capillary length decreases slightly weaker, as V−1/6 (Karbowski, 2011). Specifically, between mouse and human these densities fall by factors of 18 and 3–4, respectively (Bell and Ball, 1985; Boero et al., 1999; Blinder et al., 2013). Thus, there is an apparent correlation between the decaying trends in cortical connectivity and capillary densities across mammals, which provides an additional support for a coupling between neuroanatomy and microvascular (metabolic) system.
On a macroscopic level the cerebral cortex is composed of functional areas, each containing many micro modules known as columns. The functional cortical areas have to be somehow connected for an efficient exchange and integration of information (Tononi and Edelman, 1998; Sporns, 2011). We can define the area-to-area cortical connectivity as a fraction of cortical areas “an average” area can connect directly. This connectivity measure was calculated using certain neuroanatomical data, with the conclusion that, at most, it only weakly decays with brain size (Karbowski, 2003). For instance, for mouse cortex the area-to-area connectivity was estimated as 0.30, while for human it was ~0.08, i.e., the human number is only four times smaller (Karbowski, 2003). These theoretical values are similar to the empirical values for cat and macaque monkey, which are respectively 0.27 (Scannell and Young, 1993; Scannell et al., 1995; Young et al., 1995) and 0.15 (Young, 1993; Young et al., 1995), despite large differences in brain sizes between these species. Overall, the probability of macroscopic connectivity is much higher than the probability of microscopic connectivity, which indicates that the nature of neural connections changes from mainly stochastic to mainly deterministic as the scale of description moves form microscopic to macroscopic. Moreover, these two levels of connectivity differ also in terms of allometric scaling, i.e., microscopic connectivity decreases much faster with increasing brain size than macroscopic does.
A related quantity to cortical connectivity is the so-called path length or a degree of cortical separation, which is associated more directly with the efficiency of communication in a network (Karbowski, 2001, 2003; Latora and Marchiori, 2001; Kaiser and Hilgetag, 2006; Achard and Bullmore, 2007). This quantity is defined as a smallest number of intermediate areas (or neurons) one has to visit to connect two arbitrary cortical areas (or neurons) along a given path (Sporns, 2011). It can be calculated either theoretically using some basic neuroanatomical data (Karbowski, 2003), or by analyzing actual connectivity data (Latora and Marchiori, 2001; Kaiser and Hilgetag, 2006). Both approaches yield very similar values of the average path length for cortical areas, around 2.0, which means that on average only one intermediate area is involved in the long-distance communication between two cortical regions. Interestingly, this value is essentially independent of brain size (Karbowski, 2003). The smallness of the cortical path length is one of the two characteristic features of the so-called “small world” networks (Watts and Strogatz, 1998). The other one is modularity or high level of clustering (Sporns, 2011). Both of them occur for the mammalian cerebral cortex (Hilgetag et al., 2000; Sporns et al., 2000), making it a small world network. In this type of architecture, local connectivity is dense, while long-range connectivity is sparser (Perin et al., 2011).
The pattern of cortical connectivity, especially that on the macroscopic level is probably very important for proper cortical functioning. There are many experimental studies suggesting that some mental disorders such as schizophrenia or autism are caused by altered long-range neural connectivity (McGlashan and Hoffman, 2000; Geschwind and Levitt, 2007). Similarly, problems with memory and learning in aged brains associated with Alzheimer disease have been linked to a decline in synaptic density (Rakic et al., 1994; Terry and Katzman, 2001). Taking these facts into account, one may hypothesize that the conserved (or almost conserved) parameters associated with connections, i.e., synaptic density and size, macroscopic connectivity or average cortical path length, are all critical for brain operation and might have been a subject of evolutionary optimization.
Trade-Offs Between Cortical Structure, Functionality, and Cost
One of the main consequences of the cortical conservation, which is not fully realized and appreciated, is the existence of trade-offs between structural design of the cortex, its cost, and a way the cortex can effectively process and store information. These trade-offs are present on micro-scale in axonal and dendritic arbors design (Wen et al., 2009; Budd et al., 2010; Cuntz et al., 2010; Snider et al., 2010; Teeter and Stevens, 2011), and on macro-scale in fiber pathways configurations (Bassett et al., 2010; Chen et al., 2013). Below, we briefly discuss some of the trade-offs.
Connectivity vs. metabolic cost
The analysis above shows that the connectivity between neurons decays quickly with brain size, which generally may not be beneficial for cortical communication because this decaying trend enhances neuronal isolation in bigger brains. To prevent a complete isolation, one would have to increase the length of axons and dendrites to place more synapses on them. However, such an enlargement of neural wiring leads to its larger surface area and volume. This, in turn, is associated with higher influx of Na+ ions that have to be pumped out, which costs additional energy. As a result, there exists some compromise between enhancing neural connectivity and reducing the consumption of metabolic energy, which is visible in microscopic and macroscopic patterns of wiring (Bassett et al., 2010; Cuntz et al., 2010; Snider et al., 2010; Teeter and Stevens, 2011; Chen et al., 2013). The connectivity vs. metabolism trade-off is also apparent in a formula for glucose metabolic rate CMR (derived in Karbowski, 2009, 2012), which contains an explicit term proportional to synaptic density. Because of that, one can say that transmission and storage of information in cortical circuits introduces some energy cost. That cost constitutes the majority of the neuronal energy budget (Harris et al., 2012; Karbowski, 2012).
Cortical path length vs. metabolic cost
Cortical path length is a measures of neuronal separation. If that separation is large, then the path length is large and interneuronal signal does not reach its target on time. That situation cannot be beneficial for an animal, which often has to respond fast to environmental inputs. Therefore it seems that evolution should keep the cortical path length as small as possible (Karbowski, 2001). However, the path length is negatively correlated with neural wiring, and decreasing the path length leads to the increase in the axon length (Karbowski, 2001; Kaiser and Hilgetag, 2006). This is undesirable, because longer axons mean higher metabolic expenditure. Thus, too short cortical path lengths may cost too much energy (Karbowski, 2001; Kaiser and Hilgetag, 2006).
Speed vs. metabolic cost
In a similar fashion, if we want to increase the speed of electric signals traveling along unmyelinated axons in gray matter, we need to increase axon thickness. This is because the conduction velocity of unmyelinated axons is proportional to the square root of axonal diameter (Hursh, 1939; for myelinated axons in white matter this relation is close to linear). Thus, increasing the speed two-fold requires four times thicker axons. With all other things unchanged, this leads to four-fold enhancement of cerebral metabolic rate in gray matter. Again, there is a compromise between increasing the speed of information transfer and saving metabolic energy. The speed of signal transmission along axons is related to temporal delays in the cortex. Generally, these delays should be as small as possible, otherwise the brain would not function coherently (Ringo et al., 1994; Chklovskii et al., 2002; Wen and Chklovskii, 2005; Wen et al., 2009; Budd et al., 2010).
Metabolic energy vs. cortical space
Energy available for neurophysiological processes in the cortex is not freely given, but instead it is restricted by the capillary size and glia number. In particular, cerebral metabolic rate is proportional to the fraction of cortical volume occupied by capillary length (Boero et al., 1999; Karbowski, 2011). Thus, for example, increasing energy for synaptic activity (e.g., for storing more memories) would have to be associated with increasing capillary volume and/or glia number in the cortex. But that would implicate less cortical space for other, more functional, neurophysiological processes including synapses, if we are to keep the total cortical volume unchanged. Clearly, energy delivery system needs some space, and this puts a constraint on the amount of possible metabolic rates that are required for cortical efficient function.
Neuron size (synaptic weight) vs. neuron activity
How neural spiking activity depends on brain size? Estimates based on cerebral metabolic data show that the average neural firing rate f declines with increasing brain size, with an allometric relationship f ~ V−0.15, where V is the cortical volume (Karbowski, 2009). The conclusion that lower firing rates are associated with larger brains is in agreement with general observations that physiological processes in larger mammals occur at a slower pace than they do in smaller mammals (Schmidt-Nielsen, 1984). This conclusion is also consistent with allometric data on the decaying trend of firing rates in avian peripheral nervous system (Hempleman et al., 2005).
Moreover, larger brains have neurons with longer fibers (Braitenberg and Schüz, 1998). If we assume that intersynaptic distance along axons and dendrites is invariant (Table 1), we consequently obtain that the number of synapses per neuron is inversely related to neuron's electric activity. Both of these results imply a trade-off between neuron's activity and its synaptic number (and neuron size), i.e., more synapses per neuron actually decrease postsynaptic neuron activity! This trade-off immediately suggests that average synaptic weight should decreases with increasing the number of synapses per neuron (otherwise firing rate would not decrease), or alternatively bigger brains probably have weaker synapses. These conclusions are in line with a computational study, based on developmental data, showing that average synaptic weight declines with firing rate across different mammals (Karbowski, 2012). Moreover, this type of trade-offs (synaptic weights vs. neuronal activity) are characteristic for homeostatic plasticity, which was discovered in slices of cortical circuits (Turrigiano et al., 1998; Turrigiano and Nelson, 2004).
Limitations of the Approach and Robustness of Invariants
The scaling approach across species taken in this review, as every approach, has its limitations. First, the available empirical data is limited. Therefore, the number of mammalian species used in the scaling plots, and thus the number of data points, is not large. This fact can potentially alter precise bounds of statistical confidence intervals used in describing the scaling trends. Second, each data point represents an average value for a given species. It is good to keep in mind that there is always some degree of variability among individuals of the same species or even across cortical regions of the same individual. Error bars in Table 1 indicate that most variability in our data is in the range 10–20%, and hence it does not seem to be large to affect the robustness of neuroanatomical invariants.
One has to realize that the two above limitations, i.e., small number of species and variability in parameters of interest, may in some cases preclude a clear-cut interpretation of the data. This is the case with surface density of neurons in the cortex, which initially was claimed to be invariant with respect to brain size (Rockel et al., 1980). This constancy was later disputed by others (Herculano-Houzel et al., 2008), and it still causes controversy (Carlo and Stevens, 2013; Young et al., 2013).
Role of Heat Released in Constraining Neuroanatomy
One of the consequences of metabolic processes in neurons is heat generated in the cerebral tissue (Erecinska et al., 2003; Sukstanskii and Yablonskiy, 2006; Kiyatkin, 2007). Since neuronal anatomy and metabolism are mutually related, it is interesting to ask if the heat could have any influence on the underlying cortical structure (Karbowski, 2009)? In particular, how is cortical wiring, i.e., diameters of intracortical axons and dendrites affected? It is known from the laws of thermodynamics that small objects warm up faster than larger ones, and hence one might suspect that axons could warm up excessively due to their small submicrometer diameter. However, this is not the case (Karbowski, 2009). Relatively large cerebral metabolic rates and small fiber diameters are still not enough to warm up the cortical tissue by more than a couple of degrees Celsius (Kiyatkin, 2007). This is mainly due to the circulating cerebral blood that cools the brain in its deeper regions (Karbowski, 2009). Therefore, it appears that temperature in the cortex is almost always well below a critical temperature leading to irreversible damage of neurons and synapses, which is 43–44°C (Karbowski, 2009), provided the environmental temperature is not too excessive. To reach that critical temperature the intracortical wiring would have to be at least ~10 times thinner (Karbowski, 2009). Similarly, the heat in the brain is not large enough to impose a limit on brain size, assuming that both cerebral metabolic rate and blood flow would scale for large hypothetical brains according to expectations given by the allometric scaling (Karbowski, 2009). Concluding, the heat generated in the brain is not the major constraint affecting neuronal wiring and brain size, in spite of previous suggestions (Falk, 1990).
Concluding Remarks
Despite a huge literature concerning cortical neuroanatomy and metabolism, these two subjects have been treated mostly separately in the neuroscience community. A few exceptions in evolutionary and developmental neuroscience dealt with a question of energetic limitations on brain size (Martin, 1981; Aiello and Wheeler, 1995; Isler and van Schaik, 2006; Karbowski, 2007; Navarrete et al., 2011), and with a possible relationship between synaptogenesis and metabolism (Huttenlocher and Dabholkar, 1997; Chugani, 1998; Karbowski, 2012). One of the aims of this review is to show that the mutual relationship between cortical structure and energy is much broader, especially at microscale. This paper discusses several neuroanatomical and metabolic characteristics that are conserved across mammals. Conservation in these two parallel organizations suggests their mutual coupling. In particular, since energy is a driving force of neural organization, and its available amount is always limited, it should constrain some neuroanatomical processes, most notably synapses and neural wiring. However, it is not clear how strong is this restriction. On one hand, there exists an energetic (hemodynamic) threshold below which cortical circuits biophysically degenerate and simply do not function (Martin et al., 1994, Figure 5). On the other hand, for energies supplied above that threshold, the energetic constraint seems to be soft, unless a huge amount of energy is delivered, which may be harmful for cortical structure. The reason for the softness in the intermediate regime is probably that energy cannot be the only evolutionary constraint acting on cortical architecture. Other, perhaps equally important constraints have a functional character and force cortical circuits to perform some functional computations, which requires energy and some other resources.
It is possible that constancy of some of the cortical parameters could be a result of an evolutionary optimization of metabolic, vascular and functional characteristics. However, as was shown above on several examples, any optimization procedure, i.e., maximization and/or minimization of one group of parameters, can lead to a suboptimal performance of another group. Therefore, it is argued that the observed cortical architecture is a result of structural, functional, and energetic compromises, which had to appear during a long evolutionary process.
The importance of metabolic and hemodynamic invariants discussed in this review may go well beyond traditional evolutionary and developmental neurobiology. For example, they can be used in mathematical models of brain activity, which practically neglect any conservation rules (Dayan and Abbott, 2001; Ermentrout and Terman, 2010). Their inclusion could make the models more realistic, and additionally might lead to some non-trivial computational findings regarding structure vs. function relationships. In particular, in models that consider synaptic plasticity and memory phenomena the energy constraint could be implemented. An interesting question would be, for example, what degree of plasticity and how much memory storage is allowed?
Conflict of Interest Statement
The author declares that the research was conducted in the absence of any commercial or financial relationships that could be construed as a potential conflict of interest.
Acknowledgments
The work was supported by the grant from the Polish Ministry of Science and Education (NN 518 409238), and partly by the Marie Curie Actions EU grant FP7-PEOPLE-2007-IRG-210538.
References
Achard, S., and Bullmore, E. (2007). Efficiency and cost of economical brain functional networks. PLoS Comput. Biol. 3:e17. doi: 10.1371/journal.pcbi.0030017
Aiello, L. C., and Wheeler, P. (1995). The expensive-tissue hypothesis: the brain and the digestive-system in human and primate evolution. Curr. Anthropol. 36, 199–221. doi: 10.1086/204350
Alle, H., Roth, A., and Geiger, J. R. P. (2009). Energy-efficient action potentials in hippocampal mossy fibers. Science 325, 1405–1408. doi: 10.1126/science.1174331
Ames, A. III. (2000). CNS energy metabolism as related to function. Brain Res. Rev. 34, 42–68. doi: 10.1016/S0165-0173(00)00038-2
Attwell, D., Buchan, A. N., Charpak, S., Lauritzen, M., MacVicar, B. A., and Newman, E. A. (2010). Glial and neuronal control of brain blood flow. Nature 468, 232–243. doi: 10.1038/nature09613
Attwell, D., and Laughlin, S. B. (2001). An energy budget for signaling in the gray matter of the brain. J. Cereb. Blood Flow Metab. 21, 1133–1145. doi: 10.1097/00004647-200110000-00001
Balasubramanian, V., Kimber, D., and Berry, M. J. II. (2001). Metabolically efficient information processing. Neural Comput. 13, 799–815. doi: 10.1162/089976601300014358
Bar, T. H. (1980). The vascular system of the cerebral cortex. Adv. Anat. Embryol. Cell Biol. 59, 71–84. doi: 10.1007/978-3-642-67432-7
Barton, R. A., and Harvey, P. H. (2000). Mosaic evolution of brain structure in mammals. Nature 405, 1055–1058. doi: 10.1038/35016580
Bassett, D. S., Greenfield, D. L., Meyer-Lindenberg, A., Weinberger, D. R., Moore, S. W., and Bullmore, E. T. (2010). Efficient physical embedding of topologically complex information processing networks in brains and computer circuits. PLoS Comput. Biol. 6:e1000748. doi: 10.1371/journal.pcbi.1000748
Belanger, M., Allaman, I., and Magistretti, P. J. (2011). Brain energy metabolism: focus on astrocyte-neuron metabolic cooperation. Cell Metabol. 14, 724–738. doi: 10.1016/j.cmet.2011.08.016
Bell, M. A., and Ball, M. J. (1985). Laminar variation in the microvascular architecture of normal human visual cortex (area 17). Brain Res. 335, 139–143. doi: 10.1016/0006-8993(85)90284-7
Benavides-Piccione, R., Fernaud-Espinosa, I., Robles, V., Yuste, R., and DeFelipe, J. (2013). Age-based comparison of human dendritic spine structure using complete three-dimensional reconstructions. Cereb. Cortex 23, 1798–1810. doi: 10.1093/cercor/bhs154
Binzegger, T., Douglas, R. J., and Martin, K. A. C. (2004). A quantitative map of the circuit of cat primary visual cortex. J. Neurosci. 24, 8441–8453. doi: 10.1523/JNEUROSCI.1400-04.2004
Blinder, P., Tsai, P. S., Kaufhold, J. P., Knutsen, P. M., Suhl, H., and Kleinfeld, D. (2013). The cortical angiome: an interconnected vascular network with noncolumnar patterns of blood flow. Nat. Neurosci. 16, 889–897. doi: 10.1038/nn.3426
Blue, M. E., and Parnavelas, J. G. (1983). The formation and maturation of synapses in the visual cortex of the rat. II. Quantitative analysis. J. Neurocytol. 12, 697–712. doi: 10.1007/BF01181526
Boero, J. A., Ascher, J., Arregui, A., Rovainen, C., and Woolsey, T. A. (1999). Increased brain capillaries in chronic hypoxia. J. Appl. Physiol. 86, 1211–1219.
Bourgeois, J. P., and Rakic, P. (1993). Changes of synaptic density in the primary visual cortex of the macaque monkey from fetal to adult stage. J. Neurosci. 13, 2801–2820.
Bourne, J. N., and Harris, K. M. (2011). Nanoscale analysis of structural synaptic plasticity. Curr. Opin. Neurobiol. 22, 372–382. doi: 10.1016/j.conb.2011.10.019
Braitenberg, V., and Schüz, A. (1998). Cortex: Statistics and Geometry of Neuronal Connectivity. Berlin: Springer. doi: 10.1007/978-3-662-03733-1
Budd, J. M. L., and Kisvarday, Z. F. (2012). Communication and wiring in the cortical connectome. Front. Neuroanat. 6:42. doi: 10.3389/fnana.2012.00042
Budd, J. M. L., Kovacs, K., Ferecsko, A. S., Buzas, P., Eysel, U. T., and Kisvarday, Z. F. (2010). Neocortical axon arbors trade-off material and conduction delay conservation. PLoS Comput. Biol. 6:e1000711. doi: 10.1371/journal.pcbi.1000711
Bullmore, E., and Sporns, O. (2012). The economy of brain network organization. Nat. Rev. Neurosci. 13, 336–349. doi: 10.1038/nrn3214
Buxhoeveden, D. P., and Casanova, M. F. (2002). The minicolumn hypothesis in neuroscience: a review. Brain 125, 935–951. doi: 10.1093/brain/awf110
Buxton, R. B., and Frank, L. R. (1997). A model of the coupling between cerebral blood flow and oxygen metabolism during neural stimulation. J. Cereb. Blood Flow Metab. 17, 64–72. doi: 10.1097/00004647-199701000-00009
Carlo, C. N., and Stevens, C. F. (2013). Structural uniformity of neocortex, revisited. Proc. Natl. Acad. Sci. U.S.A. 110, 1488–1493. doi: 10.1073/pnas.1221398110
Chen, Y., Wang, S., Hilgetag, C. C., and Zhou, C. (2013). Trade-off between multiple constraints enables simultaneous formation of modules and hubs in neural systems. PLoS Comput. Biol. 9:e1002937. doi: 10.1371/journal.pcbi.1002937
Chetelat, G., Landeau, B., Salmon, E., Yakushev, I., Bahri, M. A., Mezenge, F., et al. (2013). Relationships between brain metabolism decrease in normal aging and changes in structural and functional connectivity. Neuroimage 76, 167–177. doi: 10.1016/j.neuroimage.2013.03.009
Chklovskii, D. B. (2004). Synaptic connectivity and neuronal morphology: two sides of the same coin. Neuron 43, 609–617. doi: 10.1016/S0896-6273(04)00498-2
Chklovskii, D. B., Schikorski, T., and Stevens, C. F. (2002). Wiring optimization in cortical circuits. Neuron 43, 341–347. doi: 10.1016/S0896-6273(02)00679-7
Chugani, H. T. (1998). A critical period of brain development: studies of cerebral glucose utilization with PET. Prevent. Med. 27, 184–188. doi: 10.1006/pmed.1998.0274
Chugani, H. T., Hovda, D. A., Villablanca, J. R., Phelps, M. E., and Xu, W. F. (1991). Metabolic maturation of the brain: a study of local cerebral glucose utilization in the developing cat. J. Cereb. Blood Flow Metab. 11, 35–47. doi: 10.1038/jcbfm.1991.4
Chugani, H. T., and Phelps, M. E. (1986). Maturational changes in cerebral function in infants determined by 18FDG positron emission tomography. Science 231, 840–843. doi: 10.1126/science.3945811
Clark, D. A., Mitra, P. P., and Wang, S. S. H. (2001). Scalable architecture in mammalian brains. Nature 411, 189–193. doi: 10.1038/35075564
Cragg, B. G. (1975). The development of synapses in kitten visual cortex during visual deprivation. Exp. Neurol. 46, 445–451. doi: 10.1016/0014-4886(75)90118-1
Cuntz, H., Forstner, F., Borst, A., and Hausser, M. (2010). One rule to grow them all: a general theory of neuronal branching and its practical application. PloS Comput. Biol. 6:e1000877. doi: 10.1371/journal.pcbi.1000877
Dayan, P., and Abbott, L. F. (2001). Theoretical Neuroscience. Cambridge, MA: MIT Press. doi: 10.1016/S0306-4522(00)00552-2
DeFelipe, J., Alonso-Nanclares, L., and Avellano, J. (2002). Microstructure of the neocortex: comparative aspects. J. Neurocytol. 31, 299–316. doi: 10.1023/A:1024130211265
DeFelipe, J., Marco, P., Fairen, A., and Jones, E. G. (1997). Inhibitory synaptogenesis in mouse somatosensory cortex. Cereb. Cortex 7, 619–634. doi: 10.1093/cercor/7.7.619
de Vasconcelos, A. P., Ferrandon, A., and Nehlig, A. (2002). Local cerebral blood flow during lithium-pilocarpine seizures in the developing and adult rat: role of coupling between blood flow and metabolism in the genesis of neuronal damage. J. Cereb. Blood Flow Metab. 22, 196–205. doi: 10.1097/00004647-200202000-00007
De Winter, W., and Oxnard, C. E. (2001). Evolutionary radiations and convergences in the structural organization of mammalian brains. Nature 409, 710–714. doi: 10.1038/35055547
Douglas, R. J., and Martin, K. A. (2004). Neuronal circuits of the neocortex. Annu. Rev. Neurosci. 27, 419–451. doi: 10.1146/annurev.neuro.27.070203.144152
Elston, G. N., Benavides-Piccione, R., Elston, A., Manger, P. R., and DeFelipe, J. (2011). Pyramidal cells in prefrontal cortex of primates: marked differences in neuronal structure among species. Front. Neuroanat. 5:2. doi: 10.3389/fnana.2011.00002
Erecinska, M., and Silver, I. A. (1989). ATP and brain function. J. Cereb. Blood Flow Metab. 9, 2–19. doi: 10.1038/jcbfm.1989.2
Erecinska, M., and Silver, I. A. (2001). Tissue oxygen tension and brain sensitivity to hypoxia. Resp. Physiol. 128, 263–276. doi: 10.1016/S0034-5687(01)00306-1
Erecinska, M., Thoresen, M., and Silver, I. A. (2003). Effects of hypothermia on energy metabolism in mammalian central nervous system. J. Cereb. Blood Flow Metab. 23, 513–530. doi: 10.1097/01.WCB.0000066287.21705.21
Ermentrout, B., and Terman, D. (2010). Mathematical Foundations of Neuroscience. New York, NY: Springer. doi: 10.1007/978-0-387-87708-2
Escobar, G., Fares, T., and Stepanyants, A. (2008). Structural plasticity of circuits in cortical neuropil. J. Neurosci. 28, 8477–8488. doi: 10.1523/JNEUROSCI.2046-08.2008
Falk, D. (1990). Brain evolution in homo: the “radiator” theory. Behav. Brain Sci. 13, 333–381. doi: 10.1017/S0140525X00078973
Finlay, B. L., and Darlington, R. B. (1995). Linked regularities in the development and evolution of mammalian brains. Science 268, 1578–1584. doi: 10.1126/science.7777856
Geschwind, D. H., and Levitt, P. (2007). Autism spectrum disorders: developmental disconnection syndromes. Curr. Opin. Neurobiol. 17, 103–111. doi: 10.1016/j.conb.2007.01.009
Glezer, I. L., and Morgane, P. J. (1990). Ultrastructure of synapses and Golgi analysis of neurons in the neocortex of the lateral gyrus (visual cortex) of the dolphin and pilot whale. Brain Res. Bull. 24, 401–427. doi: 10.1016/0361-9230(90)90096-I
Haider, B., Duque, A., Hasenstaub, A. R., and McCormick, D. A. (2006). Neocortical network activity in vivo is generated through a dynamic balance of excitation and inhibition. J. Neurosci. 26, 4535–4545. doi: 10.1523/JNEUROSCI.5297-05.2006
Hakeem, A. Y., Hof, P. R., Sherwood, C. C., Switzer, R. C. 3rd., Rasmussen, L. E., and Allman, J. M. (2005). Brain of the African elephant (Loxodonta africana): neuroanatomy from magnetic resonance images. Anatom. Rec. A 287A, 1117–1127. doi: 10.1002/ar.a.20255
Harris, J. J., Jolivet, R., and Attwell, D. (2012). Synaptic energy use and supply. Neuron 75, 762–777. doi: 10.1016/j.neuron.2012.08.019
Hassiotis, M., Paxinos, G., and Ashwell, K. W. (2003). The anatomy of the cerebral cortex of the echidna (Tachyglossus aculeatus). Comp. Biochem. Physiol. 136, 827–850. doi: 10.1016/S1095-6433(03)00166-1
Hassiotis, M., Paxinos, G., and Ashwell, K. W. (2005). Cyto- and chemoarchitecture of the cerebral cortex of an echidna (Tachyglossus aculeatus). II. Laminar organization and synaptic density. J. Comp. Neurol. 482, 94–122. doi: 10.1002/cne.20353
Haug, H. (1987). Brain sizes, surfaces, and neuronal sizes of the cortex cerebri: a stereological investigation of Man and his variability and a comparison with some mammals (primates, whales, marsupials, insectivores, and one elephant). Am. J. Anat. 180, 126–142. doi: 10.1002/aja.1001800203
Heiss, W. D. (1983). Flow threshold of functional and morphological damage of brain tissue. Stroke 14, 329–331. doi: 10.1161/01.STR.14.3.329
Hempleman, S. C., Kilgore, D. L., Colby, C., Bavis, R. W., and Powell, F. L. (2005). Spike firing allometry in avian intrapulmonary chemoreceptors: matching neural code to body size. J. Exp. Biol. 208, 3065–3073. doi: 10.1242/jeb.01752
Herculano-Houzel, S. (2011a). Not all brains are made the same: new views on brain scaling in evolution. Brain Behav. Evol. 78, 22–36. doi: 10.1159/000327318
Herculano-Houzel, S. (2011b). Scaling of brain metabolism with a fixed energy budget per neuron: implications for neuronal activity, plasticity, and evolution. PLoS ONE 6:e17514. doi: 10.1371/journal.pone.0017514
Herculano-Houzel, S. (2012). The remarkable, yet not extraordinary, human brain as a scaled-up primate brain and its associated cost. Proc. Natl. Acad. Sci. U.S.A. 109, 10661–10668. doi: 10.1073/pnas.1201895109
Herculano-Houzel, S., Collins, C. E., Wong, P., Kaas, J. H., and Lent, R. (2008). The basic nonuniformity of the cerebral cortex. Proc. Natl. Acad. Sci. U.S.A. 105, 12593–12598. doi: 10.1073/pnas.0805417105
Hilgetag, C. C., Burns, G. A., O'Neill, M. A., Scannell, J. W., and Young, M. P. (2000). Anatomical connectivity defines the organization of clusters of cortical areas in the macaque monkey and the cat. Phil. Trans. R. Soc. B 355, 91–110. doi: 10.1098/rstb.2000.0551
Hofman, M. A. (1988). Size and shape of the cerebral cortex in mammals. II. The cortical volume. Brain Behav. Evol. 32, 17–26. doi: 10.1159/000116529
Hofman, M. A. (1989). On the evolution and geometry of the brain in mammals. Prog. Neurobiol. 32, 137–158. doi: 10.1016/0301-0082(89)90013-0
Hursh, J. B. (1939). Conduction velocity and diameter of nerve fibers. Am. J. Physiol. 127, 131–139.
Huttenlocher, P. R., and Dabholkar, A. S. (1997). Regional differences in synaptogenesis in human cerebral cortex. J. Comp. Neurol. 387, 167–178. doi: 10.1002/(SICI)1096-9861(19971020)387:2<167::AID-CNE1>3.0.CO;2-Z
Hyder, F., Rothman, D. L., and Bennett, M. R. (2013). Cortical energy demands of signaling and nonsignaling components in brain are conserved across mammalian species and activity levels. Proc. Natl. Acad. Sci. U.S.A. 110, 3549–3554. doi: 10.1073/pnas.1214912110
Hyder, F., Shulman, R. G., and Rothman, D. L. (1998). A model for the regulation of cerebral oxygen delivery. J. Appl. Physiol. 85, 554–564.
Iadecola, C. (2004). Neurovascular regulation in the normal brain and in Alzheimer's disease. Nat. Rev. Neurosci. 5, 347–360. doi: 10.1038/nrn1387
Ingvar, M. (1986). Cerebral blood flow and metabolic rate during seizures: relationship to epileptic brain damage. Ann. N.Y. Acad. Sci. 462, 207–223. doi: 10.1111/j.1749-6632.1986.tb51254.x
Isler, K., and van Schaik, C. P. (2006). Metabolic cost of brain size evolution. Biol. Lett. 2, 557–560. doi: 10.1098/rsbl.2006.0538
Kaas, J. H. (2000). Why is brain size so important: design problems and solutions as neocortex gets bigger or smaller. Brain Mind 1, 7–23. doi: 10.1023/A:1010028405318
Kaiser, M., and Hilgetag, C. C. (2006). Nonoptimal component placement, but short processing paths, due to long-distance projections in neural systems. PLoS Comput. Biol. 2:e95. doi: 10.1371/journal.pcbi.0020095
Kandel, E. R., Schwartz, J. H., and Jessell, T. M. (1991). Principles of Neural Science. Norwalk, CT: Appleton and Lange.
Karbowski, J. (2001). Optimal wiring principle and plateaus in the degree of separation for cortical neurons. Phys. Rev. Lett. 86, 3674–3677. doi: 10.1103/PhysRevLett.86.3674
Karbowski, J. (2003). How does connectivity between cortical areas depend on brain size? Implications for efficient computation. J. Comput. Neurosci. 15, 347–356. doi: 10.1023/A:1027467911225
Karbowski, J. (2007). Global and regional brain metabolic scaling and its functional consequences. BMC Biol. 5:18. doi: 10.1186/1741-7007-5-18
Karbowski, J. (2009). Thermodynamic constraints on neural dimensions, firing rates, brain temperature and size. J. Comput. Neurosci. 27, 415–436. doi: 10.1007/s10827-009-0153-7
Karbowski, J. (2011). Scaling of brain metabolism and blood flow in relation to capillary and neural scaling. PLoS ONE 6:e26709. doi: 10.1371/journal.pone.0026709
Karbowski, J. (2012). Approximate invariance of metabolic energy per synapse during development in mammalian brains. PLoS ONE 7:e33425. doi: 10.1371/journal.pone.0033425
Kasai, H., Fukuda, M., Watanabe, S., Hayashi-Takagi, A., and Noguchi, J. (2010). Structural dynamics of dendritic spines in memory and cognition. Trends Neurosci. 33, 121–129. doi: 10.1016/j.tins.2010.01.001
Kiyatkin, E. A. (2007). Brain temperature fluctuations during physiological and pathological conditions. Eur. J. Appl. Physiol. 101, 3–17. doi: 10.1007/s00421-007-0450-7
Klein, B., Kuschinsky, W., Schrock, H., and Vetterlein, F. (1986). Interdependency of local capillary density, blood flow, and metabolism in rat brain. Am. J. Physiol. 251, H1333–H1340.
Klyachko, V. A., and Stevens, C. F. (2003). Connectivity optimization and the positioning of cortical areas. Proc. Natl. Acad. Sci. U.S.A. 100, 7937–7941. doi: 10.1073/pnas.0932745100
Krogh, A. (1929). The Anatomy and Physiology of Capillaries, 2nd Edn. New Haven, CT: Yale University Press. doi: 10.1007/978-3-662-36692-9
Krubitzer, L. (1995). The organization of neocortex in mammals: are species differences really so different? Trends Neurosci. 18, 408–417. doi: 10.1016/0166-2236(95)93938-T
Latora, V., and Marchiori, M. (2001). Efficient behavior of small-world networks. Phys. Rev. Lett. 87, 198701. doi: 10.1103/PhysRevLett.87.198701
Laughlin, S. B., de Ruyter van Steveninck, R. R., and Anderson, J. C. (1998). The metabolic cost of neural information. Nat. Neurosci. 1, 36–41. doi: 10.1038/236
Laughlin, S. B., and Sejnowski, T. J. (2003). Communication in neuronal networks. Science 301, 1870–1874. doi: 10.1126/science.1089662
Lennie, P. (2003). The cost of cortical computation. Curr. Biol. 13, 493–497. doi: 10.1016/S0960-9822(03)00135-0
Loewenstein, Y., Kuras, A., and Rumpel, S. (2011). Multiplicative dynamics underlie the emergence of the log-normal distribution of spine sizes in the neocortex in vivo. J. Neurosci. 31, 9481–9488. doi: 10.1523/JNEUROSCI.6130-10.2011
Logothetis, N. K. (2008). What we can do and what we cannot do with fMRI. Nature 453, 869–878. doi: 10.1038/nature06976
Magistretti, P. J. (2006). Neuron-glia metabolic coupling and plasticity. J. Exp. Biol. 209, 2304–2311. doi: 10.1242/jeb.02208
Mainen, Z., and Sejnowski, T. (1996). Influence of dendritic structure on firing patterns in model neocortical neurons. Nature 382, 363–366. doi: 10.1038/382363a0
Martin, R. D. (1981). Relative brain size and basal metabolic rate in terrestrial vertebrates. Nature 293, 57–60. doi: 10.1038/293057a0
Martin, R. L., Lloyd, H. G., and Cowan, A. I. (1994). The early events of oxygen and glucose deprivation: setting the scene for neuronal death? Trends Neurosci. 17, 251–257. doi: 10.1016/0166-2236(94)90008-6
Mathers, L. H. (1979). Postnatal dendritic development in the rabbit visual cortex. Brain Res. 168, 21–29. doi: 10.1016/0006-8993(79)90125-2
McCaslin, A. F. H., Chen, B. R., Radosevich, A. J., Cauli, B., and Hillman, E. M. C. (2011). In vivo 3D morphology of astrocyte-vasculature interactions in the somatosensory cortex: implications for neurovascular coupling. J. Cereb. Blood Flow Metabol. 31, 795–806. doi: 10.1038/jcbfm.2010.204
McGlashan, T. H., and Hoffman, R. E. (2000). Schizophrenia as a disorder of developmentally reduced synaptic connectivity. Arch. Gen. Psychiatry 57, 637–648. doi: 10.1001/archpsyc.57.7.637
McNab, B. K., and Eisenberg, J. F. (1989). Brain size and its relation to the rate of metabolism in mammals. Am. Nat. 133, 157–167. doi: 10.1086/284907
Miller, B., Nagy, D., Finlay, B. L., Chance, B., Kobayashi, A., and Nioka, S. (1993). Consequences of reduced cerebral blood flow in brain development: I. Gross morphology, histology, and callosal connectivity. Exp. Neurol. 124, 326–342. doi: 10.1006/exnr.1993.1203
Mink, J. W., Blumenschine, R. J., and Adams, D. B. (1981). Ratio of central nervous system to body metabolism in vertebrates: its constancy and functional basis. Am. J. Physiol. 241, R203–R212.
Moore, C. I., and Cao, R. (2008). The hemo-neural hypothesis: on the role of blood flow in information processing. J. Neurophysiol. 99, 2035–2047. doi: 10.1152/jn.01366.2006
Mountcastle, V. B., Davies, P. W., and Berman, A. L. (1957). Response properties of neurons of cats somatic sensory cortex to peripheral stimuli. J. Neurophysiol. 20, 374–407.
Muir, D. R., and Douglas, R. J. (2011). From neural arbors to daisies. Cereb. Cortex 21, 1118–1133. doi: 10.1093/cercor/bhq184
Murre, J. M. J., and Sturdy, D. P. F. (1995). The connectivity of the brain: multilevel quantitative analysis. Biol. Cybern. 73, 529–545. doi: 10.1007/BF00199545
Navarrete, A., van Schaik, C. P., and Isler, K. (2011). Energetics and the evolution of human brain size. Nature 480, 91–93. doi: 10.1038/nature10629
Nedergaard, M., Ransom, B., and Goldman, S. A. (2003). New roles for astrocytes: redefining the functional architecture of the brain. Trends Neurosci. 26, 523–530. doi: 10.1016/j.tins.2003.08.008
Niven, J. E., and Laughlin, S. B. (2008). Energy limitation as a selective pressure on the evolution of sensory systems. J. Exp. Biol. 211, 1792–1804. doi: 10.1242/jeb.017574
Noda, A., Ohba, H., Kakiuchi, T., Futatsubashi, M., Tsukada, H., and Nishimura, S. (2002). Age-related changes in cerebral blood flow and glucose metabolism in conscious rhesus monkeys. Brain Res. 936, 76–81. doi: 10.1016/S0006-8993(02)02558-1
Oberheim, N. A., Wang, X., Goldman, S., and Nedergaard, M. (2006). Astrocytes complexity distinguishes the human brain. Trends Neurosci. 29, 547–553. doi: 10.1016/j.tins.2006.08.004
O'Kusky, J., and Colonnier, M. (1982). A laminar analysis of the number of neurons, glia, and synapses in the visual cortex (area 17) of adult macaque monkey. J. Comp. Neurol. 210, 278–290. doi: 10.1002/cne.902100308
Olivares, R., Montiel, J., and Aboitiz, F. (2001). Species differences and similarities in the fine structure of the mammalian corpus callosum. Brain Behav. Evol. 57, 98–105. doi: 10.1159/000047229
Olney, J. W., Collins, R. C., and Sloviter, R. S. (1986). Excitotoxic mechanisms of epileptic brain damage. Adv. Neurol. 44, 857–877.
Pakkenberg, B., and Gundersen, H. J. (1997). Neocortical neuron number in humans: effect of sex and age. J. Comp. Neurol. 384, 312–320. doi: 10.1002/(SICI)1096-9861(19970728)384:2<312::AID-CNE10>3.0.CO;2-K
Perge, J. A., Niven, J. E., Mugnaini, E., Balasubramanian, V., and Sterling, P. (2011). Why do axons differ in caliber? J. Neurosci. 32, 626–638. doi: 10.1523/JNEUROSCI.4254-11.2012
Perin, R., Berger, T. K., and Markram, H. (2011). A synaptic organizing principle for cortical neuronal groups. Proc. Natl. Acad. Sci. U.S.A. 108, 5419–5424. doi: 10.1073/pnas.1016051108
Peters, A., Sethares, C., and Luebke, J. I. (2008). Synapses are lost during aging in the primate prefrontal cortex. Neuroscience 152, 970–981. doi: 10.1016/j.neuroscience.2007.07.014
Raichle, M. E. (1983). The pathophysiology of brain ischemia. Ann. Neurol. 13, 2–10. doi: 10.1002/ana.410130103
Raj, A., and Chen, Y.-H. (2011). The wiring economy principle: connectivity determines anatomy in the human brain. PLoS ONE 6:e14832. doi: 10.1371/journal.pone.0014832
Rakic, P. (2009). Evolution of the neocortex: a perspective from developmental biology. Nat. Rev. Neurosci. 10, 724–735. doi: 10.1038/nrn2719
Rakic, P., Bourgeois, J. P., and Goldman-Rakic, P. S. (1994). Synaptic development of the cerebral cortex: implications for learning, memory, and mental illness. Prog. Brain Res. 102, 227–243. doi: 10.1016/S0079-6123(08)60543-9
Ringo, J. L., Doty, R. W., Demeter, S., and Simard, P. Y. (1994). Time is of the essence: a conjecture that hemispheric specialization arises from interhemispheric conduction delay. Cereb. Cortex 4, 331–343. doi: 10.1093/cercor/4.4.331
Rockel, A. J., Hiorns, R. W., and Powell, T. P. S. (1980). The basic uniformity in structure of the neocortex. Brain 103, 221–244. doi: 10.1093/brain/103.2.221
Ruppin, E., Schwartz, E. L., and Yeshurun, Y. (1993). Examining the volume efficiency of the cortical architecture in a multi-processor network model. Biol. Cybern. 70, 89–94. doi: 10.1007/BF00202570
Scannell, J. W., and Young, M. P. (1993). The connectional organization of neural systems in the cat cerebral cortex. Curr. Biol. 3, 199–200. doi: 10.1016/0960-9822(93)90331-H
Scannell, J. W., Young, M. P., and Blakemore, C. (1995). Analysis of connectivity in the cat cerebral cortex. J. Neurosci. 15, 1463–1483.
Scheff, S. W., Price, D. A., and Sparks, D. L. (2001). Quantitative assessment of possible age-related change in synaptic numbers in the human frontal cortex. Neurobiol. Aging 22, 355–365. doi: 10.1016/S0197-4580(01)00222-6
Schmidt-Nielsen, K. (1984). Scaling: Why Is Animal Size So Important? Cambridge: Cambridge University Press. doi: 10.1017/CBO9781139167826
Shoshani, J., Kupsky, W. J., and Marchant, G. H. (2006). Elephant brain. Part I: gross morphology, functions, comparative anatomy, and evolution. Brain Res. Bull. 70, 124–157. doi: 10.1016/j.brainresbull.2006.03.016
Snider, J., Pillai, A., and Stevens, C. F. (2010). A universal property of axonal and dendritic arbors. Neuron 66, 45–56. doi: 10.1016/j.neuron.2010.02.013
Sporns, O., Tononi, G., and Edelman, G. M. (2000). Theoretical neuroanatomy: relating anatomical and functional connectivity in graphs and cortical connection matrices. Cereb. Cortex 10, 127–141. doi: 10.1093/cercor/10.2.127
Sukstanskii, A. L., and Yablonskiy, D. A. (2006). Theoretical model of temperature regulation in the brain during changes in functional activity. Proc. Natl. Acad. Sci. U.S.A. 103, 12144–12149. doi: 10.1073/pnas.0604376103
Szentagothai, J. (1978). The neuron network of the cerebral cortex: a functional interpretation. Proc. R. Soc. Lond. B 201, 219–248. doi: 10.1098/rspb.1978.0043
Teeter, C. M., and Stevens, C. F. (2011). A general principle of neural arbor branch density. Curr. Biol. 21, 2105–2108. doi: 10.1016/j.cub.2011.11.013
Terry, R. D., and Katzman, R. (2001). Life span and synapses: will there be a primary senile dementia? Neurobiol. Aging 22, 347–348. doi: 10.1016/S0197-4580(00)00250-5
Tieman, S. B., Mollers, S., Tieman, D. G., and White, J. (2004). The blood supply of cat's visual cortex and its postnatal development. Brain Res. 998, 100–112. doi: 10.1016/j.brainres.2003.11.023
Tononi, G., and Edelman, G. M. (1998). Consciousness and complexity. Science 282, 1846–1851. doi: 10.1126/science.282.5395.1846
Tsai, P. S., Kaufhold, J. P., Blinder, P., Friedman, B., Drew, P. J., Karten, H. J., et al. (2009). Correlations of neuronal and microvascular densities in murine cortex revealed by direct counting and colocalization of nuclei and vessels. J. Neurosci. 29, 14553–14570. doi: 10.1523/JNEUROSCI.3287-09.2009
Turrigiano, G. G., Leslie, K. R., Desai, N. S., Rutherford, L. C., and Nelson, S. B. (1998). Activity-dependent scaling of quantal amplitude in neocortical neurons. Nature 391, 892–896. doi: 10.1038/36103
Turrigiano, G. G., and Nelson, S. B. (2004). Homeostatic plasticity in the developing nervous system. Nat. Rev. Neurosci. 5, 97–107. doi: 10.1038/nrn1327
Wang, S. S. H., Shultz, J. R., Burish, M. J., Harrison, K. H., Hof, P. R., Towns, L. C., et al. (2008). Functional trade-offs in white matter axonal scaling. J. Neurosci. 28, 4047–4056. doi: 10.1523/JNEUROSCI.5559-05.2008
Watts, D. J., and Strogatz, S. H. (1998). Collective dynamics of “small-world” networks. Nature 393, 440–442. doi: 10.1038/30918
Weber, B., Keller, A. L., Reichold, J., and Logothetis, N. K. (2008). The microvascular system of the striate and extrastriate visual cortex of the macaque. Cereb. Cortex 18, 2318–2330. doi: 10.1093/cercor/bhm259
Weibel, E. R., Taylor, C. R., and Hoppeler, H. (1991). The concept of symmorphosis: a testable hypothesis of structure-function relationship. Proc. Natl. Acad. Sci. U.S.A. 88, 10357–10361. doi: 10.1073/pnas.88.22.10357
Wen, Q., and Chklovskii, D. B. (2005). Segregation of the brain into gray and white matter: a design minimizing conduction delays. PLoS Comput. Biol. 1:e78. doi: 10.1371/journal.pcbi.0010078
Wen, Q., Stepanyants, A., Elston, G. N., Grosberg, A. Y., and Chklovskii, D. B. (2009). Maximization of the connectivity repertoire as a statistical principle governing the shapes of dendritic arbors. Proc. Natl. Acad. Sci. U.S.A. 106, 12536–12541. doi: 10.1073/pnas.0901530106
West, G. B., Brown, J. H., and Enquist, B. J. (1997). A general model for the origin of allometric scaling laws in biology. Science 276, 122–126. doi: 10.1126/science.276.5309.122
Winfield, D. A. (1981). The postnatal development of synapses in the visual cortex of the cat and the effects of eyelid closure. Brain Res. 206, 166–171. doi: 10.1016/0006-8993(81)90110-4
Van Hooser, S. D., Heimel, J. A., Chung, S., and Nelson, S. B. (2006). Lack of patchy horizontal connectivity in primary visual cortex of a mammal without orientation maps. J. Neurosci. 26, 7680–7692. doi: 10.1523/JNEUROSCI.0108-06.2006
Van Vreeswijk, C., and Sompolinsky, H. (1996). Chaos in neuronal networks with balanced excitatory and inhibitory activity. Science 274, 1724–1726. doi: 10.1126/science.274.5293.1724
Vogels, T. P., Sprekeler, H., Zenke, F., Clopath, C., and Gerstner, W. (2011). Inhibitory plasticity balances excitation and inhibition in sensory pathways and memory networks. Science 334, 1569–1573. doi: 10.1126/science.1211095
Vrensen, G., De Groot, D., and Nunes-Cardozo, J. (1977). Postnatal development of neurons and synapses in the visual and motor cortex of rabbits: a quantitative light and electron microscopic study. Brain Res. Bull. 2, 405–416. doi: 10.1016/0361-9230(77)90050-8
Young, M. P. (1993). The organization of neural systems in the primate cerebral cortex. Proc. Roy. Soc. B 252, 13–18. doi: 10.1098/rspb.1993.0040
Young, M. P., Scannell, J. W., and Burns, G. (1995). The Analysis of Cortical Connectivity. Austin, TX: Landes.
Young, N. A., Collins, C. E., and Kaas, J. H. (2013). Cell and neuron densities in the primary motor cortex of primates. Front. Neural Circ. 7:30. doi: 10.3389/fncir.2013.00030
Keywords: cerebral cortex, conservation, connectivity, metabolism, capillary, constraints, allometry, evolutionary design
Citation: Karbowski J (2014) Constancy and trade-offs in the neuroanatomical and metabolic design of the cerebral cortex. Front. Neural Circuits 8:9. doi: 10.3389/fncir. 2014.00009
Received: 11 July 2013; Accepted: 23 January 2014;
Published online: 11 February 2014.
Edited by:
Charles F. Stevens, The Salk Institute for Biological Studies, USAReviewed by:
Julian Budd, University of Sussex, UKPrakash Kara, Medical University of South Carolina, USA
Copyright © 2014 Karbowski. This is an open-access article distributed under the terms of the Creative Commons Attribution License (CC BY). The use, distribution or reproduction in other forums is permitted, provided the original author(s) or licensor are credited and that the original publication in this journal is cited, in accordance with accepted academic practice. No use, distribution or reproduction is permitted which does not comply with these terms.
*Correspondence: Jan Karbowski, Nalecz Institute of Biocybernetics and Biomedical Engineering, Polish Academy of Sciences, ul. Trojdena 4, 02-109 Warsaw, Poland e-mail:amthcmJvd3NraUBkdWNoLm1pbXV3LmVkdS5wbA==;amthcmJAaXRzLmNhbHRlY2guZWR1