 David Eriksson1,2*
- 1Center for Neuroscience, Albert Ludwig University of Freiburg, Freiburg, Germany
- 2BrainLinks-BrainTools, Albert Ludwig University of Freiburg, Freiburg, Germany
In the last 20 years there has been an increased interest in estimating signals that are sent between neurons and brain areas. During this time many new methods have appeared for measuring those signals. Here we review a wide range of methods for which connected neurons can be identified anatomically, by tracing axons that run between the cells, or functionally, by detecting if the activity of two neurons are correlated with a short lag. The signals that are sent between the neurons are represented by the activity in the neurons that are connected to the target population or by the activity at the corresponding synapses. The different methods not only differ in the accuracy of the signal measurement but they also differ in the type of signal being measured. For example, unselective recording of all neurons in the source population encompasses more indirect pathways to the target population than if one selectively record from the neurons that project to the target population. Infact, this degree of selectivity is similar to that of optogenetic perturbations; one can perturb selectively or unselectively. Thus it becomes possible to match a given signal measurement method with a signal perturbation method, something that allows for an exact input control to any neuronal population.
Introduction
Ideally the neuroscientist ought to understand how all the inputs to a population affect its output activity (Jonas and Kording, 2016). A pragmatic version of this goal is to compare the importance of one specific input (S), to all remaining inputs (B) in generating the output activity in population (T; Figure 1A). The background input (B) can potentially be estimated using optogenetic inhibition (Eriksson, 2016). Here we will review methods for estimating the complementary specific input signal which originates from the source population (S).
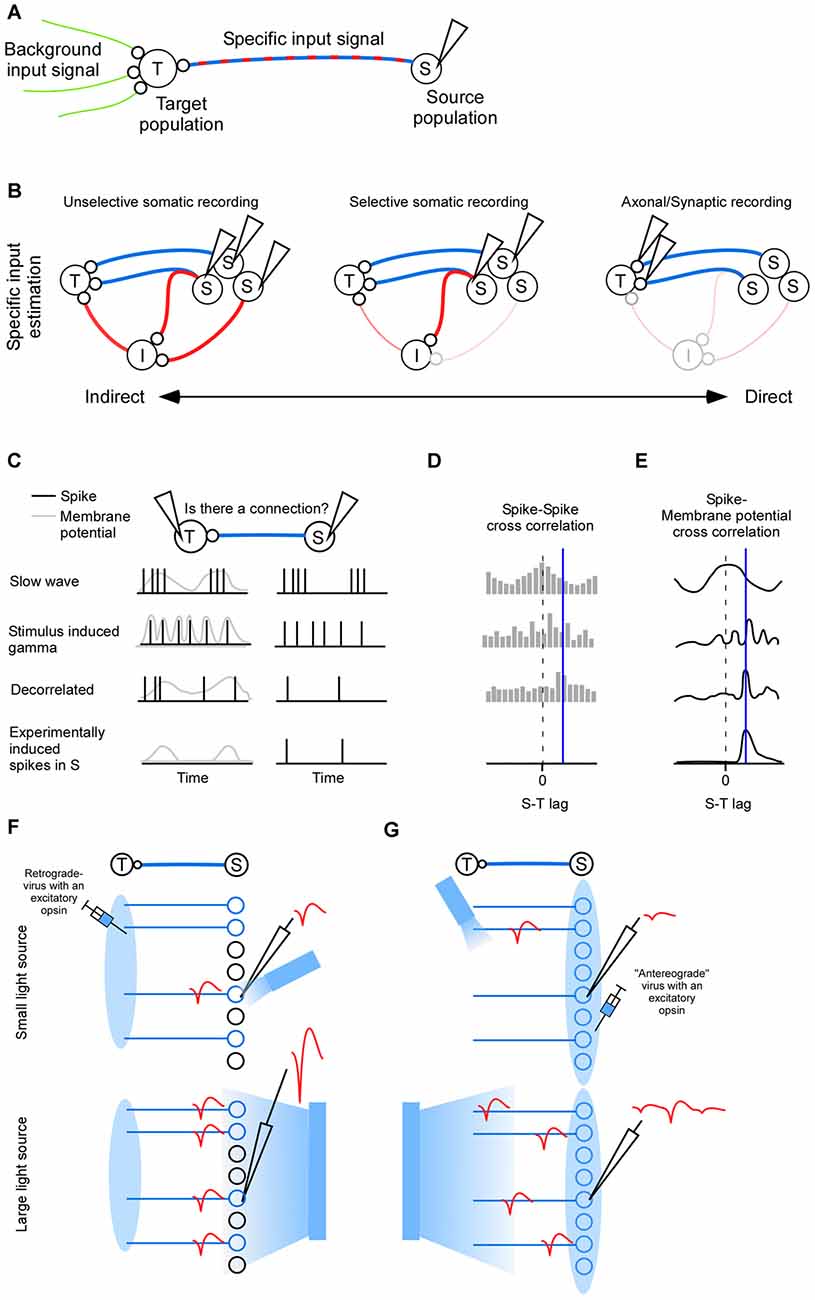
Figure 1. Inputs to population (T). (A) The complete input to a neuronal population (T) can be divided into a background input and a specific input (S). (B) Indirect to direct spectrum of inter-cellular signaling. The indirect route goes via indirect neurons (I). Left: activity is recorded in neurons (S) that have a polysynaptic path to the target (T). Middle: activity is recorded in neurons that have a direct connection to (T). Some of those neurons may also send collaterals elsewhere, hence contributing to the indirect activity. Right: synapse specific recordings allows quantification of the direct input to the target neuron exclusively while sparing indirect paths. (C) Functional connectivity between (S) and (T) is crucially dependent on the type of neuronal activity to which the connectivity measure is applied (rows). Correlated activity in terms of slow wave sleep generates a strong spike incidence at zero lag (first row), correlated activity in terms of high frequency gamma oscillation generates a spike incidence with a periodicity (second row), decorrelated activity is more likely to give a high spike incidence at the lag defined by the connection (third row), and experimentally induced single pre synaptic spikes are more likely to show a spike incidence only at the lag defined by the connection (fourth row). Postsynaptic activity is either spikes (black) or membrane potential (gray). (D) Hypothetical cross-correlations between (S) and (T) for the different spiking activity types shown in (C). The delay of the connection is indicated by a blue vertical line. (E) Hypothetical cross-correlations between (S) and (T) for the different spike-membrane potential activity types shown in panel (C). (F) For somatic phototagging the light should be small and directed towards the electrode tip (top). The larger the emitter is the larger the population spike (red) will be (bottom). (G) For axonal phototagging a small light source may miss the axon of the recorded neuron. The recorded action potential will therefore be of low amplitude (top). Instead the light source may be large and positioned somewhere in the target area (bottom). Although many neurons will be activated the axonal conduction velocity heterogeneity separates the spikes in time.
Since the specific signal governs the activity in the target population it might be tempting to estimate the specific signal by inhibiting it and measuring how the target activity changes. The resulting change may have very little to do with the specific signal (Lien and Scanziani, 2013). To illustrate this one can imagine that the specific signal conveys a simple trigger that starts a complex computation in the target population. When the specific signal is inhibited the activity in the target population is radically simplified and one would falsely conclude that the specific signal is a complex signal. To be able to detect such non-linear effects it is crucial to measure the specific signal directly.
In the first two sections we review mathematical and anatomical approaches for identifying projecting neurons. Their activity represent the specific signal. The first section deals with mathematically oriented methods which typically identifies both direct and indirectly connected neurons (Figure 1B left). In the second section we review experimentally oriented methods for identifying directly connected neurons primarily, although some of the identified neurons will inevitably send collaterals to indirect targets (Figure 1B middle). In the last section we review imaging methods for measuring the specific signal directly at the synapse (Figure 1B right).
Unselective Recording
The experimentally least demanding method for approximating the unspecific direct and indirect signal that is running from the source to the target population is to insert one extracellular electrode array in each population. Linear and non-linear mapping methods can then be used to identify source units that convey information about the activity of the target units (Aggarwal et al., 2009; Graf et al., 2011; Aggarwal et al., 2013; Haxby et al., 2014; Kaufman et al., 2014). A problem with mapping methods is that although the source units convey information about the target units, this may not be because they send information to the target units, but because they receive information from them. Therefore such methods are suitable to apply for pathways with a large delay such that the lag between source and target can be used to infer causality. Granger causality partially solves this problem since it takes the (causal) history into account. It requires relatively little data, and is typically used for linear interactions. To deal with nonlinear interactions, the more data intensive method called transfer entropy is applied (Vicente et al., 2011). To control for the influences of a third area (the common source problem) one can condition the interaction estimation on recordings done in additional areas (Bastos et al., 2015). Even non-simultaneous recordings in overlapping areas can be “stitched” together to provide a more complete description of the interaction (Soudry et al., 2013; Turaga et al., 2013). Finally if one has the luxury to choose from a few well defined and constrained models, one can apply dynamic causal modeling to identify which of those models best describe the interaction between the source and the target population (Pinotsis et al., 2012; Friston et al., 2013; Kobayashi and Kitano, 2013; Roudi et al., 2014).
For short range interactions the local field potential (LFP) may be an additional unspecific factor that influences the activity in the target population. The extracellular electric fields generated by neuronal activity are strong enough to modulate membrane potentials and spiking probabilities (Fröhlich and McCormick, 2010; Anastassiou et al., 2011). To quantify the relation between the spiking activity and the extracellular electrical field one can average the LFP across the spikes (Nauhaus et al., 2009; Rasch et al., 2009). A perfect match between the spike and LFP is not expected, though, since the LFP is the combined result of neurons and glia (Anastassiou and Koch, 2014). Nevertheless, LFP frequencies below 15 Hz are the easiest to predict (Nauhaus et al., 2009; Rasch et al., 2009). This fits well with the fact that spike entrainment is particularly effective for ephaptic field frequencies below 8 Hz (Anastassiou et al., 2011). The predicted LFP components give information about how the membrane potential and spiking probability is modulated (Anastassiou et al., 2010; Okun et al., 2010; Haider et al., 2016). Since the LFP changes across different cortical layers, and since neurons are sensitive to those spatial changes, the LFP should preferably be recorded using a laminar electrode (Anastassiou et al., 2010; Linden et al., 2011). To summarize, both individual neurons and ephaptic effects can contribute to the unselective signaling between two neuronal populations. The reviewed mathematical methods can be used to identify which neurons are important, and/or whether ephaptic effects should be taken into account, for understanding the target activity (see Figures 2A1–5).
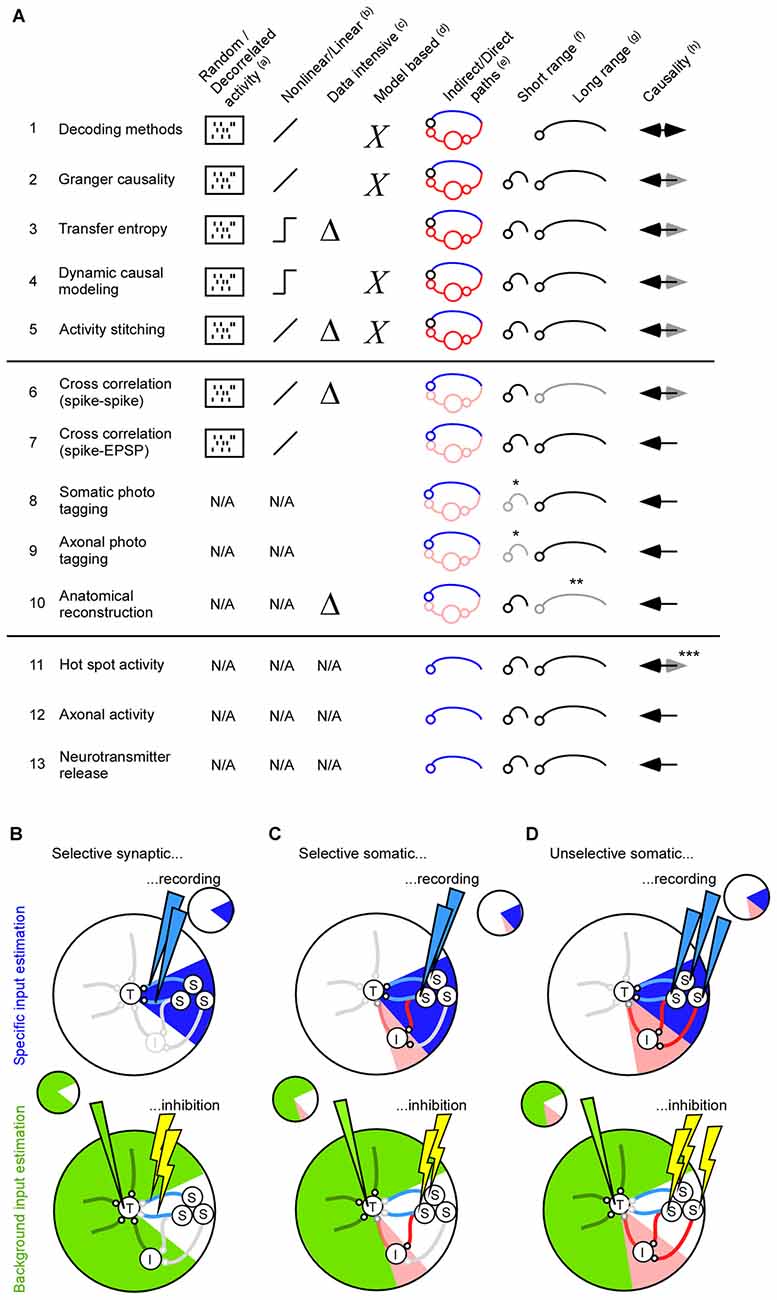
Figure 2. Methods for finding direct and indirect pathways. (A) Summary of 13 methods for estimating inter-cellular signals. To measure the inter-cellular signals one needs to identify the projecting neuron (1–10), or connecting synapse (11–13). (a) For the functional methods connected neurons are found most reliable if the neuronal activity in both the source and the target area is decorrelated (1–7). For the anatomical methods, such as photo tagging and neurite reconstructions, the neuronal activity is not used and, as such, is not a limiting factor (8–13). (b) The functional methods can be divided into those that extract linear relationships between the source and the target population, and those that extract non-linear relationships. (c) Transfer entropy extracts non-linear relationships and is therefore data intensive. (d) Dynamic causal modeling relies on modeling assumptions. (e) Methods that identify projection neurons with mathematical means will typically result in a large number of indirectly connected neurons. (f,g) The suitability for finding short and/or long range connectivity. Somatic- and axonal photo tagging of short range connections within 200–500 micro-meter is limited by virus diffusion (*). Anatomical reconstruction of long-range axons using electronmicroscopy is extremely resource intensive (**). (h) Decoding methods can only give causal information if the connection between source and target is directed and having a long delay. Anatomical based methods (8–10) and those that extract the activity in the synapse (12–13) can most reliably identify causal/projecting neurons. Calcium hot-spot derived post synaptic activity may be influenced by back propagating action potentials and is therefore less suited for identifying causal activity (***). (B) The total input to a neuron from fast and slow chemical synapses, astrocytes, vasculatures, extracellular ions, ephaptic signals and gap junctions can be divided into a specific signal (blue, top) and a background signal (green, bottom). In this review article, we have focused on how to estimate the specific input from fast chemical synapses, gap junctions and ephaptic effects. The background input can be addressed by inhibiting the specific signal. Since optogenetic inhibition has a faster onset than the feedback time of astrocytes, vasculature, slow chemical synapses, and the responses of extracellular ions, optogenetic inhibition can be used to estimate their input contribution (Eriksson, 2016). To cover all inputs to the neuron a rough guideline is to inhibit and record the same signal. For example, if selective synaptic/axonal inhibition is used for estimating the background input, in which only direct pathways will be affected, it is preferable to estimate signal (S) using the synaptic activity based methods (A11–A13). (C) If selective somatic inhibition is used for estimating the background input, in which relatively few indirect pathways will be affected, it is preferable to estimate signal (S) using selective somatic recordings (A6–A10). (D) If unselective somatic inhibition is used for estimating the background input, in which many indirect pathways will be affected, it is preferable to estimate signal (S) such that the effect of indirect pathways can be estimated (A1–A5).
Selective Somatic Recording
Here we review functional and anatomical methods to find neurons that directly connect to a certain population of neurons (see Figures 2A6–10). Once those neurons have been identified, their activity can be used to infer the inter-cellular signal.
Functional Techniques
We will focus on cross-correlations between the pre- and postsynaptic neurons for estimating neuronal connectivity (Perkel et al., 1967; Ts’o et al., 1986; Fujisawa et al., 2008; Berényi et al., 2014). With the introduction of multi-channel extracellular recordings those methods have been used to estimate short and long range connectivity (Berényi et al., 2014), feedforward connectivity from primary visual cortex to secondary visual cortex (Zandvakili and Kohn, 2015) and local connectivity (Isomura et al., 2009). Although general correlations in neuronal data can be tested for significance using powerful mathematical methods (Grun, 2009), we argue here that it is crucial to acquire data that is suitable for applying cross-correlation techniques. We will cover endogenous/spontaneous activity caused by the brain itself, and exogenous activity caused by the experimenter.
Cross-correlations have a limitation whereby detected relationships may not correspond to real anatomical connections. For example, a third brain area targeting the neuronal pair of interest could generate spurious connections (i.e., the common source problem). Importantly, the number of spurious connections is dictated by the brain state (Figure 1C). For slow wave sleep the activity of different neurons co-vary with zero-lag (first row in Figures 1C–E). Close to 100% of those apparent connections will be false positives because they are not anatomically connected. For a more decorrelated (or random) spontaneous activity, a more reasonable estimate of the connection probability of 0.3%–0.5% is obtained for spiking activity in vivo (Fujisawa et al., 2008; Zandvakili and Kohn, 2015). Using in vitro patching a larger connectivity probability of 2% is seen between pyramidal cells which may be explained by the more sensitive post synaptic potential (Nowak et al., 1999; Holmgren et al., 2003; Song et al., 2005; Fujisawa et al., 2008). Even during the more decorrelated state typically associated with sensory stimulation there are detectable correlations between neurons that are not necessarily connected in the anesthetized animal (Yu and Ferster, 2010), and in the awake animal (Fries et al., 2001; Ray and Maunsell, 2010; second row in Figure 1C). Therefore, although the brain automatically randomize/decorrelated activity by means of heterogenous populations of neurons and inhibitory neurons (Padmanabhan and Urban, 2010; Renart et al., 2010; Tetzlaff et al., 2012; Bernacchia and Wang, 2013), in some cases it may be advantageous to artificially decorrelate neurons (third row in Figure 1C). Decorrelation has previously been accomplished by optogenetically injecting a one-dimensional noise signal (Han and Boyden, 2007). In the future, the degree of decorrelation might be enhanced using various light-sculpting approaches (Rickgauer and Tank, 2009; Dal Maschio et al., 2010; Zahid et al., 2010; Katona et al., 2012; Quirin et al., 2013; Schrödel et al., 2013; Rickgauer et al., 2014). Even single neurons can be selectively activated by the experimenter (fourth row in Figure 1C; Rickgauer et al., 2014; Szabo et al., 2014; Packer et al., 2015).
For estimating connectivity, the background input to a neuron is both beneficial and problematic. The background input creates spurious connections and adds variability to the connectivity estimation. On the other hand, this input may be crucial for the generation of action potentials; thus, without this input it would be impossible to detect a connection using extracellular recordings or calcium imaging. One alternative is to provide this additional input via artificial stimulation. The firing threshold can be decreased using two-photon stimulation of a single postsynaptic neuron (Prakash et al., 2012). A small number of postsynaptic neurons can now be activated, and even decorrelated, in similar ways using light patterning methods (see references above). The sparse activation practically eliminates the problem of common source input. Also sparse activation of presynaptic neurons may be beneficial when studying weak long range connections. To this end, projection neurons may be selectively stimulated through retrograde labeling (Wickersham et al., 2007a,b; Reardon et al., 2016). Overall, it may be pragmatic to try to measure connectivity in terms of postsynaptic spikes, since spikes are reliably detected using two-photon imaging of calcium indicators or with dense extracellular recordings, something which is not yet established with voltage indicators in vivo.
Ultimately, connectivity should be estimated in terms of the postsynaptic potential (Figure 1E). Ongoing attempts combine whole-cell recordings with selective two-photon stimulation of potential presynaptic cells (Packer et al., 2012). The yield for these whole-cell recordings may be increased through the use of patching robots, which may allow for the simultaneous patching of multiple neurons (Kodandaramaiah et al., 2012). Furthermore, fluorescent voltage markers might allow for the recording of membrane potentials across multiple neurons via two-photon imaging (Akemann et al., 2012; Knopfel, 2012; Flytzanis et al., 2014; St-Pierre et al., 2014; Vogt, 2014; Yang and St-Pierre, 2016).
Anatomical Techniques
Neurons that project to a specific target area can be found by anatomical means. To this end a retrogradely transported virus expressing an excitatory opsin is injected in the target area (Zhang et al., 2013; Figure 1F), or a specific cell type is targeted using transgenic animals (Lima et al., 2009). A brief light pulse will then evoke a spike in expressing neurons (Lima et al., 2009). If a spontaneously evoked spike matches this light evoked spike waveform then it is assumed that it was generated by the expressing neuron. The problem is that multiple expressing neurons will fire simultaneously to the brief light pulse such that spike sorting becomes difficult. Even neurons far from the electrode may show up in the population spike, since the number of neurons increases with distance (Du et al., 2011). Therefore one should use a small optical fiber to illuminate as small a volume as possible (Stark et al., 2012, 2014; Pi et al., 2013; Wu et al., 2015). Indeed, the required emitting light power for evoking a spike can be reduced by several orders of magnitude if the emitter is decreased in size, indicating a large increase in selectivity (Buzsáki et al., 2015), and somatic stimulation (Wu et al., 2015). Indirectly activated neurons can be detected by means of the spike jitter since it will in general be larger for an indirect activation than for a direct activation (Zhang et al., 2013). Synaptic antagonists can be used to block indirect activation (Lima et al., 2009; Zhang et al., 2013). To avoid the population spike photo-tagging can be done with inhibition instead of excitation (Courtin et al., 2014). Here the latency until spike cancelation is indicative of an indirect or direct inhibition. In addition the Becquerel effect can be subtracted since it will not be time-locked to the spontaneous spikes.
Projection neurons can also be found by infecting the source area with an excitatory opsin and by evoking an anti-dromic spike in the projecting neurons by illuminating the axonal terminals (Sato et al., 2014; Li et al., 2015; Figure 1G). The fundaments for this technique were laid out several decades ago when researches started to use anti-dromic electric stimulation of axons (Miller, 1975; Cleland et al., 1976; Lipski, 1981; Ferster and Lindström, 1983). Although, electrical stimulation is simpler than optogenetic stimulation it may require comparable higher stimulation intensities since the electric field decays quicker over space than the photon distribution. Indeed, in a beautiful study of geniculo-cortical connectivity it was noted that the electrical stimulation had to be so strong that it sometimes leads to small lesions (Ferster and Lindström, 1983). Typical light intensities may at worst cause reversible changes in neuronal activity (Stujenske et al., 2015). In comparison to the retrograde approach in which a virus is taken up by the presynaptic terminals, the axonal stimulation approach may run the risk of stimulating en passant axons. Furthermore, it may be difficult to know where the emitter should be placed given the location of the recorded neuron (in the retrograde approach the emitter should be placed where the neuron/electrode is; Figure 1G). Instead it might be advantageous if the emitter is very large such that many axons are stimulated. Note that the population-spike is weaker for axonal stimulation since the relatively large heterogeneity of axonal conduction delays separates the evoked spikes in time. Axonal phototagging also has the advantage that the number of target structures is not constrained by the number of opsins with non-overlapping wavelengths (e.g., blue and red depolarizing opsins Yizhar et al., 2011; Lin et al., 2013; Klapoetke et al., 2014; Emiliani et al., 2015), as is the case for the retrogradely transported opsin approach. To assure the identity of the sorted unit one can do a collision test (Ciocchi et al., 2015; Li et al., 2015), and to control for collaterals one can assure a low spike jitter, and/or apply synaptic blockers (Sato et al., 2014). Although the choice between somatic or axonal phototagging depends on the question at hand, there is so far no study that has systematically studied the advantages and disadvantages of those two approaches.
It is possible to approximate neuronal connectivity based on axonal and dendritic reconstructions (Stepanyants and Chklovskii, 2005). Typically, the distance between neurites indicates whether there is a synapse. Similarly to the functional approaches discussed above, this anatomical approach may produce both false negatives and spurious connectivity (Stepanyants and Chklovskii, 2005). Dense extracellular recordings may allow the position of a recorded cell group to be estimated and matched to histology (Blanche et al., 2005; Scholvin et al., 2016). Various tissue-clearing approaches may increase the chance of finding a match between an extracellularly recorded cell and a histologically-identified cell, since the brain remains intact and therefore is minimally distorted (Chung et al., 2013; Ke et al., 2013; Miyawaki, 2015). Finally, in one intriguing study, electron microscopy was used to reveal reconstructed connections in a 350 μm × 450 μm × 52 μm block of tissue, combined with two-photon calcium imaging of the corresponding tissue (Bock et al., 2011). If done properly the electron microscopy reconstruction will generate a negligible number of spurious or false negative connections (Denk and Horstmann, 2004; Jurrus et al., 2009). Recent developments could facilitate reconstruction within a larger volume, if not the entire mouse brain (Hua et al., 2015; Mikula and Denk, 2015).
Axonal/Synaptic Recording
Since the projection signal can be seen as synaptic activity, another approach is to measure the activity in and around the synapse (see Figures 2A11–13). The post-synaptic activity gives a localized activity in terms of a hot-spot (Jia et al., 2010; Chen et al., 2011). Although this activity is related to the synaptic activity it is also dependent on the postsynaptic activity such as back propagating action potentials (Jia et al., 2010). Calcium activity in the axonal terminal is much less influenced by the postsynaptic activity (Andermann et al., 2013; Gunaydin et al., 2014). It is even possible to target individual axon terminals with two-photon axonal calcium imaging (Cruz-Martin et al., 2014). Finally, to address synaptic depression and facilitation (Markram and Tsodyks, 1996; Tsodyks and Markram, 1997), it might be optimal to measure the neuro transmitter release (Schulze et al., 1999; Nguyen et al., 2010). Recent, fluorescent markers for glutamate showed both cellular (synaptic) and millisecond resolution (Marvin et al., 2013). A future possibility is to measure the neurotransmitter in identified synaptic clefts by means of a genetically encoded presynaptic fluorescent marker and a genetically encoded postsynaptic transmitter marker (Lin and Schnitzer, 2016).
Conclusion
Here we have reviewed ways to estimate the signal that runs from one neuronal population to another. Some of the methods are suitable to estimate the combined contribution from mono- and poly-synaptic signals that run along direct and indirect pathways, whereas other methods can be used to selectively target the direct mono-synaptic signal between the two populations. This wide range of methods allow the researcher to tailor his/her experiment to the question at hand. In particular, if one wants to inhibit and record a specific input, one can tailor the input recording method to match the inhibition method (Figures 2B–D). If we inhibit and record the same input we will have an excellent control of the input to the target population.
Author Contributions
The author conceived and performed the study.
Funding
The article processing charge was funded by the German Research Foundation (DFG) and the University of Freiburg in the funding programme Open Access Publishing.
Conflict of Interest Statement
The author declares that the research was conducted in the absence of any commercial or financial relationships that could be construed as a potential conflict of interest.
Acknowledgments
The author would like to thank the reviewers for their valuable comments; Mansour Alyahyay, Artur Schneider, Gilad Silberberg, Stylianos Papaioannou, and Raul Vicente for fruitful discussions; Mansour Alyahyay, Artur Schneider, Ilka Diester, Gilad Silberberg, Stylianos Papaioannou, Danko Nikolic, Kai Gansel, Raul Vicente, and Sten Eriksson for comments on earlier versions of this manuscript.
References
Aggarwal, V., Mollazadeh, M., Davidson, A. G., Schieber, M. H., and Thakor, N. V. (2013). State-based decoding of hand finger kinematics using neuronal ensemble and LFP activity during dexterous reach-to-grasp movements. J. Neurophysiol. 109, 3067–3081. doi: 10.1152/jn.01038.2011
Aggarwal, V., Tenore, F., Acharya, S., Schieber, M. H., and Thakor, N. V. (2009). Cortical decoding of individual finger and wrist kinematics for an upper-limb neuroprosthesis. Conf. Proc. IEEE Eng. Med. Biol. Soc. 2009, 4535–4538. doi: 10.1109/IEMBS.2009.5334129
Akemann, W., Mutoh, H., Perron, A., Park, Y. K., Iwamoto, Y., and Knöpfel, T. (2012). Imaging neural circuit dynamics with a voltage-sensitive fluorescent protein. J. Neurophysiol. 108, 2323–2337. doi: 10.1152/jn.00452.2012
Anastassiou, C. A., and Koch, C. (2014). Ephaptic coupling to endogenous electric field activity: why bother? Curr. Opin. Neurobiol. 31C, 95–103. doi: 10.1016/j.conb.2014.09.002
Anastassiou, C. A., Montgomery, S. M., Barahona, M., Buzsaki, G., and Koch, C. (2010). The effect of spatially inhomogeneous extracellular electric fields on neurons. J. Neurosci. 30, 1925–1936. doi: 10.1523/JNEUROSCI.3635-09.2010
Anastassiou, C. A., Perin, R., Markram, H., and Koch, C. (2011). Ephaptic coupling of cortical neurons. Nat. Neurosci. 14, 217–223. doi: 10.1038/nn.2727
Andermann, M. L., Gilfoy, N. B., Goldey, G. J., Sachdev, R. N., Wölfel, M., McCormick, D. A., et al. (2013). Chronic cellular imaging of entire cortical columns in awake mice using microprisms. Neuron 80, 900–913. doi: 10.1016/j.neuron.2013.07.052
Bastos, A. M., Vezoli, J., Bosman, C. A., Schoffelen, J.-M., Oostenveld, R., Dowdall, J. R., et al. (2015). Visual areas exert feedforward and feedback influences through distinct frequency channels. Neuron 85, 390–401. doi: 10.1016/j.neuron.2014.12.018
Berényi, A., Somogyvári, Z., Nagy, A. J., Roux, L., Long, J. D., Fujisawa, S., et al. (2014). Large-scale, high-density (up to 512 channels) recording of local circuits in behaving animals. J. Neurophysiol. 111, 1132–1149. doi: 10.1152/jn.00785.2013
Bernacchia, A., and Wang, X. J. (2013). Decorrelation by recurrent inhibition in heterogeneous neural circuits. Neural Comput. 25, 1732–1767. doi: 10.1162/NECO_A_00451
Blanche, T. J., Spacek, M. A., Hetke, J. F., and Swindale, N. V. (2005). Polytrodes: high-density silicon electrode arrays for large-scale multiunit recording. J. Neurophysiol. 93, 2987–3000. doi: 10.1152/jn.01023.2004
Bock, D. D., Lee, W. C., Kerlin, A. M., Andermann, M. L., Hood, G., Wetzel, A. W., et al. (2011). Network anatomy and in vivo physiology of visual cortical neurons. Nature 471, 177–182. doi: 10.1038/nature09802
Buzsáki, G., Stark, E., Berényi, A., Khodagholy, D., Kipke, D. R., Yoon, E., et al. (2015). Tools for probing local circuits: high-density silicon probes combined with optogenetics. Neuron 86, 92–105. doi: 10.1016/j.neuron.2015.01.028
Chen, X., Leischner, U., Rochefort, N. L., Nelken, I., and Konnerth, A. (2011). Functional mapping of single spines in cortical neurons in vivo. Nature 475, 501–505. doi: 10.1038/nature10193
Chung, K., Wallace, J., Kim, S. Y., Kalyanasundaram, S., Andalman, A. S., Davidson, T. J., et al. (2013). Structural and molecular interrogation of intact biological systems. Nature 497, 332–337. doi: 10.1038/nature12107
Ciocchi, S., Passecker, J., Malagon-Vina, H., Mikus, N., and Klausberger, T. (2015). Brain computation. Selective information routing by ventral hippocampal CA1 projection neurons. Science 348, 560–563. doi: 10.1126/science.aaa3245
Cleland, B. G., Levick, W. R., Morstyn, R., and Wagner, H. G. (1976). Lateral geniculate relay of slowly conducting retinal afferents to cat visual cortex. J. Physiol. 255, 299–320. doi: 10.1113/jphysiol.1976.sp011281
Courtin, J., Chaudun, F., Rozeske, R. R., Karalis, N., Gonzalez-Campo, C., Wurtz, H., et al. (2014). Prefrontal parvalbumin interneurons shape neuronal activity to drive fear expression. Nature 505, 92–96. doi: 10.1038/nature12755
Cruz-Martin, A., El-Danaf, R. N., Osakada, F., Sriram, B., Dhande, O. S., Nguyen, P. L., et al. (2014). A dedicated circuit links direction-selective retinal ganglion cells to the primary visual cortex. Nature 507, 358–361. doi: 10.1038/nature12989
Dal Maschio, M., Difato, F., Beltramo, R., Blau, A., Benfenati, F., and Fellin, T. (2010). Simultaneous two-photon imaging and photo-stimulation with structured light illumination. Opt. Express 18, 18720–18731. doi: 10.1364/OE.18.018720
Denk, W., and Horstmann, H. (2004). Serial block-face scanning electron microscopy to reconstruct three-dimensional tissue nanostructure. PLoS Biol. 2:e329. doi: 10.1371/journal.pbio.0020329
Du, J., Blanche, T. J., Harrison, R. R., Lester, H. A., and Masmanidis, S. C. (2011). Multiplexed, high density electrophysiology with nanofabricated neural probes. PLoS One 6:e26204. doi: 10.1371/journal.pone.0026204
Emiliani, V., Cohen, A. E., Deisseroth, K., and Häusser, M. (2015). All-optical interrogation of neural circuits. J. Neurosci. 35, 13917–13926. doi: 10.1523/JNEUROSCI.2916-15.2015
Eriksson, D. (2016). Estimating neural background input with controlled and fast perturbations: a bandwidth comparison between inhibitory opsins and neural circuits. Front. Neural Circuits 10:58. doi: 10.3389/fncir.2016.00058
Ferster, D., and Lindström, S. (1983). An intracellular analysis of geniculo-cortical connectivity in area 17 of the cat. J. Physiol. 342, 181–215. doi: 10.1113/jphysiol.1983.sp014846
Flytzanis, N. C., Bedbrook, C. N., Chiu, H., Engqvist, M. K., Xiao, C., Chan, K. Y., et al. (2014). Archaerhodopsin variants with enhanced voltage-sensitive fluorescence in mammalian and Caenorhabditis elegans neurons. Nat. Commun. 5:4894. doi: 10.1038/ncomms5894
Fries, P., Reynolds, J. H., Rorie, A. E., and Desimone, R. (2001). Modulation of oscillatory neuronal synchronization by selective visual attention. Science 291, 1560–1563. doi: 10.1126/science.1055465
Friston, K., Moran, R., and Seth, A. K. (2013). Analysing connectivity with Granger causality and dynamic causal modelling. Curr. Opin. Neurobiol. 23, 172–178. doi: 10.1016/j.conb.2012.11.010
Fröhlich, F., and McCormick, D. A. (2010). Endogenous electric fields may guide neocortical network activity. Neuron 67, 129–143. doi: 10.1016/j.neuron.2010.06.005
Fujisawa, S., Amarasingham, A., Harrison, M. T., and Buzsáki, G. (2008). Behavior-dependent short-term assembly dynamics in the medial prefrontal cortex. Nat. Neurosci. 11, 823–833. doi: 10.1038/nn.2134
Graf, A. B., Kohn, A., Jazayeri, M., and Movshon, J. A. (2011). Decoding the activity of neuronal populations in macaque primary visual cortex. Nat. Neurosci. 14, 239–245. doi: 10.1038/nn.2733
Grun, S. (2009). Data-driven significance estimation for precise spike correlation. J. Neurophysiol. 101, 1126–1140. doi: 10.1152/jn.00093.2008
Gunaydin, L. A., Grosenick, L., Finkelstein, J. C., Kauvar, I. V., Fenno, L. E., Adhikari, A., et al. (2014). Natural neural projection dynamics underlying social behavior. Cell 157, 1535–1551. doi: 10.1016/j.cell.2014.05.017
Haider, B., Schulz, D. P., Häusser, M., and Carandini, M. (2016). Millisecond coupling of local field potentials to synaptic currents in the awake visual cortex. Neuron 90, 35–42. doi: 10.1016/j.neuron.2016.02.034
Han, X., and Boyden, E. S. (2007). Multiple-color optical activation, silencing, and desynchronization of neural activity, with single-spike temporal resolution. PLoS One 2:e299. doi: 10.1371/journal.pone.0000299
Haxby, J. V., Connolly, A. C., and Guntupalli, J. S. (2014). Decoding neural representational spaces using multivariate pattern analysis. Annu. Rev. Neurosci. 37, 435–456. doi: 10.1146/annurev-neuro-062012-170325
Holmgren, C., Harkany, T., Svennenfors, B., and Zilberter, Y. (2003). Pyramidal cell communication within local networks in layer 2/3 of rat neocortex. J. Physiol. 551, 139–153. doi: 10.1113/jphysiol.2003.044784
Hua, Y., Laserstein, P., and Helmstaedter, M. (2015). Large-volume en-bloc staining for electron microscopy-based connectomics. Nat. Commun. 6:7923. doi: 10.1038/ncomms8923
Isomura, Y., Harukuni, R., Takekawa, T., Aizawa, H., and Fukai, T. (2009). Microcircuitry coordination of cortical motor information in self-initiation of voluntary movements. Nat. Neurosci. 12, 1586–1593. doi: 10.1038/nn.2431
Jia, H., Rochefort, N. L., Chen, X., and Konnerth, A. (2010). Dendritic organization of sensory input to cortical neurons in vivo. Nature 464, 1307–1312. doi: 10.1038/nature08947
Jonas, E., and Kording, K. (2016). Could a neuroscientist understand a microprocessor? Available online at: http://biorxiv.org/
Jurrus, E., Hardy, M., Tasdizen, T., Fletcher, P. T., Koshevoy, P., Chien, C. B., et al. (2009). Axon tracking in serial block-face scanning electron microscopy. Med. Image Anal. 13, 180–188. doi: 10.1016/j.media.2008.05.002
Katona, G., Szalay, G., Maak, P., Kaszas, A., Veress, M., Hillier, D., et al. (2012). Fast two-photon in vivo imaging with three-dimensional random-access scanning in large tissue volumes. Nat. Methods 9, 201–208. doi: 10.1038/nmeth.1851
Kaufman, M. T., Churchland, M. M., Ryu, S. I., and Shenoy, K. V. (2014). Cortical activity in the null space: permitting preparation without movement. Nat. Neurosci. 17, 440–448. doi: 10.1038/nn.3643
Ke, M. T., Fujimoto, S., and Imai, T. (2013). SeeDB: a simple and morphology-preserving optical clearing agent for neuronal circuit reconstruction. Nat. Neurosci. 16, 1154–1161. doi: 10.1038/nn.3447
Klapoetke, N. C., Murata, Y., Kim, S. S., Pulver, S. R., Birdsey-Benson, A., Cho, Y. K., et al. (2014). Independent optical excitation of distinct neural populations. Nat. Methods 11, 338–346. doi: 10.1038/nmeth.2836
Knopfel, T. (2012). Genetically encoded optical indicators for the analysis of neuronal circuits. Nat. Rev. Neurosci. 13, 687–700. doi: 10.1038/nrn3293
Kobayashi, R., and Kitano, K. (2013). Impact of network topology on inference of synaptic connectivity from multi-neuronal spike data simulated by a large-scale cortical network model. J. Comput. Neurosci. 35, 109–124. doi: 10.1007/s10827-013-0443-y
Kodandaramaiah, S. B., Franzesi, G. T., Chow, B. Y., Boyden, E. S., and Forest, C. R. (2012). Automated whole-cell patch-clamp electrophysiology of neurons in vivo. Nat. Methods 9, 585–587. doi: 10.1038/nmeth.1993
Li, N., Chen, T. W., Guo, Z. V., Gerfen, C. R., and Svoboda, K. (2015). A motor cortex circuit for motor planning and movement. Nature 519, 51–56. doi: 10.1038/nature14178
Lien, A. D., and Scanziani, M. (2013). Tuned thalamic excitation is amplified by visual cortical circuits. Nat. Neurosci. 16, 1315–1323. doi: 10.1038/nn.3488
Lima, S. Q., Hromádka, T., Znamenskiy, P., and Zador, A. M. (2009). PINP: a new method of tagging neuronal populations for identification during in vivo electrophysiological recording. PLoS One 4:e6099. doi: 10.1371/journal.pone.0006099
Lin, J. Y., Knutsen, P. M., Muller, A., Kleinfeld, D., and Tsien, R. Y. (2013). ReaChR: a red-shifted variant of channelrhodopsin enables deep transcranial optogenetic excitation. Nat. Neurosci. 16, 1499–1508. doi: 10.1038/nn.3502
Lin, M. Z., and Schnitzer, M. J. (2016). Genetically encoded indicators of neuronal activity. Nat. Neurosci. 19, 1142–1153. doi: 10.1038/nn.4359
Linden, H., Tetzlaff, T., Potjans, T. C., Pettersen, K. H., Grun, S., Diesmann, M., et al. (2011). Modeling the spatial reach of the LFP. Neuron 72, 859–872. doi: 10.1016/j.neuron.2011.11.006
Lipski, J. (1981). Antidromic activation of neurones as an analytic tool in the study of the central nervous system. J. Neurosci. Methods 4, 1–32. doi: 10.1016/0165-0270(81)90015-7
Markram, H., and Tsodyks, M. (1996). Redistribution of synaptic efficacy between neocortical pyramidal neurons. Nature 382, 807–810. doi: 10.1038/382807a0
Marvin, J. S., Borghuis, B. G., Tian, L., Cichon, J., Harnett, M. T., Akerboom, J., et al. (2013). An optimized fluorescent probe for visualizing glutamate neurotransmission. Nat. Methods 10, 162–170. doi: 10.1038/nmeth.2333
Mikula, S., and Denk, W. (2015). High-resolution whole-brain staining for electron microscopic circuit reconstruction. Nat. Methods 12, 541–546. doi: 10.1038/nmeth.3361
Miller, R. (1975). Distribution and properties of commissural and other neurons in cat sensorimotor cortex. J. Comp. Neurol. 164, 361–373. doi: 10.1002/cne.901640307
Miyawaki, A. (2015). Brain clearing for connectomics. Microscopy (Oxf) 64, 5–8. doi: 10.1093/jmicro/dfu108
Nauhaus, I., Busse, L., Carandini, M., and Ringach, D. L. (2009). Stimulus contrast modulates functional connectivity in visual cortex. Nat. Neurosci. 12, 70–76. doi: 10.1038/nn.2232
Nguyen, Q. T., Schroeder, L. F., Mank, M., Muller, A., Taylor, P., Griesbeck, O., et al. (2010). An in vivo biosensor for neurotransmitter release and in situ receptor activity. Nat. Neurosci. 13, 127–132. doi: 10.1038/nn.2469
Nowak, L. G., Munk, M. H., James, A. C., Girard, P., and Bullier, J. (1999). Cross-correlation study of the temporal interactions between areas V1 and V2 of the macaque monkey. J. Neurophysiol. 81, 1057–1074.
Okun, M., Naim, A., and Lampl, I. (2010). The subthreshold relation between cortical local field potential and neuronal firing unveiled by intracellular recordings in awake rats. J. Neurosci. 30, 4440–4448. doi: 10.1523/JNEUROSCI.5062-09.2010
Packer, A. M., Peterka, D. S., Hirtz, J. J., Prakash, R., Deisseroth, K., and Yuste, R. (2012). Two-photon optogenetics of dendritic spines and neural circuits. Nat. Methods 9, 1202–1205. doi: 10.1038/nmeth.2249
Packer, A. M., Russell, L. E., Dalgleish, H. W. P., and Häusser, M. (2015). Simultaneous all-optical manipulation and recording of neural circuit activity with cellular resolution in vivo. Nat. Methods 12, 140–146. doi: 10.1038/nmeth.3217
Padmanabhan, K., and Urban, N. N. (2010). Intrinsic biophysical diversity decorrelates neuronal firing while increasing information content. Nat. Neurosci. 13, 1276–1282. doi: 10.1038/nn.2630
Perkel, D. H., Gerstein, G. L., and Moore, G. P. (1967). Neuronal spike trains and stochastic point processes. II. Simultaneous spike trains. Biophys. J. 7, 419–440. doi: 10.1016/s0006-3495(67)86597-4
Pi, H. J., Hangya, B., Kvitsiani, D., Sanders, J. I., Huang, Z. J., and Kepecs, A. (2013). Cortical interneurons that specialize in disinhibitory control. Nature 503, 521–524. doi: 10.1038/nature12676
Pinotsis, D. A., Moran, R. J., and Friston, K. J. (2012). Dynamic causal modeling with neural fields. Neuroimage 59, 1261–1274. doi: 10.1016/j.neuroimage.2011.08.020
Prakash, R., Yizhar, O., Grewe, B., Ramakrishnan, C., Wang, N., Goshen, I., et al. (2012). Two-photon optogenetic toolbox for fast inhibition, excitation and bistable modulation. Nat. Methods 9, 1171–1179. doi: 10.1038/nmeth.2215
Quirin, S., Peterka, D. S., and Yuste, R. (2013). Instantaneous three-dimensional sensing using spatial light modulator illumination with extended depth of field imaging. Opt. Express 21, 16007–16021. doi: 10.1364/OE.21.016007
Rasch, M., Logothetis, N. K., and Kreiman, G. (2009). From neurons to circuits: linear estimation of local field potentials. J. Neurosci. 29, 13785–13796. doi: 10.1523/JNEUROSCI.2390-09.2009
Ray, S., and Maunsell, J. H. (2010). Differences in gamma frequencies across visual cortex restrict their possible use in computation. Neuron 67, 885–896. doi: 10.1016/j.neuron.2010.08.004
Reardon, T. R., Murray, A. J., Turi, G. F., Wirblich, C., Croce, K. R., Schnell, M. J., et al. (2016). Rabies virus CVS-N2c(ΔG) strain enhances retrograde synaptic transfer and neuronal viability. Neuron 89, 711–724. doi: 10.1016/j.neuron.2016.01.004
Renart, A., de la Rocha, J., Bartho, P., Hollender, L., Parga, N., Reyes, A., et al. (2010). The asynchronous state in cortical circuits. Science 327, 587–590. doi: 10.1126/science.1179850
Rickgauer, J. P., Deisseroth, K., and Tank, D. W. (2014). Simultaneous cellular-resolution optical perturbation and imaging of place cell firing fields. Nat. Neurosci. 17, 1816–1824. doi: 10.1038/nn.3866
Rickgauer, J. P., and Tank, D. W. (2009). Two-photon excitation of channelrhodopsin-2 at saturation. Proc. Natl. Acad. Sci. U S A 106, 15025–15030. doi: 10.1073/pnas.0907084106
Roudi, Y., Dunn, B., and Hertz, J. (2014). Multi-neuronal activity and functional connectivity in cell assemblies. Curr. Opin. Neurobiol. 32C, 38–44. doi: 10.1016/j.conb.2014.10.011
Sato, T. K., Häusser, M., and Carandini, M. (2014). Distal connectivity causes summation and division across mouse visual cortex. Nat. Neurosci. 17, 30–32. doi: 10.1038/nn.3585
Scholvin, J., Kinney, J. P., Bernstein, J. G., Moore-Kochlacs, C., Kopell, N., Fonstad, C. G., et al. (2016). Close-packed silicon microelectrodes for scalable spatially oversampled neural recording. IEEE Trans. Biomed. Eng. 63, 120–130. doi: 10.1109/TBME.2015.2406113
Schrödel, T., Prevedel, R., Aumayr, K., Zimmer, M., and Vaziri, A. (2013). Brain-wide 3D imaging of neuronal activity in Caenorhabditis elegans with sculpted light. Nat. Methods 10, 1013–1020. doi: 10.1038/nmeth.2637
Schulze, H. G., Greek, L. S., Barbosa, C. J., Blades, M. W., Gorzalka, B. B., and Turner, R. F. (1999). Measurement of some small-molecule and peptide neurotransmitters in vitro using a fiber-optic probe with pulsed ultraviolet resonance Raman spectroscopy. J. Neurosci. Methods 92, 15–24. doi: 10.1016/s0165-0270(99)00081-3
Song, S., Sjöström, P. J., Reigl, M., Nelson, S., and Chklovskii, D. B. (2005). Highly nonrandom features of synaptic connectivity in local cortical circuits. PLoS Biol. 3:e68. doi: 10.1371/journal.pbio.0030068
Soudry, D., Keshri, S., Stinson, P., Oh, M.-H., Iyengar, G., and Paninski, L. (2013). A shotgun sampling solution for the common input problem in neural connectivity inference. Available online at: arxiv.org
Stark, E., Koos, T., and Buzsáki, G. (2012). Diode probes for spatiotemporal optical control of multiple neurons in freely moving animals. J. Neurophysiol. 108, 349–363. doi: 10.1152/jn.00153.2012
Stark, E., Roux, L., Eichler, R., Senzai, Y., Royer, S., and Buzsáki, G. (2014). Pyramidal cell-interneuron interactions underlie hippocampal ripple oscillations. Neuron 83, 467–480. doi: 10.1016/j.neuron.2014.06.023
Stepanyants, A., and Chklovskii, D. B. (2005). Neurogeometry and potential synaptic connectivity. Trends Neurosci. 28, 387–394. doi: 10.1016/j.tins.2005.05.006
St-Pierre, F., Marshall, J. D., Yang, Y., Gong, Y., Schnitzer, M. J., and Lin, M. Z. (2014). High-fidelity optical reporting of neuronal electrical activity with an ultrafast fluorescent voltage sensor. Nat. Neurosci. 17, 884–889. doi: 10.1038/nn.3709
Stujenske, J. M., Spellman, T., and Gordon, J. A. (2015). Modeling the spatiotemporal dynamics of light and heat propagation for in vivo optogenetics. Cell Rep. 12, 525–534. doi: 10.1016/j.celrep.2015.06.036
Szabo, V., Ventalon, C., De Sars, V., Bradley, J., and Emiliani, V. (2014). Spatially selective holographic photoactivation and functional fluorescence imaging in freely behaving mice with a fiberscope. Neuron 84, 1157–1169. doi: 10.1016/j.neuron.2014.11.005
Tetzlaff, T., Helias, M., Einevoll, G. T., and Diesmann, M. (2012). Decorrelation of neural-network activity by inhibitory feedback. PLoS Comput. Biol. 8:e1002596. doi: 10.1371/journal.pcbi.1002596
Ts’o, D. Y., Gilbert, C. D., and Wiesel, T. N. (1986). Relationships between horizontal interactions and functional architecture in cat striate cortex as revealed by cross-correlation analysis. J. Neurosci. 6, 1160–1170.
Tsodyks, M. V., and Markram, H. (1997). The neural code between neocortical pyramidal neurons depends on neurotransmitter release probability. Proc. Natl. Acad. Sci. U S A 94, 719–723. doi: 10.1073/pnas.94.2.719
Turaga, S. C., Buesing, L., Packer, A. M., Dalgleish, H., Pettit, N., Häusser, M., et al. (2013). “Inferring neural population dynamics from multiple partial recordings of the same neural circuit,” in Advances in Neural Information Processing Systems 26 (NIPS 2013), (Lake Tahoe, NV).
Vicente, R., Wibral, M., Lindner, M., and Pipa, G. (2011). Transfer entropy—a model-free measure of effective connectivity for the neurosciences. J. Comput. Neurosci. 30, 45–67. doi: 10.1007/s10827-010-0262-3
Wickersham, I. R., Finke, S., Conzelmann, K. K., and Callaway, E. M. (2007a). Retrograde neuronal tracing with a deletion-mutant rabies virus. Nat. Methods 4, 47–49. doi: 10.1038/nmeth999
Wickersham, I. R., Lyon, D. C., Barnard, R. J., Mori, T., Finke, S., Conzelmann, K. K., et al. (2007b). Monosynaptic restriction of transsynaptic tracing from single, genetically targeted neurons. Neuron 53, 639–647. doi: 10.1016/j.neuron.2007.01.033
Wu, F., Stark, E., Ku, P. C., Wise, K. D., Buzsáki, G., and Yoon, E. (2015). Monolithically integrated μLEDs on silicon neural probes for high-resolution optogenetic studies in behaving animals. Neuron 88, 1136–1148. doi: 10.1016/j.neuron.2015.10.032
Yang, H. H., and St-Pierre, F. (2016). Genetically encoded voltage indicators: opportunities and challenges. J. Neurosci. 36, 9977–9989. doi: 10.1523/JNEUROSCI.1095-16.2016
Yizhar, O., Fenno, L. E., Prigge, M., Schneider, F., Davidson, T. J., O’Shea, D. J., et al. (2011). Neocortical excitation/inhibition balance in information processing and social dysfunction. Nature 477, 171–178. doi: 10.1038/nature10360
Yu, J., and Ferster, D. (2010). Membrane potential synchrony in primary visual cortex during sensory stimulation. Neuron 68, 1187–1201. doi: 10.1016/j.neuron.2010.11.027
Zahid, M., Vélez-Fort, M., Papagiakoumou, E., Ventalon, C., Angulo, M. C., and Emiliani, V. (2010). Holographic photolysis for multiple cell stimulation in mouse hippocampal slices. PLoS One 5:e9431. doi: 10.1371/journal.pone.0009431
Zandvakili, A., and Kohn, A. (2015). Coordinated neuronal activity enhances corticocortical communication. Neuron 87, 827–839. doi: 10.1016/j.neuron.2015.07.026
Keywords: anatomical connectivity, functional connectivity, perturbation, contextual signaling, neural circuits
Citation: Eriksson D (2016) Estimating Fast Neural Input Using Anatomical and Functional Connectivity. Front. Neural Circuits 10:99. doi: 10.3389/fncir.2016.00099
Received: 22 May 2016; Accepted: 18 November 2016;
Published: 20 December 2016.
Edited by:
David Parker, University of Cambridge, UKReviewed by:
Armin Lak, University College London, UKRune W. Berg, University of Copenhagen, Denmark
Copyright © 2016 Eriksson. This is an open-access article distributed under the terms of the Creative Commons Attribution License (CC BY). The use, distribution and reproduction in other forums is permitted, provided the original author(s) or licensor are credited and that the original publication in this journal is cited, in accordance with accepted academic practice. No use, distribution or reproduction is permitted which does not comply with these terms.
*Correspondence: David Eriksson, ZGFmZnNhbmRhZmZ5QGdtYWlsLmNvbQ==