 Frédéric Huppé-Gourgues
 Karim Jegouic
 Elvire Vaucher
- 1Laboratoire de Neurobiologie de la Cognition Visuelle, École d’Optométrie, Université de Montréal, Montreal, QC, Canada
- 2École de Psychologie, Université de Moncton, Moncton, NB, Canada
Acetylcholine is an important neurotransmitter for the regulation of visual attention, plasticity, and perceptual learning. It is released in the visual cortex predominantly by cholinergic projections from the basal forebrain, where stimulation may produce potentiation of visual processes. However, little is known about the fine organization of these corticopetal projections, such as whether basal forebrain neurons projecting to the primary and secondary visual cortical areas (V1 and V2, respectively) are organized retinotopically. The aim of this study was to map these basal forebrain-V1/V2 projections. Microinjections of the fluorescent retrograde tracer cholera toxin b fragment in different sites within V1 and V2 in Long–Evans rats were performed. Retrogradely labeled cell bodies in the horizontal and vertical limbs of the diagonal band of Broca (HDB and VDB, respectively), nucleus basalis magnocellularis, and substantia innominata (SI), were mapped ex vivo with a computer-assisted microscope stage controlled by stereological software. Choline acetyltranferase immunohistochemistry was used to identify cholinergic cells. Our results showed a predominance of cholinergic projections coming from the HDB. These projections were not retinotopically organized but projections to V1 arised from neurons located in the anterior HDB/SI whereas projections to V2 arised from neurons located throughout the whole extent of HDB/SI. The absence of a clear topography of these projections suggests that BF activation can stimulate visual cortices broadly.
Introduction
The neurotransmitter acetylcholine (ACh) is important for the tuning of cortical functions through mechanisms that modulate synaptic strength and neural responses. ACh can produce a broad network-coordinating signal that elevates cortical activity and can also produce localized signals that modulate the neural activity of specific cells (Sarter et al., 2005; Hasselmo and Sarter, 2011). These two signaling forms echo to the underlying organization of cholinergic innervation. On one hand, cholinergic innervation of the cortex consists of topographically organized projections from cells in the basal forebrain (BF) (Rye et al., 1984; Luiten et al., 1987; Gaykema et al., 1990; Woolf, 1991; Vaucher and Hamel, 1995; Zaborszky et al., 2015). ACh is contained and most probably released from varicosities distributed along these long cholinergic axons, suggesting a broad ACh role. The low synaptic frequency on cholinergic varicosities demonstrated by ultrastructural studies (Vaucher and Hamel, 1995; Mechawar et al., 2000) also fits with broad volume transmission rather than restricted synaptic transmission (Descarries and Mechawar, 2000; Yamasaki et al., 2010). On the other hand, ACh may exert localized micro-function effects within specific cortical areas or layers owing to the enriched distribution of varicosities along specific segments of cholinergic axons (Zhang et al., 2011) or of cholinergic receptor subtypes (Hasselmo and Sarter, 2011; Coppola et al., 2016). In addition, restricted cholinergic actions could be generated by locally evoked ACh release. It is not yet known whether cholinergic projections are distributed differentially according to higher cortical functional organization, such as retinotopy in the visual cortex.
Local cholinergic modulation of visual cortical areas has been evidenced in a number of rat studies (Fournier et al., 2004; Laplante et al., 2005; Soma et al., 2013). ACh has been shown to play a role in visual attention (Sarter et al., 2005; Herrero et al., 2008), as well as in the refining of visual perception (Kang et al., 2014; Gratton et al., 2017) and visual cortex pathways (Ricciardi et al., 2013). Indeed, ACh influences the intensity of neural activity (Gil et al., 1997; Pinto et al., 2013; Soma et al., 2013), preferred responses (Roberts et al., 2005) and receptive field properties (Herrero et al., 2008) in primary visual cortex (V1). The presence of cholinergic terminals throughout the cortical layers of visual areas (Mechawar et al., 2000) suggests that ACh might affect visual processing at each level of visual processing. Visual areas are organized in a precise retinotopic manner, as shown in V1 in electrophysiological experiments (Adams and Forrester, 1968) and in the extra striate area (Montero et al., 1973; Espinoza and Thomas, 1983) in optical imaging experiments (Gias et al., 2005). Functional maps produced in these studies fit well with the cytoarchitectonic organization of visual cortex, as shown in the work of Krieg (1946), Paxinos (1995), and Paxinos and Watson (1997), wherein cellular densities delineate V1 and secondary visual cortex (V2) organization.
The BF origin of corticopetal ACh fibers has been described by Shute and Lewis (1967) and Mesulam et al. (1983). The cholinergic BF nuclei include the medial septum/vertical limb of the diagonal band of Broca (VDB), horizontal limb of the diagonal band of Broca (HDB), sublenticular substantia innominata (SI), and nucleus basalis magnocellularis (NBM). These areas contain heterogeneous populations of neurons, where cholinergic and non-cholinergic projection neurons are intermingled with putative interneurons along ascending pathways (Zaborszky and Duque, 2000). The NBM and SI innervate frontal regions (Rye et al., 1984; Luiten et al., 1987), whereas the HDB, VDB, and anterior BF project to visual cortex areas (Rye et al., 1984; Saper, 1984; Gaykema et al., 1990; Laplante et al., 2005). The SI projects, but only weakly, to V1 (Rye et al., 1984; Vaucher and Hamel, 1995; Laplante et al., 2005). Although the topographical projection patterns of BF nuclei are well-characterized, the functional organization and connectivity of neurons within the anatomical delimitations of BF nuclei are still debated. It is not known whether BF neurons are clustered relative to a precise function in their projection fields or if BF neurons are distributed randomly, acting independently in terms of function. Technical challenges have impeded clarification of the timing and localization of BF neuronal firing relative to external sensory stimuli. Some recent optogenetic studies are in the process of elucidating the firing patterns of BF neurons. For example, cholinergic neurons within the HDB and NBM were found to exhibit identical firing in mice performing a behavioral task, suggesting that BF neurons may constitute a unified broadcast system to the cortex (Hangya et al., 2015; Lin et al., 2015). Meanwhile, BF neurons projecting to primary auditory areas were found to be restricted to a small BF area distinct from the BF area projecting to secondary auditory areas (Chavez and Zaborszky, 2017).
The aim of the present study was to determine whether BF neurons that project to the visual cortex are finely organized and clustered retinotopically into subpopulations within the BF. Anatomical clustering would be consistent with neurons sharing a similar function. A broad distribution of cholinergic BF neurons projecting to different visual field representations would indicate complex BF organization. Thus, we performed restricted microinjections of cholera toxin fragment b (CTb) into multiple visual cortex sites according to the functional retinotopy proposed by Gias et al. (2005) and the architectonic organization described by Paxinos and Watson (1997). Labeled neurons within the BF were counted and their locations were identified in coronal brain sections. We expected that if there is topographic BF organization matching V1 retinotopy, then retrograde tracer placed in the visual cortex should result in the labeling of cells in a restricted part of the BF with a distribution pattern that is reproducible across animals.
Materials and Methods
Animal Preparation
Fifteen Long–Evans rats from Charles River Laboratories (Saint-Constant, QC, Canada), weighing 242–369 g, were used. All injections were unilateral; some animals received two tracer colors. Protocols were designed in accordance with the Canadian Council on Animal Care and approved by the Université de Montréal ethics committee (#14-164).
Injections
We based our injection sites (n = 17) on Paxinos and Watson’s brain atlas coordinates (Paxinos and Watson, 1997), where V1m, V1b, V2m, and V2l are determined according to their architectonic organization. Animals were anesthetized with isoflurane (2–2.5%) and their temperatures were maintained at 37 ± 0.5°C by a thermostatic rectal temperature controller. Fluid replacement saline was given by subcutaneous bolus (1 cc/h). Each animal was placed in a stereotaxic apparatus (Kopf Instruments). The dorsal skin of the head was incised along the fronto-posterior axis, and then a burr hole was drilled through the skull above the visual cortex. A borosilicate micropipette linked to a 10-μl Hamilton syringe filled with mineral oil was used. CTb (1% in saline) conjugated with fluorescent Alexa 488 or 493 nm (Molecular probes) was loaded into micropipette tips. The filled micropipette was placed at the desired coordinates of cortical visual areas stereotaxically relative to Bregma’s suture; coordinates ranged antero-posteriorly from -5 to -9 mm and ranged laterally from 1 to 5 mm from the midline as shown in Table 1. CTb (0.5 μl) was injected at a rate of 0.1 μl/1 min by a syringe pump (Phd, Harvard apparatus) in the visual cortex. Dental acrylic was applied to secure the burr hole. The skin wound was sutured and each animal was returned to its home cage. Retrograde transport of the injected solution was allowed to proceed for 5–13 days.
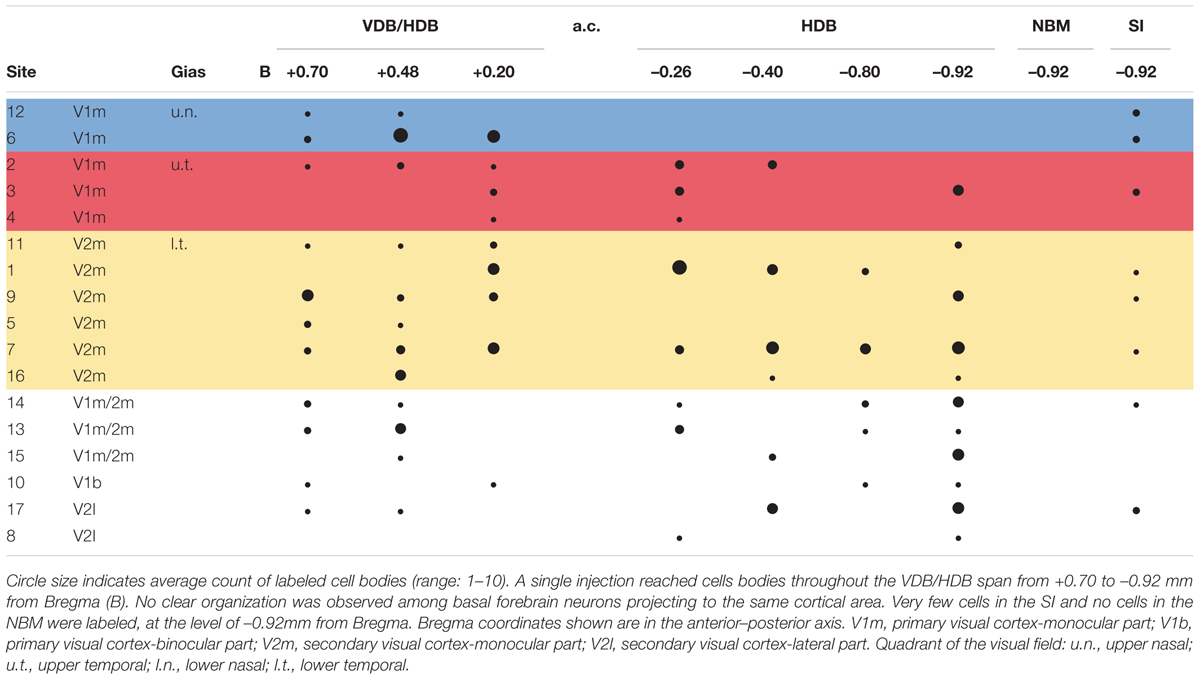
TABLE 1. Distribution of retrogradely labeled cells by tracer injection site.
Histochemistry
Animals were deeply anesthetized with pentobarbital then perfused with 4% paraformaldehyde and their brains were collected and cryoprotected in graded sucrose solutions (10–30%) for 3 days. Each brain was blocked with a matrix, flash frozen with isopentane, stored at -80°C, and then sliced into 50-μm coronal sections, proceeding from anterior to posterior areas, with a cryostat (Leica CM3050s). Sections were collected in series to preserve their order and stored in a glycerol preparation at 4°C before immunolabeling. Alternate CTb-tracer marked sections were labeled with choline acetyltransferase (ChAT). Briefly, sections were rinsed in phosphate buffer, blocked with 1.5% normal donkey serum (Jackson Immuno Research Laboratories, Inc., West Grove, PA, United States) for 90 min, immersed in goat anti-choline acetyltransferase 1:250 (Millipore, Ltd., Etobicoke, ON, Canada) for 24 h, and then incubated with Alexa Fluor anti-goat secondary antibody (1:200, Molecular Probes, Eugene, OR, United States) for 90 min. Finally, the sections were mounted on glass slide, and then cover slipped.
Tracer analysis was conducted by researchers who were blinded to the experimental conditions throughout the BF (from 1.5 anterior to 2 mm posterior to Bregma). Sections were selected according to a random start, and then sampled systematically (average spacing of 160 μm according to stereological recommendations) (Mouton et al., 2002). Marked cells were sparse (2.17 cells/section), which is not compatible with the use of a stereology grid. Therefore, we documented all encountered cells in each analyzed section. Limits of the sampled sections were delineated anatomically at low magnifications (2.5 and 10×) with reference to a rat brain atlas (Paxinos and Watson, 1997). Cell plotting was performed at higher magnification 63–100× magnification (Leica HCX PL Fluotar oil-immersion objective) under a Leica DMR microscope equipped with Stereoinvestigator software (v 9.13, Microbrightfields, Colchester, VT, United States) and a computer-driven motorized stage. To reconstruct injection sites, mosaic images were assembled (Figure 1) in Stereoinvestigator software linked to a camera (Retiga-200R fast 1394) and reconstructed on dorsal view of the visual cortex (Figure 2). Marked cells were plotted against Paxinos and Watson’s (1997) rat brain atlas plates (Figure 3). The HDB analysis range was +1.2 to -1.3 mm of Bregma, the SI analysis range was from -0.26 to -1.8 mm of Bregma. A confocal laser-scanning microscope (Leica TCS) was used to image double-labeled cells.
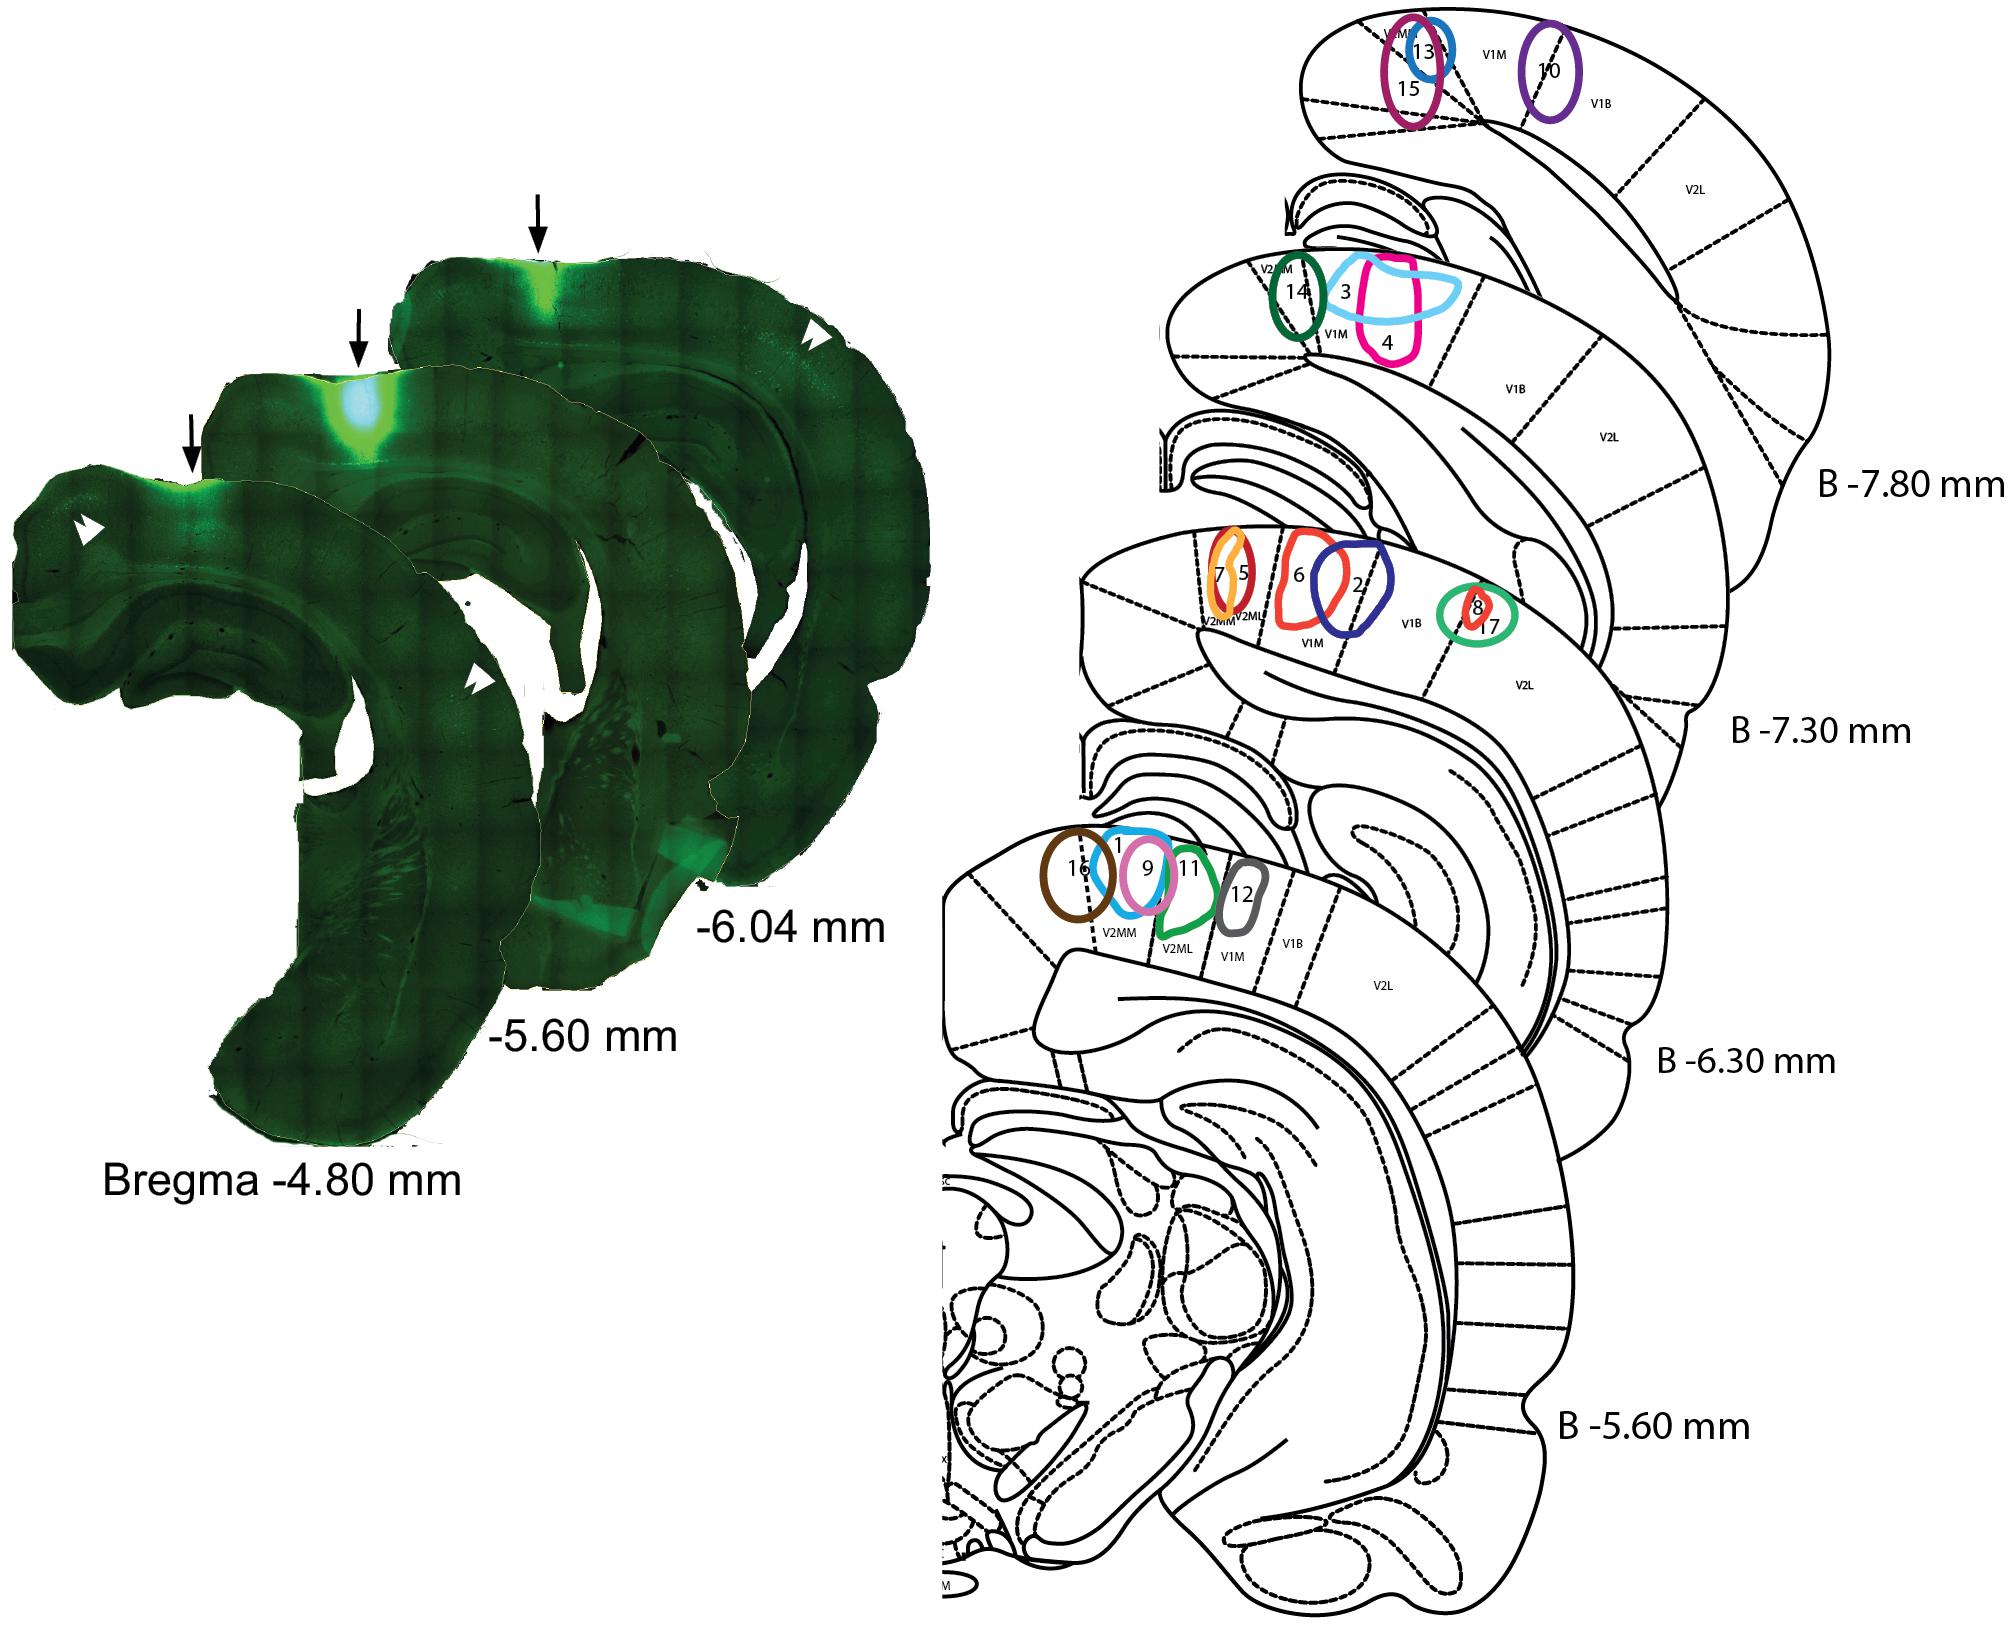
FIGURE 1. Injection sites in the visual areas. (Left) Example of a CTb injection into visual cortex. Reconstruction of the injection site #11 (arrows) with the aid of the virtual slices function in Stereoinvestigator software. The center section is the location of a 488 nm tracer-conjugated CTb injection; the reconstruction of other sections reveals the antero-posterior spread of the injection. Double arrow heads point to clusters of retrogradely stained neurons from adjacent cortical areas. Numbers indicate distance from Bregma. (Right) Representation of the different injection sites on coronal sections of the rat brain atlas. Edges of the injections site were drawn according to the saturation level of the CTb as recorded by the camera at the strongest fluorescence level. Distances from Bregma (in mm) are given for the different plates.
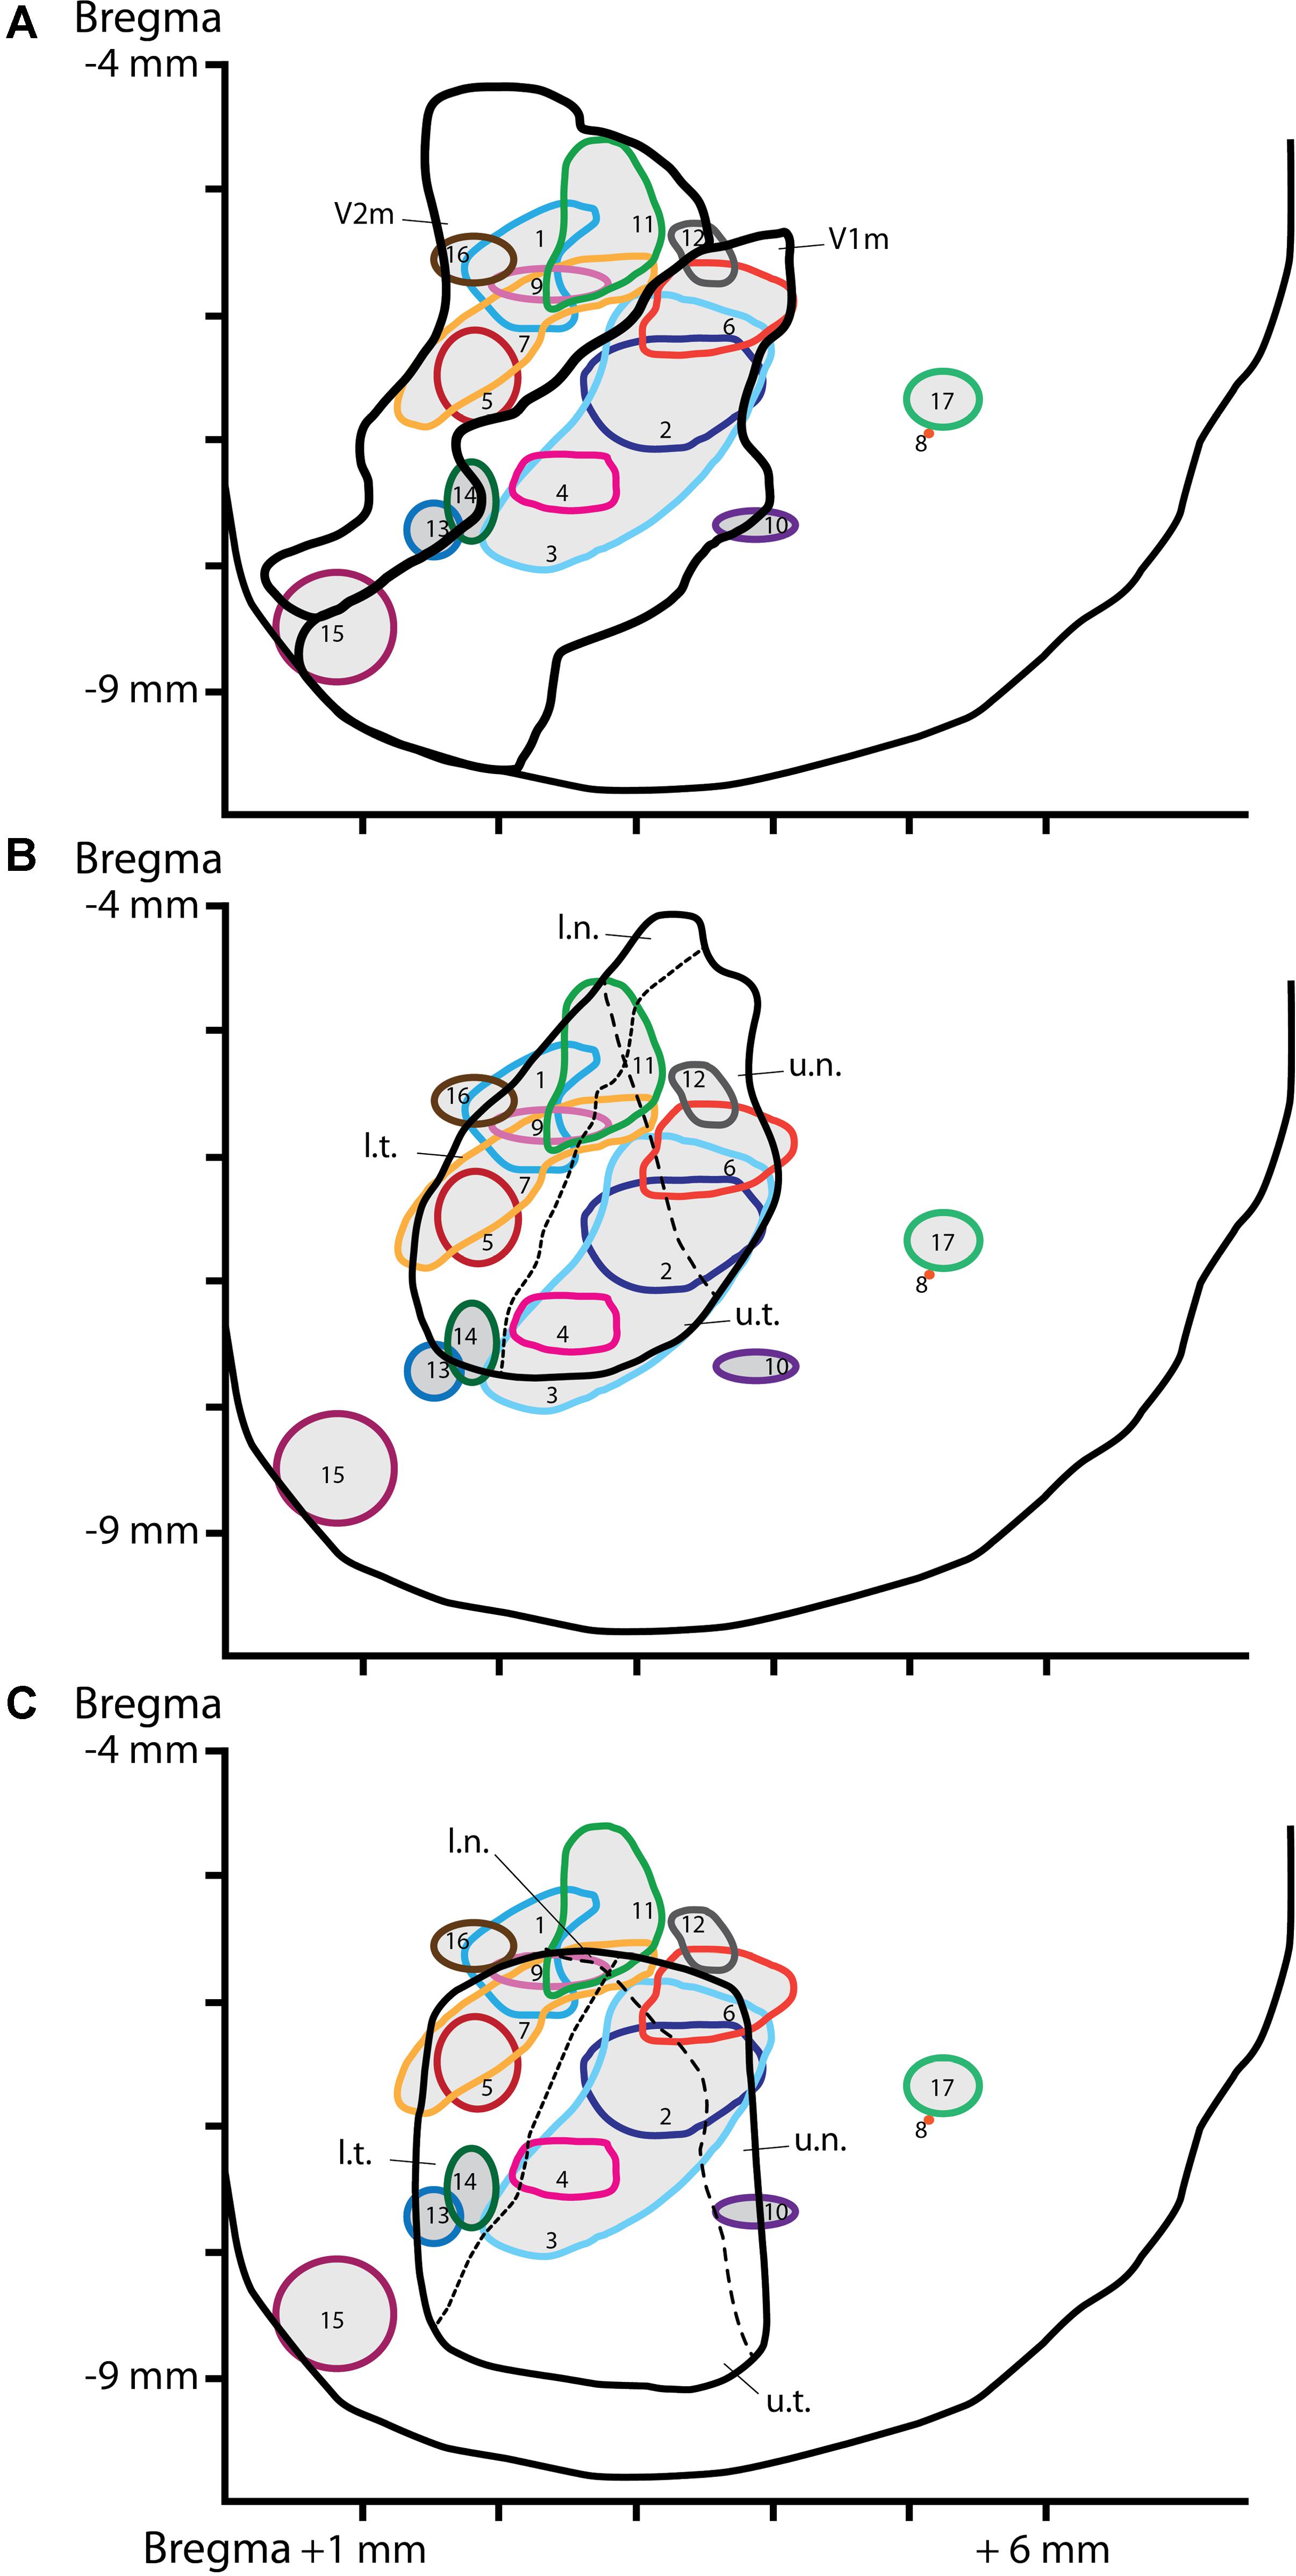
FIGURE 2. Location of the injection sites on a schematic dorsal view of the visual cortex. CTb injection sites reconstructed and plotted on a dorsal view of the visual cortex delineating visual areas according to Paxinos and Watson’s (1997) atlas (A), the retinotopy from Gias et al. (2005) (B) or the retinotopy from Adams and Forrester (1968) (C). The dashed lines represent the horizon (short dash) or the meridian (long dash) lines of the visual field. The x-axe depicts distance (in mm) from the mediolateral midline, the y-axe depict distance (in mm) from Bregma. V1m, primary visual cortex-monocular part; V2m, secondary visual cortex-monocular part. Quadrant of the visual field: u.n., upper nasal; u.t., upper temporal; l.n., lower nasal; l.t., lower temporal.
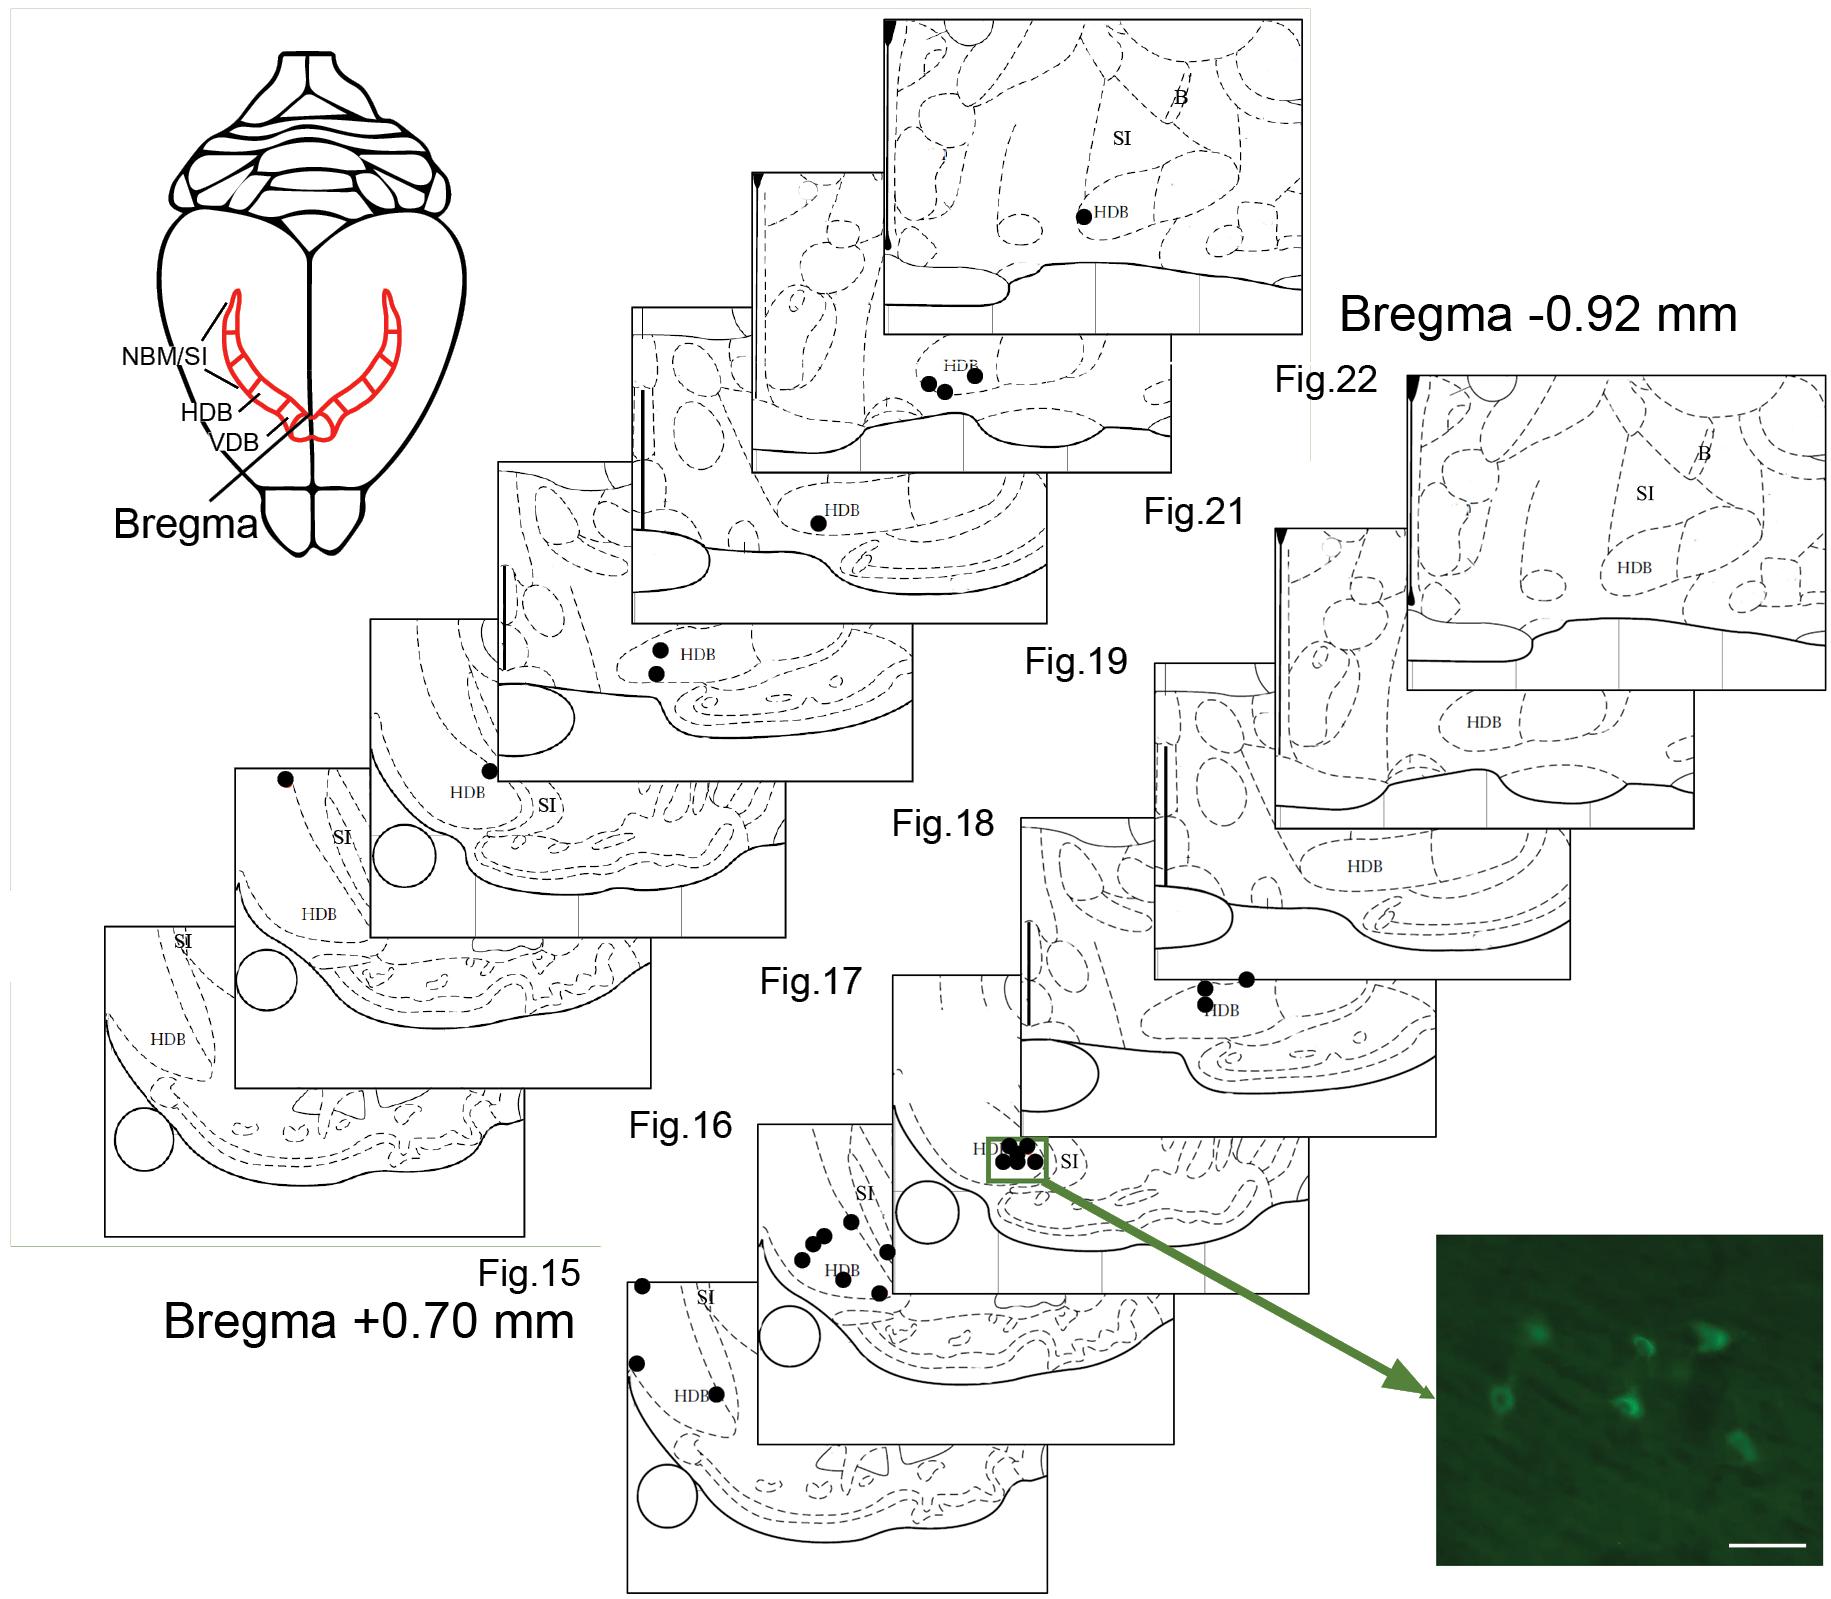
FIGURE 3. Plots of BF neurons marked with CTb injected in the visual cortex. Two representative cases of retrogradely labeled BF neurons (each dot represents one neuron) in V2m (site 11, upper panel) or V1m (site 6, lower panel). The locations are plotted on atlas plates (Figures 15–22; from +0.48 anterior to –0.92 mm posterior to Bregma). Most of the labeled cells are scattered in the HDB. The photomicrograph shows a cluster of fluorescent CTb-positive cells. Scale bar: 25 μm.
Results
A mosaic reconstruction of the injection sites (Figure 1), visualized in coronal sections, was established to determine the spread of CTb injections within different quadrants of the visual cortex retinotopy. We reconstituted 17 injection sites from adjacent coronal sections located within V1m (monocular), or the monocular and lateral areas of secondary visual cortex (V2m and V2l) according to Paxinos and Watson’s (1997) atlas as shown in Figure 2A. These reconstituted sites were overlapped with the retinotopic maps established by Adams and Forrester (1968) and Gias et al. (2005) (Figures 2B,C) to establish the correspondence between BF neuronal organization and retinotopy.
Retrogradely labeled cells were sparse, independent of the extent or intensity of the corresponding injection site. At most, nine labeled BF cell bodies were detected within a single 50-μm-thick brain section. For example, a large injection site (#11) in rostral V2m was associated with a few retrogradely labeled cells that were widely distributed in the VDB/HDB or caudal HDB (Figure 3 and Table 1). This example is representative of the results obtained with other injections leading to only one or two cells per section (0.66 cell/section). There were very few cell clusters. Of 17 injections sites, only four produced cell clusters in which ≥3 cells within 100 μm of one another (e.g., site #6, Figure 3). Cells were found throughout the anterior HDB to posterior HDB and SI, but none were located within the NBM at the level observed (-0.92 to 1.8 mm from Bregma). As expected, retrograde CTb tracer was observed in cell bodies, but not their dendrites, precluding visualization of interconnections between BF cells.
Pattern of BF Neuronal Projections to Visual Areas
Six injections in V1m produced labeled cells in VDB, HDB, and SI regions. No clear pattern in the distribution of the cells among these BF regions was observed across injection sites in V1m (#2, #3, and #4), nor across injection sites in V2m (#1, #9, and #11) (Figure 3). A distribution pattern did not emerge across animals. Injections performed more laterally, within V1b or V2l, also resulted in widely distributed cells throughout the extent of the HDB and SI. However, looking at the data as a whole (Table 1), it became clear that neurons projecting to V1m were principally concentrated within the anterior HDB (+0.7 to -0.2 mm from Bregma), whereas neurons projecting to V2m were distributed throughout HDB (+0.7 to -0.9 mm from Bregma). Moreover, as shown clearly in Table 1, the anterior HDB (+0.7 to +0.48 mm from Bregma), as well as the SI, project to virtually all visual cortex subregions (V1m, V2m, and V2l).
Correspondence With Retinotopic Maps
Puzzlingly, the functional retinotopic maps established by different authors differ slightly from one to another, depending on the mapping method (electrophysiology or optical imaging) and anesthesia used. We overlapped our injection site map with Gias’ retinotopy determined by optical imaging Gias et al. (2005) and Adams and Forrester (1968), who used pigmented rats. We did not compare our map with the retinotopy established by Espinoza and Thomas (1983) because their V1 map was substantially lateral compared to both previous maps and anatomical correlates. In Gias’ map, the upper visual field representation (u.t. and u.n.) corresponds to the architectonic structure of V1m and the lower field representation corresponds to V2m (l.t. and l.n.). Once again, there was no specific reproducible pattern of BF neuronal organization among the different rats. It is generally assumed that cells that function in synchrony are grouped into clusters. The cell clusters in BF observed in some rats were not redundant from the same quadrant. These results are not indicative of a predetermined organization of cholinergic projections to visual areas.
Proportion of CTb Marked Cholinergic Cells
As shown in Figure 4, ChAT immunolabeling revealed that the overwhelming majority (94.5%) of CTb retrogradely labeled cells were cholinergic, that is, they were double labeled for CTb and ChAT (Figure 4).
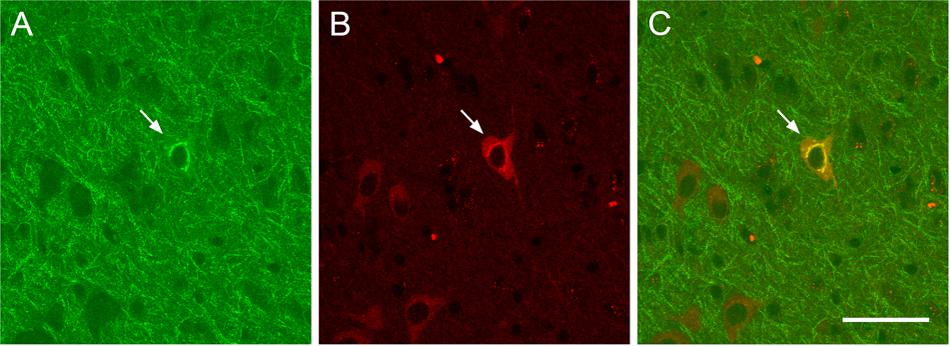
FIGURE 4. Examples of retrograde CTb-marked cholinergic cells. Confocal images showing a retrograde CTb-marked cell (A, arrow), ChAT-immunopositive cells (B, arrow), and merge of CTb and ChAT labels demonstrating a double labeled neuron (C, arrow). Scale bar: 50 μm.
Discussion
The present results show that BF neurons projecting to different parts of the visual cortex are intermingled within the VDB/HDB/SI regions. The only tendency observed was with respect to V1m receiving projections from the anterior HDB and SI, whereas V2m was observed to receive projections from neurons distributed at every level of the HDB/SI. Moreover, the SI and anterior HDB appear send projections to virtually all subregions of the visual cortex examined. However, we did not obtain evidence of BF neuron organization reproducing the retinotopic organization of the visual areas. These results suggest that any part of the VDB/HDB/anterior SI is likely to be able to modulate different areas of visual cortex.
Spatial Organization of the Retrograde Labeled Cells
The present experiments revealed a low estimated number and broad dispersion of retrogradely labeled BF cells throughout the HDB/SI, suggesting that the axonal field of a single BF cell is quite restricted and that the axonal fields of different BF cells have quite limited, if any, overlap. A larger axonal field would have resulted in a greater density of labeled BF cells projecting directly or to the periphery of the injection site, even following a small injection. There is some controversy as to the size of the area of cortex innervated by individual BF neurons. In the rat, the terminal fields of cholinergic neurons appear to be restricted to a surface area that is ∼1.5 mm in diameter (Price and Stern, 1983; Saper, 1984), whereas more widespread termination has been reported in the cat (Adams et al., 1986). The present results tend to confirm a restricted axonal field of BF neuron projections to V1, a circumstance consistent with BF cholinergic axons containing few collateral fibers. Without excluding the possibility of en passant boutons underlying volume transmission, such restricted terminal fields also suggest that a single BF neuron has a rather precise projection. Meanwhile, the low number of cells found to have retrograde tracer from particular visual area injection sites suggests that BF projections to visual cortex are rather scattered. This circumstance, however, contrasts with the features of cholinergic innervation of occipital cortex, which shows a high density of cholinergic fibers (1.5–5.6 m per mm2 of cortical surface) and varicosities (0.6–2.3 × 10⁶ per mm2 of cortical surface). This density is much greater than that of any other neuromodulatory system (Mechawar et al., 2000). However, it is probable that en passant axons do not uptake microinjected CTb.
Our scarce observation of clusters further suggests limited overlap in axonal arborizations. High degrees of overlap would have been expected to result in more clusters. For example, a high density of labeled cells was seen in adjacent cortical regions in the present study (data not shown) and in thalamic nuclei previously (Conte et al., 2009). Clustering is a common hallmark of long-range cortico-cortical connections in the visual cortex of tree shrews, cats, monkeys and rats (Rockland and Lund, 1982; Livingstone and Hubel, 1984; Burkhalter, 1989; Gilbert and Wiesel, 1989). This type of organization appears when two cortical territories interact in a precise manner. The BF clusters shown in the present study appeared only following large injections, suggesting that the clustered cells project to distinct areas. With small injections, generally, only one cell or two cells were marked within single sections.
Notably, virtually all of the retrogradely labeled cells in this study were immunopositive for ChAT. This result is in agreement with other studies reporting that cortex-tracer receiving cells in the SI-NBM were largely also ChAT positive (80–90%) (Rye et al., 1984). Many studies on cortical projections have focused on the cholinergic component, while some have confirmed that there is a GABAergic component to the BF projections to the cerebral cortex (Fisher et al., 1988; Gritti et al., 1997). BF neurons can regulate the activity of cortical neurons not only via direct projections to the cortex, but also via indirect projections through the thalamus. The aim of the present study was not to establish the biochemical nature of the BF to the cortex connection, but we can confirm that most BF cells that are retrogradely labeled from visual cortex are cholinergic.
Together, these results indicate wide distributions of BF cells projecting to particular visual cortex sites and confirm a limited axonal arborization of cholinergic BF corticopetal projections. This arrangement fits with the BF’s apparent role in facilitating coordination between cortical subareas (Duque et al., 2000; Pinto et al., 2013). Our findings confirm a previous observation that projections to the prefrontal cortex or V1 originate from BF cells intermingled in the HDB (Laplante et al., 2005), and a recent study showing similar results in the auditory cortex (Chavez and Zaborszky, 2017).
No Clear Recurrent Organization
Injections in the same area lead to different locations of stained BF cells from one animal to another, without evidence of a systematic organization pattern and certainly not reproducing the retinotopy of the visual cortex. If BF to V1 projections were precisely organized, one would expect that injection into a restricted quadrant of the visual cortex should lead to the consistent labeling of corresponding BF groups of cells and some pattern should repeat across animals. For example, in a tightly organized nucleus like the lateral geniculate, each part corresponds to a particular retinotopic region in the visual cortex (Reese and Jeffery, 1983; Piscopo et al., 2013; Castonguay et al., 2014). Previous studies have shown an organization that is relatively constant from one animal to the next, although there is a puzzling variability across published functional retinotopic maps (Adams and Forrester, 1968; Espinoza and Thomas, 1983; Gias et al., 2005). In particular, the medio-lateral coordinates of the visual cortex have been variable across studies, most likely due to the use of a flat mount versus a dorsal view of the brain. Our results suggest that a single locus within the BF is able to modulate diverse types of visual neurons over large surfaces of the visual cortex.
Nevertheless, there is a rostro-caudal organization tendency of HDB projections in which V1 is more abundantly innervated by rostral HDB than V2, which receives projections from all over the HDB. Such a rostro-caudal organization of projections is seen in NBM projections to the fronto-parietal cortices and has been well-characterized (Luiten et al., 1987; Gaykema et al., 1990). Likewise, BF cells projecting to primary auditory cortex were shown to be located in a more limited region than those projecting to secondary auditory cortex (Chavez and Zaborszky, 2017). These studies suggest that BF projections may play an integrative role in sensory cortices, which could be stronger in associative areas.
It can be assumed that distant projecting cells are activated by a larger variety of stimuli, thus increasing the integration weight of these projections. There is, however, a lack of understanding of how BF cells are activated, such as which region or stimulus elicits BF neuronal firing and if there is discrete BF activation of different BF subgroups. Many modulatory systems are able to activate cholinergic BF cells, such as the noradrenergic locus coeruleus, the serotoninergic raphe dorsalis, and the cholinergic pedonculopontine nucleus. The BF (especially the HDB) receives substantial innervation from the prefrontal cortex (Gaykema et al., 1991; Golmayo et al., 2003; Vertes, 2004) and is modulated by the amygdala and caudate putamen (Gielow and Zaborszky, 2017). It has been predicted that BF firing should be elicited by the prefrontal cortex (Golmayo et al., 2003), but this expectation has not yet been supported by anatomo-functional evidence of spontaneous activity. It is also not known whether the whole BF functions as a single entity, such that interconnections between BF subregions are able to either coordinate or isolate the cholinergic input affecting specific cortical areas. All these questions should be investigated to better understand how the BF modulates the cortex.
Functional Effects of ACh Cells
Functional effects of BF cells are widespread, consistent with the neuromodulatory role of the BF. Single-unit recordings in the BF in combination with electroencephalographic (EEG) monitoring in animals during various behaviors have indicated that BF inputs to the neocortex correlate with activation of the neocortex (Pirch et al., 1986; Buzsaki et al., 1988; Metherate et al., 1992; Nunez, 1996; Duque et al., 2000). ACh-positive cells have been linked with frontal EEG state in the rat (Metherate et al., 1992) and EEG data correlate with the discharge profiles of NBM neurons (Buzsaki et al., 1988; Duque et al., 2000). This research supports the hypothesis that the cholinergic BF provides a steady background of neocortical activation that may facilitate or enhance the effects of other afferents to the neocortex (Duque et al., 2000). The stimulation of specific BF sites can produce either large-scale ACh release in the motor, somatosensory, and visual cortices, or restricted ACh release in one of these cortical areas (Jimenez-Capdeville et al., 1997). The present lack of evidence of clear retinotopic organization supports the view that the cholinergic BF has a broad modulatory role, reflected in EEG recordings, which can enhance local cortical processing.
This ubiquitous control of different visual areas by neighbor BF cholinergic neurons might also refine the transmission of visual fluxes throughout visual pathways. The visual processing results from coordinated actions of complementary visual areas with mirror functions (Zhuang et al., 2017). Thalamocortical inputs are processed within V1 but are also modulated by local, horizontal, as well as long-range recurrent microcircuits. Cholinergic modulation acts at every level of these microcircuits, enabling enhancement and facilitation of particular stimuli (Kang et al., 2014). For example, ACh might promote the co-activation of different cortical areas or layers (Obermayer et al., 2017) enabling selection of stimuli related to summation of the temporally coincident presynaptic spikes (Fries et al., 2002) or enabling expended cortical representation of sensory stimuli related to decorrelation between neurons (Goard and Dan, 2009). It can also trigger gamma oscillations allowing coordination between areas and triggering learning (Rodriguez et al., 2010; Nair et al., 2016).
Conclusion
The present results indicate that BF projections to V1 and V2 are not organized according to the functional organization of the visual cortex. Rather, the results suggest that a single visual cortex region is controlled by different levels of the HDB and that the different BF subregions project broadly across visual cortex areas, although laminar projections were not investigated. Because ACh can facilitate or depress cortical responses, these findings imply that any BF region with projections to visual cortex can modulate visual processing at different hierarchical levels, an arrangement that confers a strong modulatory potency of cholinergic innervation upon visual cortex activities.
Author Contributions
EV and FH-G: designed this study and drafted and wrote the manuscript. KJ and FH-G: contributed to the acquisition, analysis, and interpretation of the data in this study. EV: contributed to the interpretation of the data. All authors have approved the final version of the manuscript; agree to be accountable for all aspects of the work in ensuring that questions related to the accuracy or integrity of any part of the work are appropriately investigated and resolved; designated as authors qualify for authorship and who qualify for authorship are listed.
Funding
Canadian Institutes of Health Research (Grant No. MOP-111003 to EV) and Natural Sciences and Engineering Research Council of Canada (Grant No. 238835-2011 to EV).
Conflict of Interest Statement
The authors declare that the research was conducted in the absence of any commercial or financial relationships that could be construed as a potential conflict of interest.
Acknowledgments
We are grateful to Salam Bouhabel and Isabelle Godbout for their technical assistance and Micheline Gloin for her help with graphics.
References
Adams, A. D., and Forrester, J. M. (1968). The projection of the rat’s visual field on the cerebral cortex. Q. J. Exp. Physiol. Cogn. Med. Sci. 53, 327–336. doi: 10.1113/expphysiol.1968.sp001974
Adams, C. E., Cepeda, C., Boylan, M. K., Fisher, R. S., Hull, C. D., Buchwald, N. A., et al. (1986). Basal forebrain neurons have axon collaterals that project to widely divergent cortical areas in the cat. Brain Res. 397, 365–371. doi: 10.1016/0006-8993(86)90640-2
Burkhalter, A. (1989). Intrinsic connections of rat primary visual cortex: laminar organization of axonal projections. J. Comp. Neurol. 279, 171–186. doi: 10.1002/cne.902790202
Buzsaki, G., Bickford, R. G., Ponomareff, G., Thal, L. J., Mandel, R., and Gage, F. H. (1988). Nucleus basalis and thalamic control of neocortical activity in the freely moving rat. J. Neurosci. 8, 4007–4026.
Castonguay, A., Thomas, S., Lesage, F., and Casanova, C. (2014). Repetitive and retinotopically restricted activation of the dorsal lateral geniculate nucleus with optogenetics. PLoS One 9:e94633. doi: 10.1371/journal.pone.0094633
Chavez, C., and Zaborszky, L. (2017). Basal forebrain cholinergic-auditory cortical network: primary versus nonprimary auditory cortical areas. Cereb. Cortex 27, 2335–2347. doi: 10.1093/cercor/bhw091
Conte, W. L., Kamishina, H., and Reep, R. L. (2009). The efficacy of the fluorescent conjugates of cholera toxin subunit B for multiple retrograde tract tracing in the central nervous system. Brain Struct. Funct. 213, 367–373. doi: 10.1007/s00429-009-0212-x
Coppola, J. J., Ward, N. J., Jadi, M. P., and Disney, A. A. (2016). Modulatory compartments in cortex and local regulation of cholinergic tone. J. Physiol. Paris 110, 3–9. doi: 10.1016/j.jphysparis.2016.08.001
Descarries, L., and Mechawar, N. (2000). Ultrastructural evidence for diffuse transmission by monoamine and acetylcholine neurons of the central nervous system. Prog. Brain Res. 125, 27–47. doi: 10.1016/S0079-6123(00)25005-X
Duque, A., Balatoni, B., Detari, L., and Zaborszky, L. (2000). EEG correlation of the discharge properties of identified neurons in the basal forebrain. J. Neurophysiol. 84, 1627–1635. doi: 10.1152/jn.2000.84.3.1627
Espinoza, S. G., and Thomas, H. C. (1983). Retinotopic organization of striate and extrastriate visual cortex in the hooded rat. Brain Res. 272, 137–144. doi: 10.1016/0006-8993(83)90370-0
Fisher, R. S., Buchwald, N. A., Hull, C. D., and Levine, M. S. (1988). Gabaergic basal forebrain neurons project to the neocortex - the localization of glutamic-acid decarboxylase and choline-acetyltransferase in feline corticopetal neurons. J. Comp. Neurol. 272, 489–502. doi: 10.1002/cne.902720404
Fournier, G. N., Semba, K., and Rasmusson, D. D. (2004). Modality- and region-specific acetylcholine release in the rat neocortex. Neuroscience 126, 257–262. doi: 10.1016/j.neuroscience.2004.04.002
Fries, P., Schroder, J. H., Roelfsema, P. R., Singer, W., and Engel, A. K. (2002). Oscillatory neuronal synchronization in primary visual cortex as a correlate of stimulus selection. J. Neurosci. 22, 3739–3754.
Gaykema, R. P., Luiten, P. G., Nyakas, C., and Traber, J. (1990). Cortical projection patterns of the medial septum-diagonal band complex. J. Comp. Neurol. 293, 103–124. doi: 10.1002/cne.902930109
Gaykema, R. P., Van Weeghel, R., Hersh, L. B., and Luiten, P. G. (1991). Prefrontal cortical projections to the cholinergic neurons in the basal forebrain. J. Comp. Neurol. 303, 563–583. doi: 10.1002/cne.903030405
Gias, C., Hewson-Stoate, N., Jones, M., Johnston, D., Mayhew, J. E., and Coffey, P. J. (2005). Retinotopy within rat primary visual cortex using optical imaging. Neuroimage 24, 200–206. doi: 10.1016/j.neuroimage.2004.08.015
Gielow, M. R., and Zaborszky, L. (2017). The input-output relationship of the cholinergic basal forebrain. Cell Rep. 18, 1817–1830. doi: 10.1016/j.celrep.2017.01.060
Gil, Z., Connors, B. W., and Amitai, Y. (1997). Differential regulation of neocortical synapses by neuromodulators and activity. Neuron 19, 679–686. doi: 10.1016/S0896-6273(00)80380-3
Gilbert, C. D., and Wiesel, T. N. (1989). Columnar specificity of intrinsic horizontal and corticocortical connections in cat visual cortex. J. Neurosci. 9, 2432–2442.
Goard, M., and Dan, Y. (2009). Basal forebrain activation enhances cortical coding of natural scenes. Nat. Neurosci. 12, 1444–1449. doi: 10.1038/nn.2402
Golmayo, L., Nunez, A., and Zaborszky, L. (2003). Electrophysiological evidence for the existence of a posterior cortical-prefrontal-basal forebrain circuitry in modulating sensory responses in visual and somatosensory rat cortical areas. Neuroscience 119, 597–609. doi: 10.1016/S0306-4522(03)00031-9
Gratton, C., Yousef, S., Aarts, E., Wallace, D. L., D’esposito, M., and Silver, M. A. (2017). Cholinergic, but not dopaminergic or noradrenergic, enhancement sharpens visual spatial perception in humans. J. Neurosci. 37, 4405–4415. doi: 10.1523/JNEUROSCI.2405-16.2017
Gritti, I., Mainville, L., Mancia, M., and Jones, B. E. (1997). GABAergic and other noncholinergic basal forebrain neurons, together with cholinergic neurons, project to the mesocortex and isocortex in the rat. J. Comp. Neurol. 383, 163–177. doi: 10.1002/(SICI)1096-9861(19970630)383:2<163::AID-CNE4>3.0.CO;2-Z
Hangya, B., Ranade, S. P., Lorenc, M., and Kepecs, A. (2015). Central cholinergic neurons are rapidly recruited by reinforcement feedback. Cell 162, 1155–1168. doi: 10.1016/j.cell.2015.07.057
Hasselmo, M. E., and Sarter, M. (2011). Modes and models of forebrain cholinergic neuromodulation of cognition. Neuropsychopharmacology 36, 52–73. doi: 10.1038/npp.2010.104
Herrero, J. L., Roberts, M. J., Delicato, L. S., Gieselmann, M. A., Dayan, P., and Thiele, A. (2008). Acetylcholine contributes through muscarinic receptors to attentional modulation in V1. Nature 454, 1110–1114. doi: 10.1038/nature07141
Jimenez-Capdeville, M. E., Dykes, R. W., and Myasnikov, A. A. (1997). Differential control of cortical activity by the basal forebrain in rats: a role for both cholinergic and inhibitory influences. J. Comp. Neurol. 381, 53–67. doi: 10.1002/(SICI)1096-9861(19970428)381:1<53::AID-CNE5>3.0.CO;2-J
Kang, J. I., Huppe-Gourgues, F., and Vaucher, E. (2014). Boosting visual cortex function and plasticity with acetylcholine to enhance visual perception. Front. Syst. Neurosci. 8:172. doi: 10.3389/fnsys.2014.00172
Krieg, W. J. (1946). Connections of the cerebral cortex. I. the albino rat. A. topography of the cortical areas. J. Comp. Neurol. 84, 221–275. doi: 10.1002/cne.900840205
Laplante, F., Morin, Y., Quirion, R., and Vaucher, E. (2005). Acetylcholine release is elicited in the visual cortex, but not in the prefrontal cortex, by patterned visual stimulation: a dual microdialysis study with functional correlates in the rat brain. Neuroscience 132, 501–510. doi: 10.1016/j.neuroscience.2004.11.059
Lin, S. C., Brown, R. E., Hussain Shuler, M. G., Petersen, C. C., and Kepecs, A. (2015). Optogenetic dissection of the basal forebrain neuromodulatory control of cortical activation, plasticity, and cognition. J. Neurosci. 35, 13896–13903. doi: 10.1523/JNEUROSCI.2590-15.2015
Livingstone, M. S., and Hubel, D. H. (1984). Specificity of intrinsic connections in primate primary visual cortex. J. Neurosci. 4, 2830–2835.
Luiten, P. G., Gaykema, R. P., Traber, J., and Spencer, D. G. Jr. (1987). Cortical projection patterns of magnocellular basal nucleus subdivisions as revealed by anterogradely transported Phaseolus vulgaris leucoagglutinin. Brain Res. 413, 229–250. doi: 10.1016/0006-8993(87)91014-6
Mechawar, N., Cozzari, C., and Descarries, L. (2000). Cholinergic innervation in adult rat cerebral cortex: a quantitative immunocytochemical description. J. Comp. Neurol. 428, 305–318. doi: 10.1002/1096-9861(20001211)428:2<305::AID-CNE9>3.0.CO;2-Y
Mesulam, M. M., Mufson, E. J., Wainer, B. H., and Levey, A. I. (1983). Central cholinergic pathways in the rat: an overview based on an alternative nomenclature (Ch1-Ch6). Neuroscience 10, 1185–1201. doi: 10.1016/0306-4522(83)90108-2
Metherate, R., Cox, C. L., and Ashe, J. H. (1992). Cellular bases of neocortical activation: modulation of neural oscillations by the nucleus basalis and endogenous acetylcholine. J. Neurosci. 12, 4701–4711.
Montero, V. M., Rojas, A., and Torrealba, F. (1973). Retinotopic organization of striate and peristriate visual cortex in the albino rat. Brain Res. 53, 197–201. doi: 10.1016/0006-8993(73)90780-4
Mouton, P. R., Gokhale, A. M., War, N. L., and West, M. J. (2002). Stereological length estimation using spherical probes. J. Microsc. 206, 54–64. doi: 10.1046/j.1365-2818.2002.01006.x
Nair, J., Klaassen, A. L., Poirot, J., Vyssotski, A., Rasch, B., and Rainer, G. (2016). Gamma band directional interactions between basal forebrain and visual cortex during wake and sleep states. J. Physiol. Paris 110, 19–28. doi: 10.1016/j.jphysparis.2016.11.011
Nunez, A. (1996). Unit activity of rat basal forebrain neurons: relationship to cortical activity. Neuroscience 72, 757–766. doi: 10.1016/0306-4522(95)00582-X
Obermayer, J., Verhoog, M. B., Luchicchi, A., and Mansvelder, H. D. (2017). Cholinergic modulation of cortical microcircuits is layer-specific: evidence from rodent, monkey and human brain. Front. Neural Circuits 11:100. doi: 10.3389/fncir.2017.00100
Paxinos, G., and Watson, C. R. (1997). The Rat Brain in Stereotaxic Coordinates, 4th Edn. Sydney, NSW: Academic Press.
Pinto, L., Goard, M. J., Estandian, D., Xu, M., Kwan, A. C., Lee, S. H., et al. (2013). Fast modulation of visual perception by basal forebrain cholinergic neurons. Nat. Neurosci. 16, 1857–1863. doi: 10.1038/nn.3552
Pirch, J. H., Corbus, M. J., Rigdon, G. C., and Lyness, W. H. (1986). Generation of cortical event-related slow potentials in the rat involves nucleus basalis cholinergic innervation. Electroencephalogr. Clin. Neurophysiol. 63, 464–475. doi: 10.1016/0013-4694(86)90128-8
Piscopo, D. M., El-Danaf, R. N., Huberman, A. D., and Niell, C. M. (2013). Diverse visual features encoded in mouse lateral geniculate nucleus. J. Neurosci. 33, 4642–4656. doi: 10.1523/JNEUROSCI.5187-12.2013
Price, J. L., and Stern, R. (1983). Individual cells in the nucleus basalis–diagonal band complex have restricted axonal projections to the cerebral cortex in the rat. Brain Res. 269, 352–356. doi: 10.1016/0006-8993(83)90145-2
Reese, B. E., and Jeffery, G. (1983). Crossed and uncrossed visual topography in dorsal lateral geniculate nucleus of the pigmented rat. J. Neurophysiol. 49, 877–885. doi: 10.1152/jn.1983.49.4.877
Ricciardi, E., Handjaras, G., Bernardi, G., Pietrini, P., and Furey, M. L. (2013). Cholinergic enhancement reduces functional connectivity and BOLD variability in visual extrastriate cortex during selective attention. Neuropharmacology 64, 305–313. doi: 10.1016/j.neuropharm.2012.07.003
Roberts, M. J., Zinke, W., Guo, K., Robertson, R., Mcdonald, J. S., and Thiele, A. (2005). Acetylcholine dynamically controls spatial integration in marmoset primary visual cortex. J. Neurophysiol. 93, 2062–2072. doi: 10.1152/jn.00911.2004
Rockland, K. S., and Lund, J. S. (1982). Widespread periodic intrinsic connections in the tree shrew visual cortex. Science 215, 1532–1534. doi: 10.1126/science.7063863
Rodriguez, R., Kallenbach, U., Singer, W., and Munk, M. H. J. (2010). Stabilization of visual responses through cholinergic activation. Neuroscience 165, 944–954. doi: 10.1016/j.neuroscience.2009.10.059
Rye, D. B., Wainer, B. H., Mesulam, M. M., Mufson, E. J., and Saper, C. B. (1984). Cortical projections arising from the basal forebrain: a study of cholinergic and noncholinergic components employing combined retrograde tracing and immunohistochemical localization of choline acetyltransferase. Neuroscience 13, 627–643. doi: 10.1016/0306-4522(84)90083-6
Saper, C. B. (1984). Organization of cerebral cortical afferent systems in the rat. II. Magnocellular basal nucleus. J. Comp. Neurol. 222, 313–342. doi: 10.1002/cne.902220302
Sarter, M., Hasselmo, M. E., Bruno, J. P., and Givens, B. (2005). Unraveling the attentional functions of cortical cholinergic inputs: interactions between signal-driven and cognitive modulation of signal detection. Brain Res. Rev. 48, 98–111. doi: 10.1016/j.brainresrev.2004.08.006
Shute, C. C., and Lewis, P. R. (1967). The ascending cholinergic reticular system: neocortical, olfactory and subcortical projections. Brain 90, 497–520. doi: 10.1093/brain/90.3.497
Soma, S., Shimegi, S., Suematsu, N., Tamura, H., and Sato, H. (2013). Modulation-specific and laminar-dependent effects of acetylcholine on visual responses in the rat primary visual cortex. PLoS One 8:e68430. doi: 10.1371/journal.pone.0068430
Vaucher, E., and Hamel, E. (1995). Cholinergic basal forebrain neurons project to cortical microvessels in the rat: electron microscopic study with anterogradely transported Phaseolus vulgaris leucoagglutinin and choline acetyltransferase immunocytochemistry. J. Neurosci. 15, 7427–7441.
Vertes, R. P. (2004). Differential projections of the infralimbic and prelimbic cortex in the rat. Synapse 51, 32–58. doi: 10.1002/syn.10279
Woolf, N. J. (1991). Cholinergic systems in mammalian brain and spinal cord. Prog. Neurobiol. 37, 475–524. doi: 10.1016/0301-0082(91)90006-M
Yamasaki, M., Matsui, M., and Watanabe, M. (2010). Preferential localization of muscarinic M1 receptor on dendritic shaft and spine of cortical pyramidal cells and its anatomical evidence for volume transmission. J. Neurosci. 30, 4408–4418. doi: 10.1523/JNEUROSCI.5719-09.2010
Zaborszky, L., Csordas, A., Mosca, K., Kim, J., Gielow, M. R., Vadasz, C., et al. (2015). Neurons in the basal forebrain project to the cortex in a complex topographic organization that reflects corticocortical connectivity patterns: an experimental study based on retrograde tracing and 3D reconstruction. Cereb. Cortex 25, 118–137. doi: 10.1093/cercor/bht210
Zaborszky, L., and Duque, A. (2000). Local synaptic connections of basal forebrain neurons. Behav. Brain Res. 115, 143–158. doi: 10.1016/S0166-4328(00)00255-2
Zhang, Z. W., Kang, J. I., and Vaucher, E. (2011). Axonal varicosity density as an index of local neuronal interactions. PLoS One 6:e22543. doi: 10.1371/journal.pone.0022543
Keywords: cholera toxin B, visual cortex, diagonal band of Broca, acetylcholine, topographic maps, Long–Evans rat, cortical neuromodulation
Citation: Huppé-Gourgues F, Jegouic K and Vaucher E (2018) Topographic Organization of Cholinergic Innervation From the Basal Forebrain to the Visual Cortex in the Rat. Front. Neural Circuits 12:19. doi: 10.3389/fncir.2018.00019
Received: 20 November 2017; Accepted: 19 February 2018;
Published: 08 March 2018.
Edited by:
Michael E. Hasselmo, Boston University, United StatesReviewed by:
Styliani Vlachou, Dublin City University, IrelandMatthew R. Gielow, Rutgers University–Newark, United States
Copyright © 2018 Huppé-Gourgues, Jegouic and Vaucher. This is an open-access article distributed under the terms of the Creative Commons Attribution License (CC BY). The use, distribution or reproduction in other forums is permitted, provided the original author(s) and the copyright owner are credited and that the original publication in this journal is cited, in accordance with accepted academic practice. No use, distribution or reproduction is permitted which does not comply with these terms.
*Correspondence: Elvire Vaucher, ZWx2aXJlLnZhdWNoZXJAdW1vbnRyZWFsLmNh