 Wenyu Deng
 Muneeb A. Faiq
 Crystal Liu
 Vishnu Adi
 Kevin C. Chan
- 1NYU Langone Eye Center, Department of Ophthalmology, NYU School of Medicine, NYU Langone Health, New York University, New York, NY, United States
- 2Department of Radiology, NYU School of Medicine, NYU Langone Health, New York University, New York, NY, United States
- 3Center for Neural Science, Faculty of Arts and Science, New York University, New York, NY, United States
Understanding the mechanisms of vision in health and disease requires knowledge of the anatomy and physiology of the eye and the neural pathways relevant to visual perception. As such, development of imaging techniques for the visual system is crucial for unveiling the neural basis of visual function or impairment. Magnetic resonance imaging (MRI) offers non-invasive probing of the structure and function of the neural circuits without depth limitation, and can help identify abnormalities in brain tissues in vivo. Among the advanced MRI techniques, manganese-enhanced MRI (MEMRI) involves the use of active manganese contrast agents that positively enhance brain tissue signals in T1-weighted imaging with respect to the levels of connectivity and activity. Depending on the routes of administration, accumulation of manganese ions in the eye and the visual pathways can be attributed to systemic distribution or their local transport across axons in an anterograde fashion, entering the neurons through voltage-gated calcium channels. The use of the paramagnetic manganese contrast in MRI has a wide range of applications in the visual system from imaging neurodevelopment to assessing and monitoring neurodegeneration, neuroplasticity, neuroprotection, and neuroregeneration. In this review, we present four major domains of scientific inquiry where MEMRI can be put to imperative use — deciphering neuroarchitecture, tracing neuronal tracts, detecting neuronal activity, and identifying or differentiating glial activity. We deliberate upon each category studies that have successfully employed MEMRI to examine the visual system, including the delivery protocols, spatiotemporal characteristics, and biophysical interpretation. Based on this literature, we have identified some critical challenges in the field in terms of toxicity, and sensitivity and specificity of manganese enhancement. We also discuss the pitfalls and alternatives of MEMRI which will provide new avenues to explore in the future.
Introduction
The visual system is a vital and complex component of the central nervous system that receives and processes electrochemical information for visual perception. Not only does it comprise the specialized sensory organ (i.e., the eye), but also the optic nerve fibers, the visual brain nuclei, as well as the feedforward and feedback pathways to and from the visual cortex (Gilbert and Li, 2013) (Figures 1A,B). To understand the mechanisms of visual perception in health and disease, it is imperative to focus not only on the anatomy and physiology of the eye itself, but also the visual brain connections as well as their interactions in different types of visual impairments in an objective, quantitative, and non-invasive manner.
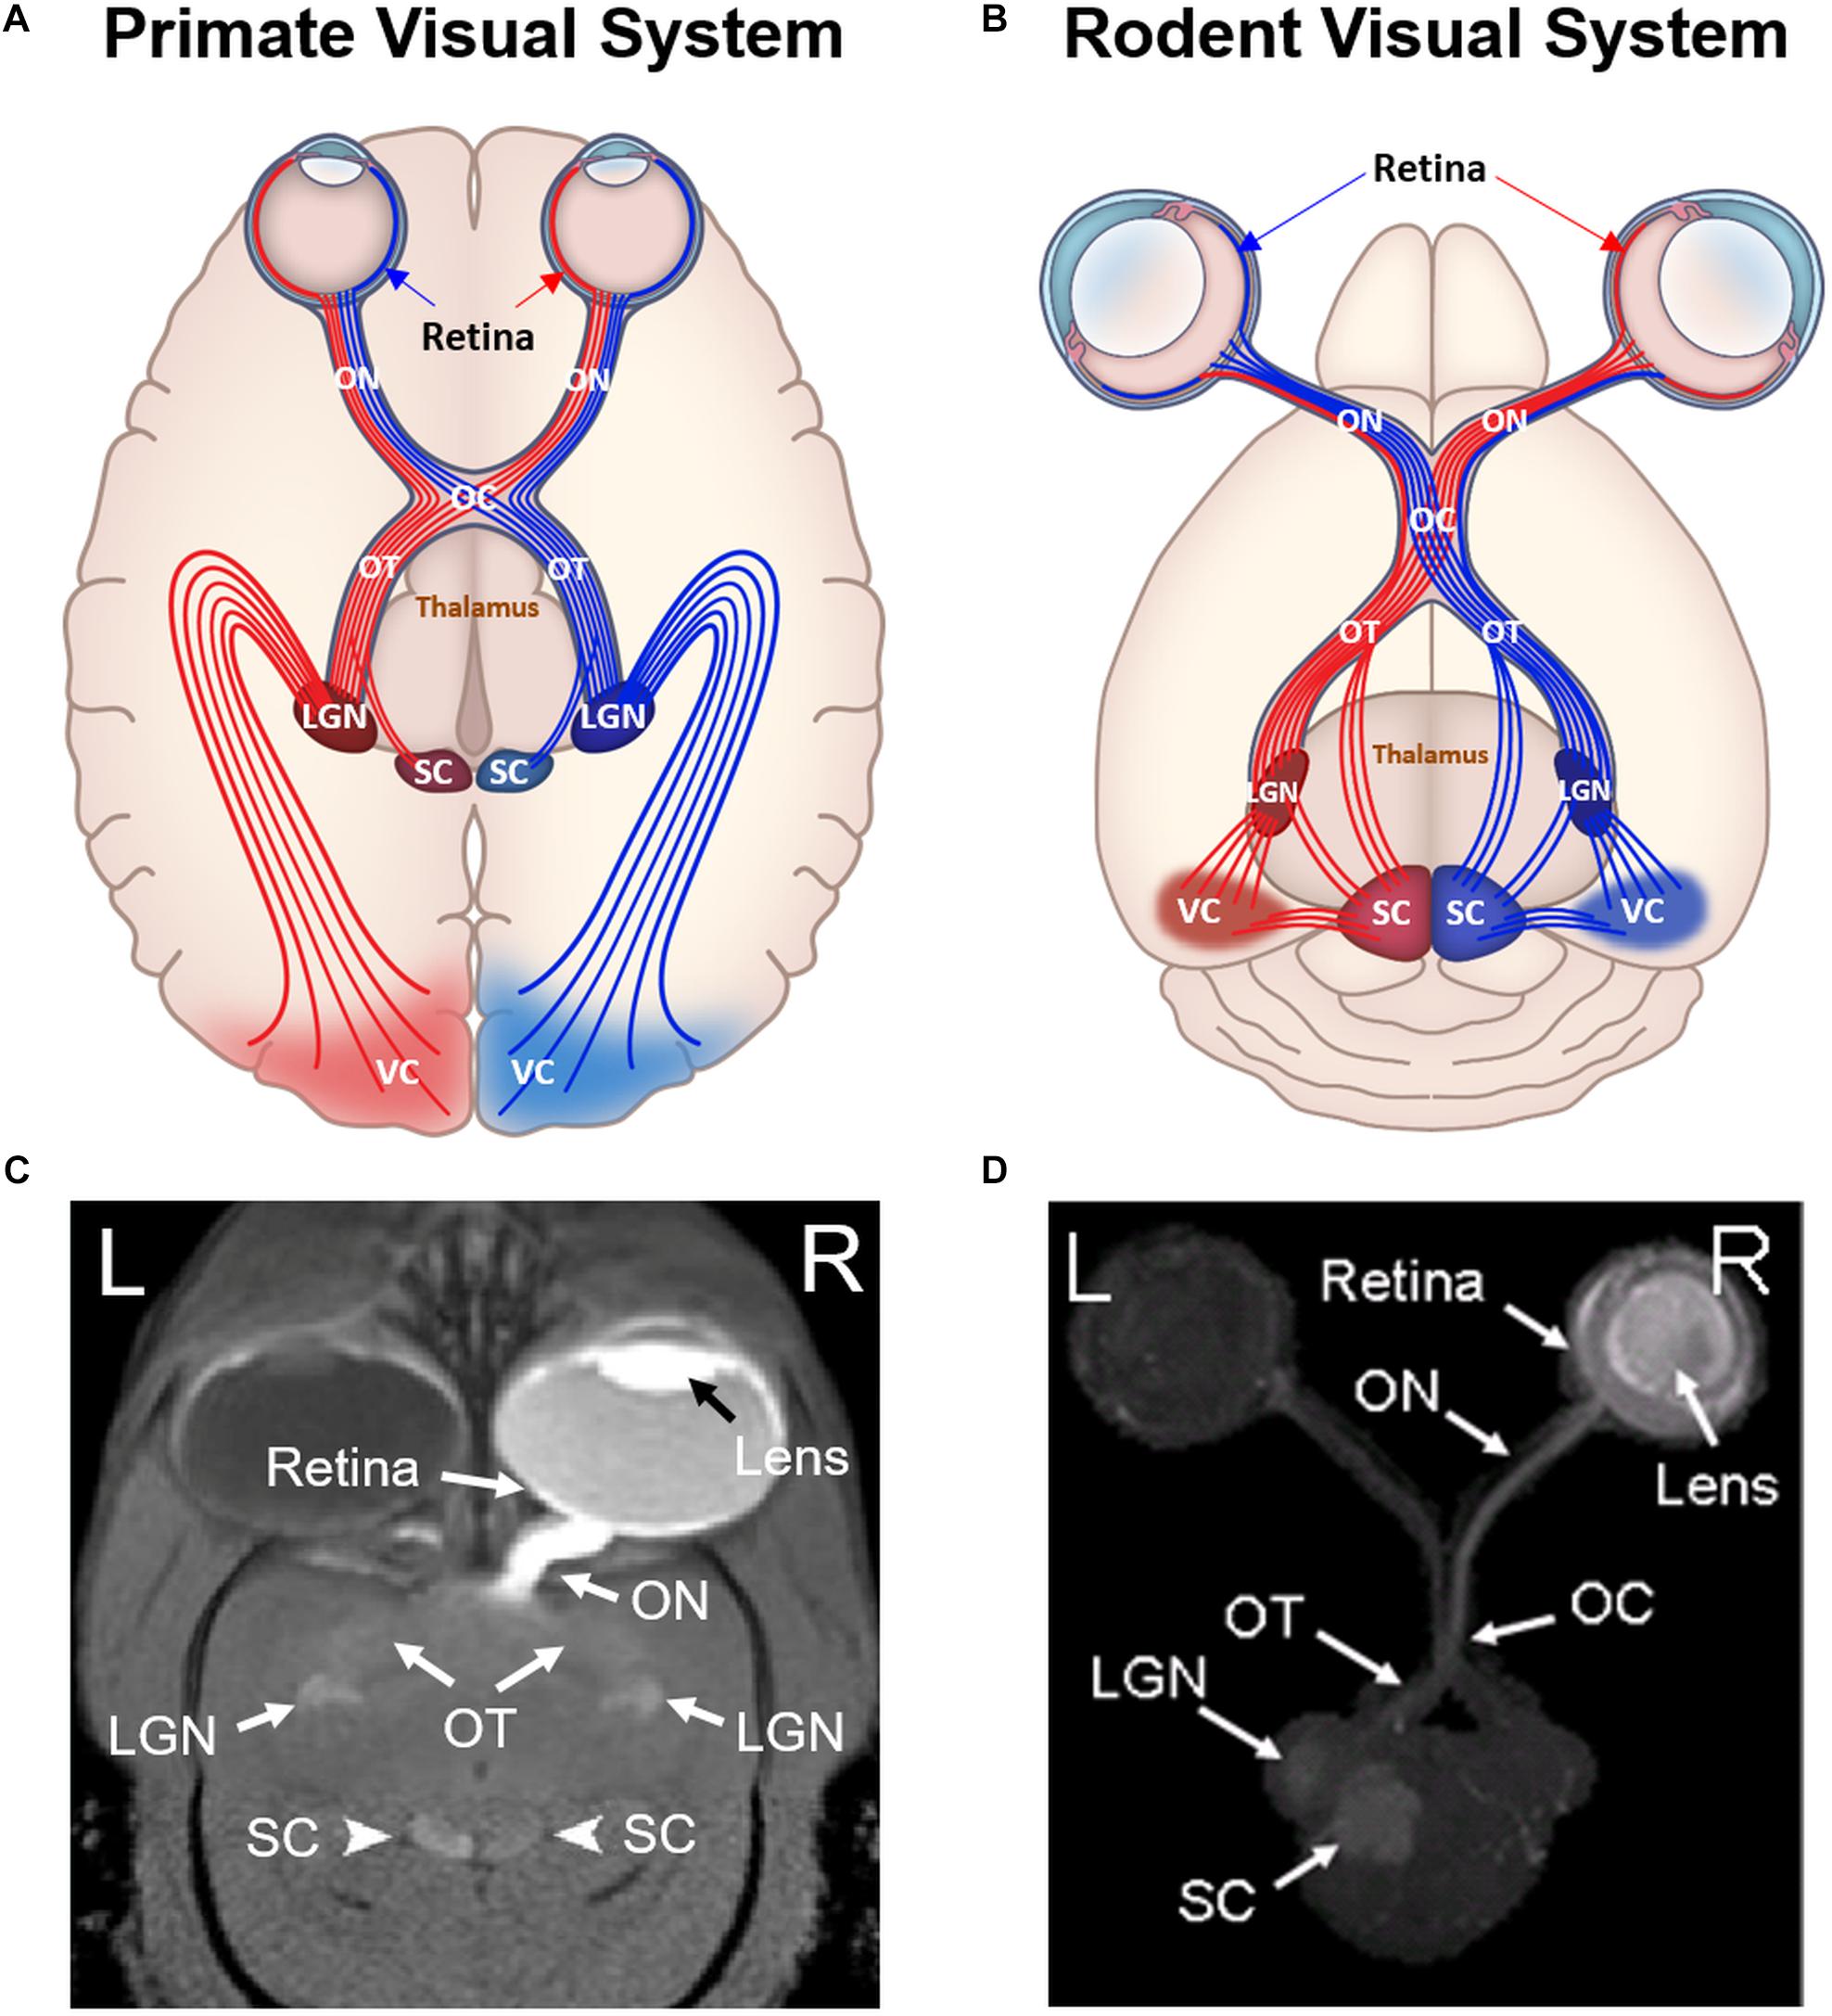
Figure 1. Comparisons between primate (A,C) and rodent visual systems (B,D). Schematic diagrams in (A,B) illustrate the ocular structures and fiber tracts originating from either left (red) or right (blue) visual cortex. Labeled structures include the retina, optic nerve (ON), optic chiasm (OC), optic tract (OT), superior colliculus (SC), lateral geniculate nucleus (LGN), and visual cortex (VC). In primates, around 53% of ON fibers cross the optic chiasm and project to the contralateral hemisphere (Kupfer et al., 1967). In contrast, more than 90% of rodent ON fibers project to the contralateral hemisphere after reaching the optic chiasm, while the remaining 5–10% of fibers project to ipsilateral hemisphere (Forrester and Peters, 1967). (C,D) are the corresponding Mn-enhanced MRI (MEMRI) scans after unilateral intravitreal injection into a marmoset and a rat respectively. (C) is in 2D oblique view, whereas (D) is in 3D axial maximum intensity projected view. Note the unilateral enhancement in the eye and the ON for both primate and rodent MEMRI. In the OT, LGN and SC, primate MEMRI showed bilateral enhancement as compared to unilateral enhancement in rodent MEMRI in the contralateral hemisphere of the injected eye. (C,D) are reproduced with permissions from Yamada et al. (2008) and Chan et al. (2017).
Magnetic resonance imaging (MRI) offers non-destructive probing of the structure and function of the neural circuits without depth limitation. It can also help identify abnormalities in brain tissues in vivo. Among the advanced MRI techniques, manganese-enhanced MRI (MEMRI) has substantiated in the past two decades as a valuable tool for visualizing the architecture and physiology of the brain and the peripheral structures. MEMRI has a number of advantages over existing MRI techniques including blood-oxygen-level-dependent functional MRI (BOLD fMRI), diffusion tensor imaging, and other contrast-enhanced MRI systems. In its ionic form (Mn2+), manganese is paramagnetic, which makes it a suitable contrast agent that positively enhances T1-weighted MRI intensities in local tissues as a result of contrast uptake over a defined period of time. Manganese (II) chloride (MnCl2) is the most commonly used exogenous salt in the delivery of Mn2+ to the central nervous system in vivo. MEMRI is useful in basic and preclinical neuroscience because Mn2+ can be actively transported along axons and can accumulate in brain tissues with respect to the level of connectivity and activity, thereby aiding in enhancing neuroarchitecture contrast and in functional brain mapping (Pautler et al., 1998; Silva and Bock, 2008; Massaad and Pautler, 2011; Chan et al., 2014a) (Figures 1C,D). Mn2+ administration and transport can be performed when the animals are awake, thus the effects of anesthesia on neuronal activity and Mn2+ transport can be avoided or minimized. Together with the availability of fast sequences for T1-weighted imaging and longitudinal relaxivity (R1) mapping (Chuang and Koretsky, 2006; Tambalo et al., 2009), MEMRI can be performed in vivo in studies with longitudinal design, though a caveat of toxicity at higher Mn2+ doses does exist. With whole brain imaging and temporal assessments, the same tissues or different tissues of the same animals can serve as an internal control of the experimental brain targets at baseline and over time. Due to its ability to enhance neuronal tracts, detect activity-dependent changes, and reveal changes in axon integrity, MEMRI is an excellent tool for analyzing neuronal structures within the visual system and for providing insights into the mechanisms underlying neurodegenerative conditions of the visual system (e.g., glaucoma, diabetic retinopathy, and retinitis pigmentosa) as well as neuroplasticity, neuroprotection, and neuroregeneration (Liang et al., 2011; Haenold et al., 2012; Sandvig and Sandvig, 2014; Van der Merwe et al., 2016). In this review, we aim to provide an overview of the use of MEMRI for studying ophthalmology and visual neuroscience. We will discuss the underlying mechanisms of Mn2+ transport and accumulation in the eye and the brain, the routes of administrations, chemical and imaging preparation, and the metabolism and safety of Mn2+ based contrast. We will focus on four major domains of scientific inquiry where MEMRI can be put to imperative use — deciphering neuroarchitecture, tracing neuronal tracts, detecting neuronal activity, and identifying or differentiating glial activity. Additionally, we will appraise the possible limitations of this modality and consider new opportunities for further investigations.
Mechanisms of Mn2+ Transport and Accumulation In Vivo
Due to its similarities with Ca2+ in terms of atomic size, chemistry, and valence, divalent manganese ions (Mn2+) tend to act as a Ca2+ analog by passing through voltage-gated calcium channels, making MEMRI an effective technique for visualizing neural activity in vivo. To bolster this hypothesis, mice deficient in L-type Ca2+ channel 1.2 (Cav1.2) were found to have a near 50% reduction in signal enhancement in MEMRI compared to control mice (Bedenk et al., 2018). These results demonstrate that (a) Cav1.2 is an important gateway for Mn2+ ions into neurons, and (b) Mn2+ biochemistry in neuronal milieu is similar to that of Ca2+ (except for their magnetic properties). Due to its unpaired electrons, Mn2+ is paramagnetic and acts as a positive contrast agent with short T1 relaxation time. As a result, tissues with high concentrations of Mn2+ generally appear as regions with bright signals in T1-weighted images.
Mn2+ ions are anterograde tract tracers, traveling away from the soma and toward projection terminals of neurons, then crossing the synapses before entering neighboring neurons. They can localize into the endoplasmic reticulum or Golgi bodies, and be actively transported along axons (Pautler, 2004; Watanabe et al., 2004; Van der Linden et al., 2007). The exact mechanism of Mn2+ transport is still elusive, but there is evidence to support a microtubule-dependent fast axonal transport mechanism. One study in Wistar rats involved unilateral administration of colchicine, a mitotic poison that inhibits microtubule polymerization, followed by bilateral administration of Mn2+ into the substantia nigra (Sloot and Gramsbergen, 1994). Axonal Mn2+ transport from the substantia nigra to the striatum was significantly decreased 48 h after Mn2+ injection in the colchicine-injected site compared to the control, suggesting that Mn2+ transport relies on microtubule polymerization (Sloot and Gramsbergen, 1994). Similar findings were also observed with unilateral injection of colchicine into the rat vitreous, which led to decreased Mn2+ enhancement in the ipsilateral optic nerve and contralateral superior colliculus (Hernandez et al., 2015).
The unique properties of Mn2+ gives MEMRI a number of advantages over a variety of contrast agents, BOLD fMRI, and diffusion tensor imaging. Compared to the passive T1 contrast agents such as gadolinium compounds (Chan et al., 2008b, 2012b; Ho et al., 2014), Mn2+ is an active contrast agent that can be used to detect activity-dependent changes and trans-synaptic transport in vivo. Since Mn2+ transport is independent of hemodynamic influences, MEMRI avoids the shortcomings seen in BOLD fMRI such as artifacts from draining veins and potential mismatches between neuronal activation and hemodynamic changes (Lin and Koretsky, 1997; Duong et al., 2000). Additionally, the use of Mn2+ as a direct tracer allows it to resolve fiber directions in areas of high curvature or tract crossing more easily than fiber modeling with diffusion tensor imaging (Lin et al., 2001). Mn2+ may reveal specifics of intracellular function (Barandov et al., 2019) while diffusion MRI may reflect transports in both intra- and extra-axonal spaces (Cheung et al., 2009; Hori et al., 2012; Wang Y. et al., 2015; Chung et al., 2018), though decisive opinions in the light of present literature are uncertain. It is possible to combine diffusion tensor imaging and MEMRI by using the same spatial parameters when performing both scans and overlaying the images (Lin et al., 2001). Diffusion tensor imaging has been verified by MEMRI in Mn2+-enhanced optic tracts and frontal eye fields (Lin et al., 2001; Yamada et al., 2008; Schaeffer et al., 2018) and vice versa across species. MEMRI is non-invasive which allows for effective longitudinal studies on brain structures — an advantage over histological studies which require sacrificing the animals. Diffusion tensor imaging and MEMRI can also complement one another to elucidate connectivity changes along the visual pathway in different optic neuropathy models (Thuen et al., 2009; Ho et al., 2015; Kancherla et al., 2016; Yang et al., 2018). Accumulation of Mn2+ ions in cells and neuronal tracts appears to be a proportionate marker of the neuronal activity and axonal integrity, making it valuable for probing both structural and functional connectivity between proximal and distal ends of the neural circuits in vivo.
Routes of Administration
Mn2+ can be delivered to the brain regions of interest via local intraocular and intracerebral administrations or systemic administrations into the blood stream (Figure 2). When choosing an appropriate delivery route, it is essential to consider the purpose of Mn2+ detection, the species, age, size, and gender of animal models, the frequency and dosage of Mn2+ administration, as well as the expected outcomes and caveats of each administration. These considerations are important as they may reflect different sensitivity, specificity, and mechanisms of Mn2+ enhancement in the brain targets (Silva et al., 2004; Silva and Bock, 2008; Chan et al., 2017). Furthermore, Mn2+ ions are toxic at high concentrations and may damage the target tissues or the local sites of administration (Bock et al., 2008; Thuen et al., 2008; Lin et al., 2014a; Vousden et al., 2018). It is pertinent to consider the cumulative effects of Mn2+ toxicity and design careful experiments especially if longitudinal assessments, functional/behavioral outcomes or histological studies are needed after Mn2+ injection. In most in vivo studies, Mn2+ is delivered as a bolus injection of MnCl2 solution. If a large amount of Mn2+ needs to be administered, continuous low-dose release or fractionation may minimize toxicity and hence bring down the probability of the adverse effects (Bock et al., 2008, 2009; Grunecker et al., 2010; Mok et al., 2012; Morch et al., 2012; Driencourt et al., 2017; Poole et al., 2017; Vousden et al., 2018). In the following paragraphs, we will elucidate a number of delivery routes used in MEMRI experiments of the visual system as well as relevant precautions of their use.
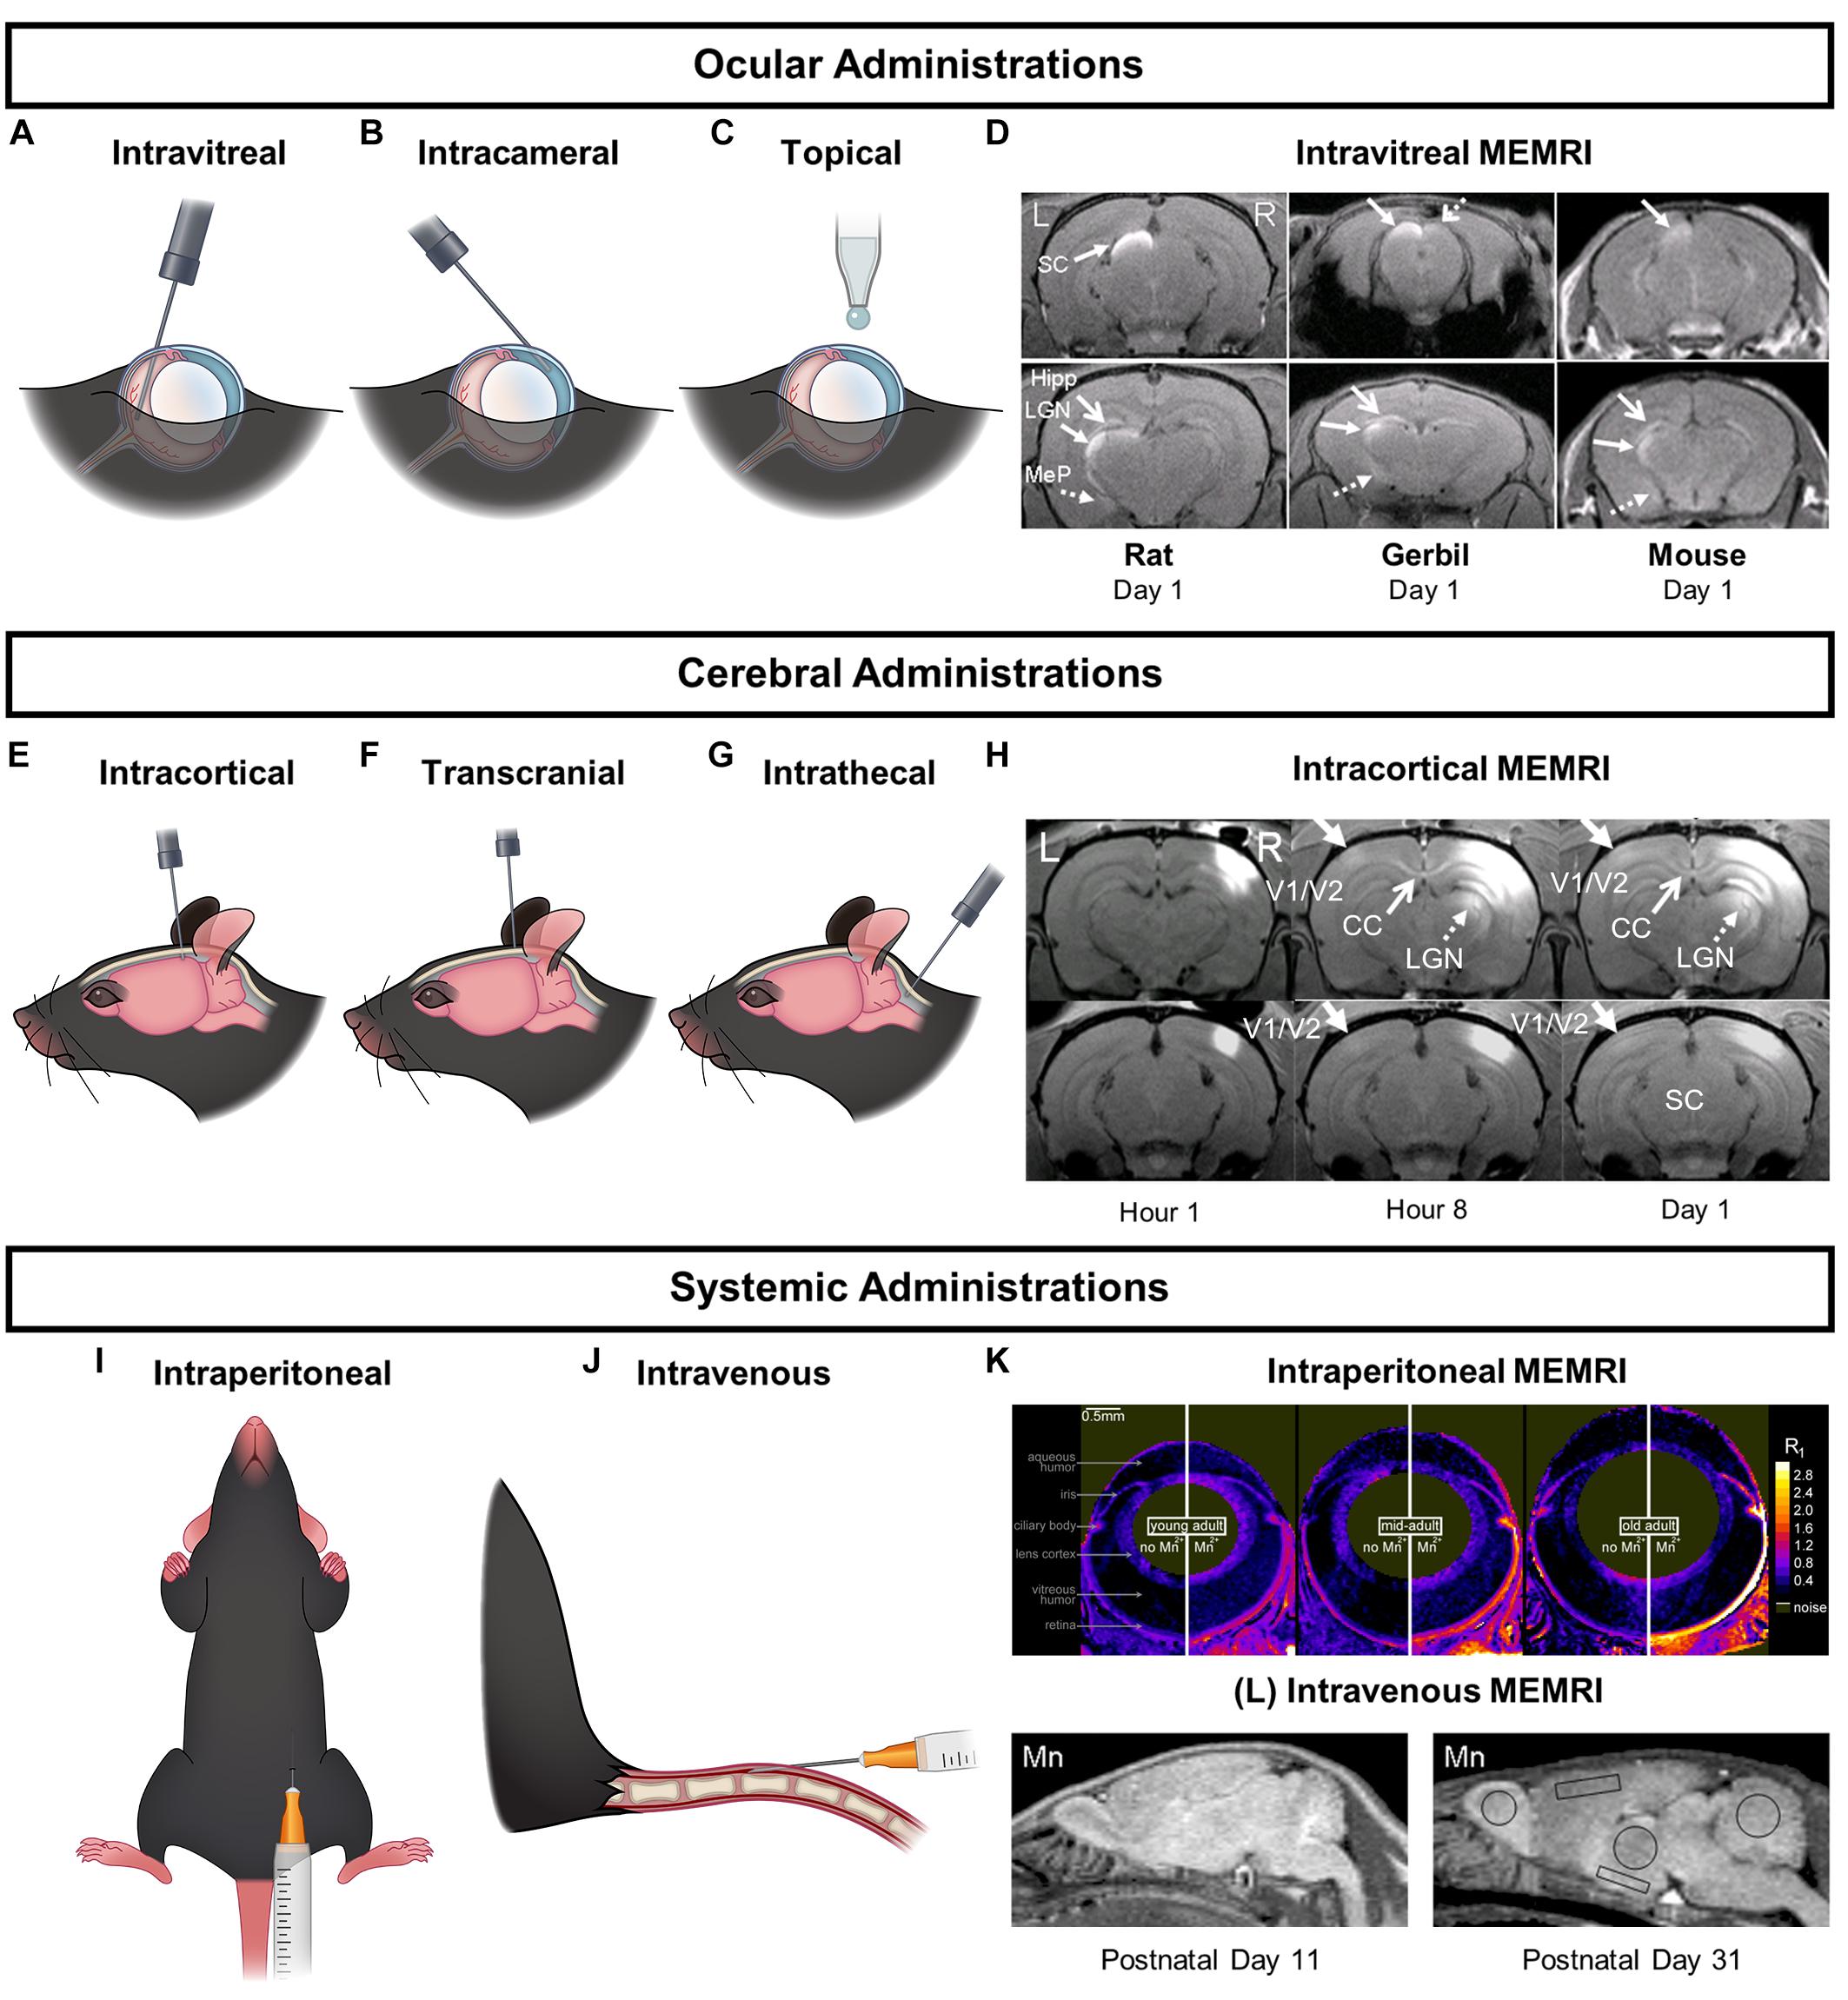
Figure 2. Major Mn2+ delivery routes and the corresponding MEMRI enhancement patterns in the visual system. (A–C,E–G,I,J) are schematic representations of ocular, cerebral, and systemic injection routes respectively. (D,H,K) are the corresponding MEMRI enhancement patterns in the brain as a result of the specific Mn2+ administrations. (D) is a series of MEMRI scans of the rat, gerbil, and mouse brains 1 day after an intravitreal Mn2+ injection. Mn2+ enhancement could be found in the contralateral SC and LGN along the central visual pathway, and in the non-visual regions in the contralateral hippocampus (Hipp) and medial posterior amygdala (MeP). (H) contains MEMRI scans of a rat brain after intracortical Mn2+ injection to the right V1/V2 transition zone at 1-, 8-, and 24-h time points. Mn2+ enhancement could be observed along the cortico-cortical pathways in the left contralateral V1/V2 border and the splenium of corpus callosum. Mn2+ was also seen to transport along the cortico-subcortical feedback pathways in the ipsilateral LGN and SC. MEMRI scans in (K) portray age-related increase in outer retinal Mn2+ uptake in Long Evans rats between 2.4 and 19 months old. MEMRI was taken at baseline and at about 4 h after intraperitoneal Mn2+ administration using quantitative mapping of tissue R1 values in units of s-1. (L) shows sagittal MEMRI scans of postnatal days (PD) 11 and 31 rats at 24 h after intravenous Mn2+ injection. Brain Mn2+ uptake appeared higher in neonates and decreased with brain development. An estimate of the relative cortical concentration of manganese uptake shows a twofold drop from PD 11 to PD 31. (D,H,K,L) are reproduced with permissions from de Sousa et al. (2007), Bissig et al. (2013), and Chan et al. (2014a, 2017).
Intravitreal MnCl2 injection is commonly used to investigate neuronal tracts of the central visual pathway by visualizing the retina, optic nerve, optic chiasm, superior colliculus, lateral geniculate nucleus, and sometimes the visual cortex (Watanabe et al., 2001; Murayama et al., 2006; Chan et al., 2008c, 2014a; Thuen et al., 2008; Yamada et al., 2008; Lindsey et al., 2013) at fractionated doses or at extended time points in T1-weighted images. It can also enhance the nearby non-visual brain regions such as hippocampus and amygdala (Chan et al., 2017). High concentrations of MnCl2 risk damaging the retinal ganglion cells, as well as compromising the integrity of other ocular structures such as the corneal stroma, endothelium, anterior chamber, lens, and outer retina (Thuen et al., 2008; Haenold et al., 2012; Luo et al., 2012; Xiao et al., 2019).
Topical administration of MnCl2 solution as eye drops onto the corneal surface presents a non-invasive and simple technique that can deliver Mn2+ into the visual system. While topical Mn2+ loading can enhance the anterior chamber, cornea, iris, retina, and the posterior visual pathways in the lateral geniculate nucleus and superior colliculus (Sun et al., 2012), no apparent enhancement in the vitreous chamber has been reported through this method, indicating that transportation of Mn2+ into the central visual pathway may not involve the vitreous and is likely independent of transcorneal diffusion (Sun et al., 2011; Lin et al., 2014a; Liang et al., 2015). Instead, uptake may involve permeation across the conjunctiva and sclera into the anterior uvea (Sun et al., 2011). Mn2+ uptake via this route can be significantly improved by surgical removal of the corneal epithelium, which indicates the presence of the physical corneal barrier to topical Mn2+ administration (Chen et al., 2016). To improve non-invasive Mn2+ entry into the eye, Mn2+ ions can be administered via transscleral and transcorneal iontophoresis by application of local electric current (Li et al., 2004). Transscleral iontophoresis leads to enhancements in the vitreous while transcorneal iontophoresis leads to Mn2+ filling of the anterior chamber (Li et al., 2004).
Intracameral MnCl2 injection has also been used to enhance the retina, optic nerve, superior colliculus, lateral geniculate nucleus, and visual cortex (Lindsey et al., 2007, 2013). However, this technique is less common likely because it is invasive while it does not provide substantial advantages over the topical loading. Additionally, it is not as direct as intravitreal injection for Mn2+ deposition into the retina.
Intracortical injection of MnCl2 to the rodent visual cortex has also been performed which results in Mn2+ enhancement in the splenium of corpus callosum, contralateral V1/V2 border, and the ipsilateral dorsal lateral geniculate nucleus and superior colliculus along the feedback pathway (Chan et al., 2012a). Recently, intracortical MnCl2 injection into the frontal eye field of primates has been used to study the neural circuits connected to this region (Schaeffer et al., 2018). These brain regions are areas that intraocular or topical administration cannot easily reach (Watanabe et al., 2001; Thuen et al., 2008).
Intrathecal or intracerebroventricular injection is another important route of Mn2+ administration that allows Mn2+ delivery to brain tissues while circumventing the blood–brain barrier. This technique requires a high level of expertise and precision comparable to intracortical injection. In a study carried out on Sprague-Dawley rats, MnCl2 injections through the cisterna magna resulted in Mn2+ enhancement around the cerebrospinal fluid space in the olfactory bulb, cortex, and the brain stem within the first 6 h of administration which lasted for at least 3 weeks (Liu et al., 2004). Mn2+ uptake from the cerebrospinal fluid circulation into neuronal structures likely includes mechanisms apart from passive diffusion (Bock et al., 2008, 2009), such as glia-mediated cerebrospinal fluid-interstitial fluid exchange (Iliff et al., 2013), though further investigations are needed to confirm the specificity of Mn2+ enhancement via this pathway. Alternatively, intranasal administration of MnCl2 can bypass the blood–brain barrier while enhancing the visual cortex (Fa et al., 2010). It is also possible to assess the neuronal tracts of the visual system directly by transcranial Mn2+ delivery (Atanasijevic et al., 2017).
Systemic administrations such as intraperitoneal and intravenous Mn2+ injections have also been used to visualize the retina (Berkowitz et al., 2006; Braun et al., 2007; Bissig and Berkowitz, 2011), primary visual cortex (Bissig and Berkowitz, 2009), and other subcortical visual structures. Mn2+ transport in the brain via this route appears to stem from the blood supply to the pituitary gland, which then enters the cerebrospinal fluid through the choroid plexus, and then into brain regions near the ventricles, such as the striatum, thalamus, cerebellum, and hippocampus (Aoki et al., 2004; Bock et al., 2008, 2009; Alaverdashvili et al., 2017). However, the blood–brain and blood–retinal barriers pose a challenge when it comes to standardizing doses of systemic Mn2+ administration to maximize bioavailability and neuroenhancement while avoiding systemic toxicity. Hyperosmolar agents can be used to temporarily breach the blood–brain barrier to improve Mn2+ entry in the visual cortex and other brain regions after systemic Mn2+ infusion (Aoki et al., 2002; Fa et al., 2011). Alternatively, low MnCl2 concentrations have been successfully administered intravenously in fractionated doses to enhance the primary visual cortex in marmosets (Bock et al., 2009), as well as the periventricular areas in rodents without compromising the blood–brain barrier (Talley Watts et al., 2015; Alaverdashvili et al., 2017). Subcutaneous Mn2+ injection or infusion may also allow slow release of Mn2+ into the bloodstream, thus avoiding immediate hepatic elimination resulting in prolonged Mn2+ accumulation in the brain compared to intravenous administration (Chuang et al., 2009; Shazeeb and Sotak, 2012; Vousden et al., 2018).
Oral administration of MnCl2 has recently been used to reveal differences in brain development between male and female neonates (Qiu et al., 2018), though oral Mn2+ administration for studying adult rodent visual system is currently a less preferred method given the lower bioavailability as compared to intraperitoneal and intrathecal routes (Roels et al., 1997).
Contrast Agent Preparation and MRI Protocols
Appropriate choices of the buffer system, concentration, and pH are indispensable to the success of MEMRI experiments. MnCl2 is available in different grades of purification (mostly > 99% purity) and various anhydrous and hydrated forms. Since mammalian body fluids have around 300 mOsm/L of osmolarity (Bhave and Neilson, 2011; Fregoneze et al., 2014; Hooper et al., 2015; Villiger et al., 2018), the infused MnCl2 solution should be prepared at similar osmotic concentrations, especially for local injections. While the buffer solution of MnCl2 can be deionized water, saline, phosphate-buffered saline, etc., physiological pH of approximately 7.2–7.4 should be maintained as lower pH may cause acidosis of the target tissues while higher pH may cause alkalosis. For example, the pH of a 300 mOsm/l MnCl2 solution prepared from deionized water is 5.5 to 5.8 under standard temperature and pressure conditions (Silva et al., 2004). Bicine and sodium hydroxide can be utilized to adjust pH to around 7.2 to 7.4 (Silva et al., 2004; Bock et al., 2008). Alternatively, for non-invasive Mn2+ delivery, such as transcranial administration, high osmolarity of MnCl2 solution at about 250–500 mM is required to pass through the intact rat skull unless CaCl2 is added to MnCl2 such that the total salt concentration equals 500 mM (Atanasijevic et al., 2017). It should be noted that retinal degeneration has been reported after intravitreal injection of normal saline but not phosphate-buffered saline to C57BL/6J mice (Hombrebueno et al., 2014). Caution is warranted when determining the dosage and chemical property of the buffer solution for localized MnCl2 injection.
On the other hand, the intensity of T1-weighted imaging is dependent on the gradient, the radiofrequency field homogeneity, and the coil sensitivity of the MRI system, which often differ slightly between experimental sessions. To account for such inhomogeneity, a small phantom filled with saline, water, or MnCl2 solution can be placed near the animal’s head to normalize the neural tissue signals to the phantom signals in the same imaging slices during acquisition (Chan et al., 2008c, 2017; Yang et al., 2018). Alternatively, the contralateral homotopic tissues or the nearby muscles may be used as the internal control for the eye or the brain after local but not systemic Mn2+ administration (Thuen et al., 2005), assuming negligible T1-weighted signal enhancement in these regions soon after local injection. Signal intensities may also be normalized to the background noise from each animal (Aoki et al., 2004; Thuen et al., 2005). One may also use T1-weighted imaging sequences that are less sensitive to radiofrequency inhomogeneity (Lee et al., 1995; Thomas et al., 2005). For more accurate quantitation, R1 mapping should be performed to compute the absolute R1 parametric values of the target tissues which are much less affected by signal non-uniformity than the relative signal comparisons in T1-weighted imaging. There are a few fast sequences available for R1 mapping (Chuang and Koretsky, 2006; Tambalo et al., 2009), whereas R1 is noted to linearly correlate with tissue Mn2+ concentration in Mn2+-injected animals (Chuang et al., 2009).
Neuroarchitecture Evaluation
Manganese-enhanced MRI of neuroarchitecture evaluation involves utilizing Mn2+ administration to detect the cytoarchitecture of brain tissues. The underlying principle of this technique is based on the varying degrees of Mn2+ accumulation resulting from differences in tissue properties at basal levels such as Mn2+ uptake through activity-dependent Cav1.2 channels in active neurons (Bedenk et al., 2018). A variety of neural circuits can be enhanced through systemic or local delivery of Mn2+. The high sensitivity and resolution provided by Mn2+ distribution allows for in vivo brain mapping, as well as outlining of retinal and cortical layers which, in turn, can be used to differentiate between disease conditions to discern neuropathological mechanisms. The specificity and accuracy of Mn2+ enhancements have been determined via histological confirmation. A list of relevant MEMRI studies can be found in Table 1. In this section, we will go through few important studies that have implemented the use of Mn2+ to resolve the neuroarchitecture of the visual system in high-resolution MRI.
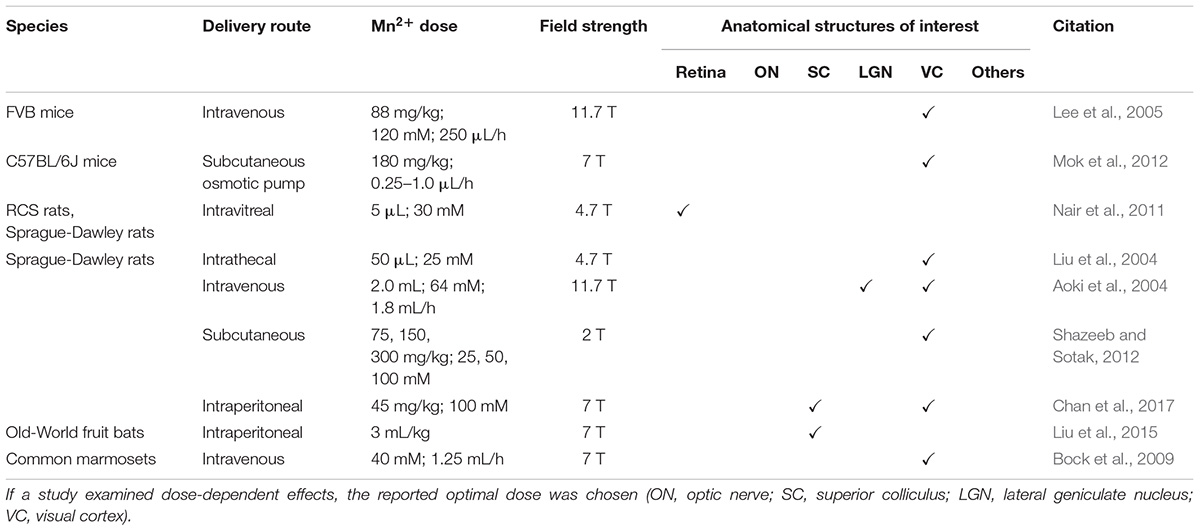
Table 1. Summary of MEMRI protocols used for the detection of neuroarchitecture in the visual system in terms of species, delivery route, Mn2+ dose, magnetic field strength and anatomical structures enhanced and studied.
Manganese-enhanced MRI enables in vivo visualization of anatomical details in the whole brain from topographical and functional domains to layer-specific or even cellular levels (Aoki et al., 2004; Lee et al., 2005; Bock et al., 2009; Chuang et al., 2010; Chan et al., 2014a). With regards to the visual system, MEMRI has been used to reveal retinal and cortical structures layer-specifically in healthy and diseased animal models. For instance, after intravitreal MnCl2 injection into normal rats, MEMRI at 25 micron resolution displayed seven bands of alternating high and low intensities (Figure 3A) which correspond to the ganglion cell layer, inner plexiform layer, inner nuclear layer, outer plexiform layer, outer nuclear layer, photoreceptor segment layer, and choroidal vascular layer (Nair et al., 2011). In contrast, the Long-Evans Royal College of Surgeons (RCS) rats with inherited photoreceptor degeneration only showed four bands of alternating intensities alongside with one debris band (Nair et al., 2011) (Figure 3A) indicating loss of the cellular architecture in the retina. Histological analysis confirmed the findings revealing four intact retinal layers and a debris layer in place of the outer plexiform layer, outer nuclear layer, and photoreceptor segment layer.
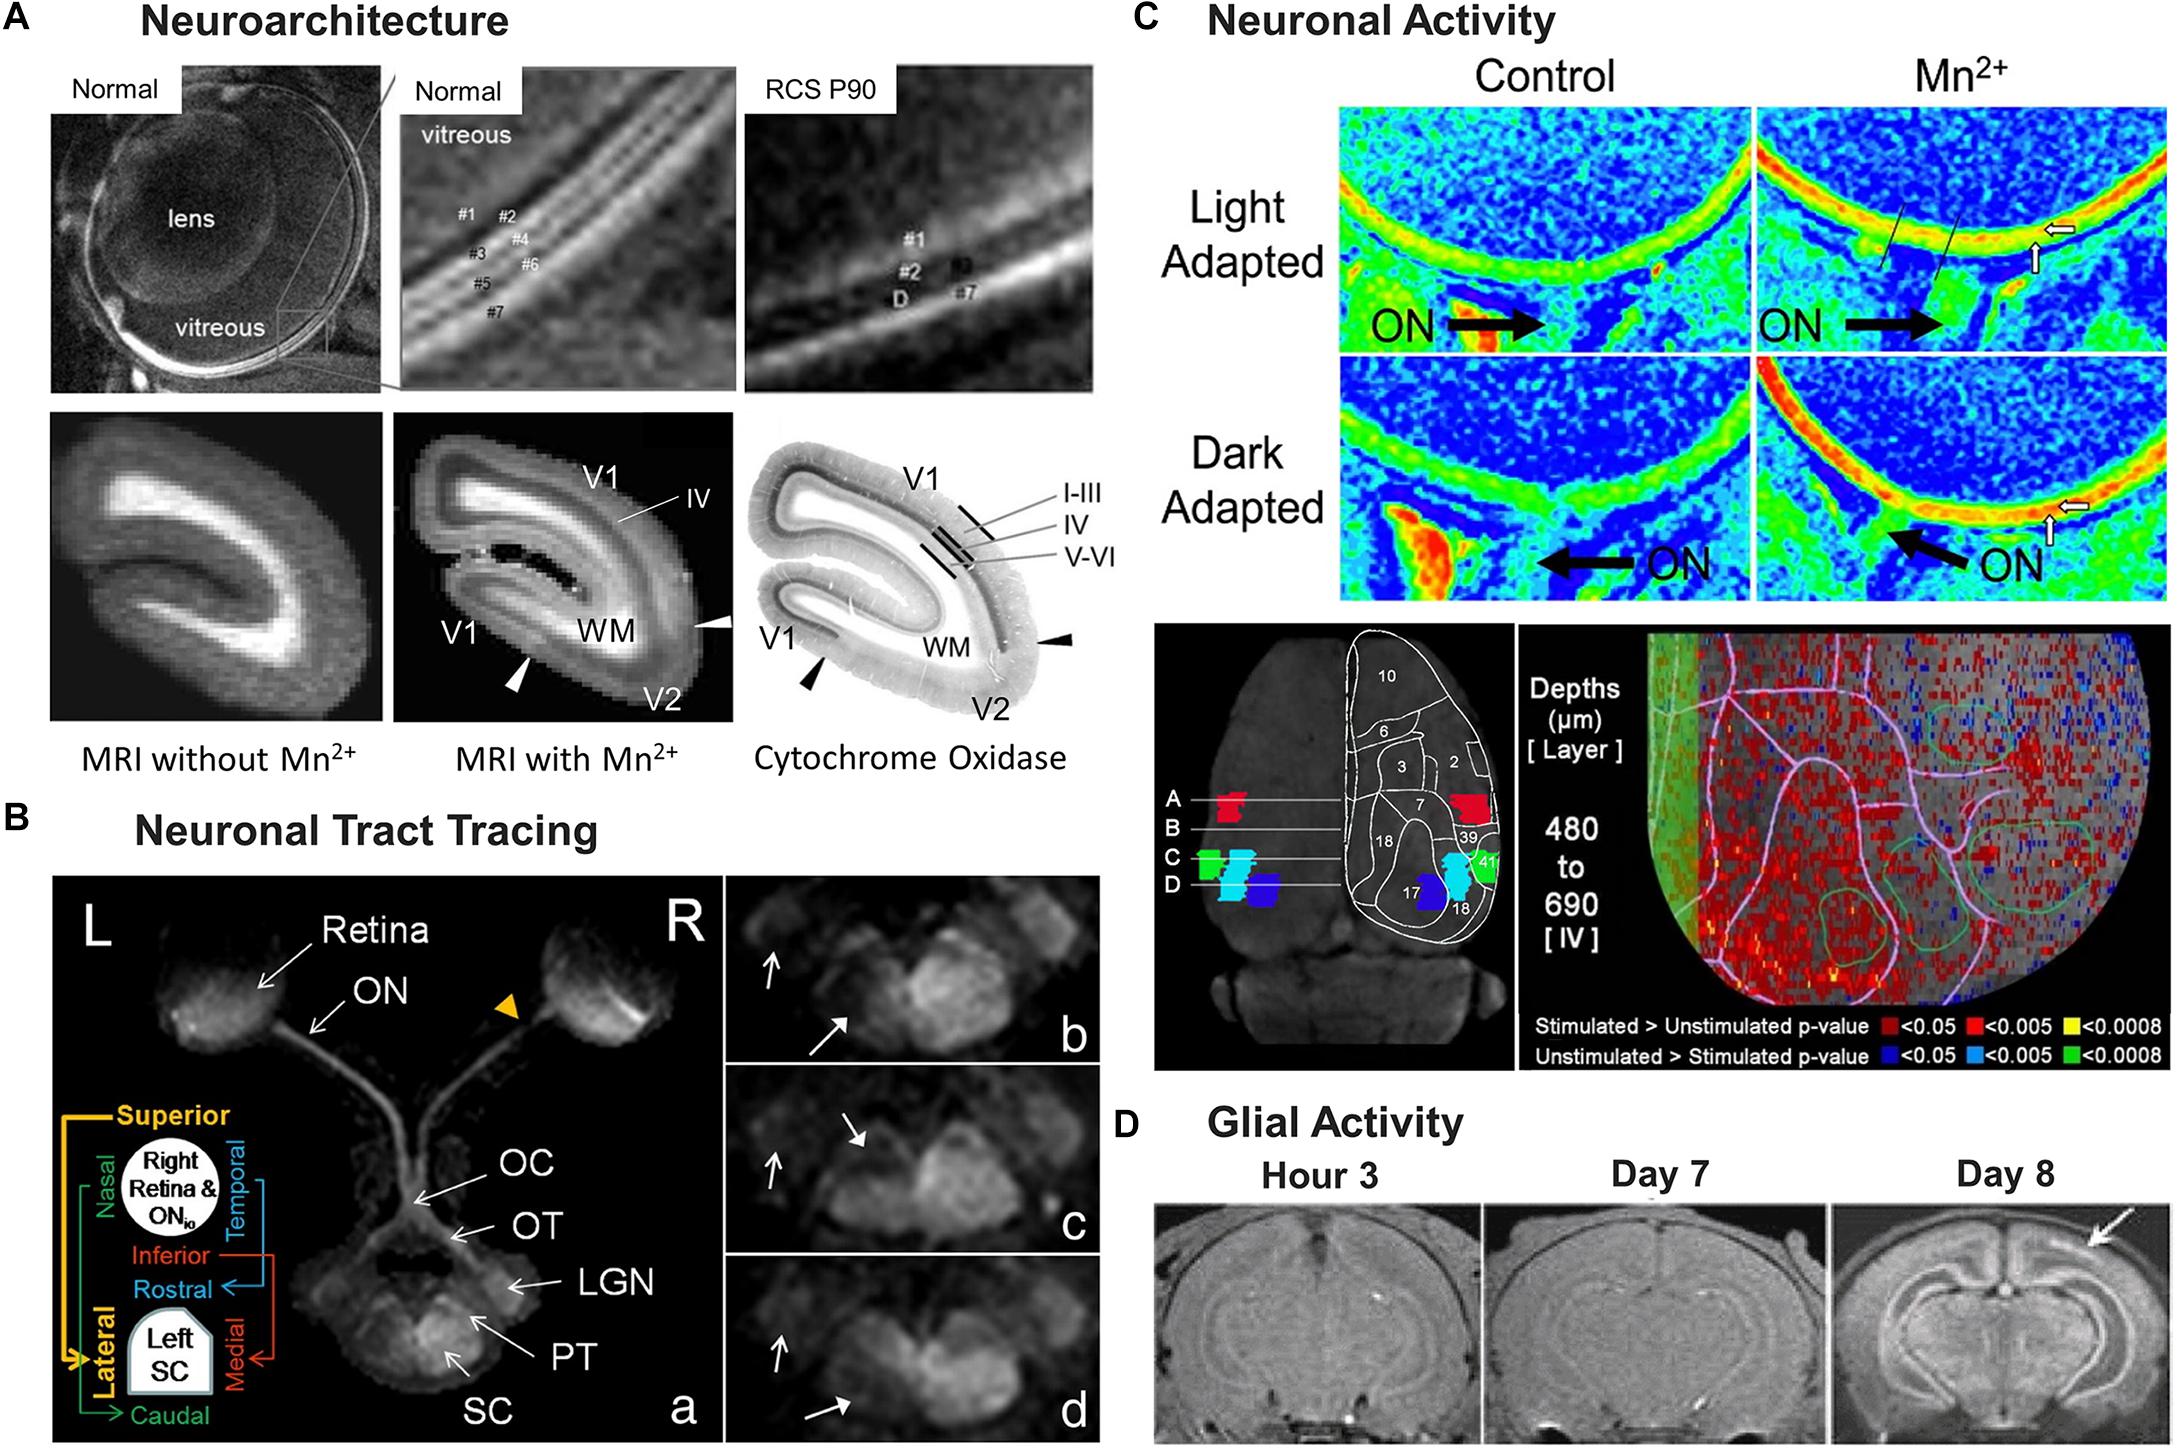
Figure 3. Illustrations of four key MEMRI applications for studying the visual system, from neuroarchitecture detection (A), to neuronal tract tracing (B), neuronal activity detection (C) and glial activity identification (D). (A) represents detection of neuroarchitecture in the rodent retina and the primate visual cortex. Top row of (A) shows MEMRI detection of distinct bands of the normal (left and middle) and degenerated rodent retinas (right) with alternating dark and light intensity signals, as denoted by the numbering of layers. Note the compromised photoreceptor layer “D” upon degeneration in the Royal College of Surgeons (RCS) rats at postnatal day (P) 90. Bottom row of (A) represents in vivo T1-weighted MRI of the marmoset occipital cortex before (left) and after (middle) systemic Mn2+ administration. The corresponding histological section stained for cytochrome oxidase activity is shown on the right. The arrows indicate the primary/secondary visual cortex (V1/V2) border; I–III, IV, and V–VI indicate the cortical layers; and WM represents white matter. V1 detected in the T1-enhanced MEMRI scans agrees with the V1 identified in the histological section. The cortical layer IV experiences the strongest layer-specific enhancement, defining the extent of V1. (B) represents the use of MEMRI tract tracing for retinotopic mapping of normal and injured central visual pathways in Sprague-Dawley rats. MEMRI was performed 1 week after partial transection to the right superior intraorbital optic nerve (ONio) in a,b as shown by the yellow arrowhead in a, and to the temporal and nasal regions of the right optic nerve in c,d, respectively. After intravitreal Mn2+ injection into both eyes, the intact central visual pathway projected from the left eye could be traced from the left retina to the left optic nerve (ON), optic chiasm (OC), right optic tract (OT), right lateral geniculate nucleus (LGN), right pretectum (PT), and right superior colliculus (SC) in a. In contrast, reduced anterograde Mn2+ transport was found beyond the site of partial transection in the central visual pathway projected from the right eye in a retinotopic manner following the schematics in the insert in a. b–d in the right column highlight the reduced Mn2+ enhancement in the lateral, rostral and caudal regions of the left SC, denoted by the solid arrows. Open arrows indicate the hypointensity in the left LGN. (C) shows the use of MEMRI for detection of neuronal activity in the retina (top 2 rows) and the visual cortex (bottom row) of rodents. The heat maps on the top 2 rows of (C) visualize retinal adaptation by MEMRI in either light or dark condition. The horizontal white arrows mark the enhanced inner retina 4 h after systemic Mn2+ administration (right column) as compared to the control condition without Mn2+ administration (left column), while the vertical white arrows point to the outer retina that has higher intensity in dark-adapted than light-adapted conditions. The optic nerve (ON) is identified by a black arrow in each image. The bottom row of (C) represents neuronal activity of the visual cortex after systemic Mn2+ administration and awake visual stimulation. The left image shows the anatomy of cortical regions of interest (ROIs) in terms of Brodmann areas: blue for the binocular division of the primary visual cortex (Area 17), cyan for the lateral division of the accessory visual cortex (Area 18), red for the primary somatosensory cortex (Area 2), and green for the primary auditory cortex (Area 41). A superimposed drawing shows the relevant surface topography. On the right is a voxel-wise analysis of activity-dependent Mn2+ enhancement in one hemisphere centered in layer IV of the primary visual cortex at a depth from 480 to 690 μm. The top of the image is the rostral side of the cortex while the left side depicts the position of the longitudinal fissure. Values of the P-threshold are indicated on the bottom. The primary visual cortex, represented by the leftmost green open circle, had the highest density of below-threshold voxels. The green shaded band to the left, centered at the longitudinal fissure, is a buffer of the unanalyzed space. (D) shows a series of T1-weighted images of neonatal rats at 3 h, and 7 and 8 days after mild hypoxic-ischemia (H-I) insult at postnatal day (P) 7. The injury was induced by unilateral carotid artery occlusion and exposure to hypoxia at 35°C for 1 h. After MRI scans at day 7, systemic Mn2+ administration was performed, and the image at day 8 represents MEMRI enhancement. The white arrow points to gray matter injuries in the ipsilesional hemisphere around the visual cortex. This type of gray matter lesion is not visible in the images from hour 3 and day 7 post-insult. Immunohistology of the same rats suggested co-localization of overexpressed glial activity in the same lesion area in MEMRI (not shown). (A–D) are reproduced with permissions from Berkowitz et al. (2006), Yang and Wu (2007), Bissig and Berkowitz (2009); Bock et al. (2009), Chan et al. (2011), and Nair et al. (2011).
The architecture of the visual cortex can also be visualized using MEMRI. For instance, fractionated intravenous MnCl2 injections to marmosets led to significantly greater enhancement in the V1 and V2 gray matter regions of the visual cortex compared to the proximal white matter in MEMRI, with V1 being slightly more enhanced than V2 (Bock et al., 2009) (Figure 3A). The cortical layer IV in V1 experienced the strongest layer-specific enhancement. These differences in signal intensities allowed investigators to identify the borders between corresponding brain structures in the images. Cytochrome oxidase staining of brain samples corroborated with MEMRI observations, supporting the use of high-resolution MEMRI in resolving cytoarchitecture (Bock et al., 2009).
Neuronal Tract Tracing
Early methods of neuronal tract tracing involve the use of biotinylated dextran (Rajakumar et al., 1993), horseradish peroxidase (Kristensson and Olsson, 1971), fluorogold (Tillet et al., 1993), herpes simplex virus (Sun et al., 1996), and carbocyanine fast DiI (Friedland et al., 1996). However, these methods are mostly mono-synaptic and require sacrificing the animals to obtain brain slices for visualizing the tracts. In addition, the process of serial brain sectioning for reconstructing three-dimensional information is laborious, requires highly skilled expertise and is prone to errors. For this reason, it needs a more efficient tract tracing method that is viable for living animals, and MEMRI serves this purpose. Since Mn2+ can be readily taken up and transported by neurons, it can be used as an in vivo anterograde tracer for MRI to determine the movement and distribution of this moiety which, in consequence, allows tracing of the neuronal tracts. In order to examine the veracity of this premise, one of the earliest MEMRI experiments involved administration of MnCl2 solution into the vitreous to unveil the anatomical structures along the central visual pathway (Pautler et al., 1998). The rate of anterograde transport of Mn2+ was found to be about 2–8 mm/h in rodents (Sandvig et al., 2011), and is dependent upon body temperature (Smith et al., 2007), age (Minoshima and Cross, 2008; Chan et al., 2012a), and health status (Gallagher et al., 2012; Lin et al., 2014b; Majid et al., 2014; Bertrand et al., 2018). In addition, trans-synaptic transport of Mn2+ to the distal neurons in the visual cortex can be detected upon sufficient functional activity (Bearer et al., 2007; Lindsey et al., 2007; Chan et al., 2014a). These results demonstrate that it is plausible to use Mn2+ to trace separate tracts simultaneously in the same animals and to examine the physiological transport properties in chronic studies. Further investigations are needed to (a) determine the sensitivity and specificity of MEMRI for neuronal tract tracing; (b) determine the doses at which Mn2+ becomes toxic; (c) clarify the mechanism of how Mn2+ enters the cells, and (d) decipher the mechanism through which Mn2+ is transported across the cellular milieu. In this section, we will examine important studies that utilize MEMRI to trace neuronal tracts in the visual system. A summary of the relevant MEMRI protocols used is provided in Table 2.
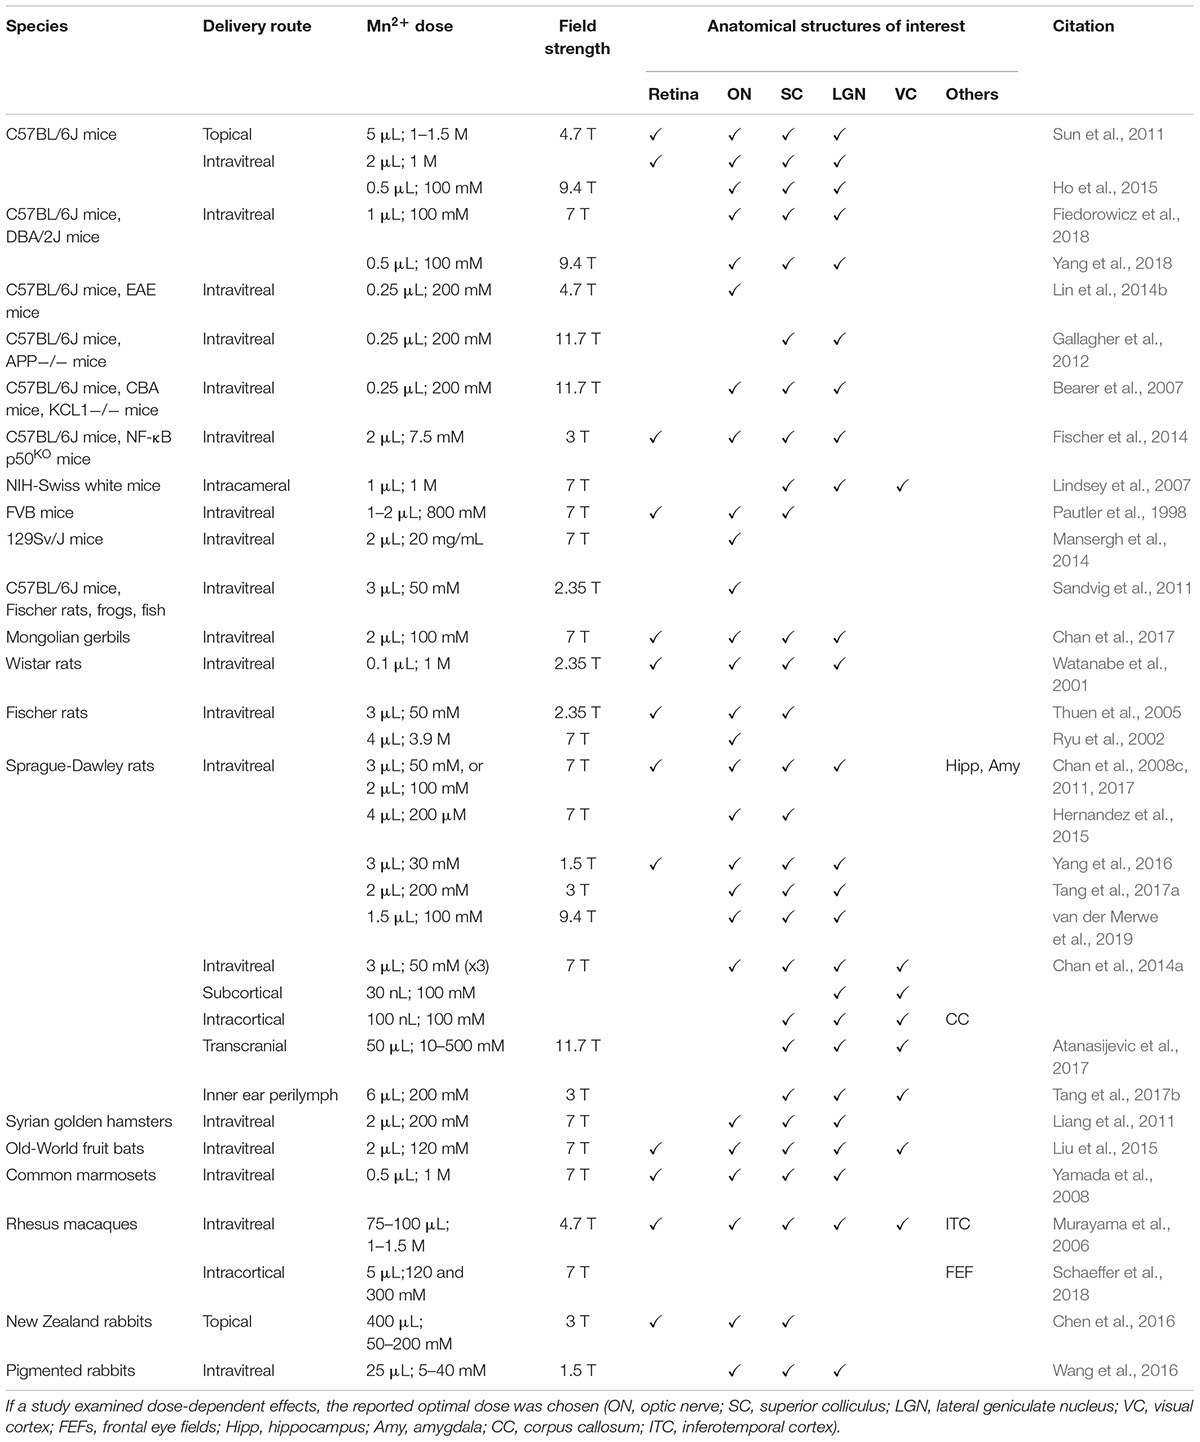
Table 2. Summary of MEMRI protocols used for neuronal tract tracing in the visual system in terms of species, delivery route, Mn2+ dose, magnetic field strength and anatomical structures enhanced and studied.
Watanabe et al. (2001) are among the earliest to perform extensive MEMRI studies to determine the spatiotemporal evolution of MEMRI for tracing the visual system in healthy rodents. At 8, 24, 48, and 72 h after intraocular MnCl2 administration to adult Wistar rats, the best MEMRI enhancement of the central visual pathway was achieved at 24 h post-injection, which revealed clear delineation of the retina, the axonal tracts, and the primary visual centers. At 8 h there was insufficient transport beyond the optic chiasm, while the contrast faded at 48 h. At 24 h, a continuous pattern of anterograde labeling was observed from the retina, optic nerve, and optic chiasm to the contralateral optic tract, the dorsal and ventral lateral geniculate nucleus, the superficial gray layer of the superior colliculus and its brachium, the olivary pretectal nucleus, and the suprachiasmatic nucleus. Enhancement was achieved on the ipsilateral hemisphere to a lesser degree after passing the optic chiasm, which agreed with the known anatomical projection in rodents (Forrester and Peters, 1967) (Figure 1). A shortcoming of MEMRI-based neuroanatomic tracing is its relatively low sensitivity to sparse fibers. Several tracts known to consist of only a few fiber connections could be visualized by other methods but were not distinguishable in this study. Some examples include the nuclei of the accessory optic system, lateral geniculate nucleus, and olivary pretectal nuclei in the same hemisphere of the rodent brain ipsilateral to the unilaterally injected eye.
While most MEMRI studies involving intraocular MnCl2 injection detected the retinal pathways toward the lateral geniculate nucleus or superior colliculus (Pautler et al., 1998; Watanabe et al., 2004; Thuen et al., 2005; Chan et al., 2011, 2017; Fischer et al., 2014; Xiao et al., 2019) (Figure 2D), detection of the visual cortex upon intraocular MnCl2 injection was less frequently reported (Murayama et al., 2006; Bearer et al., 2007; Lindsey et al., 2007; Chan et al., 2014a). The fact that Mn2+ is not easily visualized in the visual cortex appears to reflect differences in transport dynamics between the proximal and distal visual pathways. Along the rodent visual pathway, Mn2+ ions are taken up by the retinal ganglion cells, which experience anterograde axonal transport along the optic nerve and optic tracts, and subsequently accumulate at the axon terminals and the synapses at the contralateral superior colliculus and lateral geniculate nucleus (Pautler et al., 1998; Watanabe et al., 2004). At this point, the Mn2+ ions need to cross the synapse and be collected by the post-synaptic terminals of the next neurons in the distal pathway for further transport and signal enhancement. While in vivo, trans-synaptic tract-tracing has been reported across different nervous systems and species (Saleem et al., 2002; Pautler, 2004; Chan et al., 2014a; Almeida-Correa et al., 2018), the amount of transfer appears substantially smaller than the proximal Mn2+ input and is dependent upon the synaptic integrity, axonal caliber, and functional activity of the neurons (Murayama et al., 2006; Bearer et al., 2007). This may explain at least in part why trans-synaptic enhancement of the visual cortex by intraocular Mn2+ injection has been challenging and less sensitive to be detected (Lindsey et al., 2007). Since the degree of Mn2+ enhancement along the visual pathway depends on the duration of the available Mn2+ input in the eye more than the dosage used (Olsen et al., 2010), sustained ocular Mn2+ release and MEMRI at an extended time point might help improve the sensitivity of detecting visual cortex Mn2+ enhancement (Morch et al., 2012; Chan et al., 2014a).
Apart from the central visual pathway, MEMRI has been increasingly utilized as a robust tool for layer-specific and topographical brain mapping of the transcallosal, cortico-geniculate, cortico-collicular, poly-synaptic, and intracortical horizontal connections in the rodent visual system (Chan et al., 2012a, 2014a) (Figure 2H). In particular, the ability of MEMRI to appraise cortico-cortical and cortico-subcortical pathways opens up new avenues to explore the neurophysiological properties of top–down, feedback neural pathways to and from the visual cortex that have been largely understudied (Gilbert and Li, 2013). In addition to the rodent visual system, MEMRI is readily translatable to study the visual system of other species including primates. For example, intravitreal Mn2+ injection allows detection of not only the central visual pathways in marmosets (Yamada et al., 2008) (Figure 1C) and rhesus macaques (Murayama et al., 2006), but also higher levels of the ventral visual stream such as the inferotemporal cortex in rhesus macaques (Murayama et al., 2006). In the prefrontal cortex, a recent MEMRI study focused on the saccadic eye movement system of rhesus macaques, whose neural circuit was also documented histologically, thereby making it a useful reference point to verify MEMRI as a precise in vivo technique in analyzing long-range neuronal connectivity (Schaeffer et al., 2018). After intracortical Mn2+ injection into the frontal eye fields, comparisons between diffusion tensor imaging, MEMRI, and histochemical results revealed that the tract tracing via MEMRI was in agreement with histochemical tracing whereas diffusion tensor imaging underestimates connectivity (Schaeffer et al., 2018). The reason for this may be attributed to the limitation of diffusion tensor imaging to resolve crossing fibers. These results further support the use of MEMRI in investigating neuronal tracts and reveal a distinct benefit of this technique over diffusion tensor imaging.
Manganese-enhanced MRI also provides a solution to non-invasively image transport deficits in the visual system for examining neuronal abnormalities caused by optic neuropathies such as irradiation-induced injuries (Ryu et al., 2002), optic nerve crush (Thuen et al., 2005; Fischer et al., 2014), glaucoma (Chan et al., 2007, 2008c; Fiedorowicz et al., 2018; Yang et al., 2018), optic neuritis (Lin et al., 2014b), retinal ischemia/reperfusion (van der Merwe et al., 2019), and neonatal hypoxia-ischemia (Chan et al., 2014b). Studies by Thuen et al. (2005, 2009) are among the earliest to demonstrate the feasibility of MEMRI for longitudinal monitoring of Mn2+ transport along injured axons of the central visual pathway via intraocular Mn2+ administration. Accumulation of Mn2+ in the vitreous and enhancement plummeting at the site of injury in the optic nerve are commonly noted after neuronal damages due to blockade of Mn2+ transport (Thuen et al., 2005; Sandvig et al., 2012), whereas the extent of reduced Mn2+ enhancement at the distal site often reflects the severity of damages (Fischer et al., 2014; Lin et al., 2014b). Subsequent studies demonstrated the use of in vivo MEMRI tract tracing for retinotopic mapping at submillimeter resolution (Chan et al., 2011) (Figure 3B), and for monitoring primary versus secondary degeneration after partial transection of the optic nerve (Chan et al., 2017). With these premises, MEMRI can serve as an in vivo imaging model system to evaluate neuroprotective approaches to the injured visual system (Mansergh et al., 2014; Van der Merwe et al., 2016, van der Merwe et al., 2019), as well as to trace neuroplasticity (Immonen et al., 2008; Chan et al., 2012a; Tang et al., 2017b) and regenerated axons along the visual pathway (Liang et al., 2011; Sandvig et al., 2011, 2012; Sandvig and Sandvig, 2014; Komatsu et al., 2017). MEMRI can be combined with diffusion tensor imaging to give complementary information about injury and regeneration in the adult optic nerve (Thuen et al., 2009). In terms of correspondence between image modalities, our previous MEMRI and diffusion tensor imaging experiments indicated that anterograde Mn2+ transport is relatively more sensitive to axial diffusivity changes than radial diffusivity changes in the injured visual pathway (Ho et al., 2015).
Evaluation of Neuronal Activity
Manganese-enhanced MRI of neuronal activity detection involves analyzing brain structures under a certain stimulus. Regions of the brain that are active in response to a stimulus experience a rise in ion demand, which results in increased Mn2+ accumulation after exogenous administration. Higher concentrations of Mn2+ ions in local brain regions result in higher T1-weighted signal intensities on MRI, indicating that signal enhancement of these structures can be a biomarker of their activity (Lin and Koretsky, 1997; Duong et al., 2000; Yu et al., 2005). In this section, we will overview findings which involved the use of MEMRI to examine neuronal activity in the visual system. A compilation of relevant studies can be found in Table 3.
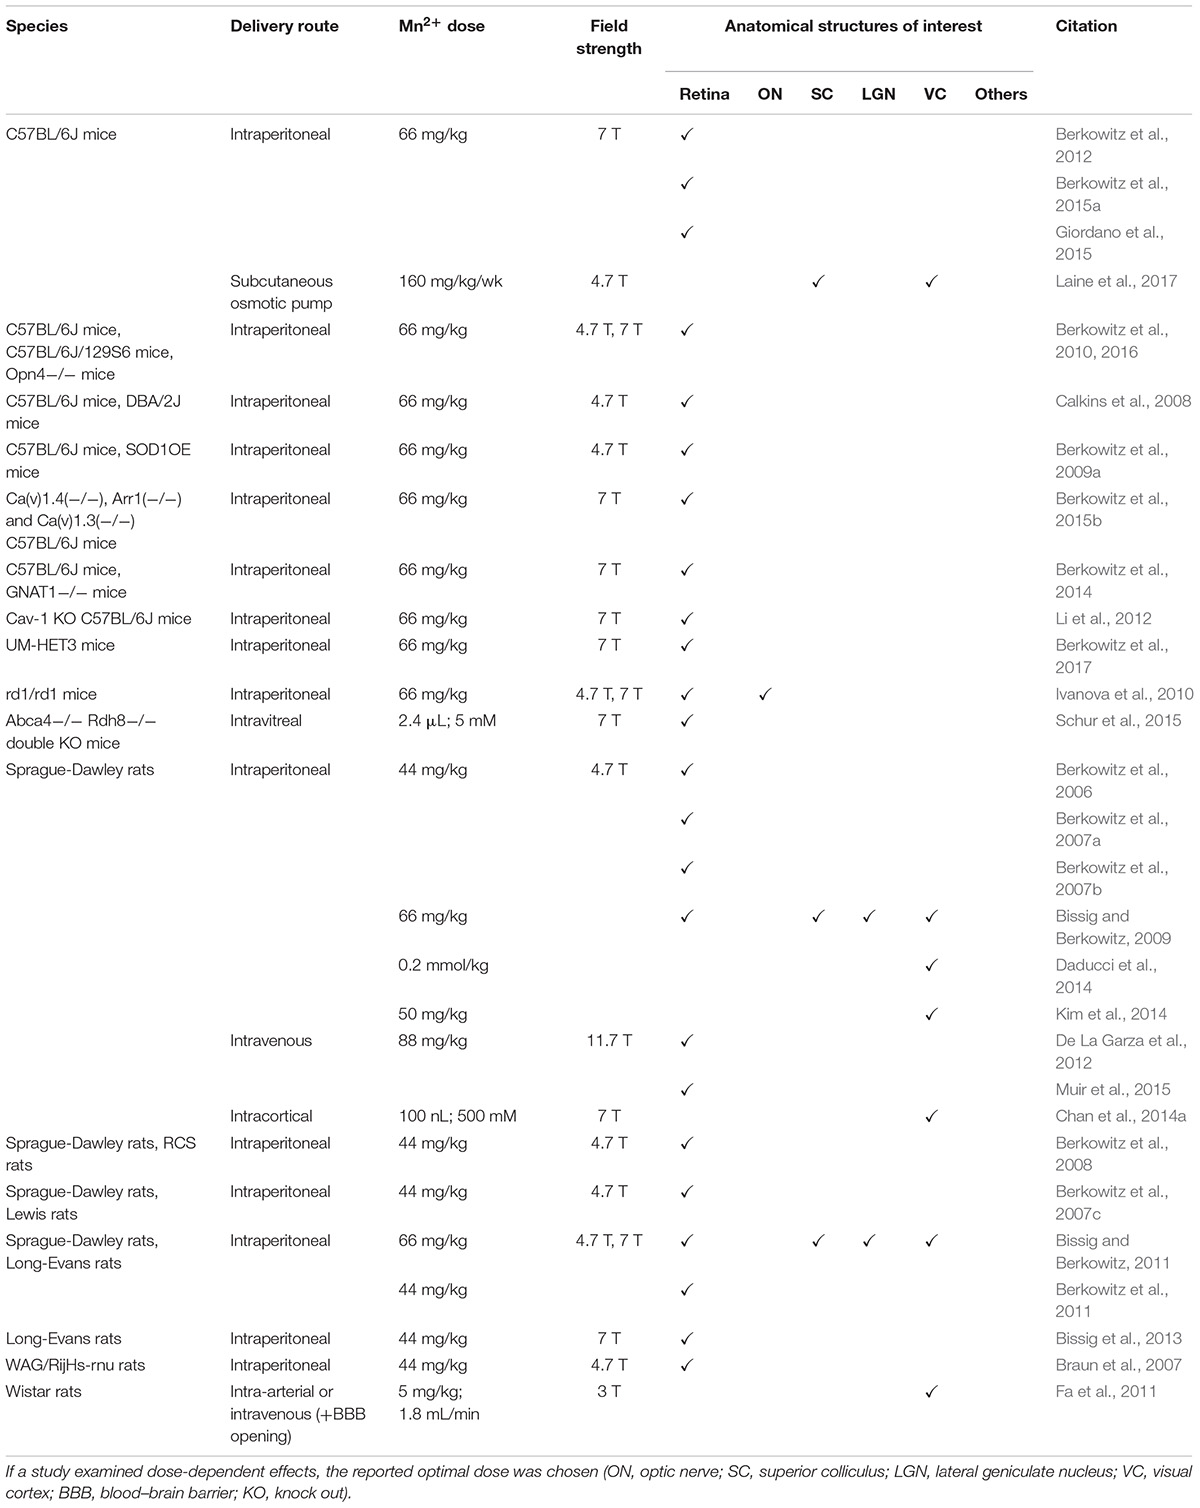
Table 3. Summary of MEMRI protocols used for detecting neuronal activity in the visual system in terms of species, delivery route, Mn2+ dose, magnetic field strength and anatomical structures enhanced and studied.
Manganese-enhanced MRI can detect layer-specific changes in retinal ion demand in response to light or dark adaptation. Upon systemic MnCl2 administration, healthy adult rats that were maintained in dark conditions showed higher signal intensity in the outer retinal layers, indicative of increased ion demand of photoreceptors when compared to rats maintained in light conditions (Berkowitz et al., 2006; De La Garza et al., 2012) (Figure 3C). Additionally, the inner retinal layers of light-stimulated rats had greater enhancements compared to the inner layers of dark-adapted rats, suggesting differential activity-dependent mechanisms of Mn2+ contrast across retinal layers (De La Garza et al., 2012). Such intraretinal MEMRI contrasts appear to be sensitive to melanopsin regulation (Berkowitz et al., 2010, 2016), horizontal cell inhibitory signaling (Berkowitz et al., 2015b), visual cycle activity (Berkowitz et al., 2009b), and channelrhodopsin-2-mediated activity in vivo (Ivanova et al., 2010). In addition, adult rats pretreated with diltiazem, a calcium channel antagonist, suppressed intraretinal Mn2+ uptake and MEMRI enhancement (Berkowitz et al., 2007b), indicative of the role of calcium channels in the Mn2+ uptake in the retina.
Manganese-enhanced MRI has been used to detect Ca2+-dependent abnormalities in aging, glaucomatous, and diabetic retinas (Calkins et al., 2008; Bissig et al., 2013; Berkowitz et al., 2014; Muir et al., 2015) (Figure 2K) as well as retinal ischemia/reperfusion (Berkowitz et al., 2008) and experimental retinopathy of prematurity (Berkowitz et al., 2007b, 2011). Calkins et al. (2008) demonstrated the use of MEMRI in identifying age-related ocular changes in hereditary glaucoma in a mouse model. Upon intraperitoneal MnCl2 injection, C57BL/6J mice at 10–11 months old demonstrated larger Mn2+ retinal uptake in the inner and outer retina by 18 and 24% respectively than young mice at 2–3 months old, whereas the aged and severely diseased DBA/2J glaucoma mice demonstrated a 6% decrease in inner retinal Mn2+ uptake and 5% increase in outer retinal Mn2+ uptake when compared to the younger and milder counterparts. Taken together, these findings indicate that MEMRI can be used to evaluate age-related activity changes and tracing the disease progression in glaucoma across retinal layers over an extensive period of time. On the other hand, a common animal model for diabetes involves the use of streptozotocin which is an alkylating antineoplastic agent toxic to insulin-producing beta cells of the pancreas. Several MEMRI experiments have utilized this model to characterize changes in neuronal integrity during the progression of this disease (Berkowitz et al., 2012, 2015a; Giordano et al., 2015; Muir et al., 2015; Kancherla et al., 2016). In brief, Mn2+-dependent activity in the outer retina decreased in dark conditions as the duration of hyperglycemia increased, suggesting altered ion homeostasis which is important in maintaining depolarizing dark current in photoreceptors when unstimulated. These changes were detected as early as 14 days after streptozotocin injection (Muir et al., 2015). However, MEMRI was not able to detect changes in the inner retina that were picked up by electroretinogram, which could mean that the two methods measure different aspects of neuronal activity or that MEMRI is not as sensitive with regards to detecting electrical changes in the diabetic inner retina. Using intraretinal MEMRI, loss of caveolin-1, an integral component of caveolar membrane domains involved in glaucoma, diabetic retinopathy, and autoimmune uveitis, was found to impair retinal function via disturbance of subretinal ion/fluid homeostasis (Li et al., 2012). MEMRI has an advantage of considerable spatial resolution when compared to electroretinography and hence the combination of MEMRI and electroretinogram may provide important insights into the spatiotemporal activity changes in future studies (Schur et al., 2015). One of the key etiological factors of dysfunctional rod photoreceptors in diabetic retinopathy involves oxidative stress (Berkowitz et al., 2015a). Hence, intraretinal MEMRI has been used to evaluate the effectiveness of anti-oxidative administration in reducing such damage (Giordano et al., 2015). Intraretinal MEMRI can also be used to examine other treatment regimens such as alpha-lipoic acid (Berkowitz et al., 2007c), 11-cis-retinal treatment (Berkowitz et al., 2009b, 2012), prophylactic retinylamine treatment (Schur et al., 2015), repetitive hypoxic-preconditioning (Berkowitz et al., 2008), and superoxide dismutase overexpression (Berkowitz et al., 2009a).
Manganese-enhanced MRI can also assess alterations in intraretinal ion demand due to ocular injury and tumorigenesis. Upon Na+/K+-ATPase inhibition by intravitreal ouabain injection, rats showed reduced retinal function as indicated by decreased receptor and post-receptor MEMRI signal intensities compared to phosphate-buffered saline-injected controls (Berkowitz et al., 2007a). In contrast, retinal pigment epithelium damage by intraperitoneal sodium iodate administration in rats resulted in increased levels of intraretinal Mn2+ uptake (Berkowitz et al., 2007a). Additionally, MEMRI has been shown to detect ocular tumor progression and its effects on non-tumor-bearing retinal cells. In a study supporting this notion, rat eyes were imaged at 14 days after implantation of C918 tumor cells into the suprachoroidal space. A cohort of these animals received intraperitoneal MnCl2 administration and showed a 30% increase in tumor signal intensity, a 17% increase in outer retinal signal intensity, but no change in inner retinal intensity in tumor bearing eyes when compared to rats injected with saline (Braun et al., 2007). This indicates the potential of MEMRI in imaging early oncogenic aspects of the visual system.
Cortical activity mediated through visual stimuli in awake and free-moving rats can also be imaged by MEMRI after systemic MnCl2 injection with or without temporarily opening the blood–brain barrier (Bissig and Berkowitz, 2009; Fa et al., 2011). Rats that received visual stimulation demonstrated significantly higher MEMRI signal intensities in layers IV and V of the primary visual cortex relative to the dark-adapted rats (Bissig and Berkowitz, 2009) (Figure 3C). Interestingly, the primary visual cortex also showed significantly more Mn2+ uptake after acoustic stimulation in rats, indicative of MEMRI detection of cross-modal brain activity (Kim et al., 2014). Given that MEMRI has no depth limitation, simultaneous detection of activity in both the eye and brain can be performed which allows for direct comparisons between retinal, subcortical, and cortical activities in the same sessions upon visual stimulation (Bissig and Berkowitz, 2011). Last but not least, MEMRI can help probe altered functionality in the visual cortex in animal models of psychiatric disorders such as chronic psychosocial stress (Laine et al., 2017) and interferon-α-induced depression (Daducci et al., 2014).
Investigation of Glial Activity
Manganese-enhanced MRI has been shown to reflect glial activity changes within and beyond the visual system, yet the underlying mechanisms remain debatable. Some studies observed linkages between Mn2+ enhancement and astrocytic activity mediated by glutamate synthetase, manganese-superoxide dismutase (MnSOD), and calcium channels (Yang and Wu, 2007, 2008; Yang et al., 2008; Gadjanski et al., 2009; Hoffmann et al., 2013), whereas others observed increased Mn2+ uptake in relation to microglial activity (Haapanen et al., 2007; Wideroe et al., 2009, 2011). Oligodendrocytes may also uptake Mn3+ via the transferrin receptors, whereas Mn3+ is paramagnetic and can be converted from Mn2+ (Golub et al., 1996; Gunter et al., 2013). In this section, we will address various findings in the literature that attempted to identify and differentiate glial contributions to Mn2+ enhancement in MEMRI. A list of relevant MEMRI studies involving the visual system can be found in Table 4.
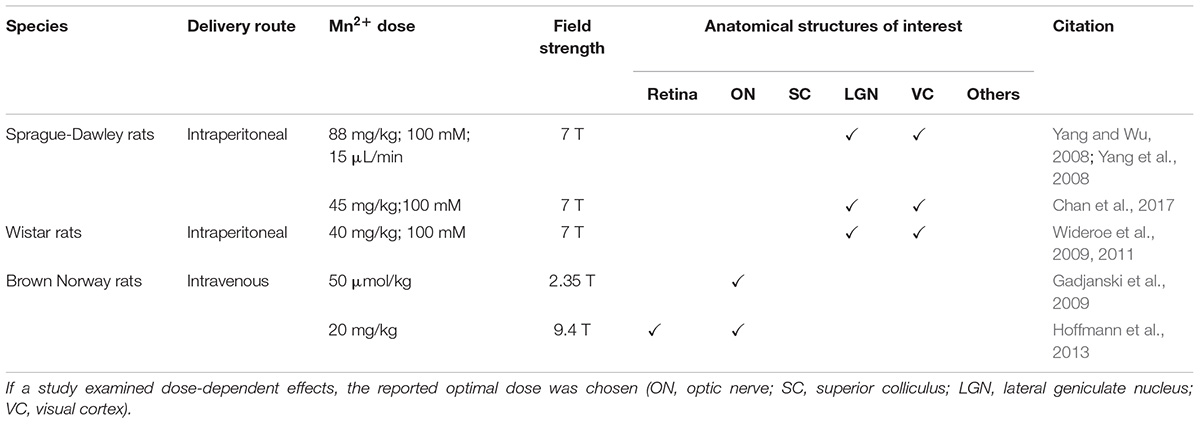
Table 4. Summary of MEMRI protocols used for identifying or differentiating glial activity in the visual system in terms of species, delivery route, Mn2+ dose, magnetic field strength and anatomical structures enhanced and studied.
Several studies supported the use of MEMRI for the detection of astrocytic activity in the healthy brain or in response to neuronal injury. Within the gray matter, astrocytes produce glutamine synthetase, an enzyme which uses Mn2+ as a cofactor. After systemic Mn2+ administration to healthy rats, longitudinal MEMRI showed maximal T1-weighted enhancement at day 1 in brain structures that are known to possess high contents of unsaturated glutamine synthetase (Patel et al., 1985; Aschner et al., 1999) as well as high basal glutaminergic activity (Norenberg, 1979), both of which may cause uptake of the diffused Mn2+ leading to T1-weighted hyperintensity. In contrast, in brain regions with low glutamine synthetase contents such as the striatum, the T1-weighted signal enhancement appeared less pronounced at day 1 and peaked at a later time (Chan et al., 2017). Upon mild unilateral hypoxic-ischemic brain injury, the ipsilesional visual cortex and nearby brain regions were specifically enhanced by exogenous Mn2+ on T1-weighted imaging near the later stages of the disease (Yang and Wu, 2008) (Figure 3D). Interestingly, such enhancement patterns colocalized with areas of delayed neurodegeneration using immunohistochemical markers of glutamine synthetase and MnSOD (Yang and Wu, 2007, 2008). Since glutamine synthetase and MnSOD are manganese-binding enzymes that impart protection against glutamate excitotoxicity and oxidative stress, it is likely that the hyperintense Mn2+ signals in the injured brain tissues may be attributed to increased glutamine synthetase and MnSOD expression (Bidmon et al., 1998; Fujioka et al., 2003; Wang et al., 2006; Chan et al., 2017). MnSOD can be found in significantly higher amounts in the astroglia than in neurons, while glutamine synthetase is astrocyte specific which accumulates in gray matter lesions. Taken together, it is possible that Mn2+ may enhance astrocyte repair-related activity and aid in the detection of gray matter-related injuries (Yang and Wu, 2008; Yang et al., 2008).
It is important to note that the mechanisms of Mn2+ uptake and glutamine synthetase or MnSOD activity have not been thoroughly examined so caution is warranted in interpreting the results. There may be alternative pathways that can cause Mn2+ enhancement in astrocytes. For example, certain glial cells possess L-type voltage-operated calcium channels (Cheli et al., 2016), through which Mn2+ ions have been observed to pass (Bedenk et al., 2018). Knocking out Cav1.2 channels in astrocytes decreases calcium influx by approximately 80% after plasma membrane depolarization and inhibits astrocyte activation, proliferation, and migration (Cheli et al., 2016). In contrast, Cav1.2 channels were upregulated more in activated astrocytes compared to quiescent astrocytes (Cheli et al., 2016). In rats with optic neuritis, intravenous Mn2+ administration led to significantly stronger optic nerve enhancement as compared to their healthy controls (Gadjanski et al., 2009; Hoffmann et al., 2013). Such enhanced Mn2+ uptake from the systemic circulation to the injured optic nerve appeared to be mediated by calcium influx and calpain activation in the degenerating axons and/or during gliosis (Gadjanski et al., 2009; Hoffmann et al., 2013).
In addition to astrocytes, recent studies supported the notion that Mn2+ enhancement is associated with microglial activation (Wideroe et al., 2009, 2011). Wideroe and colleagues combined MEMRI with immunohistochemistry to characterize the detection of cellular changes of more severe hypoxic-ischemic brain injury in neonatal rats. Six hours after cauterization of the right carotid artery, rats were given Mn2+ intraperitoneally for MEMRI scans on days 1, 3, and 7, and brain tissue samples were taken for immunohistochemical staining using CD68 for activated microglial cells and glial fibrillary acidic protein for reactive astrocytes. On days 1 and 3, widespread reactive astrocytes were found across the injured hemisphere, whereas only a few activated microglial cells were observed on day 1 across the ipsilesional hemisphere. By day 7, the number of activated microglial cells increased along with increasing CD68 staining intensities, and many of these cells were concentrated in the dorsolateral thalamus near the lateral geniculate nucleus (Wideroe et al., 2009). MEMRI scans revealed small spots of high signal intensities in the thalamus on day 3, and later in large parts of the dorsolateral thalamus and parts of the hippocampus and remaining cortex on day 7 (Wideroe et al., 2009). At day 7, two animals with low density of activated microglia in the thalamus also had almost no detectable Mn2+ enhancement in T1-weighted imaging. Among the immunohistochemical markers, activated microglia on day 7 had the best spatial agreement with the MEMRI scans. It is possible that microglia activation increased reactive oxygen species and the release of glutamate which upregulated the expression of MnSOD and glutamine synthetase in astrocytes, resulting in delayed Mn2+ enhancements on day 7. However, the enhancements of another animal group which received MnCl2 6 days after injury never reached the intensity of those which received MnCl2 within hours after the injury. Such signal intensity differences indicate that the Mn2+ enhancements in animals receiving MnCl2 early after injury may have been the result of Mn2+ accumulation in microglia over the course of several days as opposed to active uptake (Wideroe et al., 2009). This evidence suggests other potential mechanisms of Mn2+ uptake in glial cells, which further supports the need for caution when interpreting Mn2+ enhancements.
Apart from glial activity detection, there are some initial attempts to distinguish between glial and neuronal activity in inflammatory and degenerative diseases using MEMRI. After exposure to known pro-inflammatory agents via intracranial lipopolysaccharide injection (Bade et al., 2013), glial inflammation appeared to enhance neuronal activity and neuronal Mn2+ uptake. Glial Mn2+ content, however, was independent of the state of glial cells. These results bolster the thought that MEMRI reflects neuronal excitotoxicity and related impairments such as neuroinflammation. Other investigators also probed into the relation between MEMRI signal enhancement and glial reaction in different disease models including cathepsin D deficiency (Haapanen et al., 2007), epilepsy (Immonen et al., 2008), hyperoxia (Morken et al., 2013), and prenatal X-ray exposure (Saito et al., 2012) in both gray and white matters. Some studies revealed that elevated MEMRI signal enhancement tends to co-localize with activated microglia (Haapanen et al., 2007), reactive astrocytes (Kawai et al., 2010) or both (Wideroe et al., 2009, 2011; Morken et al., 2013), while one study demonstrated a negative correlation between Mn2+-enhanced brain tissue R1 changes and density of reactive astrocytes (Saito et al., 2012). Since R1 is a potential marker of Mn2+ uptake (Chuang et al., 2009), this investigation suggested that astrocytic reaction suppresses rather than increases Mn2+ signal enhancement. Also, Immonen et al. (2008) found no correlation between change in MEMRI signal and astrocyte activation status in the epileptic rat hippocampus. These varying findings can be attributed to different disease models and brain targets investigated, but also indicate that certain aspects of Mn2+ based imaging are yet to be deciphered, such as any concurrent changes in overall cell density (Saito et al., 2012) or axonal density (Immonen et al., 2008).
It is important to note that the diseases processes examined in the above studies are complex and are associated with a multitude of molecular, cellular, and pathophysiological changes which tend to obscure the clear findings about glial activation. These processes include cellular edema, necrosis (Wideroe et al., 2009, 2011; Morken et al., 2013), and apoptosis (Haapanen et al., 2007). Once these events ensue, they tend to impact the neuronal activity leading to alterations in neuronal Mn2+ uptake thereby masking the interpretations of MEMRI signal enhancement. In an attempt to differentiate these degenerative events, one study probed the spatiotemporal MEMRI profiles upon Ca2+ dysfunction after traumatic brain injury (Talley Watts et al., 2015). The areas of controlled cortical impact displayed a distinct biphasic profile with MEMRI hyperintensity at hour 1–3 and gradual loss of intensity on days 2–14, while no such biphasic effect was seen in the vehicle group. A hyperintense area was also observed surrounding the impact core on days 7–14. Compared with immunohistochemistry, the MEMRI signal void in the impact core and the hyperintense rim on days 7–14 corresponded to tissue cavitation and reactive gliosis, respectively (Talley Watts et al., 2015). The authors concluded that MEMRI could identify excitotoxic injury during the hyperacute phase that precedes vasogenic edema. Hence, MEMRI can be employed as a complementary technique to conventional MRI to differentiate early stages of gliosis. In another in vivo rat study using combined systemic and stereotactic MEMRI to specifically track the cellular responses of astrocytes and neuronal pathways, a positive temporal correlation was reported between astrogliosis and the recovery of neuronal pathways at the chronic stage after stroke. Microglia, however, did not contribute to systemic MEMRI enhancement because they remained in the lesion core (Hao et al., 2016). While MnCl2 can stimulate the microglia dose-dependently (Zhang et al., 2007), it is also possible that systemic Mn2+ administration at low doses could exert anti-oxidative effects to some extent and preserve brain tissues at remote sites from delayed secondary damage (Singh et al., 1992; Hussain and Ali, 1999; Chan et al., 2008a, 2017). There are currently a number of approaches to mediate neurodegeneration via targeting astrocytes and microglia (Yun et al., 2018; Liddelow and Sofroniew, 2019; van der Merwe et al., 2019). With better understanding of the Mn contrast mechanisms and careful interpretation, the combined Mn administration and MRI detection approaches may be useful for future investigations of post-injury cellular events and functional reorganization.
Limitations
While MEMRI possesses considerable potential for evaluating the structure and function of the retina, optic nerve, and visual brain connections, there are important limitations that need to be addressed. For example, while Mn2+ enhancement is generally interpreted as the surrogate of the tract viability and neuronal activity, this explanation may not always be accurate because mice with genetic retinal blindness were found to give MEMRI enhancements in the optic nerve after intraocular Mn2+ administration (Bearer et al., 2007). Manganese-enhanced MRI likely reflects both activity-independent uptake at base levels as well as activity-dependent uptake upon stimulations or interventions (Wang L. et al., 2015). Another important feature to consider is the depth of anesthesia and body temperature during dynamic MEMRI, both of which may alter neuronal transport (Aoki et al., 2002; Smith et al., 2007). Apart from age-related changes in neuronal Mn2+ transport (Minoshima and Cross, 2008; Chan et al., 2012a), there are age-related changes in the blood–ocular and blood–brain barriers (Berkowitz et al., 1998; Minoshima and Cross, 2008; Chan et al., 2012a; Qiu et al., 2018), which have direct bearing on the bioavailability of Mn2+ in the neural tissues. Thus, the same Mn2+ dose and protocol may give different MEMRI results in animal models of varying ages.
To date, the biochemical metabolome of Mn2+ within the brain is poorly understood; therefore, the interpretations of the results obtained by MEMRI remain rather speculative. One of the proposed mechanisms of Mn2+ transport along the neuronal tracts is through kinesin-mediated vesicular transport. However, in kinesin light chain 1 knockout mice, Mn2+ transport was slowed but not halted, while Mn2+ enhancement after 24 h was similar to normal mice. This suggests that kinesin is not essential to Mn2+ transport and that other mechanisms may be involved (Bearer et al., 2007). Additionally, the directional interpretation of Mn2+ transport along the tracts may not be as accurate as is generally thought. For example, although fast anterograde axon transport of Mn2+ is commonly observed, retrograde transport can occur concurrently albeit at a slower rate (Matsuda et al., 2010). Experimental modeling from dynamic MEMRI also noted the potential involvement of a wide range of apparent Mn2+ transport rates along the optic nerve (Olsen et al., 2010), whereas the contributions of neuronal and glial activity to MEMRI enhancement appear multifaceted. Due to the lack of specificity in our understanding of Mn2+ transport, the interpretations of MEMRI observations can range from passive diffusion to active transport along microtubules through vesicular traffic, membrane integrity, ion integrity, calcium channel activity, enzyme activity, cellular or axonal density, synaptic function, and the combinations thereof.
Currently, the major drawback for MEMRI use is the toxicity of MnCl2, especially at high concentrations, which limits its use in humans. Table 5 provides details about Mn2+ toxicity within and beyond the visual system upon local and systemic Mn2+ manifestations. For example, Mn2+ injection into the mouse eyes disrupts the electrical response to light in the visual system. At high volumes (>0.25 μL) of injectate to mouse eyes there is a volumetric effect. At low volumes (<0.25 μL of 200 mM) a transient effect on visually evoked potentials which reverses after 24 h was observed with Mn2+ but not with saline (Bearer et al., 2007). Even at these low amounts, a permanent loss of 10–20% of the axons in the optic nerve was found (Bearer et al., 2007). Similar effects on retinal morphology and visual responses were also observed upon topical Mn2+ administrations in the mouse eyes (Sun et al., 2012; Lin et al., 2014a) and upon intravitreal Mn2+ administrations in the rabbit eyes (Zhang et al., 2010). Hence Mn2+ exposure may have long-term effects on neurons. Apart from neurotoxicity, Mn2+ may manifest as cardiotoxicity when given systemically at high doses leading to changes in heart rate, cerebral blood flow, parasympathetic tone, and eventually brain functions also. While there is no evidence that intraperitoneal doses of MnCl2 in the range from 44 to 66 mg/kg alter histology, visual performance, blood–barrier integrity, visual behavior or electrophysiology (Berkowitz et al., 2006, 2007a, 2015b; Bissig and Berkowitz, 2011; Bissig et al., 2013), it is important to mention that fractionation does not completely avoid the toxic effects of Mn2+ if the dosages of the fractions are high. Paradoxically, keeping the dosage low necessitates multiple administrations which increase the risk of injection injuries. Severe necrosis have been reported to occur near the injection site on the tails of animals administered with fractions of 90 mg/kg (Bock et al., 2008). Skin ulceration was also noted in mice receiving high MnCl2 doses via subcutaneous osmotic pumps (Vousden et al., 2018).
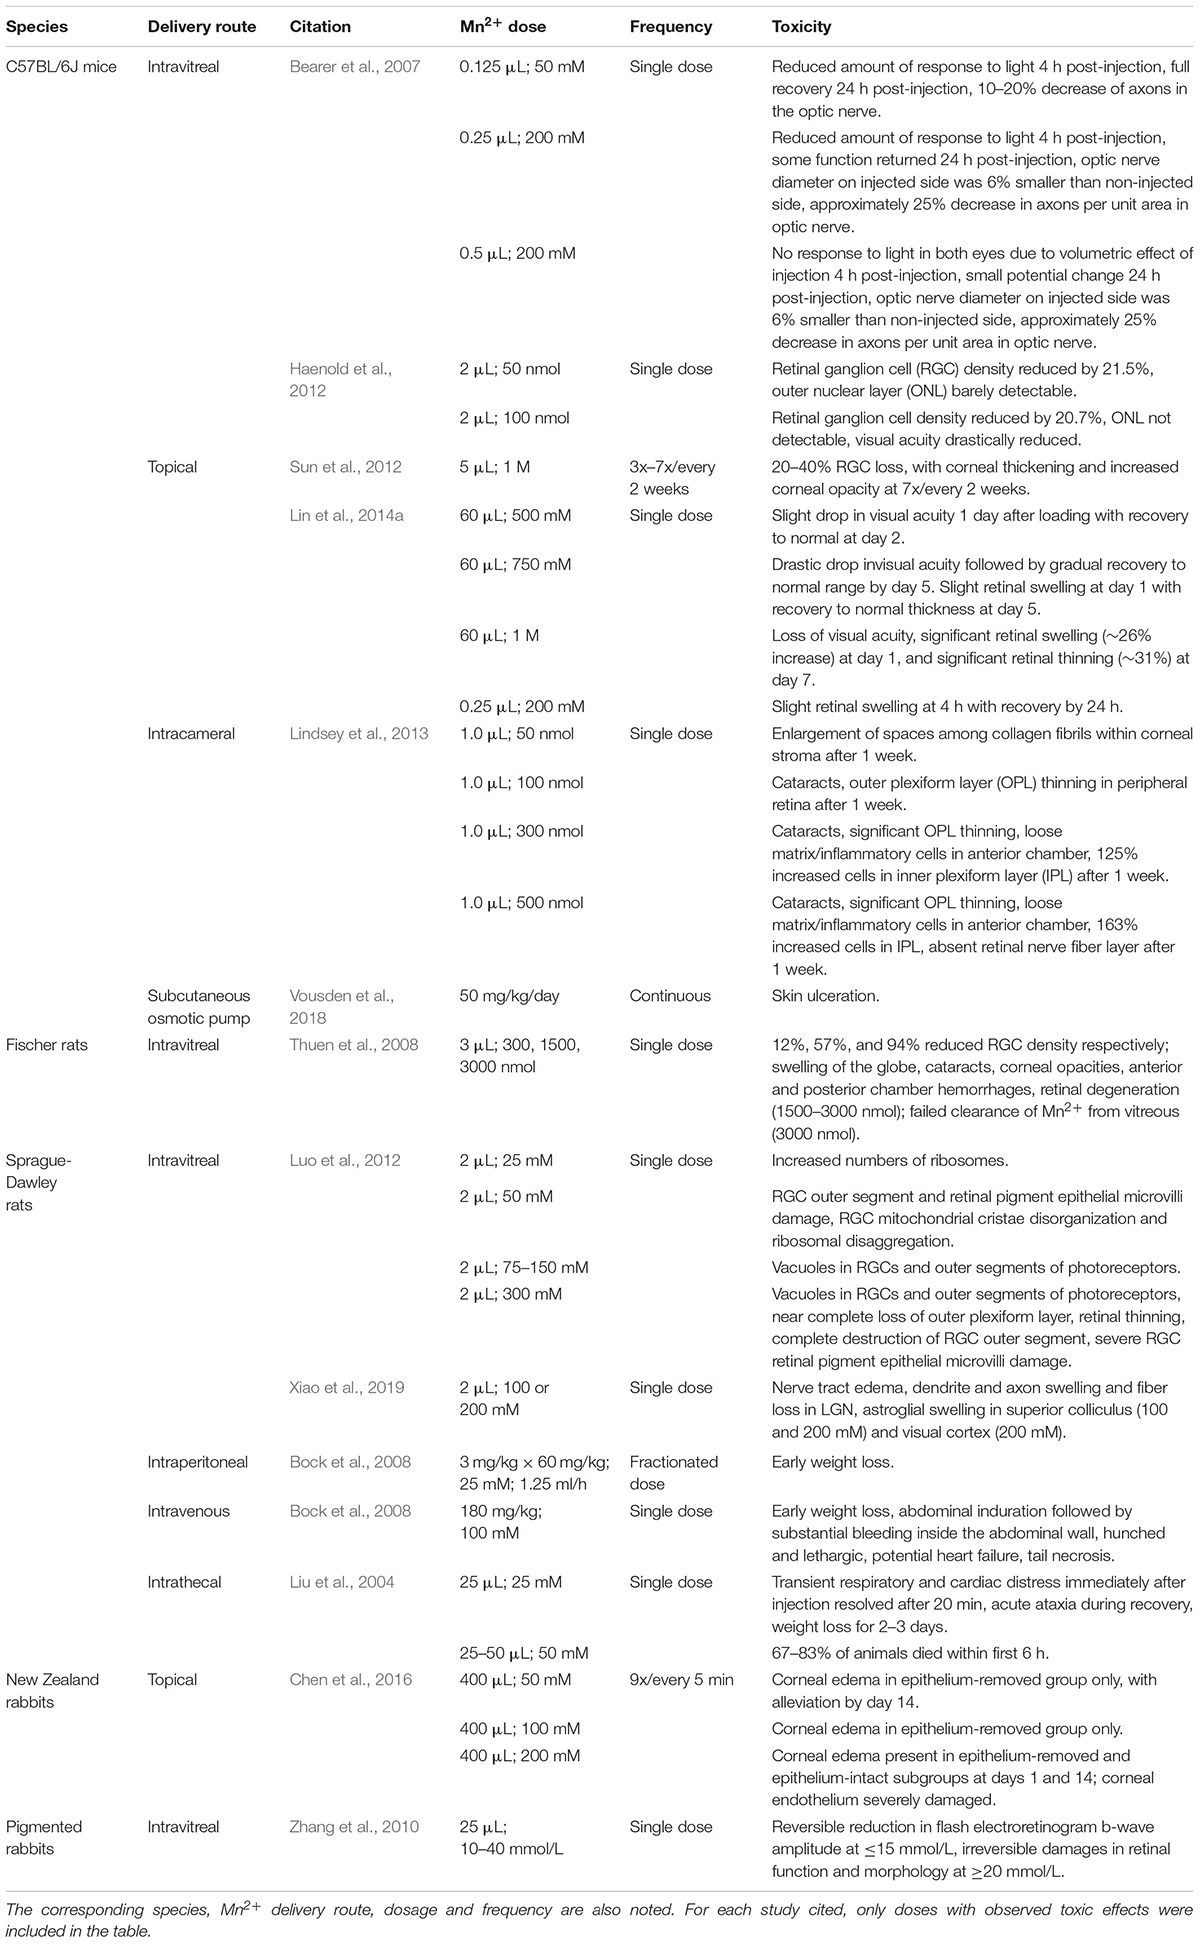
Table 5. Summary of toxic effects observed in the visual system and beyond after high-dose Mn2+ use in MEMRI.
Future Directions
One of the most important aspects for the future of Mn2+ based imaging is to identify less toxic Mn2+ salts that can be used as contrast agents for both clinical and preclinical applications. This will avoid the design handicap that we witness in the current protocols including systemic toxicity and local injuries to the target tissues and the injection sites. A potential solution is the use of chelating agents designed to sequester Mn2+ ions and drive a slow-release in biological systems. Mangafodipir trisodium (MnDPDP, TeslaScan) is an example of such. This compound is consisted of Mn2+ ions and fodipir (dipyridoxyl diphosphate) as a chelating agent, and was approved for clinical use for pancreatic and hepatobiliary imaging (Lim et al., 1991; Rofsky and Weinreb, 1992), myocardial infarction detection (Pomeroy et al., 1989; Saeed et al., 1989), and diagnostics of cancer including hepatocellular carcinoma (Sutcliffe et al., 2011). Initial studies involving intravenous MnDPDP administrations to healthy human volunteers showed maximal T1-weighted MRI enhancement within 15–30 min in the liver, pancreas, spleen, and kidney that lasted for hours (Wang et al., 1997) until clearance from hepatocytes within 24 h of administration (Koh et al., 2007). MnDPDP has been demonstrated not to cause adverse injection site injury or dermal hypersensitivity (Larsen and Grant, 1997). Also, in vivo catecholamine release triggered by MnDPDP administration prevents the potentially negative ionotropic effects of Mn2+ ions on cardiac function (Jynge et al., 1997). The reduced initial cardiac uptake of Mn2+ may account for the favorable cardiovascular safety of MnDPDP (Ni et al., 1997) with low incidence of serious side effects (Federle et al., 2000).
With regards to the visual system, intravitreal MnDPDP injection allows MEMRI tract tracing in the rat retina and optic nerve similar to intravitreal MnCl2 injection (Olsen et al., 2008), while systemic MnDPDP administration allows MEMRI detection of dark- or light-adapted retinal function at a clinically relevant dose in healthy rats (Tofts et al., 2010). MnDPDP enhancement may also reflect gliosis in hypoxic-ischemic injured rat brains in T1-weighted imaging (Yang and Wu, 2009). While the MRI-contrast properties of MnDPDP rely on the release of Mn2+, MnDPDP possesses MnSOD-mimetic activity which is dependent on the manganese ions that are bound to the fodipir part (Karlsson et al., 2015). MnDPDP may also help identify populations of neural stem and progenitor cells within the intact embryo brain for investigating neurodevelopment and disease mechanisms (Norris et al., 2013). On a negative note, MnDPDP has been shown to induce skeletal abnormalities in fetal rodents thereby raising a caveat for the toxicity of teratogenic nature (Grant et al., 1997). It is important to note that MnDPDP does not pose much toxicity in animal models unless it is used in high doses (Elizondo et al., 1991). Though MnDPDP-based neuroimaging has found remarkable use in rodent models in recent years, its use in human brains remains limited given the lack of thorough toxicity, sensitivity, and specificity assessments at relevant doses (Wang et al., 1997). Human eyes are at least 3–7 times bigger than rodent eyes in diameter (Van Cruchten et al., 2017), while the human brains are more than a 1000 times larger than rodent brains in volume (Semple et al., 2013). Also, rodents do not have lamina cribrosa or macula, both of which play important roles in vision disorders such as glaucoma and age-related macular degeneration. For more accurate determinations of human visual neurophysiology and visual disease mechanisms, we may likely see over the coming decade the translation of MnDPDP neuroimaging from rodents toward larger mammals before practical applications to the human visual system.
Apart from Mn2+ safety, one of the essential goals for future MEMRI studies would be to decipher the metabolic arena (Barandov et al., 2019) and transport of Mn2+ in the neuronal milieu as that would aid in developing better studies and understanding not only structure and function but also mechanism of disease progression and protocols for differential diagnosis and prognosis. Employment of nanotechnology such as nanoparticle-based delivery of Mn2+ may deliver Mn2+ to the eye and the visual pathway more specifically without altering the blood–ocular or blood–brain barrier (Bertin et al., 2009; Alaverdashvili et al., 2017; Sanchez-Ramos et al., 2018; Barandov et al., 2019). Additionally, sustained release of Mn2+ ions can improve Mn2+ entry duration and MEMRI sensitivity while minimizing toxicity and injection frequency (Bertin et al., 2009; Morch et al., 2012). MRI hardware and imaging sequence developments may also pave way to improve MEMRI sensitivity for detecting spare neuronal connectivity or weak brain activity change. Future studies may utilize real-time MRI to allow monitoring the outcomes of pharmacological interventions in a dynamic environment (Lu et al., 2008). Awake dynamic MEMRI may also be used for probing brain activity and pharmacological kinetics while minimizing confounds from anesthetic regimes (Febo et al., 2005; Schroeder et al., 2016).
In summary, MEMRI has considerable potential for unveiling the neural circuits of the visual system in relation to development, impairments, plasticity, and restoration. There are many unknown functional and disease processes involving the visual system that may be deciphered with the help of MEMRI. However, more work has to be done in regard to understanding precisely how Mn2+ is distributed in biological systems while avoiding the pitfalls of Mn2+ toxicity. Uncovering the mysteries behind Mn2+ detection mechanisms is the key to opening new doors for MEMRI as a non-invasive and useful in vivo tool in studying different aspects of ophthalmology and visual neuroscience.
Data Availability
No datasets were generated or analyzed for this study.
Author Contributions
WD, MF, CL, and VA wrote the manuscript. KC proposed the topic and edited the manuscript.
Funding
This work was supported in part by the National Institutes of Health R01-EY028125 (Bethesda, MD, United States); the BrightFocus Foundation G2013077, G2016030, and G2019103 (Clarksburg, MD, United States); and the Research to Prevent Blindness/Stavros Niarchos Foundation International Research Collaborators Award (New York, NY, United States).
Conflict of Interest Statement
The authors declare that the research was conducted in the absence of any commercial or financial relationships that could be construed as a potential conflict of interest.
References
Alaverdashvili, M., Lapointe, V., Whishaw, I. Q., and Cross, A. R. (2017). Manganese-enhanced magnetic resonance imaging and studies of rat behavior: transient motor deficit in skilled reaching, rears, and activity in rats after a single dose of MnCl2. Magn. Reson. Insights 10:1178623X17706878. doi: 10.1177/1178623X17706878
Almeida-Correa, S., Czisch, M., and Wotjak, C. T. (2018). In vivo visualization of active polysynaptic circuits with longitudinal manganese-enhanced MRI (MEMRI). Front. Neural Circuits 12:42. doi: 10.3389/fncir.2018.00042
Aoki, I., Tanaka, C., Takegami, T., Ebisu, T., Umeda, M., Fukunaga, M., et al. (2002). Dynamic activity-induced manganese-dependent contrast magnetic resonance imaging (DAIM MRI). Magn. Reson. Med. 48, 927–933. doi: 10.1002/mrm.10320
Aoki, I., Wu, Y. J., Silva, A. C., Lynch, R. M., and Koretsky, A. P. (2004). In vivo detection of neuroarchitecture in the rodent brain using manganese-enhanced MRI. Neuroimage 22, 1046–1059. doi: 10.1016/j.neuroimage.2004.03.031
Aschner, M., Vrana, K. E., and Zheng, W. (1999). Manganese uptake and distribution in the central nervous system (CNS). Neurotoxicology 20, 173–180.
Atanasijevic, T., Bouraoud, N., Mcgavern, D. B., and Koretsky, A. P. (2017). Transcranial manganese delivery for neuronal tract tracing using MEMRI. Neuroimage 156, 146–154. doi: 10.1016/j.neuroimage.2017.05.025
Bade, A. N., Zhou, B., Epstein, A. A., Gorantla, S., Poluektova, L. Y., Luo, J., et al. (2013). Improved visualization of neuronal injury following glial activation by manganese enhanced MRI. J. Neuroimmune Pharmacol. 8, 1027–1036. doi: 10.1007/s11481-013-9475-3
Barandov, A., Bartelle, B. B., Williamson, C. G., Loucks, E. S., Lippard, S. J., and Jasanoff, A. (2019). Sensing intracellular calcium ions using a manganese-based MRI contrast agent. Nat. Commun. 10:897. doi: 10.1038/s41467-019-08558-7
Bearer, E. L., Falzone, T. L., Zhang, X., Biris, O., Rasin, A., and Jacobs, R. E. (2007). Role of neuronal activity and kinesin on tract tracing by manganese-enhanced MRI (MEMRI). Neuroimage 37(Suppl. 1), S37–S46.
Bedenk, B. T., Almeida-Correa, S., Jurik, A., Dedic, N., Grunecker, B., Genewsky, A. J., et al. (2018). Mn(2+) dynamics in manganese-enhanced MRI (MEMRI): Cav1.2 channel-mediated uptake and preferential accumulation in projection terminals. Neuroimage 169, 374–382. doi: 10.1016/j.neuroimage.2017.12.054
Berkowitz, B. A., Bissig, D., Bergman, D., Bercea, E., Kasturi, V. K., and Roberts, R. (2011). Intraretinal calcium channels and retinal morbidity in experimental retinopathy of prematurity. Mol. Vis. 17, 2516–2526.
Berkowitz, B. A., Bissig, D., Patel, P., Bhatia, A., and Roberts, R. (2012). Acute systemic 11-cis-retinal intervention improves abnormal outer retinal ion channel closure in diabetic mice. Mol. Vis. 18, 372–376.
Berkowitz, B. A., Gradianu, M., Bissig, D., Kern, T. S., and Roberts, R. (2009a). Retinal ion regulation in a mouse model of diabetic retinopathy: natural history and the effect of Cu/Zn superoxide dismutase overexpression. Invest. Ophthalmol. Vis. Sci. 50, 2351–2358. doi: 10.1167/iovs.08-2918
Berkowitz, B. A., Roberts, R., Oleske, D. A., Chang, M., Schafer, S., Bissig, D., et al. (2009b). Quantitative mapping of ion channel regulation by visual cycle activity in rodent photoreceptors in vivo. Invest. Ophthalmol. Vis. Sci. 50, 1880–1885. doi: 10.1167/iovs.08-2958
Berkowitz, B. A., Gradianu, M., Schafer, S., Jin, Y., Porchia, A., Iezzi, R., et al. (2008). Ionic dysregulatory phenotyping of pathologic retinal thinning with manganese-enhanced MRI. Invest. Ophthalmol. Vis. Sci. 49, 3178–3184. doi: 10.1167/iovs.08-1720
Berkowitz, B. A., Grady, E. M., Khetarpal, N., Patel, A., and Roberts, R. (2015a). Oxidative stress and light-evoked responses of the posterior segment in a mouse model of diabetic retinopathy. Invest. Ophthalmol. Vis. Sci. 56, 606–615. doi: 10.1167/iovs.14-15687
Berkowitz, B. A., Murphy, G. G., Craft, C. M., Surmeier, D. J., and Roberts, R. (2015b). Genetic dissection of horizontal cell inhibitory signaling in mice in complete darkness in vivo. Invest. Ophthalmol. Vis. Sci. 56, 3132–3139. doi: 10.1167/iovs.15-16581
Berkowitz, B. A., Grady, E. M., and Roberts, R. (2014). Confirming a prediction of the calcium hypothesis of photoreceptor aging in mice. Neurobiol. Aging 35, 1883–1891. doi: 10.1016/j.neurobiolaging.2014.02.020
Berkowitz, B. A., Miller, R. A., and Roberts, R. (2017). Genetically heterogeneous mice show age-related vision deficits not related to increased rod cell L-type calcium channel function in vivo. Neurobiol. Aging 49, 198–203. doi: 10.1016/j.neurobiolaging.2016.09.009
Berkowitz, B. A., Roberto, K. A., and Penn, J. S. (1998). The vitreous protein concentration is increased prior to neovascularization in experimental ROP. Curr. Eye Res. 17, 218–221. doi: 10.1076/ceyr.17.2.218.5604
Berkowitz, B. A., Roberts, R., and Bissig, D. (2010). Light-dependant intraretinal ion regulation by melanopsin in young awake and free moving mice evaluated with manganese-enhanced MRI. Mol. Vis. 16, 1776–1780.
Berkowitz, B. A., Roberts, R., Goebel, D. J., and Luan, H. (2006). Noninvasive and simultaneous imaging of layer-specific retinal functional adaptation by manganese-enhanced MRI. Invest. Ophthalmol. Vis. Sci. 47, 2668–2674.
Berkowitz, B. A., Roberts, R., Luan, H., Bissig, D., Bui, B. V., Gradianu, M., et al. (2007a). Manganese-enhanced MRI studies of alterations of intraretinal ion demand in models of ocular injury. Invest. Ophthalmol. Vis. Sci. 48, 3796–3804.
Berkowitz, B. A., Roberts, R., Penn, J. S., and Gradianu, M. (2007b). High-resolution manganese-enhanced MRI of experimental retinopathy of prematurity. Invest. Ophthalmol. Vis. Sci. 48, 4733–4740.
Berkowitz, B. A., Roberts, R., Stemmler, A., Luan, H., and Gradianu, M. (2007c). Impaired apparent ion demand in experimental diabetic retinopathy: correction by lipoic acid. Invest. Ophthalmol. Vis. Sci. 48, 4753–4758.
Berkowitz, B. A., Schmidt, T., Podolsky, R. H., and Roberts, R. (2016). Melanopsin phototransduction contributes to light-evoked choroidal expansion and rod L-type calcium channel function in vivo. Invest. Ophthalmol. Vis. Sci. 57, 5314–5319. doi: 10.1167/iovs.16-20186
Bertin, A., Steibel, J., Michou-Gallani, A. I., Gallani, J. L., and Felder-Flesch, D. (2009). Development of a dendritic manganese-enhanced magnetic resonance imaging (MEMRI) contrast agent: synthesis, toxicity (in vitro) and relaxivity (in vitro, in vivo) studies. Bioconjug. Chem. 20, 760–767. doi: 10.1021/bc8004683
Bertrand, A., Baron, M., Hoang, D. M., Hill, L. K., Mendoza, S. L., Sigurdsson, E. M., et al. (2018). In vivo evaluation of neuronal transport in murine models of neurodegeneration using manganese-enhanced MRI. Methods Mol. Biol. 1779, 527–541. doi: 10.1007/978-1-4939-7816-8_33
Bhave, G., and Neilson, E. G. (2011). Body fluid dynamics: back to the future. J. Am. Soc. Nephrol. 22, 2166–2181. doi: 10.1681/ASN.2011080865
Bidmon, H. J., Kato, K., Schleicher, A., Witte, O. W., and Zilles, K. (1998). Transient increase of manganese-superoxide dismutase in remote brain areas after focal photothrombotic cortical lesion. Stroke 29, 203–210; discussion 211.
Bissig, D., and Berkowitz, B. A. (2009). Manganese-enhanced MRI of layer-specific activity in the visual cortex from awake and free-moving rats. Neuroimage 44, 627–635. doi: 10.1016/j.neuroimage.2008.10.013
Bissig, D., and Berkowitz, B. A. (2011). Same-session functional assessment of rat retina and brain with manganese-enhanced MRI. Neuroimage 58, 749–760. doi: 10.1016/j.neuroimage.2011.06.062
Bissig, D., Goebel, D., and Berkowitz, B. A. (2013). Diminished vision in healthy aging is associated with increased retinal L-type voltage gated calcium channel ion influx. PLoS One 8:e56340. doi: 10.1371/journal.pone.0056340
Bock, N. A., Kocharyan, A., and Silva, A. C. (2009). Manganese-enhanced MRI visualizes V1 in the non-human primate visual cortex. NMR Biomed. 22, 730–736. doi: 10.1002/nbm.1384
Bock, N. A., Paiva, F. F., and Silva, A. C. (2008). Fractionated manganese-enhanced MRI. NMR Biomed. 21, 473–478. doi: 10.1002/nbm.1211
Braun, R. D., Gradianu, M., Vistisen, K. S., Roberts, R. L., and Berkowitz, B. A. (2007). Manganese-enhanced MRI of human choroidal melanoma xenografts. Invest. Ophthalmol. Vis. Sci. 48, 963–967.
Calkins, D. J., Horner, P. J., Roberts, R., Gradianu, M., and Berkowitz, B. A. (2008). Manganese-enhanced MRI of the DBA/2J mouse model of hereditary glaucoma. Invest. Ophthalmol. Vis. Sci. 49, 5083–5088. doi: 10.1167/iovs.08-2205
Chan, K. C., Cai, K. X., Su, H. X., Hung, V. K., Cheung, M. M., Chiu, C. T., et al. (2008a). Early detection of neurodegeneration in brain ischemia by manganese-enhanced MRI. Conf. Proc. IEEE Eng. Med. Biol. Soc. 2008, 3884–3887. doi: 10.1109/IEMBS.2008.4650058
Chan, K. C., Fu, Q. L., Guo, H., So, K. F., and Wu, E. X. (2008b). GD-DTPA enhanced MRI of ocular transport in a rat model of chronic glaucoma. Exp. Eye Res. 87, 334–341. doi: 10.1016/j.exer.2008.06.015
Chan, K. C., Fu, Q. L., Hui, E. S., So, K. F., and Wu, E. X. (2008c). Evaluation of the retina and optic nerve in a rat model of chronic glaucoma using in vivo manganese-enhanced magnetic resonance imaging. Neuroimage 40, 1166–1174. doi: 10.1016/j.neuroimage.2008.01.002
Chan, K. C., Cheng, J. S., Fan, S., Zhou, I. Y., Yang, J., and Wu, E. X. (2012a). In vivo evaluation of retinal and callosal projections in early postnatal development and plasticity using manganese-enhanced MRI and diffusion tensor imaging. Neuroimage 59, 2274–2283. doi: 10.1016/j.neuroimage.2011.09.055
Chan, K. C., Fan, S. J., Zhou, I. Y., and Wu, E. X. (2012b). In vivo chromium-enhanced MRI of the retina. Magn. Reson. Med. 68, 1202–1210. doi: 10.1002/mrm.24123
Chan, K. C., Fan, S. J., Chan, R. W., Cheng, J. S., Zhou, I. Y., and Wu, E. X. (2014a). In vivo visuotopic brain mapping with manganese-enhanced MRI and resting-state functional connectivity MRI. Neuroimage 90, 235–245. doi: 10.1016/j.neuroimage.2013.12.056
Chan, K. C., Kancherla, S., Fan, S. J., and Wu, E. X. (2014b). Long-term effects of neonatal hypoxia-ischemia on structural and physiological integrity of the eye and visual pathway by multimodal MRI. Invest. Ophthalmol. Vis. Sci. 56, 1–9. doi: 10.1167/iovs.14-14287
Chan, K. C., Fu, Q. L., So, K. F., and Wu, E. X. (2007). Evaluation of the visual system in a rat model of chronic glaucoma using manganese-enhanced magnetic resonance imaging. Conf. Proc. IEEE Eng. Med. Biol. Soc. 2007, 67–70.
Chan, K. C., Li, J., Kau, P., Zhou, I. Y., Cheung, M. M., Lau, C., et al. (2011). In vivo retinotopic mapping of superior colliculus using manganese-enhanced magnetic resonance imaging. Neuroimage 54, 389–395. doi: 10.1016/j.neuroimage.2010.07.015
Chan, K. C., Zhou, I. Y., Liu, S. S., Van Der Merwe, Y., Fan, S. J., Hung, V. K., et al. (2017). Longitudinal assessments of normal and perilesional tissues in focal brain ischemia and partial optic nerve injury with manganese-enhanced MRI. Sci. Rep. 7:43124. doi: 10.1038/srep43124
Cheli, V. T., Santiago Gonzalez, D. A., Smith, J., Spreuer, V., Murphy, G. G., and Paez, P. M. (2016). L-type voltage-operated calcium channels contribute to astrocyte activation In vitro. Glia 64, 1396–1415. doi: 10.1002/glia.23013
Chen, Y., Shi, C. Y., Li, Y., Hu, Y. T., Han, H. B., Sun, X. D., et al. (2016). Ability of Mn(2+) to permeate the eye and availability of manganese-enhanced magnetic resonance imaging for visual pathway imaging via topical administration. Chin. Med. J. 129, 1822–1829. doi: 10.4103/0366-6999.186630
Cheung, M. M., Hui, E. S., Chan, K. C., Helpern, J. A., Qi, L., and Wu, E. X. (2009). Does diffusion kurtosis imaging lead to better neural tissue characterization? A rodent brain maturation study. Neuroimage 45, 386–392. doi: 10.1016/j.neuroimage.2008.12.018
Chuang, K. H., Belluscio, L., and Koretsky, A. P. (2010). In vivo detection of individual glomeruli in the rodent olfactory bulb using manganese enhanced MRI. Neuroimage 49, 1350–1356. doi: 10.1016/j.neuroimage.2009.09.060
Chuang, K. H., and Koretsky, A. (2006). Improved neuronal tract tracing using manganese enhanced magnetic resonance imaging with fast T(1) mapping. Magn. Reson. Med. 55, 604–611. doi: 10.1002/mrm.20797
Chuang, K. H., Koretsky, A. P., and Sotak, C. H. (2009). Temporal changes in the T1 and T2 relaxation rates (DeltaR1 and DeltaR2) in the rat brain are consistent with the tissue-clearance rates of elemental manganese. Magn. Reson. Med. 61, 1528–1532. doi: 10.1002/mrm.21962
Chung, S., Fieremans, E., Wang, X., Kucukboyaci, N. E., Morton, C. J., Babb, J., et al. (2018). White matter tract integrity: an indicator of axonal pathology after mild traumatic brain injury. J. Neurotrauma 35, 1015–1020. doi: 10.1089/neu.2017.5320
Daducci, A., Tambalo, S., Fiorini, S., Osculati, F., Teti, M., Fabene, P. F., et al. (2014). Manganese-enhanced magnetic resonance imaging investigation of the interferon-alpha model of depression in rats. Magn. Reson. Imaging 32, 529–534. doi: 10.1016/j.mri.2014.02.006
De La Garza, B. H., Li, G., Shih, Y. Y., and Duong, T. Q. (2012). Layer-specific manganese-enhanced MRI of the retina in light and dark adaptation. Invest. Ophthalmol. Vis. Sci. 53, 4352–4358. doi: 10.1167/iovs.11-8826
de Sousa, P. L., De Souza, S. L., Silva, A. C., De Souza, R. E., and De Castro, R. M. (2007). Manganese-enhanced magnetic resonance imaging (MEMRI) of rat brain after systemic administration of MnCl2: changes in T1 relaxation times during postnatal development. J. Magn. Reson. Imaging 25, 32–38. doi: 10.1002/jmri.20792
Driencourt, L., Romero, C. J., Lepore, M., Eggenschwiler, F., Reynaud, O., and Just, N. (2017). T1 mapping of the mouse brain following fractionated manganese administration using MP2RAGE. Brain Struct. Funct. 222, 201–214. doi: 10.1007/s00429-016-1211-3
Duong, T. Q., Silva, A. C., Lee, S. P., and Kim, S. G. (2000). Functional MRI of calcium-dependent synaptic activity: cross correlation with CBF and BOLD measurements. Magn. Reson. Med. 43, 383–392. doi: 10.1002/(sici)1522-2594(200003)43:3<383::aid-mrm10>3.0.co;2-q
Elizondo, G., Fretz, C. J., Stark, D. D., Rocklage, S. M., Quay, S. C., Worah, D., et al. (1991). Preclinical evaluation of MnDPDP: new paramagnetic hepatobiliary contrast agent for MR imaging. Radiology 178, 73–78. doi: 10.1148/radiology.178.1.1898538
Fa, Z., Zhang, P., Huang, F., Li, P., Zhang, R., Xu, R., et al. (2010). Activity-induced manganese-dependent functional MRI of the rat visual cortex following intranasal manganese chloride administration. Neurosci. Lett. 481, 110–114. doi: 10.1016/j.neulet.2010.06.063
Fa, Z., Zhang, R., Li, P., Zhang, J., Zhang, P., Zhu, S., et al. (2011). Effects of temporarily disrupting BBB on activity-induced manganese-dependent functional MRI. Brain Imaging Behav. 5, 181–188. doi: 10.1007/s11682-011-9122-7
Febo, M., Segarra, A. C., Nair, G., Schmidt, K., Duong, T. Q., and Ferris, C. F. (2005). The neural consequences of repeated cocaine exposure revealed by functional MRI in awake rats. Neuropsychopharmacology 30, 936–943. doi: 10.1038/sj.npp.1300653
Federle, M. P., Chezmar, J. L., Rubin, D. L., Weinreb, J. C., Freeny, P. C., Semelka, R. C., et al. (2000). Safety and efficacy of mangafodipir trisodium (MnDPDP) injection for hepatic MRI in adults: results of the U.S. multicenter phase III clinical trials (safety). J. Magn. Reson. Imaging 12, 186–197. doi: 10.1002/1522-2586(200007)12:1<186::aid-jmri21>3.0.co;2-2
Fiedorowicz, M., Orzel, J., Kossowski, B., Welniak-Kaminska, M., Choragiewicz, T., Swiatkiewicz, M., et al. (2018). Anterograde transport in axons of the retinal ganglion cells and its relationship to the intraocular pressure during aging in mice with hereditary pigmentary glaucoma. Curr. Eye Res. 43, 539–546. doi: 10.1080/02713683.2017.1416147
Fischer, S., Engelmann, C., Herrmann, K. H., Reichenbach, J. R., Witte, O. W., Weih, F., et al. (2014). In vivo imaging of optic nerve fiber integrity by contrast-enhanced MRI in mice. J. Vis. Exp. 89:51274. doi: 10.3791/51274
Forrester, J., and Peters, A. (1967). Nerve fibres in optic nerve of rat. Nature 214, 245–247. doi: 10.1038/214245a0
Fregoneze, J. B., Ferreira, H. S., and Luz, C. P. N. (2014). “Brain serotonergic receptors and control of fluid intake and cardiovascular function in rats,” in Neurobiology of Body Fluid Homeostasis: Transduction and Integration, eds L. A. De Luca Jr., J. V. Menani, and A. K. Johnson (Boca Raton, FL: CRC Press).
Friedland, D. R., Eden, A. R., and Laitman, J. T. (1996). Use of the novel carbocyanine tracer fast-DiI for investigating upper respiratory tract cranial nerves in prenatal rats. Lab. Anim. Sci. 46, 220–225.
Fujioka, M., Taoka, T., Matsuo, Y., Mishima, K., Ogoshi, K., Kondo, Y., et al. (2003). Magnetic resonance imaging shows delayed ischemic striatal neurodegeneration. Ann. Neurol. 54, 732–747. doi: 10.1002/ana.10751
Gadjanski, I., Boretius, S., Williams, S. K., Lingor, P., Knoferle, J., Sattler, M. B., et al. (2009). Role of n-type voltage-dependent calcium channels in autoimmune optic neuritis. Ann. Neurol. 66, 81–93. doi: 10.1002/ana.21668
Gallagher, J. J., Zhang, X., Ziomek, G. J., Jacobs, R. E., and Bearer, E. L. (2012). Deficits in axonal transport in hippocampal-based circuitry and the visual pathway in APP knock-out animals witnessed by manganese enhanced MRI. Neuroimage 60, 1856–1866. doi: 10.1016/j.neuroimage.2012.01.132
Gilbert, C. D., and Li, W. (2013). Top-down influences on visual processing. Nat. Rev. Neurosci. 14, 350–363. doi: 10.1038/nrn3476
Giordano, C. R., Roberts, R., Krentz, K. A., Bissig, D., Talreja, D., Kumar, A., et al. (2015). Catalase therapy corrects oxidative stress-induced pathophysiology in incipient diabetic retinopathy. Invest. Ophthalmol. Vis. Sci. 56, 3095–3102. doi: 10.1167/iovs.14-16194
Golub, M. S., Han, B., and Keen, C. L. (1996). Aluminum alters iron and manganese uptake and regulation of surface transferrin receptors in primary rat oligodendrocyte cultures. Brain Res. 719, 72–77. doi: 10.1016/0006-8993(96)00087-x
Grant, D., Blazak, W. F., and Brown, G. L. (1997). The reproductive toxicology of intravenously administered MnDPDP in the rat and rabbit. Acta Radiol. 38, 759–769. doi: 10.3109/02841859709172409
Grunecker, B., Kaltwasser, S. F., Peterse, Y., Samann, P. G., Schmidt, M. V., Wotjak, C. T., et al. (2010). Fractionated manganese injections: effects on MRI contrast enhancement and physiological measures in C57BL/6 mice. NMR Biomed. 23, 913–921. doi: 10.1002/nbm.1508
Gunter, T. E., Gerstner, B., Gunter, K. K., Malecki, J., Gelein, R., Valentine, W. M., et al. (2013). Manganese transport via the transferrin mechanism. Neurotoxicology 34, 118–127. doi: 10.1016/j.neuro.2012.10.018
Haapanen, A., Ramadan, U. A., Autti, T., Joensuu, R., and Tyynela, J. (2007). In vivo MRI reveals the dynamics of pathological changes in the brains of cathepsin D-deficient mice and correlates changes in manganese-enhanced MRI with microglial activation. Magn. Reson. Imaging 25, 1024–1031. doi: 10.1016/j.mri.2007.03.012
Haenold, R., Herrmann, K. H., Schmidt, S., Reichenbach, J. R., Schmidt, K. F., Lowel, S., et al. (2012). Magnetic resonance imaging of the mouse visual pathway for in vivo studies of degeneration and regeneration in the CNS. Neuroimage 59, 363–376. doi: 10.1016/j.neuroimage.2011.07.069
Hao, X. Z., Yin, L. K., Zhang, X. X., Tian, J. Q., Li, C. C., Feng, X. Y., et al. (2016). Combining systemic and stereotactic MEMRI to detect the correlation between gliosis and neuronal connective pathway at the chronic stage after stroke. J. Neuroinflammation 13:156. doi: 10.1186/s12974-016-0622-7
Hernandez, C. M., Beck, W. D., Naughton, S. X., Poddar, I., Adam, B. L., Yanasak, N., et al. (2015). Repeated exposure to chlorpyrifos leads to prolonged impairments of axonal transport in the living rodent brain. Neurotoxicology 47, 17–26. doi: 10.1016/j.neuro.2015.01.002
Ho, L. C., Conner, I. P., Do, C. W., Kim, S. G., Wu, E. X., Wollstein, G., et al. (2014). In vivo assessment of aqueous humor dynamics upon chronic ocular hypertension and hypotensive drug treatment using gadolinium-enhanced MRI. Invest. Ophthalmol. Vis. Sci. 55, 3747–3757. doi: 10.1167/iovs.14-14263
Ho, L. C., Wang, B., Conner, I. P., Van Der Merwe, Y., Bilonick, R. A., Kim, S. G., et al. (2015). In vivo evaluation of white matter integrity and anterograde transport in visual system after excitotoxic retinal injury with multimodal MRI and OCT. Invest. Ophthalmol. Vis. Sci. 56, 3788–3800. doi: 10.1167/iovs.14-15552
Hoffmann, D. B., Williams, S. K., Bojcevski, J., Muller, A., Stadelmann, C., Naidoo, V., et al. (2013). Calcium influx and calpain activation mediate preclinical retinal neurodegeneration in autoimmune optic neuritis. J. Neuropathol. Exp. Neurol. 72, 745–757. doi: 10.1097/NEN.0b013e31829c7370
Hombrebueno, J. R., Luo, C., Guo, L., Chen, M., and Xu, H. (2014). Intravitreal injection of normal saline induces retinal degeneration in the C57BL/6J mouse. Transl. Vis. Sci. Technol. 3:3. doi: 10.1167/tvst.3.2.3
Hooper, L., Abdelhamid, A., Ali, A., Bunn, D. K., Jennings, A., John, W. G., et al. (2015). Diagnostic accuracy of calculated serum osmolarity to predict dehydration in older people: adding value to pathology laboratory reports. BMJ Open 5:e008846. doi: 10.1136/bmjopen-2015-008846
Hori, M., Fukunaga, I., Masutani, Y., Taoka, T., Kamagata, K., Suzuki, Y., et al. (2012). Visualizing non-Gaussian diffusion: clinical application of q-space imaging and diffusional kurtosis imaging of the brain and spine. Magn. Reson. Med. Sci. 11, 221–233. doi: 10.2463/mrms.11.221
Hussain, S., and Ali, S. F. (1999). Manganese scavenges superoxide and hydroxyl radicals: an in vitro study in rats. Neurosci. Lett. 261, 21–24. doi: 10.1016/s0304-3940(98)01005-2
Iliff, J. J., Lee, H., Yu, M., Feng, T., Logan, J., Nedergaard, M., et al. (2013). Brain-wide pathway for waste clearance captured by contrast-enhanced MRI. J. Clin. Invest. 123, 1299–1309. doi: 10.1172/JCI67677
Immonen, R. J., Kharatishvili, I., Sierra, A., Einula, C., Pitkanen, A., and Grohn, O. H. (2008). Manganese enhanced MRI detects mossy fiber sprouting rather than neurodegeneration, gliosis or seizure-activity in the epileptic rat hippocampus. Neuroimage 40, 1718–1730. doi: 10.1016/j.neuroimage.2008.01.042
Ivanova, E., Roberts, R., Bissig, D., Pan, Z. H., and Berkowitz, B. A. (2010). Retinal channelrhodopsin-2-mediated activity in vivo evaluated with manganese-enhanced magnetic resonance imaging. Mol. Vis. 16, 1059–1067.
Jynge, P., Brurok, H., Asplund, A., Towart, R., Refsum, H., and Karlsson, J. O. (1997). Cardiovascular safety of MnDPDP and MnCl2. Acta Radiol. 38, 740–749. doi: 10.3109/02841859709172407
Kancherla, S., Kohler, W. J., Van Der Merwe, Y., and Chan, K. C. (2016). In vivo evaluation of the visual pathway in streptozotocin-induced diabetes by diffusion tensor MRI and contrast enhanced MRI. PLoS One 11:e0165169. doi: 10.1371/journal.pone.0165169
Karlsson, J. O., Ignarro, L. J., Lundstrom, I., Jynge, P., and Almen, T. (2015). Calmangafodipir [Ca4Mn(DPDP)5], mangafodipir (MnDPDP) and MnPLED with special reference to their SOD mimetic and therapeutic properties. Drug Discov. Today 20, 411–421. doi: 10.1016/j.drudis.2014.11.008
Kawai, Y., Aoki, I., Umeda, M., Higuchi, T., Kershaw, J., Higuchi, M., et al. (2010). In vivo visualization of reactive gliosis using manganese-enhanced magnetic resonance imaging. Neuroimage 49, 3122–3131. doi: 10.1016/j.neuroimage.2009.11.005
Kim, H., Cho, J., Kim, Y. R., Song, Y., Chun, S. I., Suh, J. Y., et al. (2014). Response of the primary auditory and non-auditory cortices to acoustic stimulation: a manganese-enhanced MRI study. PLoS One 9:e90427. doi: 10.1371/journal.pone.0090427
Koh, D. M., Brown, G., Meer, Z., Norman, A. R., and Husband, J. E. (2007). Diagnostic accuracy of rim and segmental MRI enhancement of colorectal hepatic metastasis after administration of mangafodipir trisodium. AJR Am. J. Roentgenol. 188, W154–W161.
Komatsu, C., Van Der Merwe, Y., He, L., Miller, M. R., Lucy, K. A., Steketee, M. B., et al. (2017). In vivo assessments of retinal structure and function, and anterograde optic nerve transport after whole eye transplantation. Invest. Ophthalmol. Vis. Sci. 58:4158.
Kristensson, K., and Olsson, Y. (1971). Retrograde axonal transport of protein. Brain Res. 29, 363–365. doi: 10.1016/0006-8993(71)90044-8
Kupfer, C., Chumbley, L., and Downer, J. C. (1967). Quantitative histology of optic nerve, optic tract and lateral geniculate nucleus of man. J. Anat. 101, 393–401.
Laine, M. A., Sokolowska, E., Dudek, M., Callan, S. A., Hyytia, P., and Hovatta, I. (2017). Brain activation induced by chronic psychosocial stress in mice. Sci. Rep. 7:15061. doi: 10.1038/s41598-017-15422-5
Larsen, L. E., and Grant, D. (1997). General toxicology of MnDPDP. Acta Radiol. 38, 770–779. doi: 10.3109/02841859709172410
Lee, J. H., Garwood, M., Menon, R., Adriany, G., Andersen, P., Truwit, C. L., et al. (1995). High contrast and fast three-dimensional magnetic resonance imaging at high fields. Magn. Reson. Med. 34, 308–312. doi: 10.1002/mrm.1910340305
Lee, J. H., Silva, A. C., Merkle, H., and Koretsky, A. P. (2005). Manganese-enhanced magnetic resonance imaging of mouse brain after systemic administration of MnCl2: dose-dependent and temporal evolution of T1 contrast. Magn. Reson. Med. 53, 640–648. doi: 10.1002/mrm.20368
Li, S. K., Jeong, E. K., and Hastings, M. S. (2004). Magnetic resonance imaging study of current and ion delivery into the eye during transscleral and transcorneal iontophoresis. Invest. Ophthalmol. Vis. Sci. 45, 1224–1231.
Li, X., Mcclellan, M. E., Tanito, M., Garteiser, P., Towner, R., Bissig, D., et al. (2012). Loss of caveolin-1 impairs retinal function due to disturbance of subretinal microenvironment. J. Biol. Chem. 287, 16424–16434. doi: 10.1074/jbc.M112.353763
Liang, S., Liang, M., Zhu, Y., Cheng, J., and Yang, Z. (2015). The distribution of Mn2+ in rabbit eyes after topical administration for manganese-enhanced MRI. Int. J. Clin. Exp. Pathol. 8, 836–841.
Liang, Y. X., Cheung, S. W., Chan, K. C., Wu, E. X., Tay, D. K., and Ellis-Behnke, R. G. (2011). CNS regeneration after chronic injury using a self-assembled nanomaterial and MEMRI for real-time in vivo monitoring. Nanomedicine 7, 351–359. doi: 10.1016/j.nano.2010.12.001
Liddelow, S. A., and Sofroniew, M. V. (2019). Astrocytes usurp neurons as a disease focus. Nat. Neurosci. 22, 512–513. doi: 10.1038/s41593-019-0367-6
Lim, K. O., Stark, D. D., Leese, P. T., Pfefferbaum, A., Rocklage, S. M., and Quay, S. C. (1991). Hepatobiliary MR imaging: first human experience with MnDPDP. Radiology 178, 79–82. doi: 10.1148/radiology.178.1.1898539
Lin, C. P., Tseng, W. Y., Cheng, H. C., and Chen, J. H. (2001). Validation of diffusion tensor magnetic resonance axonal fiber imaging with registered manganese-enhanced optic tracts. Neuroimage 14, 1035–1047. doi: 10.1006/nimg.2001.0882
Lin, T. H., Chiang, C. W., Trinkaus, K., Spees, W. M., Sun, P., and Song, S. K. (2014a). Manganese-enhanced MRI (MEMRI) via topical loading of Mn(2+) significantly impairs mouse visual acuity: a comparison with intravitreal injection. NMR Biomed. 27, 390–398. doi: 10.1002/nbm.3073
Lin, T. H., Kim, J. H., Perez-Torres, C., Chiang, C. W., Trinkaus, K., Cross, A. H., et al. (2014b). Axonal transport rate decreased at the onset of optic neuritis in EAE mice. Neuroimage 100, 244–253. doi: 10.1016/j.neuroimage.2014.06.009
Lin, Y. J., and Koretsky, A. P. (1997). Manganese ion enhances T1-weighted MRI during brain activation: an approach to direct imaging of brain function. Magn. Reson. Med. 38, 378–388. doi: 10.1002/mrm.1910380305
Lindsey, J. D., Grob, S. R., Scadeng, M., Duong-Polk, K., and Weinreb, R. N. (2013). Ocular integrity following manganese labeling of the visual system for MRI. Magn. Reson. Imaging 31, 865–874. doi: 10.1016/j.mri.2012.11.012
Lindsey, J. D., Scadeng, M., Dubowitz, D. J., Crowston, J. G., and Weinreb, R. N. (2007). Magnetic resonance imaging of the visual system in vivo: transsynaptic illumination of V1 and V2 visual cortex. Neuroimage 34, 1619–1626. doi: 10.1016/j.neuroimage.2006.07.048
Liu, C. H., D’arceuil, H. E., and De Crespigny, A. J. (2004). Direct CSF injection of MnCl(2) for dynamic manganese-enhanced MRI. Magn. Reson. Med. 51, 978–987. doi: 10.1002/mrm.20047
Liu, H. Q., Wei, J. K., Li, B., Wang, M. S., Wu, R. Q., Rizak, J. D., et al. (2015). Divergence of dim-light vision among bats (order: Chiroptera) as estimated by molecular and electrophysiological methods. Sci. Rep. 5:11531. doi: 10.1038/srep11531
Lu, H., Yang, S., Zuo, Y., Demny, S., Stein, E. A., and Yang, Y. (2008). Real-time animal functional magnetic resonance imaging and its application to neuropharmacological studies. Magn. Reson. Imaging 26, 1266–1272. doi: 10.1016/j.mri.2008.02.020
Luo, L., Xu, H., Li, Y., Du, Z., Sun, X., Ma, Z., et al. (2012). Manganese-enhanced MRI optic nerve tracking: effect of intravitreal manganese dose on retinal toxicity. NMR Biomed. 25, 1360–1368. doi: 10.1002/nbm.2808
Majid, T., Ali, Y. O., Venkitaramani, D. V., Jang, M. K., Lu, H. C., and Pautler, R. G. (2014). In vivo axonal transport deficits in a mouse model of fronto-temporal dementia. Neuroimage Clin. 4, 711–717. doi: 10.1016/j.nicl.2014.02.005
Mansergh, F. C., Chadderton, N., Kenna, P. F., Gobbo, O. L., and Farrar, G. J. (2014). Cell therapy using retinal progenitor cells shows therapeutic effect in a chemically-induced rotenone mouse model of Leber hereditary optic neuropathy. Eur. J. Hum. Genet. 22, 1314–1320. doi: 10.1038/ejhg.2014.26
Massaad, C. A., and Pautler, R. G. (2011). Manganese-enhanced magnetic resonance imaging (MEMRI). Magn. Reson. Neuroimaging Methods Protoc. 711, 145–174. doi: 10.1007/978-1-61737-992-5_7
Matsuda, K., Wang, H. X., Suo, C., Mccombe, D., Horne, M. K., Morrison, W. A., et al. (2010). Retrograde axonal tracing using manganese enhanced magnetic resonance imaging. Neuroimage 50, 366–374. doi: 10.1016/j.neuroimage.2010.01.008
Minoshima, S., and Cross, D. (2008). In vivo imaging of axonal transport using MRI: aging and Alzheimer’s disease. Eur. J. Nucl. Med. Mol. Imaging 35(Suppl. 1), S89–S92. doi: 10.1007/s00259-007-0707-8
Mok, S. I., Munasinghe, J. P., and Young, W. S. (2012). Infusion-based manganese-enhanced MRI: a new imaging technique to visualize the mouse brain. Brain Struct. Funct. 217, 107–114. doi: 10.1007/s00429-011-0324-y
Morch, Y. A., Sandvig, I., Olsen, O., Donati, I., Thuen, M., Skjak-Braek, G., et al. (2012). Mn-alginate gels as a novel system for controlled release of Mn2+ in manganese-enhanced MRI. Contrast Media Mol. Imaging 7, 265–275. doi: 10.1002/cmmi.493
Morken, T. S., Wideroe, M., Vogt, C., Lydersen, S., Havnes, M., Skranes, J., et al. (2013). Longitudinal diffusion tensor and manganese-enhanced MRI detect delayed cerebral gray and white matter injury after hypoxia-ischemia and hyperoxia. Pediatr. Res. 73, 171–179. doi: 10.1038/pr.2012.170
Muir, E. R., Chandra, S. B., De La Garza, B. H., Velagapudi, C., Abboud, H. E., and Duong, T. Q. (2015). Layer-specific manganese-enhanced MRI of the diabetic rat retina in light and dark adaptation at 11.7 Tesla. Invest. Ophthalmol. Vis. Sci. 56, 4006–4012. doi: 10.1167/iovs.14-16128
Murayama, Y., Weber, B., Saleem, K. S., Augath, M., and Logothetis, N. K. (2006). Tracing neural circuits in vivo with Mn-enhanced MRI. Magn. Reson. Imaging 24, 349–358. doi: 10.1016/j.mri.2005.12.031
Nair, G., Pardue, M. T., Kim, M., and Duong, T. Q. (2011). Manganese-enhanced MRI reveals multiple cellular and vascular layers in normal and degenerated retinas. J. Magn. Reson. Imaging 34, 1422–1429. doi: 10.1002/jmri.22719
Ni, Y., Petre, C., Bosmans, H., Miao, Y., Grant, D., Baert, A. L., et al. (1997). Comparison of manganese biodistribution and MR contrast enhancement in rats after intravenous injection of MnDPDP and MnCl2. Acta Radiol. 38, 700–707. doi: 10.3109/02841859709172402
Norenberg, M. D. (1979). Distribution of glutamine synthetase in the rat central nervous system. J. Histochem. Cytochem. 27, 756–762. doi: 10.1177/27.3.39099
Norris, F. C., Betts-Henderson, J., Wells, J. A., Cleary, J. O., Siow, B. M., Walker-Samuel, S., et al. (2013). Enhanced tissue differentiation in the developing mouse brain using magnetic resonance micro-histology. Magn. Reson. Med. 70, 1380–1388. doi: 10.1002/mrm.24573
Olsen, O., Kristoffersen, A., Thuen, M., Sandvig, A., Brekken, C., Haraldseth, O., et al. (2010). Manganese transport in the rat optic nerve evaluated with spatial- and time-resolved magnetic resonance imaging. J. Magn. Reson. Imaging 32, 551–560. doi: 10.1002/jmri.22284
Olsen, O., Thuen, M., Berry, M., Kovalev, V., Petrou, M., Goa, P. E., et al. (2008). Axon tracing in the adult rat optic nerve and tract after intravitreal injection of MnDPDP using a semiautomatic segmentation technique. J. Magn. Reson. Imaging 27, 34–42. doi: 10.1002/jmri.21234
Patel, A. J., Weir, M. D., Hunt, A., Tahourdin, C. S., and Thomas, D. G. (1985). Distribution of glutamine synthetase and glial fibrillary acidic protein and correlation of glutamine synthetase with glutamate decarboxylase in different regions of the rat central nervous system. Brain Res. 331, 1–9. doi: 10.1016/0006-8993(85)90708-5
Pautler, R. G. (2004). In vivo, trans-synaptic tract-tracing utilizing manganese-enhanced magnetic resonance imaging (MEMRI). NMR Biomed. 17, 595–601. doi: 10.1002/nbm.942
Pautler, R. G., Silva, A. C., and Koretsky, A. P. (1998). In vivo neuronal tract tracing using manganese-enhanced magnetic resonance imaging. Magn. Reson. Med. 40, 740–748. doi: 10.1002/mrm.1910400515
Pomeroy, O. H., Wendland, M., Wagner, S., Derugin, N., Holt, W. W., Rocklage, S. M., et al. (1989). Magnetic resonance imaging of acute myocardial ischemia using a manganese chelate, Mn-DPDP. Invest. Radiol. 24, 531–536. doi: 10.1097/00004424-198907000-00004
Poole, D. S., Doorenweerd, N., Plomp, J. J., Mahfouz, A., Reinders, M. J. T., and Van Der Weerd, L. (2017). Continuous infusion of manganese improves contrast and reduces side effects in manganese-enhanced magnetic resonance imaging studies. Neuroimage 147, 1–9. doi: 10.1016/j.neuroimage.2016.09.030
Qiu, L. R., Fernandes, D. J., Szulc-Lerch, K. U., Dazai, J., Nieman, B. J., Turnbull, D. H., et al. (2018). Mouse MRI shows brain areas relatively larger in males emerge before those larger in females. Nat. Commun. 9:2615. doi: 10.1038/s41467-018-04921-2
Rajakumar, N., Elisevich, K., and Flumerfelt, B. A. (1993). Biotinylated dextran: a versatile anterograde and retrograde neuronal tracer. Brain Res. 607, 47–53. doi: 10.1016/0006-8993(93)91488-e
Roels, H., Meiers, G., Delos, M., Ortega, I., Lauwerys, R., Buchet, J. P., et al. (1997). Influence of the route of administration and the chemical form (MnCl2, MnO2) on the absorption and cerebral distribution of manganese in rats. Arch. Toxicol. 71, 223–230. doi: 10.1007/s002040050380
Rofsky, N. M., and Weinreb, J. C. (1992). Manganese (II) N,N’-dipyridoxylethylenediamine-N,N’-diacetate 5,5’-bis(phosphate): clinical experience with a new contrast agent. Magn. Reson. Q. 8, 156–168.
Ryu, S., Brown, S. L., Kolozsvary, A., Ewing, J. R., and Kim, J. H. (2002). Noninvasive detection of radiation-induced optic neuropathy by manganese-enhanced MRI. Radiat. Res. 157, 500–505. doi: 10.1667/0033-7587(2002)157
Saeed, M., Wagner, S., Wendland, M. F., Derugin, N., Finkbeiner, W. E., and Higgins, C. B. (1989). Occlusive and reperfused myocardial infarcts: differentiation with Mn-DPDP–enhanced MR imaging. Radiology 172, 59–64. doi: 10.1148/radiology.172.1.2500678
Saito, S., Aoki, I., Sawada, K., and Suhara, T. (2012). Quantitative assessment of central nervous system disorder induced by prenatal X-ray exposure using diffusion and manganese-enhanced MRI. NMR Biomed. 25, 75–83. doi: 10.1002/nbm.1715
Saleem, K. S., Pauls, J. M., Augath, M., Trinath, T., Prause, B. A., Hashikawa, T., et al. (2002). Magnetic resonance imaging of neuronal connections in the macaque monkey. Neuron 34, 685–700. doi: 10.1016/s0896-6273(02)00718-3
Sanchez-Ramos, J., Song, S., Kong, X., Foroutan, P., Martinez, G., Dominguez-Viqueria, W., et al. (2018). Chitosan-Mangafodipir nanoparticles designed for intranasal delivery of siRNA and DNA to brain. J. Drug Deliv. Sci. Technol. 43, 453–460. doi: 10.1016/j.jddst.2017.11.013
Sandvig, A., Sandvig, I., Berry, M., Olsen, O., Pedersen, T. B., Brekken, C., et al. (2011). Axonal tracing of the normal and regenerating visual pathway of mouse, rat, frog, and fish using manganese-enhanced MRI (MEMRI). J. Magn. Reson. Imaging 34, 670–675. doi: 10.1002/jmri.22631
Sandvig, I., and Sandvig, A. (2014). Using manganese-enhanced MRI to assess optic nerve regeneration. Methods Mol. Biol. 1162, 233–249. doi: 10.1007/978-1-4939-0777-9_19
Sandvig, I., Thuen, M., Hoang, L., Olsen, O., Sardella, T. C., Brekken, C., et al. (2012). In vivo MRI of olfactory ensheathing cell grafts and regenerating axons in transplant mediated repair of the adult rat optic nerve. NMR Biomed. 25, 620–631. doi: 10.1002/nbm.1778
Schaeffer, D. J., Johnston, K. D., Gilbert, K. M., Gati, J. S., Menon, R. S., and Everling, S. (2018). In vivo manganese tract tracing of frontal eye fields in rhesus macaques with ultra-high field MRI: comparison with DWI tractography. Neuroimage 181, 211–218. doi: 10.1016/j.neuroimage.2018.06.072
Schroeder, M. P., Weiss, C., Procissi, D., Wang, L., and Disterhoft, J. F. (2016). Activity-induced manganese-dependent MRI (AIM-MRI) and functional MRI in awake rabbits during somatosensory stimulation. Neuroimage 126, 72–80. doi: 10.1016/j.neuroimage.2015.11.033
Schur, R. M., Sheng, L., Sahu, B., Yu, G., Gao, S., Yu, X., et al. (2015). Manganese-enhanced MRI for preclinical evaluation of retinal degeneration treatments. Invest. Ophthalmol. Vis. Sci. 56, 4936–4942. doi: 10.1167/iovs.15-16522
Semple, B. D., Blomgren, K., Gimlin, K., Ferriero, D. M., and Noble-Haeusslein, L. J. (2013). Brain development in rodents and humans: identifying benchmarks of maturation and vulnerability to injury across species. Prog. Neurobiol. 106–107, 1–16. doi: 10.1016/j.pneurobio.2013.04.001
Shazeeb, M. S., and Sotak, C. H. (2012). Dose dependence and temporal evolution of the T1 relaxation time and MRI contrast in the rat brain after subcutaneous injection of manganese chloride. Magn. Reson. Med. 68, 1955–1962. doi: 10.1002/mrm.24184
Silva, A. C., and Bock, N. A. (2008). Manganese-enhanced MRI: an exceptional tool in translational neuroimaging. Schizophr. Bull. 34, 595–604. doi: 10.1093/schbul/sbn056
Silva, A. C., Lee, J. H., Aoki, I., and Koretsky, A. P. (2004). Manganese-enhanced magnetic resonance imaging (MEMRI): methodological and practical considerations. NMR Biomed. 17, 532–543. doi: 10.1002/nbm.945
Singh, R. K., Kooreman, K. M., Babbs, C. F., Fessler, J. F., Salaris, S. C., and Pham, J. (1992). Potential use of simple manganese salts as antioxidant drugs in horses. Am. J. Vet. Res. 53, 1822–1829.
Sloot, W. N., and Gramsbergen, J. B. (1994). Axonal transport of manganese and its relevance to selective neurotoxicity in the rat basal ganglia. Brain Res. 657, 124–132. doi: 10.1016/0006-8993(94)90959-8
Smith, K. D., Kallhoff, V., Zheng, H., and Pautler, R. G. (2007). In vivo axonal transport rates decrease in a mouse model of Alzheimer’s disease. Neuroimage 35, 1401–1408. doi: 10.1016/j.neuroimage.2007.01.046
Sun, N., Cassell, M. D., and Perlman, S. (1996). Anterograde, transneuronal transport of herpes simplex virus type 1 strain H129 in the murine visual system. J. Virol. 70, 5405–5413.
Sun, S. W., Campbell, B., Lunderville, C., Won, E., and Liang, H. F. (2011). Noninvasive topical loading for manganese-enhanced MRI of the mouse visual system. Invest. Ophthalmol. Vis. Sci. 52, 3914–3920. doi: 10.1167/iovs.10-6363
Sun, S. W., Thiel, T., and Liang, H. F. (2012). Impact of repeated topical-loaded manganese-enhanced MRI on the mouse visual system. Invest. Ophthalmol. Vis. Sci. 53, 4699–4709. doi: 10.1167/iovs.12-9715
Sutcliffe, R. P., Lewis, D., Kane, P. A., Portmann, B. C., O’grady, J. G., Karani, J. B., et al. (2011). Manganese-enhanced MRI predicts the histological grade of hepatocellular carcinoma in potential surgical candidates. Clin. Radiol. 66, 237–243. doi: 10.1016/j.crad.2010.08.007
Talley Watts, L., Shen, Q., Deng, S., Chemello, J., and Duong, T. Q. (2015). Manganese-enhanced magnetic resonance imaging of traumatic brain injury. J. Neurotrauma 32, 1001–1010. doi: 10.1089/neu.2014.3737
Tambalo, S., Daducci, A., Fiorini, S., Boschi, F., Mariani, M., Marinone, M., et al. (2009). Experimental protocol for activation-induced manganese-enhanced MRI (AIM-MRI) based on quantitative determination of Mn content in rat brain by fast T1 mapping. Magn. Reson. Med. 62, 1080–1084. doi: 10.1002/mrm.22095
Tang, Z., Wang, J., Xiao, Z., Sun, X., Feng, X., Tang, W., et al. (2017a). Manganese-enhanced magnetic resonance imaging combined with electrophysiology in the evaluation of visual pathway in experimental rat models with monocular blindness. Brain Behav. 7:e00731. doi: 10.1002/brb3.731
Tang, Z., Wu, L., Xiao, Z., Sun, X., Feng, X., Chen, Q., et al. (2017b). Manganese-enhanced MR imaging (MEMRI) combined with electrophysiology in the study of cross-modal plasticity in binocularly blind rats. Int. J. Dev. Neurosci. 61, 12–20. doi: 10.1016/j.ijdevneu.2017.05.002
Thomas, D. L., De Vita, E., Deichmann, R., Turner, R., and Ordidge, R. J. (2005). 3D MDEFT imaging of the human brain at 4.7 T with reduced sensitivity to radiofrequency inhomogeneity. Magn. Reson. Med. 53, 1452–1458. doi: 10.1002/mrm.20482
Thuen, M., Berry, M., Pedersen, T. B., Goa, P. E., Summerfield, M., Haraldseth, O., et al. (2008). Manganese-enhanced MRI of the rat visual pathway: acute neural toxicity, contrast enhancement, axon resolution, axonal transport, and clearance of Mn(2+). J. Magn. Reson. Imaging 28, 855–865. doi: 10.1002/jmri.21504
Thuen, M., Olsen, O., Berry, M., Pedersen, T. B., Kristoffersen, A., Haraldseth, O., et al. (2009). Combination of Mn(2+)-enhanced and diffusion tensor MR imaging gives complementary information about injury and regeneration in the adult rat optic nerve. J. Magn. Reson. Imaging 29, 39–51. doi: 10.1002/jmri.21606
Thuen, M., Singstad, T. E., Pedersen, T. B., Haraldseth, O., Berry, M., Sandvig, A., et al. (2005). Manganese-enhanced MRI of the optic visual pathway and optic nerve injury in adult rats. J. Magn. Reson. Imaging 22, 492–500. doi: 10.1002/jmri.20400
Tillet, Y., Batailler, M., and Thibault, J. (1993). Neuronal projections to the medial preoptic area of the sheep, with special reference to monoaminergic afferents: immunohistochemical and retrograde tract tracing studies. J. Comp. Neurol. 330, 195–220. doi: 10.1002/cne.903300205
Tofts, P. S., Porchia, A., Jin, Y., Roberts, R., and Berkowitz, B. A. (2010). Toward clinical application of manganese-enhanced MRI of retinal function. Brain Res. Bull. 81, 333–338. doi: 10.1016/j.brainresbull.2009.06.002
Van Cruchten, S., Vrolyk, V., Perron Lepage, M. F., Baudon, M., Voute, H., Schoofs, S., et al. (2017). Pre- and postnatal development of the eye: a species comparison. Birth Defects Res. 109, 1540–1567. doi: 10.1002/bdr2.1100
Van der Linden, A., Van Camp, N., Ramos-Cabrer, P., and Hoehn, M. (2007). Current status of functional MRI on small animals: application to physiology, pathophysiology, and cognition. NMR Biomed. 20, 522–545. doi: 10.1002/nbm.1131
van der Merwe, Y., Faust, A. E., Sakalli, E. T., Westrick, C. C., Hussey, G., Conner, I. P., et al. (2019). Matrix-bound nanovesicles prevent ischemia-induced retinal ganglion cell axon degeneration and death and preserve visual function. Sci. Rep. 9:3482. doi: 10.1038/s41598-019-39861-4
Van der Merwe, Y., Yang, X., Ho, L. C., Yu, Y., Chau, Y., Leung, C. K., et al. (2016). Citicoline preserves optic nerve integrity and visuomotor function following chronic intraocular pressure elevation. Invest. Ophthalmol. Vis. Sci. 57, 3788–3800.
Villiger, M., Stoop, R., Vetsch, T., Hohenauer, E., Pini, M., Clarys, P., et al. (2018). Evaluation and review of body fluids saliva, sweat and tear compared to biochemical hydration assessment markers within blood and urine. Eur. J. Clin. Nutr. 72, 69–76. doi: 10.1038/ejcn.2017.136
Vousden, D. A., Cox, E., Allemang-Grand, R., Laliberte, C., Qiu, L. R., Lindenmaier, Z., et al. (2018). Continuous manganese delivery via osmotic pumps for manganese-enhanced mouse MRI does not impair spatial learning but leads to skin ulceration. Neuroimage 173, 411–420. doi: 10.1016/j.neuroimage.2018.02.046
Wang, C., Gordon, P. B., Hustvedt, S. O., Grant, D., Sterud, A. T., Martinsen, I., et al. (1997). MR imaging properties and pharmacokinetics of MnDPDP in healthy volunteers. Acta Radiol. 38, 665–676. doi: 10.3109/02841859709172399
Wang, L., Lu, H., Brown, P. L., Rea, W., Vaupel, B., Yang, Y., et al. (2015). Manganese-enhanced MRI reflects both activity-independent and activity-dependent uptake within the rat habenulomesencephalic pathway. PLoS One 10:e0127773. doi: 10.1371/journal.pone.0127773
Wang, Y., Sun, P., Wang, Q., Trinkaus, K., Schmidt, R. E., Naismith, R. T., et al. (2015). Differentiation and quantification of inflammation, demyelination and axon injury or loss in multiple sclerosis. Brain 138, 1223–1238. doi: 10.1093/brain/awv046
Wang, W. L., Xu, H., Li, Y., Ma, Z. Z., Sun, X. D., and Hu, Y. T. (2016). Dose response and time course of manganese-enhanced magnetic resonance imaging for visual pathway tracing in vivo. Neural Regen. Res. 11, 1185–1190. doi: 10.4103/1673-5374.187065
Wang, X., Qian, J., He, R., Wei, L., Liu, N., Zhang, Z., et al. (2006). Delayed changes in T1-weighted signal intensity in a rat model of 15-minute transient focal ischemia studied by magnetic resonance imaging/spectroscopy and synchrotron radiation X-ray fluorescence. Magn. Reson. Med. 56, 474–480. doi: 10.1002/mrm.20985
Watanabe, T., Frahm, J., and Michaelis, T. (2004). Functional mapping of neural pathways in rodent brain in vivo using manganese-enhanced three-dimensional magnetic resonance imaging. NMR Biomed. 17, 554–568. doi: 10.1002/nbm.937
Watanabe, T., Michaelis, T., and Frahm, J. (2001). Mapping of retinal projections in the living rat using high-resolution 3D gradient-echo MRI with Mn2+-induced contrast. Magn. Reson. Med. 46, 424–429. doi: 10.1002/mrm.1209
Wideroe, M., Brekken, C., Kavelaars, A., Pedersen, T. B., Goa, P. E., Heijnen, C., et al. (2011). Longitudinal manganese-enhanced magnetic resonance imaging of delayed brain damage after hypoxic-ischemic injury in the neonatal rat. Neonatology 100, 363–372. doi: 10.1159/000328705
Wideroe, M., Olsen, O., Pedersen, T. B., Goa, P. E., Kavelaars, A., Heijnen, C., et al. (2009). Manganese-enhanced magnetic resonance imaging of hypoxic-ischemic brain injury in the neonatal rat. Neuroimage 45, 880–890. doi: 10.1016/j.neuroimage.2008.12.007
Xiao, Z., Tang, Z., Wu, L., Feng, X., Sun, X., Tang, W., et al. (2019). Manganese-enhanced magnetic resonance imaging in the whole visual pathway: chemical identification and neurotoxic changes. Acta Radiol. doi: 10.1177/0284185119840227 [Epub ahead of print].
Yamada, M., Momoshima, S., Masutani, Y., Fujiyoshi, K., Abe, O., Nakamura, M., et al. (2008). Diffusion-tensor neuronal fiber tractography and manganese-enhanced MR imaging of primate visual pathway in the common marmoset: preliminary results. Radiology 249, 855–864. doi: 10.1148/radiol.2493072141
Yang, J., Khong, P. L., Wang, Y., Chu, A. C., Ho, S. L., Cheung, P. T., et al. (2008). Manganese-enhanced MRI detection of neurodegeneration in neonatal hypoxic-ischemic cerebral injury. Magn. Reson. Med. 59, 1329–1339. doi: 10.1002/mrm.21484
Yang, J., Li, Q., Wang, M., Cao, X., Ding, Y., Wang, G., et al. (2016). Semiquantitative assessment of optic nerve injury using manganese-enhanced MRI. Jpn. J. Radiol. 34, 356–365. doi: 10.1007/s11604-016-0533-7
Yang, J., and Wu, E. X. (2007). Manganese-enhanced MRI detected the gray matter lesions in the late phase of mild hypoxic-ischemic injury in neonatal rat. Conf. Proc. IEEE Eng. Med. Biol. Soc. 2007, 51–54.
Yang, J., and Wu, E. X. (2008). Detection of cortical gray matter lesion in the late phase of mild hypoxic-ischemic injury by manganese-enhanced MRI. Neuroimage 39, 669–679. doi: 10.1016/j.neuroimage.2007.09.009
Yang, J., and Wu, E. X. (2009). Manganese-enhanced MRI of hypoxic-ischemic brain injuries using Mn-DPDP. Conf. Proc. IEEE Eng. Med. Biol. Soc. 2009, 4775–4778. doi: 10.1109/IEMBS.2009.5334210
Yang, X. L., Van Der Merwe, Y., Sims, J., Parra, C., Ho, L. C., Schuman, J. S., et al. (2018). Age-related changes in eye, brain and visuomotor behavior in the DBA/2J mouse model of chronic glaucoma. Sci. Rep. 8:4643. doi: 10.1038/s41598-018-22850-4
Yu, X., Wadghiri, Y. Z., Sanes, D. H., and Turnbull, D. H. (2005). In vivo auditory brain mapping in mice with Mn-enhanced MRI. Nat. Neurosci. 8, 961–968. doi: 10.1038/nn1477
Yun, S. P., Kam, T. I., Panicker, N., Kim, S., Oh, Y., Park, J. S., et al. (2018). Block of A1 astrocyte conversion by microglia is neuroprotective in models of Parkinson’s disease. Nat. Med. 24, 931–938. doi: 10.1038/s41591-018-0051-5
Zhang, J., Hu, Y. T., Sheng, X. L., Li, Y., Ren, J., and Ma, Z. Z. (2010). [Evaluation of toxicity of manganese ions to rabbit retina]. Zhonghua Yan Ke Za Zhi 46, 597–603.
Keywords: visual pathway, manganese-enhanced magnetic resonance imaging, eye, neuroarchitecture, neuronal tract tracing, neuronal activity, glial activity
Citation: Deng W, Faiq MA, Liu C, Adi V and Chan KC (2019) Applications of Manganese-Enhanced Magnetic Resonance Imaging in Ophthalmology and Visual Neuroscience. Front. Neural Circuits 13:35. doi: 10.3389/fncir.2019.00035
Received: 16 February 2019; Accepted: 26 April 2019;
Published: 14 May 2019.
Edited by:
Keigo Hikishima, Okinawa Institute of Science and Technology Graduate University, JapanReviewed by:
Tsen-Hsuan (Abby) Lin, Washington University School of Medicine in St. Louis, United StatesGovind Nair, National Institutes of Health (NIH), United States
Copyright © 2019 Deng, Faiq, Liu, Adi and Chan. This is an open-access article distributed under the terms of the Creative Commons Attribution License (CC BY). The use, distribution or reproduction in other forums is permitted, provided the original author(s) and the copyright owner(s) are credited and that the original publication in this journal is cited, in accordance with accepted academic practice. No use, distribution or reproduction is permitted which does not comply with these terms.
*Correspondence: Kevin C. Chan, Y2h1ZW53aW5nLmNoYW5AZnVsYnJpZ2h0bWFpbC5vcmc=
†These authors have contributed equally to this work