
 Ruth Benavides-Piccione2

- 1 Centre for Cognitive Neuroscience, Sunshine Coast, QLD, Australia
- 2 Laboratorio de Circuitos Corticales (CTB), Universidad Politécnica de Madrid, Instituto Cajal (CSIC), Centro de Investigación Biomédica en Red sobre Enfermedades Neurodegenerativas (CIBERNED), Madrid, Spain
- 3 School of Anatomical Sciences, Faculty of Health Sciences, University of the Witwatersrand, Johannesburg, South Africa
The most ubiquitous neuron in the cerebral cortex, the pyramidal cell, is characterized by markedly different dendritic structure among different cortical areas. The complex pyramidal cell phenotype in granular prefrontal cortex (gPFC) of higher primates endows specific biophysical properties and patterns of connectivity, which differ from those in other cortical regions. However, within the gPFC, data have been sampled from only a select few cortical areas. The gPFC of species such as human and macaque monkey includes more than 10 cortical areas. It remains unknown as to what degree pyramidal cell structure may vary among these cortical areas. Here we undertook a survey of pyramidal cells in the dorsolateral, medial, and orbital gPFC of cercopithecid primates. We found marked heterogeneity in pyramidal cell structure within and between these regions. Moreover, trends for gradients in neuronal complexity varied among species. As the structure of neurons determines their computational abilities, memory storage capacity and connectivity, we propose that these specializations in the pyramidal cell phenotype are an important determinant of species-specific executive cortical functions in primates.
Introduction
Pyramidal cell structure is remarkably heterogeneous in the primate cerebral cortex. Estimates of the total number of spines (putative excitatory inputs) in the dendritic trees of pyramidal cells reveal more than a 30-fold difference between populations of cells sampled in different cortical areas (Elston et al., 2001, 2005c). Moreover, there are systematic trends for increasingly more complex phenotypes through a series of functionally related cortical areas. For example, neurons become progressively larger, more branched and more spinous with anterior progression through the dorsal and ventral visual pathways (Elston and Rosa, 1997, 1998, 2000; Elston et al., 1999a, 2005b,d,e,h; Elston, 2003b). There is a progressive systematic increase in the complexity of pyramidal cell structure through somatosensory areas 3b, 1, 2, 5, and 7 (Elston and Rockland, 2002; Elston et al., 2005g,j), which continues with anterior progression through cingulate areas 23 and 24 to granular prefrontal cortex (gPFC; Elston et al., 2001, 2005a,f,i).
Pyramidal cells are the most common neuron in the cerebral cortex. They are the major source of intrinsic excitatory cortical synapses, and their dendritic spines are the main postsynaptic target of excitatory synapses. Moreover, they form most intra-areal projections and nearly all interareal projections (DeFelipe and Fariñas, 1992). Therefore, they are considered the principal neuronal building blocks of the cerebral cortex. Thus, specializations in their structure are likely to influence cortical function at the subcellular, cellular, and systems levels (Elston, 2002, 2003a; Jacobs and Scheibel, 2002; Passingham et al., 2002; Roth and Dicke, 2005; Treves, 2005). More specifically, complexity in dendritic structure determines their biophysical properties thus influencing their functional capacity and potential for plastic changes (Koch, 1999; Mel, 1999; Jan and Jan, 2001; Chklovskii et al., 2004; London and Häusser, 2005). These specializations in neuron structure in the gPFC are thought to subserve executive functions (Funahashi and Kubota, 1994; Courtney et al., 1998; Duncan and Owen, 2000; Goldman-Rakic, 2000; Miller, 2000; Rolls, 2000; Fuster, 2001; Wang, 2001; Treves, 2005); however, pyramidal cell structure has been quantified in only few of the many cortical areas within gPFC.
Broadly speaking, prefrontal cortex has been divided into the lateral, medial, and orbital regions, which are believed to be involved in different types of processing (Goldman-Rakic, 1987, 2000; Funahashi and Kubota, 1994; Fuster, 1997, 2002; Cavada et al., 2000; Miller, 2000; Passingham et al., 2000; Petrides, 2000; Roberts and Wallis, 2000; Rolls, 2000; Funahashi and Takeda, 2002). Various gradients in patterns of connectivity and function have been reported within these three regions (Petrides, 1987, 1991; Wilson et al., 1993; ó Scalaidhe et al., 1997; Hirsch et al., 2001; Denys et al., 2004; Barbas et al., 2005; Hagler and Sereno, 2006; Nelissen et al., 2005; Noppeney et al., 2005). However, there are no standardized quantitative data on pyramidal cell structure within these different gradients in the gPFC. Here we studied cells in multiple cortical areas in the lateral, medial, and orbital gPFC of the macaque monkey to enable comparisons between these regions. In particular, we injected pyramidal cells in layer III of areas 9d, 10, 12vl, 13, and 46vr.
Recently we have demonstrated that pyramidal cells have markedly different dendritic structure in the gPFC of the macaque monkey, vervet monkey, and baboon, and that there appears to be a parallel trend for increasing size of the gPFC and increasingly more spinous pyramidal cells (Elston et al., 2006). However, it remains to be determined whether this trend is common to all cortical areas within the gPFC. To investigate this we studied layer III pyramidal cell structure in lateral, medial, and orbital gPFC of the vervet monkey and baboon for comparison with those studied in the macaque monkey. These species were included as they represented closely related primates of similar and different brain size (Gould, 2002). We found that, in general, pyramidal cells in the gPFC were characterized by highly complex structure as compared with those in other cortical regions. In addition we found regional variation in pyramidal cell structure within the gPFC in all three species; however, the topography of the gradients differed between species. We also found marked interindividual variation in pyramidal cell structure in the gPFC in all three species of an order not observed in visual, somatosensory, motor, or cingulate cortex.
Materials and Methods
Two adult macaque monkeys (Macaca fascicularis; 4.5 years old; MF1 ≈ 5 kg, MF2 ≈ 4.5 kg), two adult vervet monkeys (Cercopithecus pygerythrus; age unknown; VM1 = 6.1 kg, VM2 = 5.5 kg), and two adult baboons (Papio ursinus; age unknown; B1 = 23.1 kg, B2 = 23.1 kg) were used in the present study. Based on weight, musculature and appearence of the vervet monkeys and baboons we estimate that they were mature but not adolescent nor elderly. All animals were males. All tissue was sampled from the left hemisphere. Macaque tissue was taken from the anterior lateral portion of the superior frontal gyrus (corresponding to Walker’s and Petrides and Pandya’s area 9 or Preuss and Goldman-Rakic’s area 9d) (Walker, 1940; Preuss and Goldman-Raki, 1991a,b,c; Petrides and Pandya, 2001), the anterior medial portion of the superior frontal gyrus (area 9m of Preuss and Goldman-Rakic, corresponding to Walker’s area 9), the medial frontal gyrus (corresponding to Walker’s and Petrides and Pandya’s area 46 or Preuss and Goldman-Rakic’s area 46vr), the inferior frontal gyrus (corresponding to Walker’s area 46, Petrides and Pandya’s area 45A or Preuss and Goldman-Rakic’s area 12vl), the medial portion of the frontal pole anterior to the rostral sulcus (corresponding to area 10 of Walker, Preuss and Goldman-Rakic and Petrides and Pandya), the end of the orbital cortex between the medial orbital sulcus and the lateral orbital sulcus, inferior to the intermediate orbital sulcus (area 12orb of Preuss and Goldman-Rakic, corresponding to Walker’s area 13 and Petrides and Pandya’s area 14) of the left hemisphere (Figure 2). Likewise, tissue from the vervet monkey and baboon was sampled from dorsolateral, medial, and orbital gPFC (Figure 2). Specifically, prefrontal areas 9d, 10, 46d, 12vl, and 13 were studied in the baboon and prefrontal areas 9m, 9d, 10, 13, and cingulate area 32, were studied in the vervet monkey. The homology of the specific areas included for analyses remains to be determined.
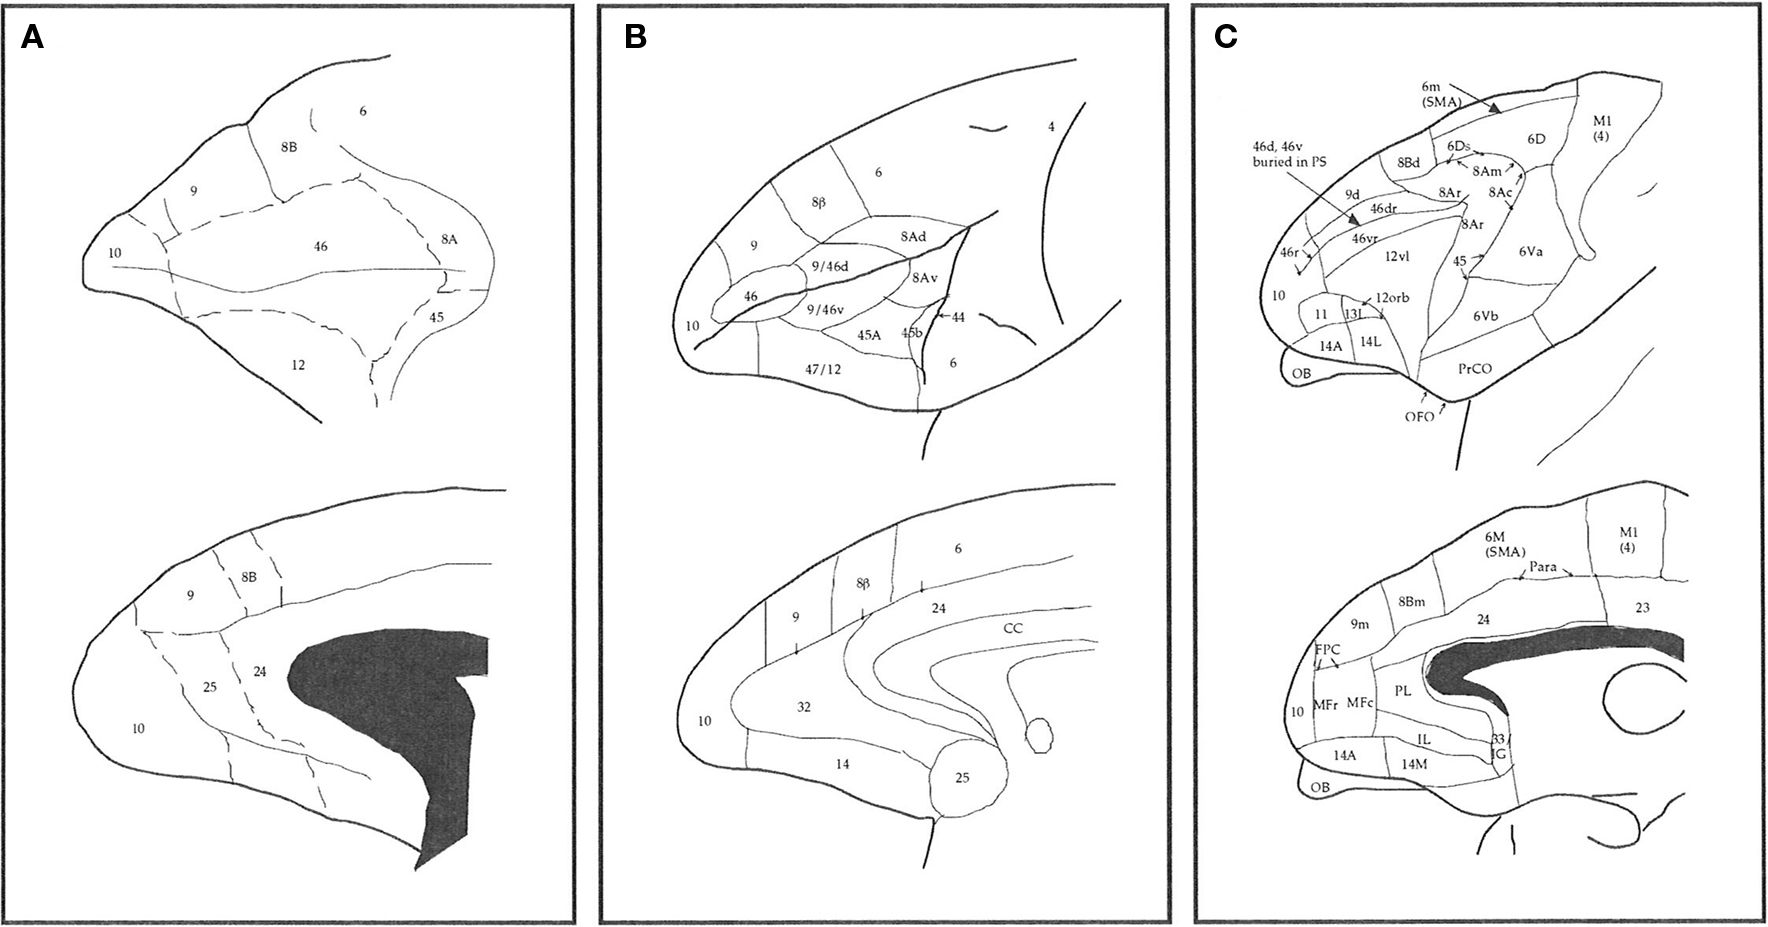
Figure 1. Schematic illustrating some different interpretations of the number, size, and location of cortical areas in prefrontal cortex of the macaque monkey. (A) Modified from Walker (1940), (B) Petrides and Pandya (1999) and (C) Preuss and Goldman-Rakic (1991a).
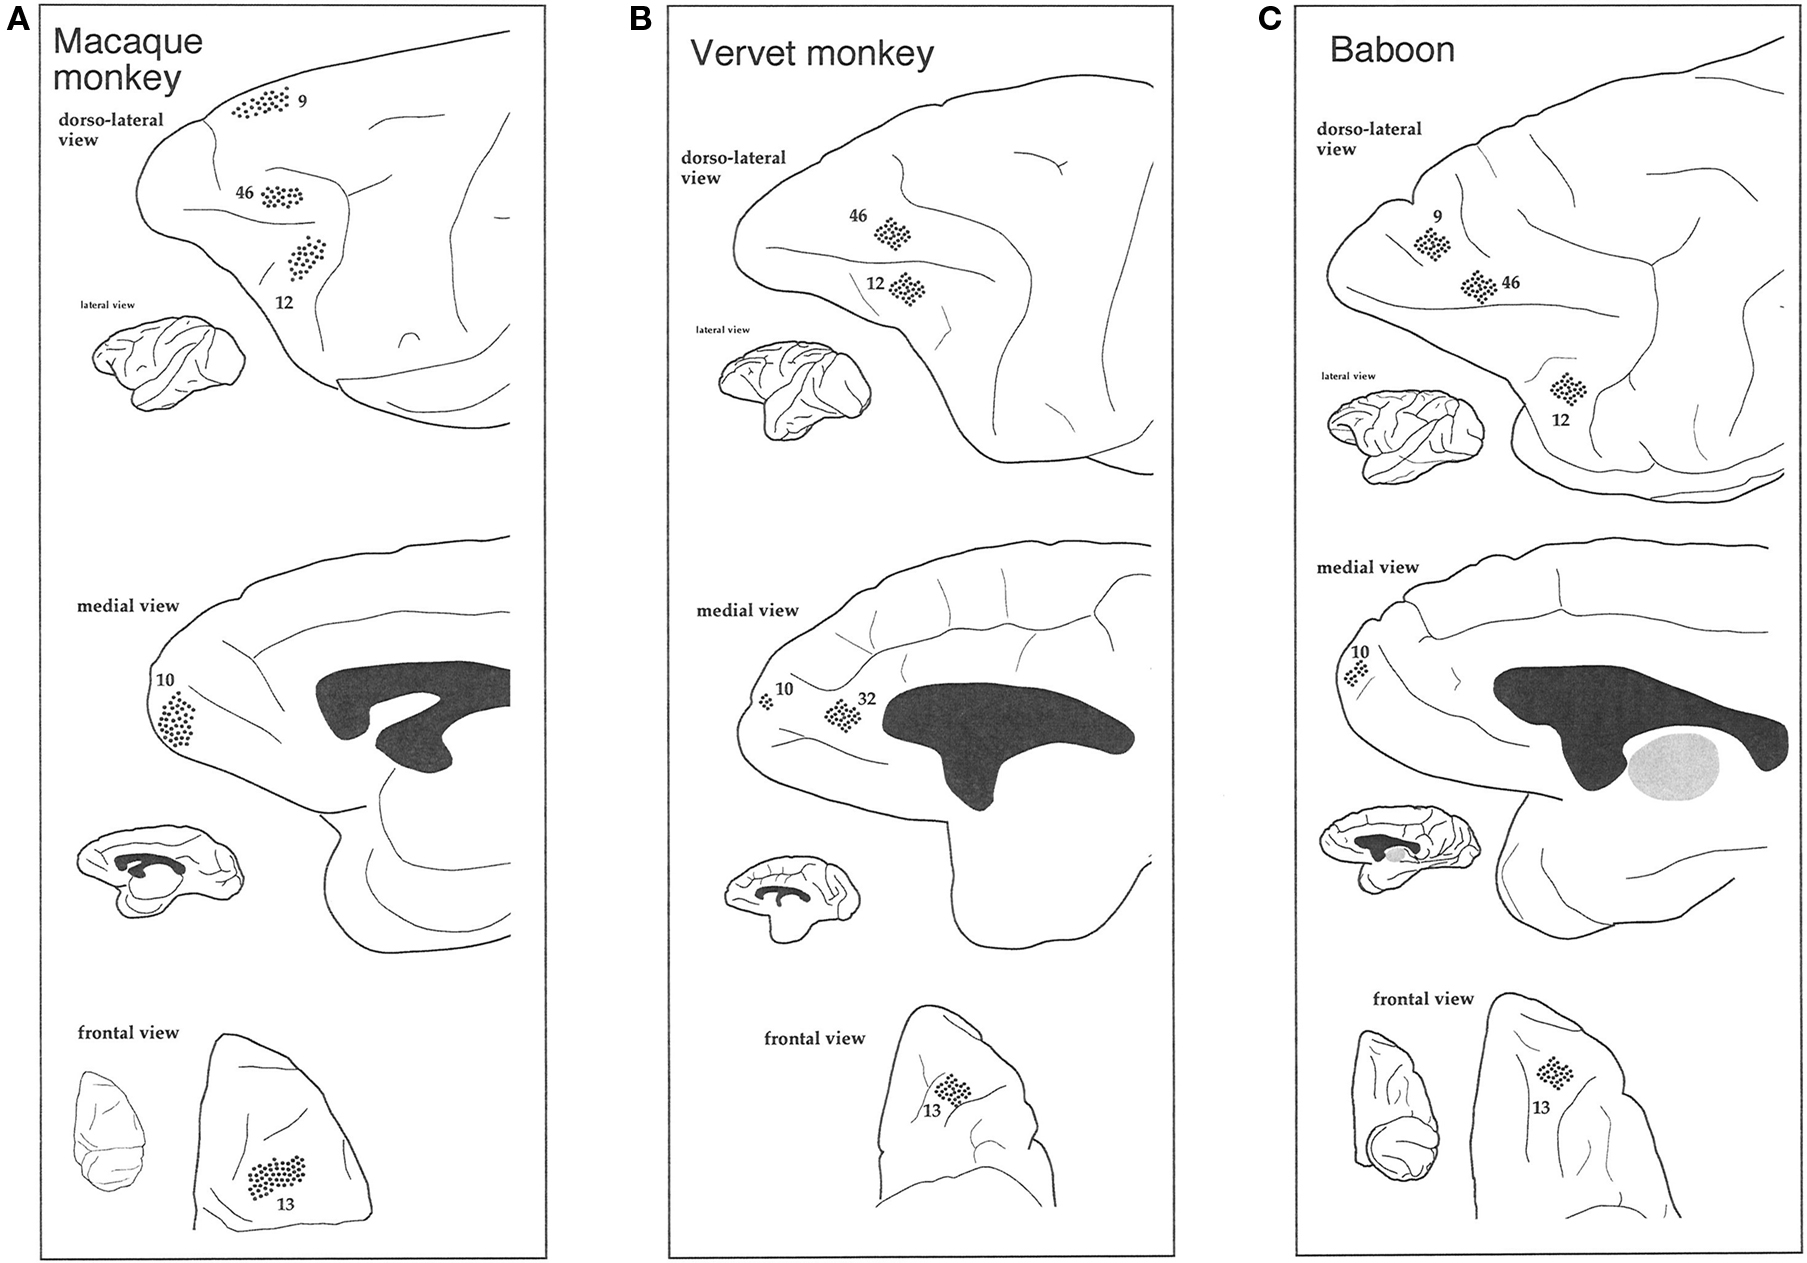
Figure 2. Schematic illustrating where neurons were sampled (dots) in the dorsolateral, medial, and orbital prefrontal cortex of the macaque monkey (A), vervet monkey (B), and baboon (C).
Methodology used in the present study has been outlined in detail in previous studies (Buhl and Schlote, 1987; Elston and Rosa, 1997; Elston, 2001). Briefly, the animals were deeply anesthetized by intramuscular injection of a mixture of ketamine hydrochloride (100 mg/ml) and xylazine (50 mg/ml) (2:1, 0.1 ml/kg), then an i.v. dose of sodium pentabarbitone (200 mg/kg) in accordance with protocols approved by the University of Queensland and University of the Witwatersrand Animal Ethics Committees and regulations for the care and use of animals set out by the NIH (publication No. 86-23, revised 1985). The animals were then perfused intracardially and the brain removed. The white matter was trimmed from the blocks and the remaining gray matter was “unfolded” and postfixed overnight between glass slides in a solution of 4% paraformaldehyde in 0.1 M phosphate buffer (PB). Serial thick sections (250 μm) were cut tangential to the cortical surface with the aid of a vibratome. Individual sections were incubated in a solution containing 10−5 mol/L of the fluorescent dye 4′,6-diamidino-2-phenylindole (DAPI; Sigma D9542, St Louis, USA) in PB at room temperature for approximately 10 min and mounted between Millipore filters (AABG02500, Bedford, USA). The slice preparation was then mounted in a perspex dish on a Zeiss fixed stage microscope and the preparation visualized with UV excitation (341–343 nm).
In the present study we focused on cells at the base of layer III, enabling comparison with data obtained at the base of layer III in visual, somatosensory, motor, and cingulate cortex of these an other species. Layer III was easily identified in the DAPI-labeled sections immediately above the neuron-dense granular layer. Even in tangential sections it is easy to distinguish the transition from layer III to layer IV due to the change in density and size of somata (see Figure 3 of Elston and Rosa, 1997). Neurons were injected in tangential sections so as to be able to reconstruct the entire basal dendritic tree. Such an approach has been central to the demonstration of regional and species specializations in pyramidal cell dendritic structure as the entire tangential extent of the basal dendritic tree is revealed, unlike in most previous studies in transverse sections in which many of the basal dendrites are truncated thus selecting for uniformity (Figure 3). In addition, by injecting neurons in the tangential plane aspects of their structure can be related directly with features reported elsewhere such as intrinsic axon patches and receptive fields (Levitt et al., 1993; Kritzer and Goldman-Rakic, 1995; Pucak et al., 1996; Melchitzky et al., 1998, 2001; González-Burgos et al., 2000). However, unfortunately, it is difficult to inject large numbers of cells under visual control in sections thick enough to contain the entire dendritic arborization (both apical and basal). Thus, we have focused on one dendritic “compartment” of a select group of pyramidal cells (those in layer III). It remains to be determined to what extent regional and species variation in the basal dendritic trees reflects any potential variation in their apical dendrites, and how this may differ from patterns of connectivity in other cortical areas/species (Binzegger et al., 2004).
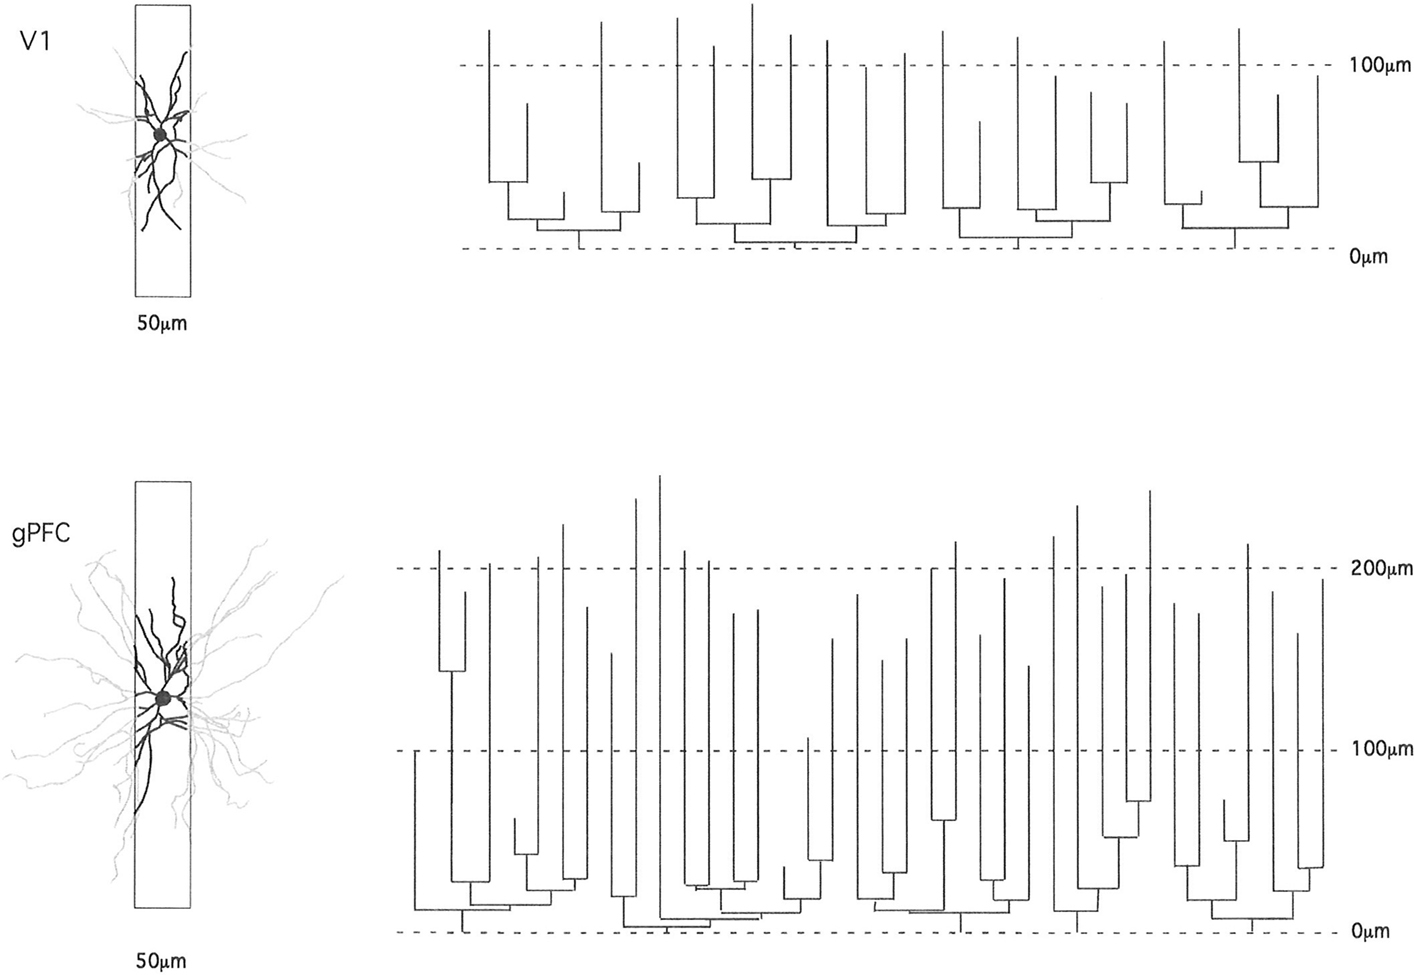
Figure 3. Schematic illustrating how the study of pyramidal cell morphology in the transverse plane may bias for uniformity in structure. Illustrated are two cells sampled from the primary visual area (V1) and granular prefrontal cortex (gPFC) of the macaque monkey. At left are the basal dendritic trees of the two cells as seen in the tangential plane. In black is the part of the dendritic tree that would be seen in a 50-μm transverse section (of the type used in many Golgi studies). The portion of the dendrites extending beyond the section is illustrated in gray. Note the relative similarity in structure of the part of the dendritic tree revealed in the 50-μm transverse sections. At right are illustrated the dendrograms of each of the two cells, which resulted from reconstruction of the complete basal dendritic tree as seen in the tangential plane. Based on our observations, transverse sections would have to be of the order of 1 mm thick to include all dendrites (e.g., human temporal lobe; Elston et al., 2001).
4′,6-Diamidino-2-phenylindole(DAPI)-labeled neurons were injected under visual guidance with continuous current (up to 100 nA). Cell bodies were impaled not at the cut surface of the sections, but some tens of micrometers below the surface so that pyramidal neurons could be identified by the presence of the proximal part of their apical dendrite. Once a suitable number of neurons had been injected, the slice was processed for a light-stable reaction product (see Elston and Rosa, 1997). Briefly, the sections were processed in a solution containing 1:400,000 anti-Lucifer Yellow in stock solution [2% bovine serum albumin (Sigma A3425), 1% Triton X-100 (BDH 30632), and 5% sucrose in PB] for 5 days at room temperature, washed three times in PB, then incubated in biotinylated anti-rabbit (1:200 Amersham RPN 1004) in stock solution for 2 h, washed another three times before being processed for a further 2 h in streptavidin biotin horseradish peroxidase (1:200, Amersham RPN1051) in PB. 3,3′-diamino-benzidine (DAB; Sigma D 8001; 1:200 in PB) was used as the chromogen (Figure 4).
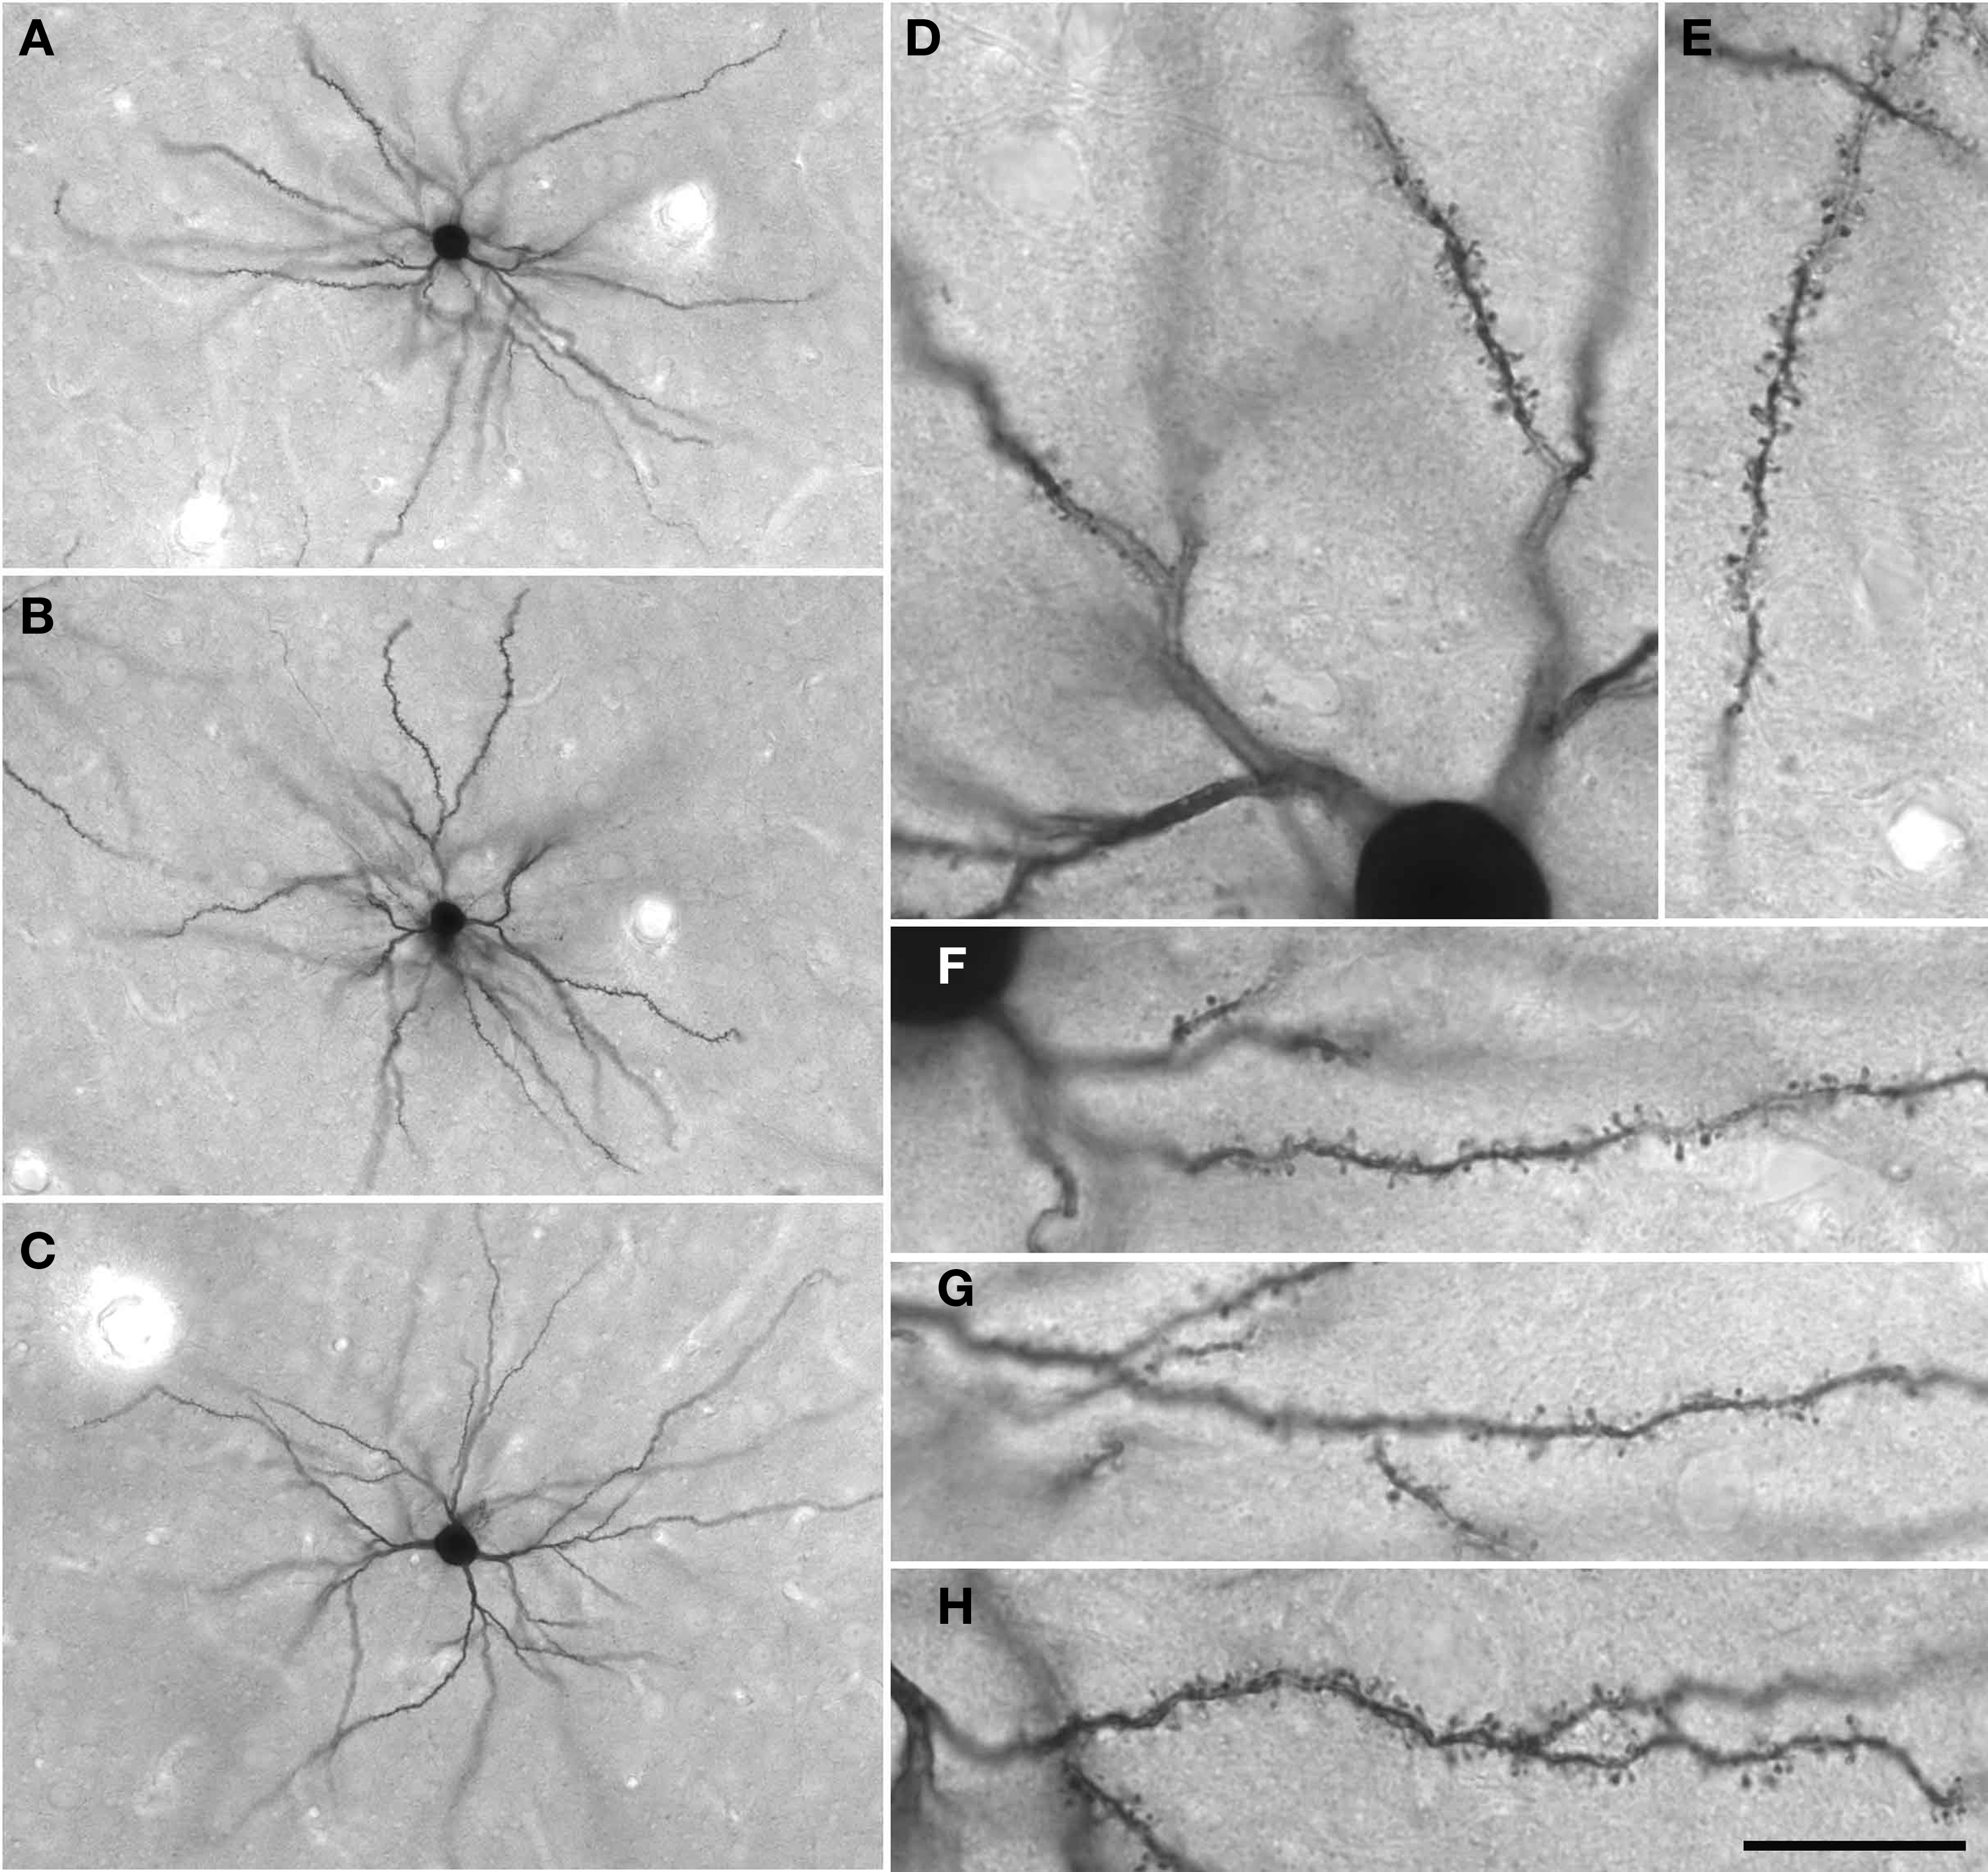
Figure 4. (A–C) Low power photomicrographs of Lucifer Yellow-injected layer III pyramidal cells in tangential sections taken from the granular prefrontal cortex of the macaque monkey (area 12vl). (D–H) Higher power photomicrographs of these same neurons as viewed through a ×100 oil-immersion Zeiss objective, revealing aspects of their fine structure including dendritic spines. Scale bar = 100 μm in (A–C) and 20 μm in (D–H).
Cells were only included for analysis if they had an unambiguous apical dendrite, had their complete basal dendritic tree contained within the section, and were well filled. We focused our analyses on the basal dendritic trees of supragranular pyramidal cells for several reasons. Of particular interest to us are horizontally projecting intrinsic axonal patches that arise from these cells and project to the basal dendritic trees of neighboring pyramidal cells (Gilbert and Wiesel, 1979, 1983; Rockland and Lund, 1982, 1983; Rockland et al., 1982; Livingstone and Hubel, 1984; Martin and Whitteridge, 1984; Rockland, 1985; Kisvárday et al., 1986; McGuire et al., 1991; Fujita and Fujita, 1996). As many as 80–95% of the horizontal projection synapses of individual supragranular pyramidal cells are formed with other nearby supragranular pyramidal cells (Kisvárday et al., 1986; McGuire et al., 1991) in reciprocally connected patches (Kisvárday and Eysel, 1992). These reciprocal patches have been reported in many different cortical areas in the primate brain, and are believed to provide an anatomical basis for functional domains among the patches (Mitchison and Crick, 1982; Matsubara et al., 1985; T’so et al., 1986; T’so and Gilbert, 1988; Gilbert and Wiesel, 1989; Malach et al., 1993; Malonek et al., 1994). By focusing on the basal dendritic trees of layer III pyramidal cells we are revealing relevant information on the connectivity of these intrinsic circuits and how they may vary among cortical areas. Moreover, we have focused on these dendritic trees here so as to be able to make direct comparisons with our previous data sampled from the basal dendritic trees of layer III pyramidal cells in visual, somatosensory, auditory, motor, and cingulate cortex of thee same species.
Neurons were drawn, and their dendritic field areas determined with NIH Image by tracing a convex hull around the outermost distal dendrites (see Elston and Rosa, 1997). Sholl (1953) analyses were performed on the 2D drawings, with concentric circles of increasing radii (25 μm increments) centered on the cell body. Spine densities were calculated by drawing the entire dendrite of randomly selected cells with the aid of a Zeiss ×100 oil-immersion objective and counting the number of spines per 10 μm segment from the cell body to the distal tip (Eayrs and Goodhead, 1959; Valverde, 1967). Horizontally projecting dendrites were selected to avoid trigonometric error. All spines were drawn and no distinction was made between different spine types. In Golgi studies it is common to apply correction factors when attempting to quantify spine density as spines issuing from under the dendrite may be obscured (Feldman and Peters, 1979). No such correction factors were applied here as the DAB reaction product is more transparent than the Golgi precipitate and allows direct visualization of spines through the dendrite. Furthermore, the basal dendrites have a diameter smaller than the neck length of many spines, and any possible error that may arise because some populations of cells have thicker basal dendrites than others would only reduce the extent of differences we report for cells among cortical areas (i.e., more spinous cells have, on average, thicker parent dendrites than the less spinous cells). Estimates of the total number of spines found within the basal dendritic arbor of the “average” cell in each cortical area were made by summing the product of the average number of dendrites by the average spine density for corresponding segments along the dendrites – from the cell body to the distal tips of the dendrites (Elston, 2001). Cell bodies were drawn by tracing the outermost perimeter, excluding the proximal basal dendrites, while viewed through a Zeiss ×100 oil objective and their areas were determined with NIH Image. Statistical comparisons were made using SPSS (SPSS Inc., IL, USA). One-way ANOVAS were used where there was a single data point for each cell, such as the size of the cell bodies of the size of the dendritic trees. When there were multiple data points for each cell, e.g., branching structure or spine density sampled radially from cell body to the distal tips of the dendrites, repeated measures ANOVAs were used.
Results
A total of 854 layer III pyramidal cells were included for analyses as they satisfied the criteria for inclusion (see Materials and Methods). Over 80,000 individual dendritic spines were drawn and tallied. Data on the size, branching complexity, and spine density of the basal dendritic trees are reported for each cortical area of both animals studied from each of the three species, as are data on cell body size and our estimates of the number of spines in the basal dendritic tree of the “average” neuron in each area.
Macaque Monkeys (Areas 9d, 10, 12vl, 13, and 46vr)
Basal dendritic field areas
Qualitative observation revealed variation in the size of the dendritic trees of pyramidal cells among prefrontal areas 9d, 10, 12vl, 13, and 46vr in both MF1 and MF2 (Figure 5A; Table 1). Statistical analysis (one-way ANOVAs) revealed these differences to be significant (p < 0.05) in both MF1 (F(4) = 8.92) and MF2 (F(4) = 15.33). Post hoc Scheffe tests revealed 3 of 10 possible between-area comparisons to be significantly different in MF1 and 4 of 10 in MF2 (Table 2).
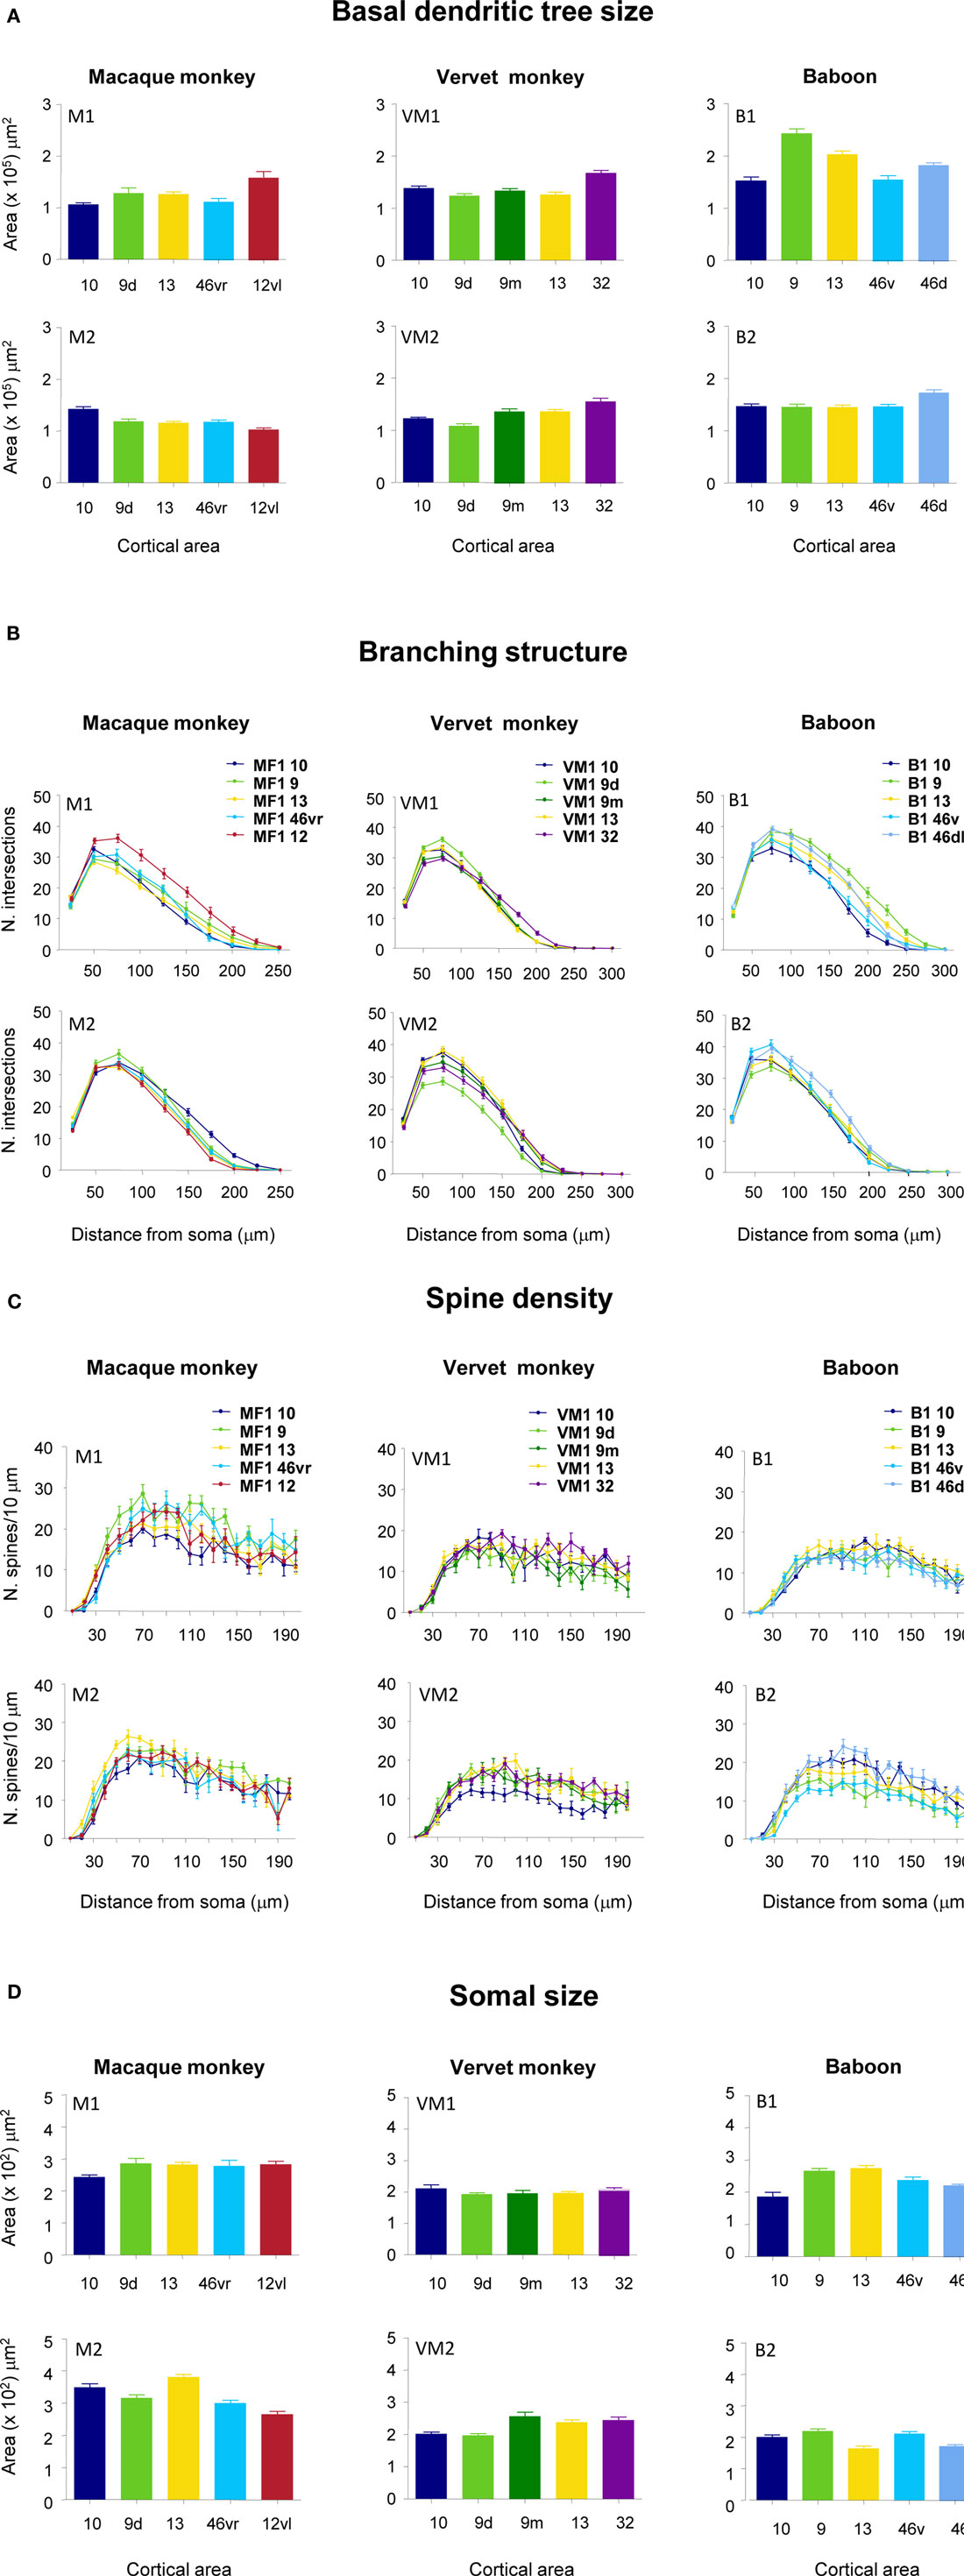
Figure 5. Frequency histograms and plots of the (A) size, (B) branching patterns, (C) spine density of the basal dendritic trees, and (D) cell body size, of layer III pyramidal neurons sampled in granular prefrontal cortex of the macaque monkey (M1 and M2), vervet monkey (VM1 and VM2) and baboon (B1 and B2). Error bars = standard errors.
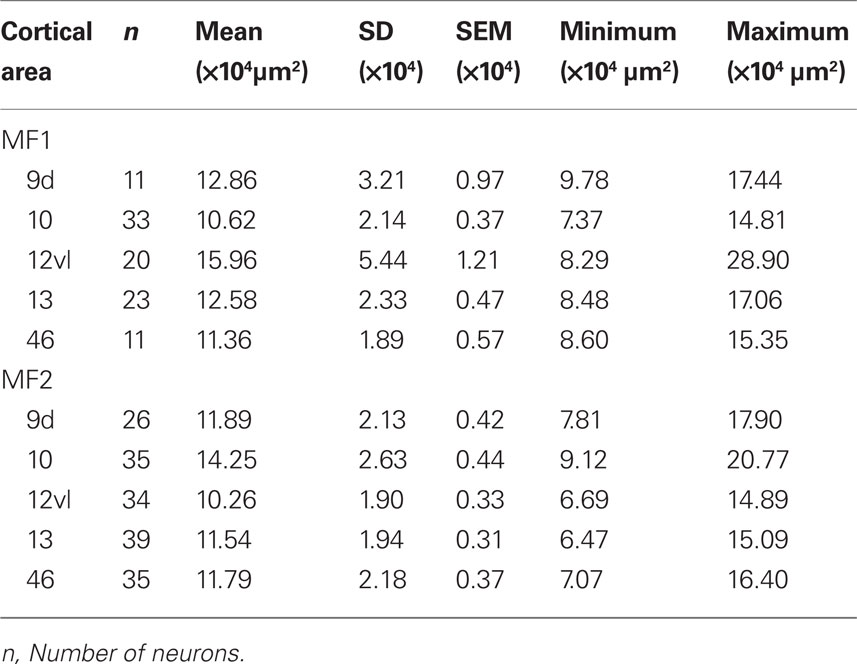
Table 1. Number, size [mean, standard deviation (SD), standard error of the mean (SEM), minimum, and maximum] of the basal dendritic trees of layer III pyramidal cells in cortical areas 9, 10, 12vl, 13, and 46 in the prefrontal cortex of the macaque monkey.
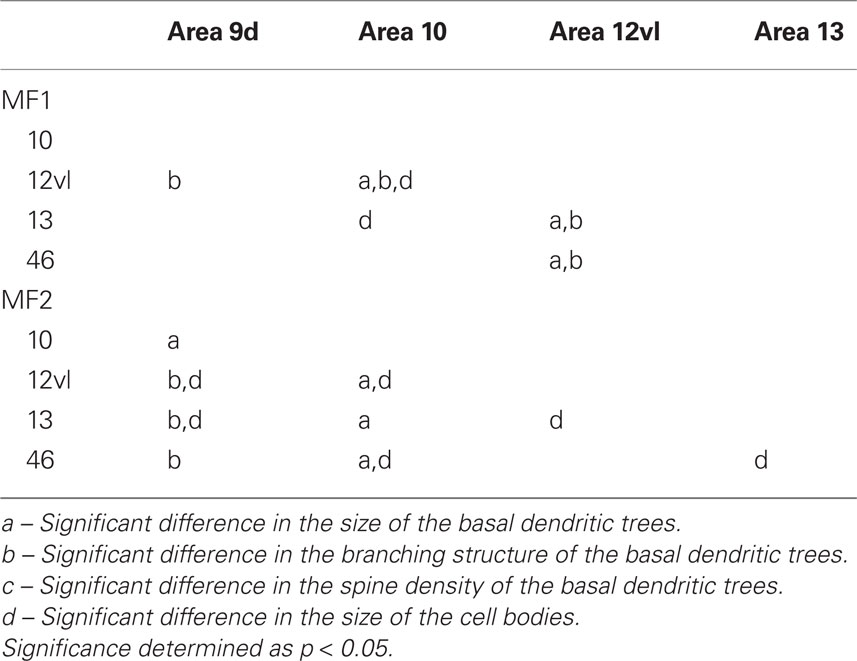
Table 2. Summary of post hoc pair-wise Scheffe comparisons of morphological parameters of neurons in the gPFC of the macaque monkey.
Branching patterns of the basal dendritic arbors
Plots of the branching patterns of the basal dendritic arbors of pyramidal neurons, as determined by Sholl analysis, are shown in Figure 5B. From the figure it can be seen that the branching structure of cells in prefrontal areas 9d, 10, 12vl, 13, and 46vr was not uniform. Repeated measures ANOVAs (5 × 12 design) revealed significant differences (p < 0.05) in the branching patterns in both MF1 (F(1,4) = 11.27) and MF2 (F(1,4) = 6.78). Post hoc Scheffe tests revealed 4 of 10 possible between-area comparisons to be significantly different in MF1 and 3 of 10 in MF2 (Table 2).
Spine densities of the basal dendrites
From Figure 5C, it can be seen that plots of the average spine density, as a function of distance from the soma to the distal tips, were similar among cortical areas. Repeated measures ANOVAs revealed no significant difference in spine density for neurons in either MF1 (F(1,4) = 1.00) and MF2 (F(1,4) = 2.58). The total number of dendritic spines in the basal dendritic arbor of the “average” pyramidal neuron in each area was calculated by combining data from the Sholl analyses with that of spine densities (see Materials and Methods). These estimates revealed up to >50% difference in of the number of spines in the “average” neuron among prefrontal areas (Figure 6; Table 3).
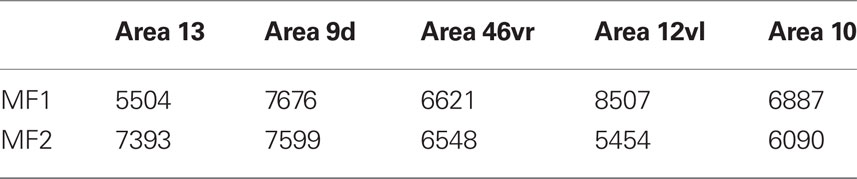
Table 3. Estimates of the total number of spines in the basal dendritic tree of the “average” layer III pyramidal cell in prefrontal areas of the macaque monkey.
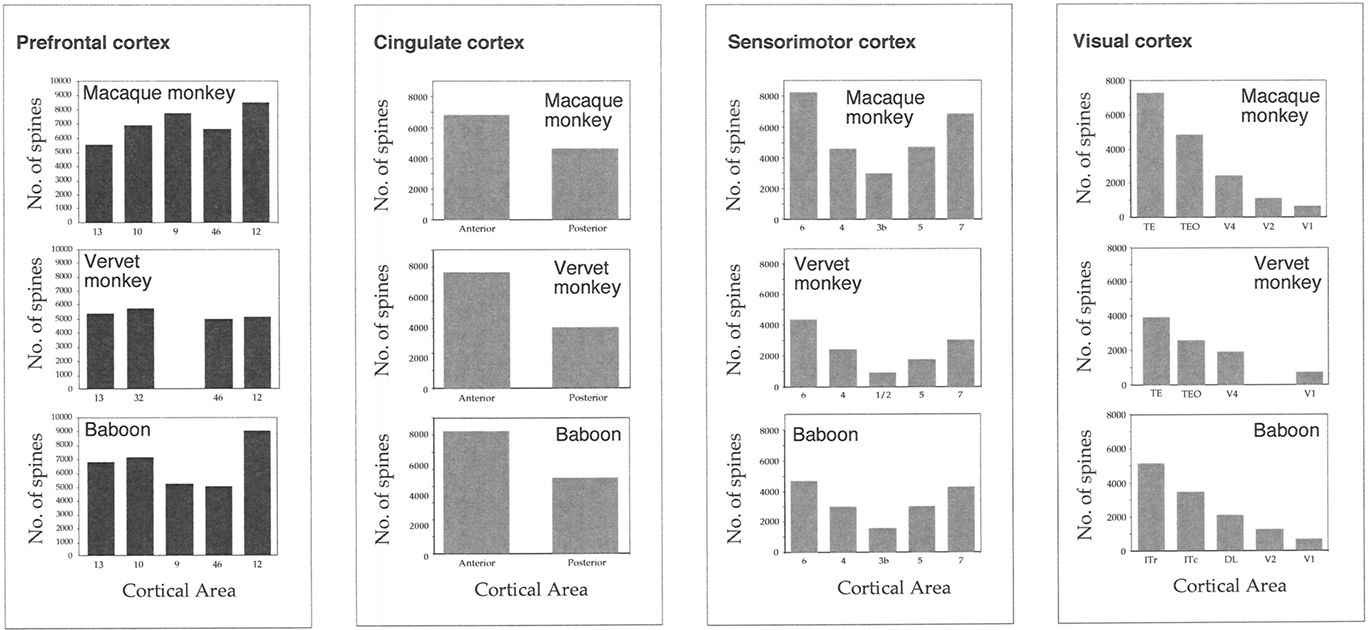
Figure 6. Plots of our estimates of the total number of dendritic spines in the basal dendritic tree of the “average” layer III pyramidal cell in visual, sensorimotor, cingulate, and prefrontal cortex of the macaque monkey, vervet monkey, and baboon. Note the remarkable similarity in the trends of these estimates in visual, sensorimotor, and limbic cortex of both animals. Note, however, the differences in these estimates in the granular prefrontal cortex among species. V1 = primary visual, V2 = second visual, V4 = fourth visual, 3b = primary somatosensory, 1/2/5/7 = somatosensory association, 4 = primary motor, 6 = premotor, 23 = posterior cingulate, 24 = anterior cingulate, 9/10/12/13/46 = prefrontal areas, 32 = cingulate.
Somal areas
Individual cell bodies were drawn, in the plane tangential to the cortical layers, and plotted in Figure 5D (see also Table 4). One-way ANOVAs revealed significant differences in cell body size between neurons in the different cortical areas in both MF1 (F(4) = 5.10) and MF2 (F(4) = 26.13). Post hoc Scheffe tests revealed 2 of 10 possible between-area comparisons to be significantly different in MF1 and 6 of 10 in MF2 (Table 2).
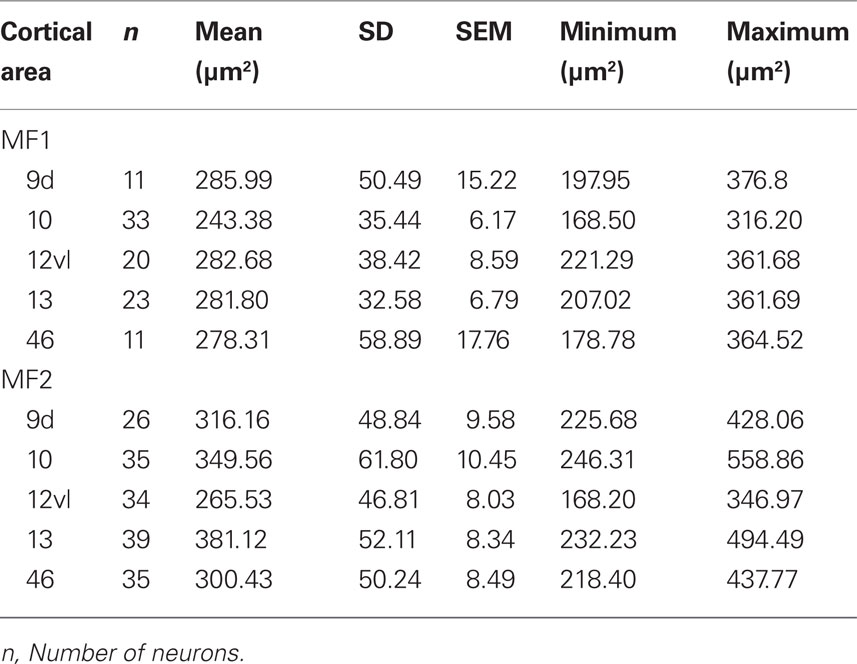
Table 4. Number, size [mean, standard deviation (SD), standard error of the mean (SEM), minimum, and maximum] of the somata of layer III pyramidal cells (in the tangential plane) in cortical areas 9, 10, 12vl, 13, and 46 in the prefrontal cortex of the macaque monkey.
Vervet Monkeys (Areas 9d, 9m, 10 and 13, and 32)
Basal dendritic field areas
Qualitative observation of pyramidal cells revealed that cells in cingulate area 32 were larger than those in prefrontal areas 9d, 9m, 10 and 13 in both VM1 and VM2 (Figure 5A; Table 5). Statistical analysis (one-way ANOVAs) revealed a significant difference (p < 0.05) in the size of the dendritic trees of neurons in both VM1 (F(4) = 16.81) and VM2 (F(4) = 18.14). Post hoc Scheffe tests revealed that cells in cingulate area 32 had significantly larger dendritic trees than those in prefrontal areas in both VM1 and VM2, except for area 9m in VM2. None of the six possible pair-wise comparisons between prefrontal areas were significantly different in VM1, two of the six pair-wise comparisons between prefrontal areas were significantly different in VM2 (Table 6).
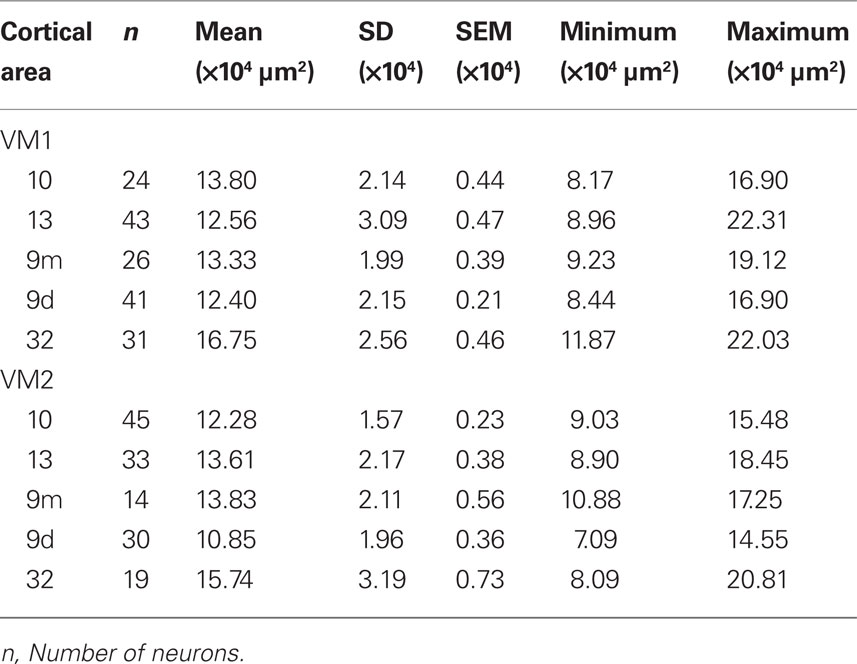
Table 5. Number, size [mean, standard deviation (SD), standard error of the mean (SEM), minimum, and maximum] of the basal dendritic trees of layer III pyramidal cells in cortical areas 10, 13, 9 (medial and dorsal), and 32 in the vervet monkey.
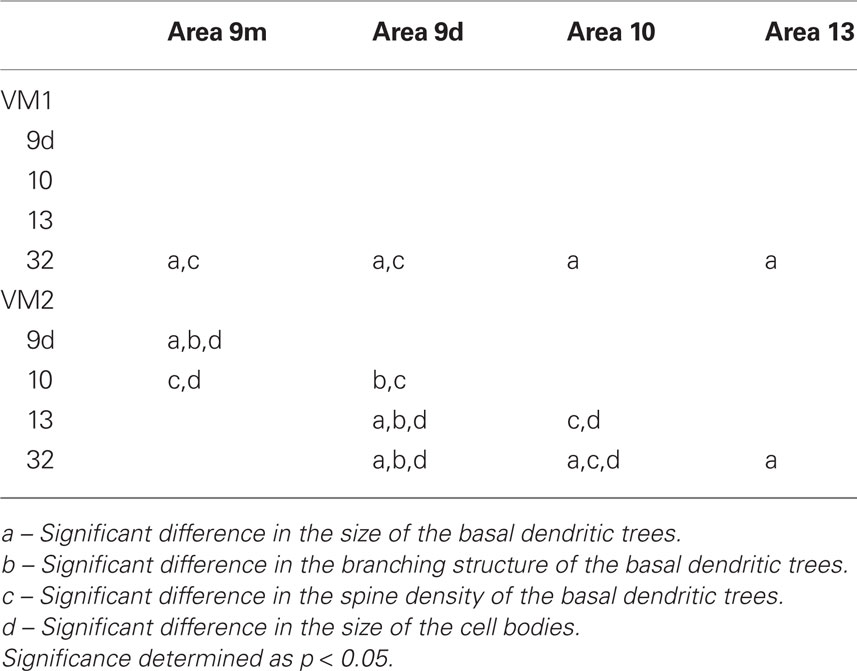
Table 6. Summary of post hoc pair-wise Scheffe comparisons of morphological parameters of neurons in the vervet monkey.
Branching patterns of the basal dendritic arbors
Branching patterns of the basal dendritic arbors of pyramidal neurons are illustrated in Figure 5B. Repeated measures ANOVAs (5 × 13 design) revealed a significant difference (p < 0.05) in the branching patterns in both VM1 (F(1,4) = 3.05) and VM2 (F(1,4) = 10.12). Post hoc Scheffe tests revealed no significant difference in branching structure, except in VM2 where cells in area 9d differed to those in all other cortical areas (Table 6).
Spine densities of the basal dendrites
The mean and standard deviation in spine density per 10 μm (as a function of distance from the soma to the distal tips of 10 randomly selected horizontally projecting basal dendrites of different cells in each cortical area) are plotted in Figure 5C. Repeated measures ANOVAs revealed a significant difference (p < 0.05) in the distribution of spines along the dendrites cells between cortical areas in both VM1 (F(1,4) = 4.23) and VM2 (F(1,4) = 7.53). Post hoc Scheffe tests revealed that spine density in area 32 was significantly different to that in areas 9d and 9m in VM1 and area 10 in VM2. None of the six possible pair-wise comparisons between prefrontal areas were significantly different in VM1. Three of the six pair-wise comparisons between prefrontal areas were significantly different in VM2 (Table 6). There was a >50% difference in our estimates of the total number of dendritic spines in the basal dendritic arbor of the “average” pyramidal neuron in areas of the gPFC (Figure 7; Table 7).
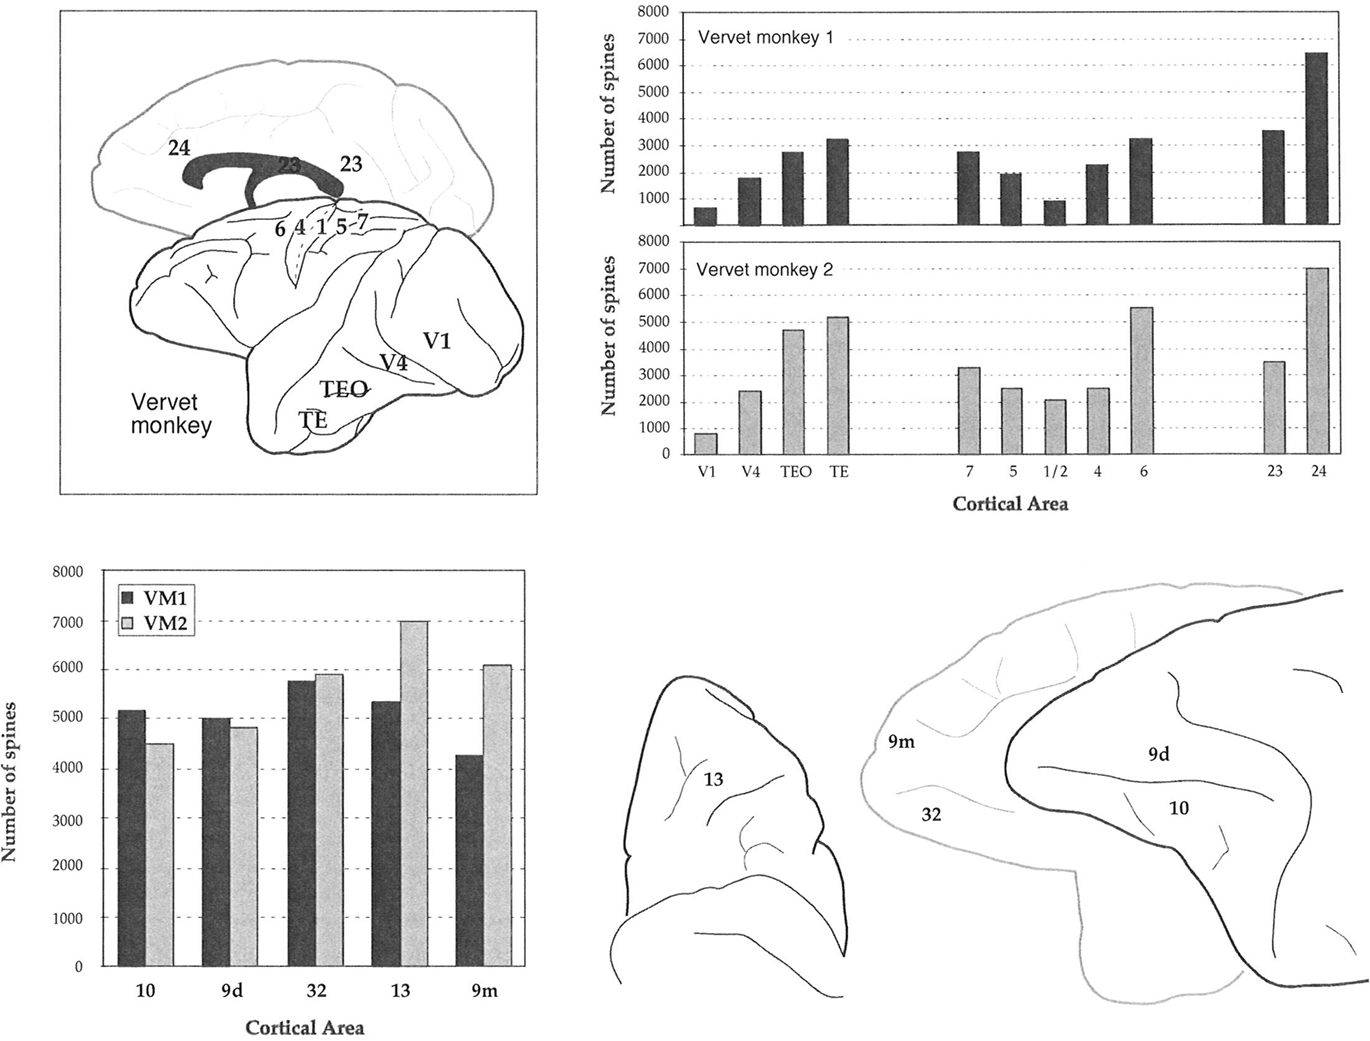
Figure 7. Plots of our estimates of the total number of dendritic spines in the basal dendritic tree of the “average” layer III pyramidal cell in visual, somatosensory, motor, limbic, and prefrontal cortex of the vervet monkey. Sampling from the same cortical regions in the two animals (stylized at top right) resulted in remarkably similar trends in these estimates in visual, somatosensory, motor, and limbic cortex of both animals (top right). In granular prefrontal cortex (gPFC), however, we found unprecedented differences in our estimates of the total number of dendritic spines in the basal dendritic tree of the “average” layer III pyramidal cell among cortical areas (bottom left), despite standardizing the regions sampled between cases (bottom right). V1 = primary visual, V2 = second visual, V4 = fourth visual, 3b = primary somatosensory, 1/2/5/7 = somatosensory association, 4 = primary motor, 6 = premotor, 23 = posterior cingulate, 24 = anterior cingulate, 9/10/12/13/46 = prefrontal areas, 32 = cingulate.
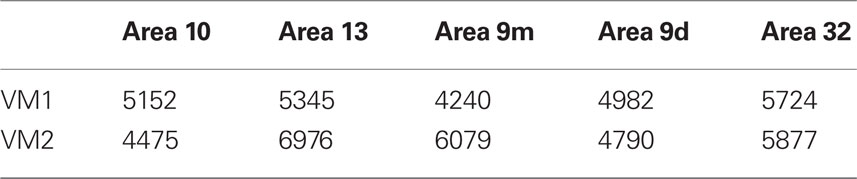
Table 7. Estimates of the total number of spines in the basal dendritic tree of the “average” layer III pyramidal cell in prefrontal areas of the vervet monkey.
Somal areas
Frequency distributions of the size of the cell bodies of pyramidal cells are plotted in Figure 5D and listed in Table 8. One-way ANOVAs revealed a significant difference in the size of the somata among neurons in VM2 (F(4) = 13.51) but not VM1 (F(4) = 1.39). Post hoc Scheffe tests revealed that cells in cingulate area 32 in VM2 had significantly larger cell bodies than those in areas 9d and 10. Four of the six possible pair-wise comparisons between prefrontal areas in VM2 were significantly different (Table 6).
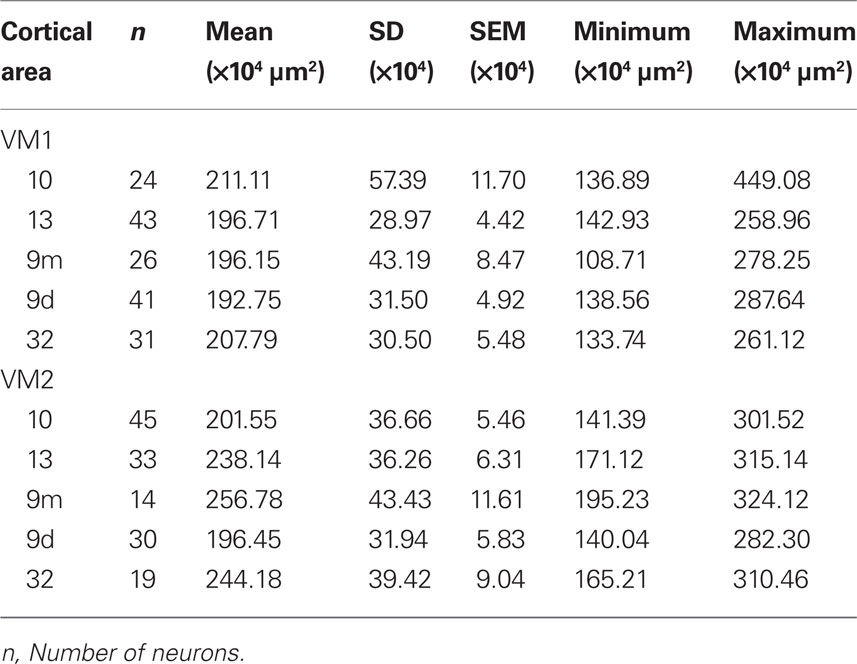
Table 8. Somata of layer III pyramidal cells (in the tangential plane) sampled in the prefrontal cortex of the vervet monkey.
Baboons (Areas 9d, 10, 13 46v and 46d)
Basal dendritic field areas
The size of the dendritic arbors was calculated and frequency distributions are plotted in Figure 5A (see also Table 9). Statistical analysis (one-way ANOVAs) revealed a significant difference in the size of the dendritic trees of neurons in both B1 (F(95) = 20.99) and B2 (F(176) = 6.50). Post hoc Scheffe tests revealed that 6 and 4 of all possible 10 pair-wise comparisons were significant in B1 and B2 (respectively; Table 10).
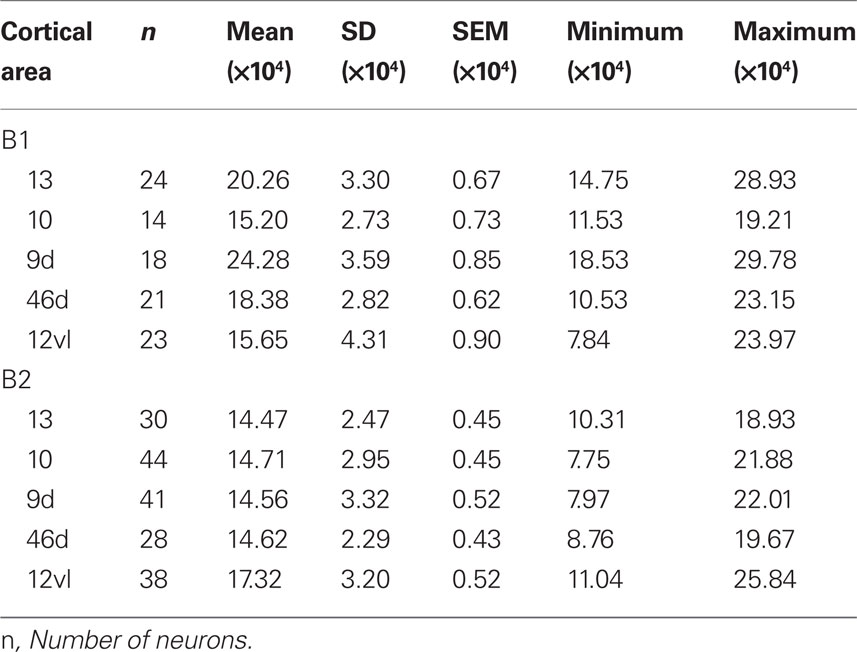
Table 9. Size of the basal dendritic trees of layer III pyramidal cells in baboon gPFC.
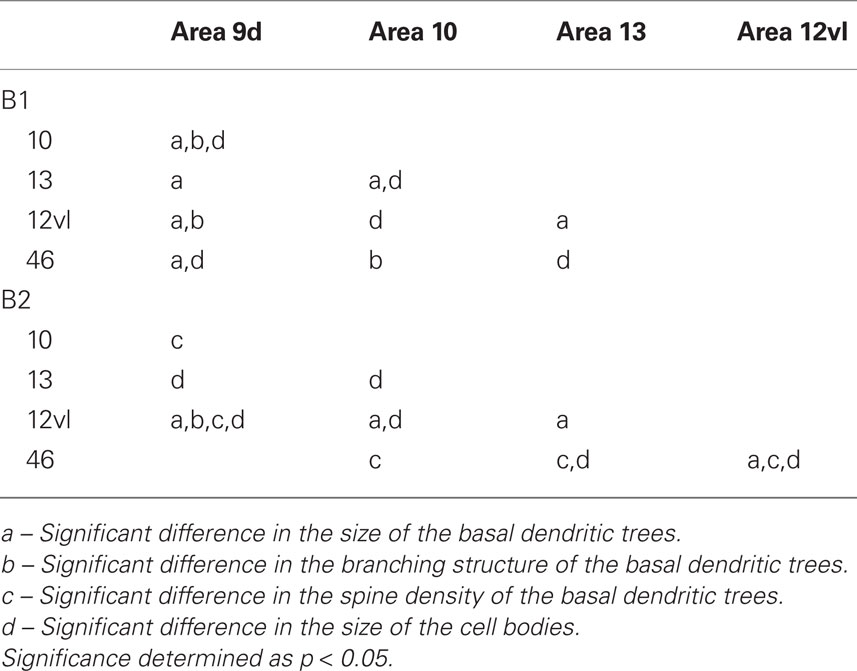
Table 10. Summary of post hoc pair-wise Scheffe comparisons of morphological parameters of neurons in the gPFC of the baboon.
Branching patterns of the basal dendritic arbors
Sholl analysis was performed and the branching profiles of the basal dendritic arbors of pyramidal neurons are illustrated in Figure 5B. Statistical analysis (repeated measures ANOVAs) revealed a significant difference (p < 0.05) in the branching patterns of cells between cortical areas in both B1 (F(1,4) = 7.86) and B2 (F(1,4) = 3.27). Post hoc Scheffe tests revealed that 3 of all 10 pair-wise between-area comparisons were significant in B1 and 1 of all 10 comparisons was significant in B2 (Table 10).
Spine densities of the basal dendrites
The spine density, as a function of distance from the cell body to the distal tips of the dendrites, is plotted in Figure 5C. Repeated measures ANOVAs (cortical area × distance from soma × spine density) revealed a significant difference (p < 0.001) in the distribution of spines between cortical areas in B2 (F(1,4) = 13.51), but not B1 (F(1,4) = 3.32). Post hoc Scheffe tests revealed a significance (p < 0.05) between cells in orbital and dorsolateral gPFC in B2 (Table 10). Estimates in the number of spines in the basal dendritic tree of the “average” layer III pyramidal cell revealed a >60% difference between cortical areas (Figure 6; Table 11).
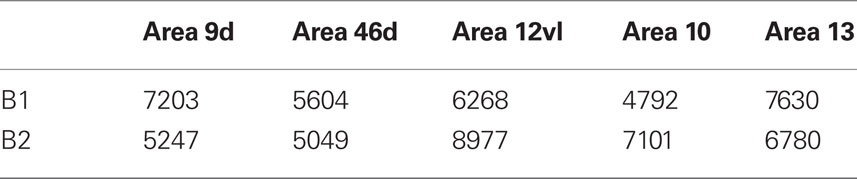
Table 11. Estimates of the total number of spines in the basal dendritic tree of the “average” layer III pyramidal cell in prefrontal areas of the Chacma baboon.
Somal areas
Frequency distributions of the size of the cell bodies of layer III pyramidal cells, in the plane tangential to the cortical surface, are plotted in Figure 5D (see also Table 12). Variance in the size of the cell bodies between cortical areas did not always coincide with that observed for the size of their dendritic trees (Figures 5A–D). One-way ANOVAs revealed significant differences (p < 0.05) in the size of the cell bodies of neurons between cortical areas in both B1 (F(95) = 13.87) and B2 (F(176) = 13.33). Post hoc Scheffe tests revealed that 5 of all 10 pair-wise between-area comparisons were significant in B1 and 6 of all 10 comparisons were significant in B2 (Table 10).
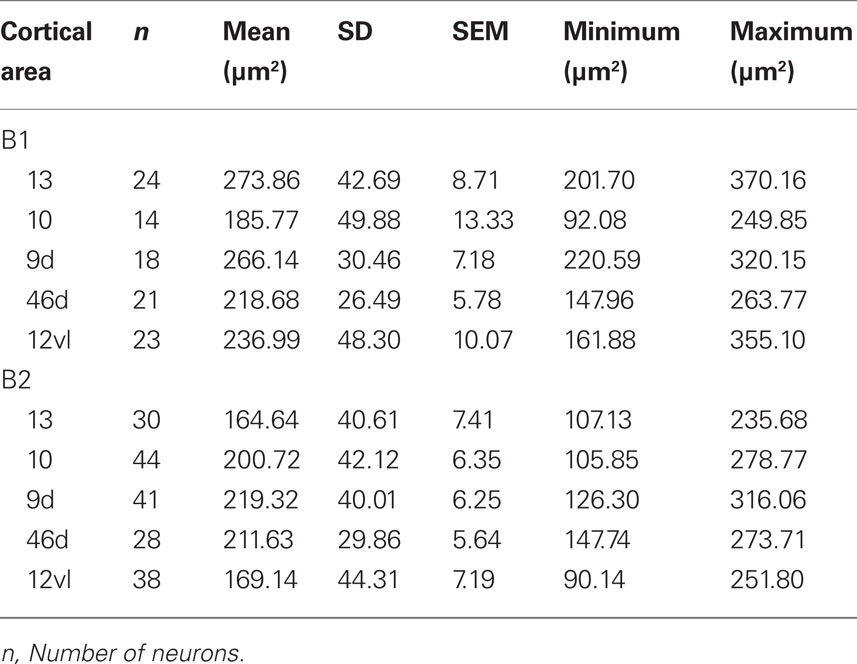
Table 12. Size of the cell bodies of layer III pyramidal cells (in the tangential plane) in the baboon gPFC.
Discussion
In the present investigation we studied pyramidal cell structure in the gPFC of the macaque monkey, the vervet monkey, and the baboon. We focused on the gPFC because of its involvement in executive functions such as conceptual thinking, prioritizing, and planning. The aim of the study was to determine whether there exists any appreciable variation in pyramidal cell structure within the gPFC, and compare any such variation across species. The results reveal significant differences in pyramidal cell structure among cortical areas within the gPFC in all animals studied. Moreover, the extent and topology of these trends differed between animals. However, it remains unclear whether regional variation in pyramidal cell structure reported here represent species specializations or interindividual variation. In either event, the extent of variation observed in the gPFC is unparalleled in any other cortical regions studied (visual, somatosensory, motor, and cingulate cortex) in all cases examined. Evolutionary, developmental, and functional implications of these findings are discussed below.
Neuronal Heterogeneity in Granular Prefrontal Cortex
The gPFC has been divided into several cortical areas, the number, and location of which varies between studies (Vogt and Vogt, 1919; Walker, 1940; Petrides and Pandya, 1988, 1999, 2001; Barbas and Pandya, 1989; Preuss and Goldman-Raki, 1991a,b,c; Carmichael and Price, 1996; Petrides, 1998; Barbas et al., 1999; Barbas, 2000; Pandya and Yeterian, 2000). While these studies have been instrumental in characterizing regional and species differences in the gPFC, they provide limited quantitative data on cortical microcircuitry. Examination of the present results (Figure 5) reveals new findings on the cortical microstructure not predictable from these cytological and connectional data. Namely, cortical pyramidal cells of similar size cell bodies may be characterized by dendritic trees of different size, branching structure, and spine density. Vice versa, pyramidal cells of different cell body size may have dendritic trees of similar size, branching structure or spine density. This lack of correspondence between cell body size and the structure of the dendritic tree has been reported in other cortical regions in primates, including the sensorimotor and cingulate cortex (Elston and Rockland, 2002; Elston et al., 2005a,f,g,i,j). Thus, while cytoarchitecture is an excellent means of detecting differences in areal and laminar structure in the cerebral cortex, it provides little insight into regional differences in patterns of connectivity and the integrative capabilities of the component neurons.
Previously we published a report in which pyramidal cell structure was compared in areas 10, 11, and 12 of the macaque monkey, and revealed quantifiable differences in cell morphology among these regions (Elston, 2000). The present data confirm and extend this original observation. In particular, previously we reported up to a 20% difference in our estimates of the numbers of spines in the dendritic tree of the average cell in areas 10 and 12 of the macaque monkey. Here we found up to a 22% difference in these estimates between areas within the gPFC of the macaque monkey (12vl and 46vr in case MF1). We found up to a 27% difference in these estimates in the vervet monkey (areas 9d and 9m in case VM1) and a 70% difference in the baboon (areas 9d and 12vl of case B2). Furthermore, as discussed above, we found different trends in the gradients of neuronal complexity among cortical areas within the gPFC within and between species. In future studies it will be worthwhile to study age, hemisphere, and sex effects to better understand the extent of heterogeneity in pyramidal cell structure in the gPFC.
Interindividual Variation in the Pyramidal Cell Phenotype
While we would expect to find some degree of interindividual variation in cell structure, that observed in the gPFC is unprecedented. We found, for example, a 56% difference in our estimates of the total number of dendritic spines in the basal dendritic tree of the average neuron in area 12vl between the two macaque monkeys. Likewise we found a 43% difference in our estimates of the total number of dendritic spines in the basal dendritic tree of the average neuron in area 9m between the two vervet monkeys and a 48% difference in area 10 between the two baboons. These percentages are considerably higher than those reported in visual somatosensory, motor, and cingulate cortex of these same animals, or, indeed all other species studied. For example, the maximum interindividual difference in our estimates of the total number of dendritic spines in the basal dendritic tree of the average neuron observed in the primary visual cortex was 16%, 25% in primary motor cortex and less than 9% in cingulate cortex (Elston and Rosa, 1997; Elston et al., 2005g,h,i). Moreover, trends for increasing complexity in the dendritic trees of pyramidal cells in visual somatosensory, motor, and cingulate cortex have always been consistent between individuals of any given species, where as this is not the case in the gPFC (Figure 7). The large number of pyramidal neurons included in these studies (Table 13) makes it unlikely that this observation is attributable to different numbers of cells included for analyses in each region. However, differences in sulcal patterns and sampling of different locations within a given cortical area (e.g., dorsal vs. ventral) are likely to have contributed to these apparent interindividual differences. For example, differences in pyramidal cell structure have been reported in layer III within V1 according to visuotopy and within inferotemporal cortex according to gross location (cf. Elston and Rosa, 1997; Elston et al., 1999a,b). A better understanding of these apparent interindividual differences will require that more individuals are included for analyses. It should be noted that these differences in our estimates of the total number of dendritic spines in the basal dendritic trees of layer III pyramidal cells in the gPFC equate to four times those reported in the entire basal dendritic trees in V1.
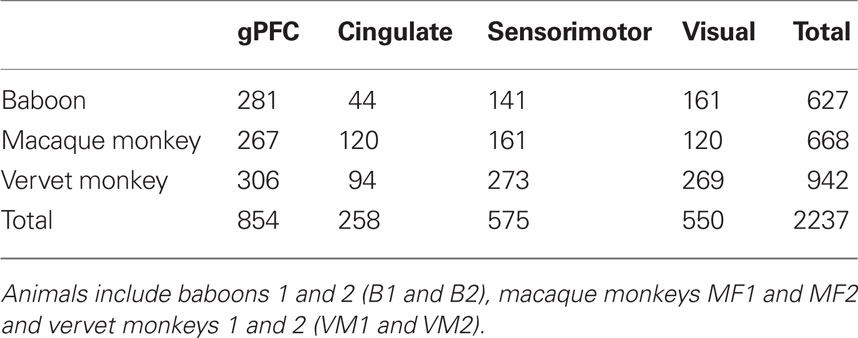
Table 13. Number of layer III pyramidal cells included for study in the granular prefrontal (gPFC), cingulate, sensorimotor, and visual cortex of the animals studied here.
Phenotypic Specialization of the Pyramidal Cell within the gPFC
Here we found differences in the relative trends in morphological complexity among cortical areas in the gPFC between individuals. For example, cells in the dorsolateral gPFC were the most spinous in both the macaque monkey and baboon, but those in the orbital and medial gPFC were the most spinous in the vervet monkeys. These differences may be attributable to the selection of cortical areas included for analyses in each of the different species, but it is worthwhile noting that no such interspecies differences have been observed in visual, somatosensory, motor, or limbic cortex of these same species. Instead, trends reported in the visual, somatosensory, motor, and limbic cortex of the macaque monkey are the same as those reported in the vervet monkey and baboon (Figure 6). Moreover, trends reported in these cortical areas in the macaque monkey, vervet monkey, and baboon are similar to those reported in all other primate species studied to date (Elston et al., 2005a,b,c,g,h,i,j).
Another possibility is that the different trends reflect species differences. The lineage leading to modern day vervet monkeys diverged from that leading to modern day baboons and macaque monkeys approximately 10 million years ago. The lineage leading to modern day baboons diverged from that leading to macaque monkeys about 7 million years ago (Gould, 2002). Thus, it is tempting to conclude that highly complex pyramidal cells in the dorsolateral gPFC is a characteristic of the latter species, which may differ from that in other primates that diverged earlier, such as New World monkeys and the great apes. Alternatively, the apparent species differences may reflect regional variation in neuronal maturation rates (Jacobs and Scheibel, 1993; Jacobs et al., 1995, 1997; Page et al., 2002; Duan et al., 2003; Elston et al., 2009, 2010a,b) or arise through sampling different subsets of projection neurons in the different cortical areas, which have been shown to differ in both their morphology (Schofield et al., 1987; Hallman et al., 1988; Hübener and Bolz, 1988; de Lima et al., 1990; Hübener et al., 1990; Einstein, 1996; Matsubara et al., 1996; Duan et al., 2002; Soloway et al., 2002; Elston and Rosa, 2006) and density (Jones and Powell, 1970; Barbas, 1992; Young, 1992; Pandya and Yeterian, 2000; Petrides, 2000; Collins et al., 2005) in different cortical areas. In either case, the result is consistent with our main conclusion that pyramidal cells develop differently among cortical areas and mature into specialized circuits. Clearly, more comparative and developmental data on pyramidal cell structure are required to reveal a more complete picture.
Not withstanding these limitations on the interpretation of the trends for regional variation in pyramidal cell structure within the gPFC, the present results confirm previous findings that pyramidal cells in the gPFC are characterized by a highly complex structure (Lund et al., 1993; Elston, 2000; Elston et al., 2001; Jacobs et al., 2001). However, previously it was reported that pyramidal cells in the gPFC have a more complex phenotype than those in the visual, somatosensory, and motor and cingulate cortex (Elston and Rosa, 1997, 1998, 2000; Elston and Rockland, 2002). The present data reveal that, in the macaque monkey, cells in inferotemporal and anterior cingulate cortex were more spinous than those area 12vl (case MF2; Elston et al., 1999a, 2005a; present results).Likewise, cells in the anterior cingulate gyrus in both the vervet monkey and baboon have larger, more branched and more spinous dendritic trees than those in some cortical areas within the gPFC(Elston et al., 2005f,i). Therefore, the present data reveal that some but not all pyramidal cells in the gPFC have a more complex structure than those in other cortical regions. More specifically, those in the gPFC have the most complex branching structure and the highest spine density while those in the anterior cingulate gyrus and inferotemporal cortex may have the largest dendritic trees. As discussed below, these different morphological parameters are likely to influence different aspects of cellular and systems function.
Form Serves Function
As reviewed in detail elsewhere (Elston, 2002, 2003a; Jacobs and Scheibel, 2002) differences in the size, branching complexity, spine density in the dendritic trees may influence various aspects of function at the subcellular, cellular, and systems levels. For example, differences in the size of the dendritic trees may influence the sampling geometry of neurons, the topographic relationship between the pattern of inputs and the size of the dendritic tree influencing receptive field properties (Lund et al., 1993; Malach, 1994). Differences in the diameter and total length of the dendrites determines their electrotonic properties (Rall, 1959, 1989; Mainen and Sejnowski, 1986; Rothnie et al., 2005). Differences in the number of branches in the dendritic tree may influence the potential to compartmentalize the processing of inputs within the arbor and, thus, the functional capacity of the neurons, as well as the decay of the backpropagating potentials believed to be important in Hebbian type reinforcement of inputs (Rall et al., 1992; Stuart et al., 1997; Segev and Rall, 1998; Mel, 1999; Spruston et al., 1999; Vetter et al., 2001; Elston, 2007). Differences in the number and density of spines along the dendrites may influence the potential for local summation and/or the inhibitory vetoing of inputs (White, 1989; Koch, 1999). In addition, as each dendritic spine in mature cortex receives at least one asymmetrical synapse (Arellano et al., 2007), which have been demonstrated to contain the excitatory transmitter glutamate (DeFelipe et al., 1988; Petralia et al., 1994a,b,c), differences in the total number of spines in the dendritic tree likely reflect differences in the number of excitatory inputs to the neuron: highly spinous cells receiving more excitatory inputs than less spinous cells (Elston, 2002, 2003a).
These differences in the density and distribution of inputs throughout the dendritic trees, and the spatial distribution of the dendritic tree, have been shown to influence both the functional capacity of neurons and the memory storage capacity of cortical circuits they comprise (Poirazi and Mel, 2001; Stepanyants et al., 2002; Losonczy et al., 2008; Spruston, 2008). The dramatic differences in the branching structure of, and number of spines in, the dendritic trees of neurons in the gPFC of primates (Elston et al., 2006) makes it implausible that function in this region of the brain is the same across species. Indeed, modeling studies have demonstrated a difference of up to two orders of magnitude in the memory capacity of cortical circuitry attributable to differences in the branching structure and number/distribution of inputs throughout the dendritic trees of the component pyramidal cells (Mel, 2002; Chklovskii et al., 2004).
Perhaps not surprisingly, differences in discharge properties of cortical neurons have also been reported among cortical regions. For example, neurons in the gPFC are characterized by tonic discharge properties that are sustained despite interruption from distractors, those in association cortex are characterized by tonic discharge properties that may be interrupted by distractors and those in and primary sensory cortex are characterized by phasic activity (Fuster and Alexander, 1971; Fuster, 1973; Fuster et al., 1982; Fuster and Jervey, 1983; Ashford and Fuster, 1985; Funahashi et al., 1989, 1993; Miller et al., 1993, 1996; Constantinidis and Steinmetz, 1996; Sakai et al., 2002; Shinomoto et al., 2005).
Finally, from the intrinsic point of view of cortical organization, there are also significant differences in the distribution of GABAergic interneurons in different cortical areas of primates (Lewis and Lund, 1990; Gabbott et al., 1997; DeFelipe et al., 1999; Elston and González-Albo, 2003; Ballesteros-Yánez et al., 2005; Benavides-Piccione and DeFelipe, 2007; Inda et al., 2007; Blazquez-Llorca et al., 2010). Since GABAergic neurons are involved in the shaping the activity of pyramidal neurons, it is likely that the different intrinsic functional attributes of the cortical regions examined depends on all these features or in a combination of them. Further correlative physiological and microanatomical/neurochemical studies would be necessary to perform to find out the role of each cortical component on the processing of information characteristic of the different cortical areas.
Conclusion
Here we found significant differences in pyramidal cell structure among cortical areas within the gPFC of the macaque monkeys, vervet monkeys, and baboons. Moreover we found species differences when comparing pyramidal cell structure between homologous/corresponding cortical areas. The data suggest regional as well as interindividual and species differences in the functional capabilities of pyramidal cells in different cortical areas of the gPFC of cercopithecid primates. Because pyramidal cells comprise >70% of neurons within the gPFC, differences in the number of dendritic spines (putative excitatory inputs) found within their dendritic trees suggest that cortical areas within the gPFC are characterized by different patterns of connectivity. As patterns of connectivity determine the computational abilities cortical circuits, the present data suggest regional and species differences in computations performed in the gPFC of macaque monkeys, vervet monkeys, and baboons. Functions often ascribed to the gPFC, such as planning, prioritizing, and conceptualization, are likely then to be influenced by specialization in the pyramidal cell phenotype.
Conflict of Interest Statement
The authors declare that the research was conducted in the absence of any commercial or financial relationships that could be construed as a potential conflict of interest.
Acknowledgments
Supported by grants from the National Health and Medical Research Council of Australia (Guy N. Elston), the McDonnell Foundation (Guy N. Elston), the Japanese Science and Technology Corporation (Guy N. Elston), Hear and Say Australia (Guy N. Elston), CIBERNED CB06/05/0066 (Javier DeFelipe), Fundación CIEN (Javier DeFelipe), and the Spanish Ministry of Education, Science and Innovation SAF2009-09394 (Javier DeFelipe), and the South African National Research Foundation (Paul R. Manger). Thanks to Brendan Zietsch and Laura Ferris for technical help.
References
Arellano, J. I., Espinosa, A., Fairen, A., Yuste, R., and DeFelipe, J. (2007). Non-synaptic dendritic spines in neocortex. Neuroscience 145, 464–469.
Ashford, J. W., and Fuster, J. M. (1985). Occipital and inferotemporal responses to visual signals in the monkey. Exp. Neurol. 90, 444–446.
Ballesteros-Yánez, I., Muñoz, A., Contreras, J., Gonzalez, J., Rodriguez-Veiga, E., and DeFelipe, J. (2005). The double bouquet cell in the human cerebral cortex and a comparison with other mammals. J. Comp. Neurol. 486, 344–360.
Barbas, H. (1992). Architecture and cortical connections of the prefrontal cortex in the rhesus monkey. Adv. Neurol. 57, 91–115.
Barbas, H. (2000). Connections underlying the synthesis of cognition, memory, and emotion in primate prefrontal cortices. Brain Res. Bull. 52, 319–330.
Barbas, H., Ghashghaei, H., Dombrowski, S. M., and Rempel-Clower, N. L. (1999). Medial prefrontal cortices are unified by common connections with superior temporal cortices and distinguished by input from memory-related areas in the rhesus monkey. J. Comp. Neurol. 410, 343–367.
Barbas, H., Hilgetag, C. C., Saha, S., Dermon, C. R., and Suski, J. L. (2005). Parallel organization of contralateral and ipsilateral prefrontal cortical projections in the rhesus monkey. BMC Neurosci. 6, 32. doi: 10.1186/1471-2202-6-32
Barbas, H., and Pandya, D. N. (1989). Architecture and intrinsic connections of the prefrontal cortex in the rhesus monkey. J. Comp. Neurol. 286, 353–375.
Benavides-Piccione, R., and DeFelipe, J. (2007). Distribution of neurons expressing tyrosine hydroxylase in the human cerebral cortex. J. Anat. 211, 212–222.
Binzegger, T., Douglas, R. J., and Martin, K. A. (2004). A quantitative map of the circuit of cat primary visual cortex. J. Neurosci. 24, 8441–8453.
Blazquez-Llorca, L., Garcia-Marin, V., and DeFelipe, J. (2010). GABAergic complex basket formations in the human neocortex. J. Comp. Neurol. 518, 4917–4937.
Buhl, E. H., and Schlote, W. (1987). Intracellular Lucifer yellow staining and electronmicroscopy of neurons in slices of fixed epitumourous human cortical tissue. Acta Neuropathol. 75, 140–146.
Carmichael, S. T., and Price, J. L. (1996). Connectional networks within the orbital and medial prefrontal cortex of macaque monkeys. J. Comp. Neurol. 371, 179–207.
Cavada, C., Compañy, T., Tejedor, J., Cruz-Rizzolo, R. J., and Reinoso-Suárez, F. (2000). The anatomical connections of the macaque orbitofrontal cortex. Cereb. Cortex 10, 220–242.
Chklovskii, D. B., Mel, B. W., and Svoboda, K. (2004). Cortical rewiring and information storage. Nature 431, 782–788.
Collins, C. E., Lyon, D. C., and Kaas, J. H. (2005). Distribution across cortical areas of neurons projecting to the superior colliculus in new world monkeys. Anat. Rec. 285, 619–627.
Constantinidis, C., and Steinmetz, M. A. (1996). Neuronal activity in posterior parietal area 7a during the delay periods of a spatial memory task. J. Neurophysiol. 76, 1352–1355.
Courtney, S. M., Petit, L., Haxby, J. V., and Ungerlieder, L. G. (1998). The role of prefrontal cortex in working memory: examining the contents of consciousness. Philos. Trans. R. Soc. Lond., B, Biol. Sci. 353, 1819–1828.
de Lima, A. D., Voigt, T., and Morrison, J. H. (1990). Morphology of the cells within the inferior temporal gyrus that project to the prefrontal cortex in the macaque monkey. J. Comp. Neurol. 296, 159–172.
DeFelipe, J., Conti, F., Van Eyck, S. L., and Manzoni, T. (1988). Demonstration of glutamate-positive axon terminals forming asymmetric synapses in cat neocortex. Brain Res. 455, 162–165.
DeFelipe, J., del Río, M. R., González Albo, M. C., and Elston, G. N. (1999). Distribution and patterns of connectivity of interneurons containing calbindin, calretinin and parvalbumin in visual areas of the occipital and temporal lobes of the macaque monkey. J. Comp. Neurol. 412, 515–526.
DeFelipe, J., and Fariñas, I. (1992). The pyramidal neuron of the cerebral cortex: morphological and chemical characteristics of the synaptic inputs. Prog. Neurobiol. 39, 563–607.
Denys, K., Vanduffel, W., Fize, D., Nelissen, K., Sawamura, H., Georgieva, S., Vogels, R., Van Essen, D., and Orban, G. A. (2004). Visual activation in prefrontal cortex is stronger in monkeys than in humans. J. Cogn. Neurosci. 16, 1505–1516.
Duan, H., Wearne, S., Morrison, J., and Hof, P. (2002). Quantitative analysis of the dendritic morphology of corticocortical projection neurons in the macaque monkey association cortex. Neuroscience 114, 349–359.
Duan, H., Wearne, S. L., Rocher, A. B., Macedo, A., Morrison, J. H., and Hof, P. R. (2003). Age-related dendritic and spine changes in corticocortically projecting neurons in macaque monkeys. Cereb. Cortex 13, 950–961.
Duncan, J., and Owen, A. (2000). Common regions of human frontal lobe recruited by diverse cognitive demands. Trends Neurosci. 23, 475–483.
Eayrs, J. T., and Goodhead, B. (1959). Postnatal development of the cerebral cortex in the rat. J. Anat. 93, 385–402.
Einstein, G. (1996). Reciprocal projections of cat extrastriate cortex: I. Distribution and morphology of neurons projecting from posterior medial lateral suprasylvian sulcus to area 17. J. Comp. Neurol. 376, 518–529.
Elston, G. N. (2000). Pyramidal cells of the frontal lobe: all the more spinous to think with. J. Neurosci. 20, RC95.
Elston, G. N. (2001). Interlaminar differences in the pyramidal cell phenotype in cortical areas 7m and STP (the superior temporal polysensory area) of the macaque monkey. Exp. Brain Res. 138, 141–152.
Elston, G. N. (2002). Cortical heterogeneity: implications for visual processing and polysensory integration. J. Neurocytol. 31, 317–335.
Elston, G. N. (2003a). Cortex, cognition and the cell: new insights into the pyramidal neuron and prefrontal function. Cereb. Cortex 13, 1124–1138.
Elston, G. N. (2003b). Pyramidal cell heterogeneity in the visual cortex of the nocturnal New World owl monkey (Aotus trivirgatus). Neuroscience 117, 213–219.
Elston, G. N. (2007). “Specializations in pyramidal cell structure during primate evolution,” in Evolution of Nervous Systems, eds J. H. Kaas and T. M. Preuss (Oxford: Academic Press), 191–242.
Elston, G. N., Benavides-Piccione, R., and DeFelipe, J. (2001). The pyramidal cell in cognition: a comparative study in human and monkey. J. Neurosci. 21, RC163.
Elston, G. N., Benavides-Piccione, R., and DeFelipe, J. (2005a). A study of pyramidal cell structure in the cingulate cortex of the macaque monkey with comparative notes on inferotemporal and primary visual cortex. Cereb. Cortex 15, 64–73.
Elston, G. N., Elston, A., Casagrande, V. A., and Kaas, J. (2005b). Areal specialization in pyramidal cell structure in the visual cortex of the tree shrew: a new twist revealed in the evolution of cortical circuitry. Exp. Brain Res. 163, 13–20.
Elston, G. N., Elston, A., Casagrande, V. A., and Kaas, J. (2005c). Pyramidal neurons of granular prefrontal cortex the galago: complexity in the evolution of the psychic cell in primates. Anat. Rec. 285, 610–618.
Elston, G. N., Elston, A., Kaas, J., and Casagrande, V. A. (2005d). Regional specialization in pyramidal cell structure in the visual cortex of the galago: an intracellular injection study with comparative notes on New World and Old World monkeys. Brain Behav. Evol. 66, 10–21.
Elston, G. N., Benavides-Piccione, R., Elston, A., DeFelipe, J., and Manger, P. (2005e). Pyramidal cell specialization in the occipitotemporal cortex of the Chacma baboon (Papio ursinus). Exp. Brain Res. 167, 496–503.
Elston, G. N., Benavides-Piccione, R., Elston, A., DeFelipe, J., and Manger, P. (2005f). Specialization in pyramidal cell structure in the cingulate cortex of the Chacma baboon (Papio ursinus): an intracellular injection study of the posterior and anterior cingulate gyrus with comparative notes on the macaque and vervet monkeys. Neurosci. Lett. 387, 130–135.
Elston, G. N., Benavides-Piccione, R., Elston, A., DeFelipe, J., and Manger, P. (2005g). Specialization in pyramidal cell structure in the sensory–motor cortex of the vervet monkey (Cercopithecus pygerythrus). Neuroscience 134, 1057–1068.
Elston, G. N., Benavides-Piccione, R., Elston, A., Manger, P., and DeFelipe, J. (2005h). Pyramidal cell specialization in the occipitotemporal cortex of the vervet monkey (Cercopithecus pygerythrus). Neuroreport 16, 967–970.
Elston, G. N., Benavides-Piccione, R., Elston, A., Manger, P., and DeFelipe, J. (2005i). Regional specialization in pyramidal cell structure in the limbic cortex of the vervet monkey (Cercopithecus pygerythrus): an intracellular injection study of the anterior and posterior cingulate gyrus. Exp. Brain Res. 167, 315–323.
Elston, G. N., Benavides-Piccione, R., Elston, A., Manger, P., and DeFelipe, J. (2005j). Specialization in pyramidal cell structure in the sensory–motor cortex of the Chacma baboon (Papio ursinus) with comparative notes on the macaque monkey. Anat. Rec. 286A, 854–865.
Elston, G. N., Benavides-Piccione, R., Elston, A., Zietsch, B., DeFelipe, J., Manger, P., Casagrande, V., and Kaas, J. H. (2006). Specializations of the granular prefrontal cortex of primates: implications for cognitive processing. Anat. Rec. 288A, 26–35.
Elston, G. N., and González-Albo, M. C. (2003). Parvalbumin-, calbindin- and calretinin-immunoreactive neurons in the prefrontal cortex of the owl monkey (Aotus trivirgatus): a standardized quantitative comparison with sensory and motor cortex. Brain Behav. Evol. 62, 19–30.
Elston, G. N., Oga T., and Fujita I. (2009). Spinogenesis and pruning scales across functional hierarchies. J. Neurosci. 29, 3271–3275.
Elston, G. N., Oga, T., Okamoto, T., and Fujita, I. (2010a). Spinogenesis and pruning from early visual onset to adulthood: an intracellular injection study of layer III pyramidal cells in the ventral visual cortical pathway of the macaque monkey. Cereb. Cortex 20, 1398–1408.
Elston, G. N., Okamoto, T., Oga, T., Dornan, D., and Fujita, I. (2010b). Spinogenesis and pruning in the primary auditory cortex of the macaque monkey (Macaca fascicularis): an intracellular injection study of layer III pyramidal cells. Brain Res. 1316, 35–42.
Elston, G. N., and Rockland, K. (2002). The pyramidal cell of the sensorimotor cortex of the macaque monkey: phenotypic variation. Cereb. Cortex 10, 1071–1078.
Elston, G. N., and Rosa, M. G. P. (1997). The occipitoparietal pathway of the macaque monkey: comparison of pyramidal cell morphology in layer III of functionally related cortical visual areas. Cereb. Cortex 7, 432–452.
Elston, G. N., and Rosa, M. G. P. (1998). Morphological variation of layer III pyramidal neurones in the occipitotemporal pathway of the macaque monkey visual cortex. Cereb. Cortex 8, 278–294.
Elston, G. N., and Rosa, M. G. P. (2000). Pyramidal cells, patches, and cortical columns: a comparative study of infragranular neurons in TEO, TE, and the superior temporal polysensory area of the macaque monkey. J. Neurosci. 20, RC117.
Elston, G. N., and Rosa, M. G. P. (2006). Ipsilateral corticocortical projections to the primary and middle temporal visual areas of the primate cerebral cortex: area-specific variations in the morphology of connectionally identified pyramidal cells. Eur. J. Neurosci. 23, 3337–3345.
Elston, G. N., Tweedale, R., and Rosa, M. G. P. (1999a). Cortical integration in the visual system of the macaque monkey: large scale morphological differences of pyramidal neurones in the occipital, parietal and temporal lobes. Proc. R. Soc. Lond., B, Biol. Sci. 266, 1367–1374.
Elston, G. N., Tweedale, R., and Rosa, M. G. P. (1999b). Cellular heterogeneity in cerebral cortex. A study of the morphology of pyramidal neurones in visual areas of the marmoset monkey. J. Comp. Neurol. 415, 33–51.
Feldman, M. L., and Peters, A. (1979). A technique for estimating total spine numbers on Golgi-impregnated dendrites. J. Comp. Neurol. 188, 527–542.
Fujita, I., and Fujita, T. (1996). Intrinsic connections in the macaque inferior temporal cortex. J. Comp. Neurol. 368, 467–486.
Funahashi, S., Bruce, C. J., and Goldman-Rakic, P. S. (1989). Mnemonic coding of visual space in the monkey’s dorsolateral prefrontal cortex. J. Neurophysiol. 61, 331–349.
Funahashi, S., Chafee, M. V., and Goldman-Rakic, P. S. (1993). Prefrontal activity in rhesus monkeys performing a delayed anti-saccad task. Nature 365, 753–756.
Funahashi, S., and Kubota, K. (1994). Working memory and prefrontal cortex. Neurosci. Res. 21, 1–11.
Funahashi, S., and Takeda, K. (2002). Information processes in the primate prefrontal cortex in relation to working memory processes. Nat. Rev. Neurosci. 13, 313–345
Fuster, J. M. (1973). Unit activity in prefrontal cortex during delayed-response performance: neuronal correlates of transient memory. J. Neurophysiol. 36, 61–78.
Fuster, J. M. (1997). The Prefrontal Cortex: Anatomy, Physiology, and Neuropsychology of the Frontal Lobe. Philadelphia: Lippincott-Raven.
Fuster, J. M. (2001). The prefrontal cortex – an update; time is of the essence. Neuron 30, 319–333.
Fuster, J. M., and Alexander, G. E. (1971). Neuron activity related to short-term memory. Science 173, 652–654.
Fuster, J. M., Bauer, R. H., and Jervey, J. P. (1982). Cellular discharge in the dorsolateral prefrontal cortex of the monkey in cognitive tasks. Exp. Neurol. 77, 679–694.
Fuster, J. M., and Jervey, J. P. (1983). Neuronal firing in the inferotemporal cortex of the monkey in a visual memory task. J. Neurosci. 2, 361–375.
Gabbott, P. L., Jays, P. R., and Bacon, S. J. (1997). Calretinin neurons in human prefrontal cortex (areas 24, 32 and 25). J. Comp. Neurol. 381, 389–410.
Gilbert, C. D., and Wiesel, T. N. (1979). Morphology and intracortical projections of functionally characterised neurones in the cat visual cortex. Nature 280, 120–125.
Gilbert, C. D., and Wiesel, T. N. (1983). Clustered intrinsic connections in cat visual cortex. J. Neurosci. 3, 1116–1133.
Gilbert, C. D., and Wiesel, T. N. (1989). Columnar specificity of intrinsic horizontal and corticocortical connections in the cat visual cortex. J. Neurosci. 9, 2432–2442.
Goldman-Rakic, P. S. (1987). “Circuitry of primate prefrontal cortex and regulation of behavior by representational memory,” in Handbook of Physiology: The Nervous System, Vol. 5, ed. F. Plum (Bethesda: American Physiological Society), 373–417.
Goldman-Rakic, P. S. (2000). “The prefrontal landscape: implications of functional architecture for understanding human mentation and the central executive,” in The Prefrontal Cortex. Executive and Cognitive Functions, eds A. C. Roberts, T. W. Robbins, and L. Weiskrantz (Oxford: Oxford University Press), 87–102.
González-Burgos, G., Barrionuevo, G., and Lewis, D. A. (2000). Horizontal synaptic connections in monkey prefrontal cortex: an in vitro electrophysiological study. Cereb. Cortex 10, 82–92.
Hagler, D. J., and Sereno, M. I. (2006). Spatial maps in frontal and prefrontal cortex. Neuroimage 29, 567–577.
Hallman, L. E., Schoefield, B. R., and Lin, C.-S. (1988). Dendritic morphology and axon collaterals of corticotectal, corticopontine, and callosal neurons in layer V of the primary visual cortex of the hooded rat. J. Comp. Neurol. 272, 149–160.
Hirsch, J., Rodriguez Moreno, D., and Kim, K. H. S. (2001). Interconnected large-scale systems for three fundamental cognitive tasks revealed by functional MRI. J. Cogn. Neurosci. 13, 389–405.
Hübener, M., and Bolz, J. (1988). Morphology of identified projection neurons in layer 5 of rat visual cortex. Neurosci. Lett. 94, 76–81.
Hübener, M., Schwarz, C., and Bolz, J. (1990). Morphological types of projection neurons in layer 5 of cat visual cortex. J. Comp. Neurol. 301, 655–674.
Inda, M. C., Defelipe, J., and Munoz, A. (2007). The distribution of chandelier cell axon terminals that express the GABA plasma membrane transporter GAT-1 in the human neocortex. Cereb. Cortex 17, 2060–2071.
Jacobs, B., Chugani, H. T., Allada, V., Chen, S., Phelps, M. E., Pollack, D. B., and Raleigh, M. J. (1995). Developmental changes in brain metabolism in sedated rhesus macaques and vervet monkeys revealed by positron emission tomography. Cereb. Cortex. 5, 222–233.
Jacobs, B., Larsen-Driscoll, L., and Schall, M. (1997). Lifespan dendritic and spine changes in areas 10 and 18 of human cortex: a quantitative Golgi study J. Comp. Neurol. 386, 661–680.
Jacobs, B., Schall, M., Prather, M., Kapler, L., Driscoll, L., Baca, S., Jacobs, J., Ford, K., Wainwright, M., and Treml, M. (2001). Regional dendritic and spine variation in human cerebral cortex: a quantitative study. Cereb. Cortex 11, 558–571.
Jacobs, B., and Scheibel, A. B. (1993). A quantitative analyses of Wernicke’s area in humans. I. Lifespan changes. J. Comp. Neurol. 327, 83–96.
Jacobs, B., and Scheibel, A. B. (2002). “Regional dendritic variation in primate cortical pyramidal cells,” in Cortical Areas: Unity and Diversity, eds A. Schüz and R. Miller (London: Taylor and Francis), 111–131.
Jones, E. G., and Powell, T. P. S. (1970). An anatomical study of converging sensory pathways within the cerebral cortex of the monkey brain. Brain 93, 793–820.
Kisvárday, Z. F., and Eysel, U. T. (1992). Cellular organization of reciprocal patchy networks in layer III of cat visual cortex (area 17). Neuroscience 46, 275–286.
Kisvárday, Z. F., Martin, K. A. C., Freund, T. F., Magloczky, Z., Whitteridge, D., and Somogyi, P. (1986). Synaptic targets of HRP-filled layer III pyramidal cells in the cat striate cortex. Exp. Brain Res. 64, 541–552.
Koch, C. (1999). Biophysics of Computation. Information Processing in Single Neurons. New York: Oxford University Press.
Kritzer, M., and Goldman-Rakic, P. S. (1995). Intrinsic circuit organization of the major layers and sublayers of the dorsolateral prefrontal cortex in monkeys. J. Comp. Neurol. 359, 131–143.
Levitt, J. B., Lewis, D. A., Yoshioka, T., and Lund, J. S. (1993). Topography of pyramidal neuron intrinsic connections in macaque monkey prefrontal cortex (areas 9 and 46). J. Comp. Neurol. 338, 360–376.
Lewis, D. A., and Lund, J. S. (1990). Heterogeneity of chandelier neurons in monkey neocortex: corticotropin-releasing factor and parvalbumin immunoreactive populations. J. Comp. Neurol. 293, 599–615.
Livingstone, M. S., and Hubel, D. H. (1984). Anatomy and physiology of a color system in the primate visual cortex. J. Neurosci. 4, 309–356.
Losonczy, A., Makara, J. K., and Magee, J. C. (2008). Compartmentalized dendritic plasticity and input feature storage in neurons. Nature 452, 436–441.
Lund, J. S., Yoshioka, T., and Levitt, J. B. (1993). Comparison of intrinsic connectivity in different areas of macaque monkey cerebral cortex. Cereb. Cortex 3, 148–162.
Mainen, Z. F., and Sejnowski, T. J. (1986). Influence of dendritic structure on firing pattern in model neocortical neurons. Nature 382, 363–366.
Malach, R. (1994). Cortical columns as devices for maximizing neuronal diversity. Trends Neurosci. 17, 101–104.
Malach, R., Amir, Y., Harel, M., and Grinvald, A. (1993). Relationship between intrinsic connections and functional architecture revealed by optical imaging and in vivo targeted biocytin injections in primate striate cortex. Proc. Natl. Acad. Sci. U.S.A. 90, 10469–10473.
Malonek, D., Tootell, R. B. H., and Grinvald, A. (1994). Optical imaging reveals the functional architecture of neurons processing shape and motion in owl monkey area MT. Proc. R. Soc. Lond., B, Biol. Sci. 258, 109–119.
Martin, K. A. C., and Whitteridge, D. (1984). Form, function and intracortical projections of spiny neurones in the striate visual cortex of the cat. J. Physiol. 353, 463–504.
Matsubara, J., Cynader, M., Swindale, N. V., and Stryker, M. P. (1985). Intrinsic projections within visual cortex: evidence for orientation-specific local connections. Proc. Natl. Acad. Sci. U.S.A. 82, 935–939.
Matsubara, J. A., Chase, R., and Thejomayen, M. (1996). Comparative morphology of three types of projection-identified pyramidal neurons in the superficial layers of cat visual cortex. J. Comp. Neurol. 366, 93–108.
McGuire, B. A., Gilbert, C. D., Rivlin, P. K., and Wiesel, T. N. (1991). Targets of horizontal connections in macaque primary visual cortex. J. Comp. Neurol. 305, 370–392.
Mel, B. (1999). “Why have dendrites? A computational perspective,” in Dendrites, eds G. Stuart, N. Spruston, and M. Häusser (New York: Oxford University Press), 271–289.
Melchitzky, D. S., González-Burgos, G., Barrionuevo, G., and Lewis, D. A. (2001). Synaptic targets of the intrinsic axon collaterals of supragranular pyramidal neurons in monkey prefrontal cortex. J. Comp. Neurol. 430, 209–221.
Melchitzky, D. S., Sesack, S. R., Pucak, M. L., and Lewis, D. A. (1998). Synaptic targets of pyramidal neurons providing intrinsic horizontal connections in monkey prefrontal cortex. J. Comp. Neurol. 390, 211–224.
Miller, E. K., Erickson, C. A., and Desimone, R. (1996). Neural mechanisms of visual working memory in prefrontal cortex of the macaque. J. Neurosci. 16, 5154–5167.
Miller, E. K., Li, L., and Desimone, R. (1993). Activity of neurons in anterior inferior temporal cortex during a short-term memory task. J. Neurosci. 13, 1460–1478.
Mitchison, G., and Crick, F. H. C. (1982). Long axons within the striate cortex: their distribution, orientation and patterns of connection. Proc. Natl. Acad. Sci. U.S.A. 79, 3661–3665.
Nelissen, K., Luppino, G., Vanduffel, W., Rizzolatti, G., and Orban, G. A. (2005). Observing others: multiple action representation in the frontal lobe. Science 310, 332–336.
Noppeney, U., Price, C. J., Penny, W. D., and Friston, K. J. (2005). Two distinct neural mechanisms for category-selective responses. Cereb. Cortex 16, 437–445.
ó Scalaidhe, S. P., Wilson, F. A. W., and Goldman-Rakic, P. S. (1997). Areal segregation of face-processing neurons in prefrontal cortex. Science 278, 1135–1138.
Page, T. L., Einstein, M., Duan, H., He, Y., Flores, T., Rolshud, D., Erwin, J. M., Wearne, S. L., Morrison, J. H., and Hof, P. R. (2002). Morphological alterations in neurons forming corticocortical projections in the neocortex of aged Patas monkeys. Neurosci. Lett. 317, 37–41.
Pandya, D. N., and Yeterian, E. H. (2000). “Comparison of prefrontal architecture and connections,” in The Prefrontal Cortex, eds A. C. Roberts, T. W. Robbins, and L. Weiskrantz (Oxford: Oxford University Press), 51–66.
Passingham, R., Stephan, K. E., and Kötter, R. (2002). The anatomical basis of functional localization in the cortex. Nat. Neurosci. 3, 606–616.
Passingham, R. E., Toni, I., and Rushworth, M. F. S. (2000). Specialisation within the prefrontal cortex: the ventral prefrontal cortex and associative learning. Exp. Brain Res. 133, 103–113.
Petralia, R. S., Yokotani, N., and Wenthold, R. J. (1994a). Light and electron microscope distribution of the NMDA receptor subunit NMDAR1 in the rat nervous system using a selective antipeptide antibody. J. Neurosci. 14, 667–696.
Petralia, R. S., Wang, Y. X., and Wenthold, R. J. (1994b). The NMDA receptor subunits NR2A and NR2B show histological and ultrastructural localization patterns similar to those of NR1. J. Neurosci. 14, 6102–6120.
Petralia, R. S., Wang, Y.-X., and Wenthold, R. J. (1994c). Histological and ultrastructural localization of kainate receptor subunits, KA2 and GluR6/7, in the rat nervous system using selective antipeptide antibodies. J. Comp. Neurol. 349, 85–110.
Petrides, M. (1987). “Conditional learning and the primate prefrontal cortex,” in The Frontal Lobes Revisited, ed. E. Perecman (New York, IRBN Press), 91–108.
Petrides, M. (1991). Functional specialization within the dorsolateral prefrontal cortex for serial order memory. Proc. R. Soc. Lond., B, Biol. Sci. 246, 299–306.
Petrides, M. (1998). “Specialised systems for the processing of mnemonic information within the primate frontal cortex,” in The Prefrontal Cortex, eds A. C. Roberts, T. W. Robbins, and L. Weiskrantz (Oxford: Oxford University Press), 103–106.
Petrides, M. (2000). “Mapping prefrontal cortical systems for the control of cognition,” in Brain Mapping: The Systems, eds A. W. Toga and J. C. Mazziotta (San Diego: Academic), 159–176.
Petrides, M., and Pandya, D. N. (1988). Association fiber pathways to the frontal cortex from the superior temporal region in the rhesus monkey. J. Comp. Neurol. 273, 52–66.
Petrides, M., and Pandya, D. N. (1999). Dorsolateral prefrontal cortex: comparative cytoarchitectonic analysis in the human and the macaque monkey brain and corticocortical connection patterns. Eur. J. Neurosci. 11, 1011–1036.
Petrides, M., and Pandya, D. N. (2001). Comparative cytoarchitectonic analysis of the human and the macaque dorsolateral prefrontal cortex and corticocortical connection patterns in the monkey. Eur. J. Neurosci. 16, 291–310.
Poirazi, P., and Mel, B. (2001). Impact of active dendrites and structural plasticity on the storage capacity of neural tissue. Neuron 29, 779–796.
Preuss, T. M., and Goldman-Rakic, P. S. (1991a). Architectonics of the parietal and temporal association cortex in the strepsirhine primate Galago compared to the anthropoid Macaca. J. Comp. Neurol. 310, 475–506.
Preuss, T. M., and Goldman-Rakic, P. S. (1991b). Ipsilateral cortical connections of granular frontal cortex in the strepsirhine primate Galago, with comparative comments on anthropoid primates. J. Comp. Neurol. 310, 507–549.
Preuss, T. M., and Goldman-Rakic, P. S. (1991c). Myelo- and cytoarchitecture of the granular frontal cortex and surrounding regions in the strepshrine primate Galago and the anthropoid primate Macaca. J. Comp. Neurol. 310, 429–474.
Pucak, M. L., Levitt, J. B., Lund, J. S., and Lewis, D. A. (1996). Patterns of intrinsic and associational circuitry in monkey prefrontal cortex. J. Comp. Neurol. 376, 614–630.
Rall, W. (1959). Branching dendritic trees and motorneuron membrane resistivity. Exp. Neurol. 1, 491–527.
Rall, W. (1989). “Cable theory for dendritic neurons,” in Methods in Neuronal Modeling: From Synapses to Networks, eds C. Koch and I. Segev (Cambridge, MA: MIT), 9–62.
Rall, W., Burke, R. E., Holmes, W. R., Jack, J. J. B., Redman, S. R., and Segev, I. (1992). Matching dendritic neuron models to experimental data. Physiol. Rev. 72, 159–186.
Roberts, A. C., and Wallis, J. D. (2000). Inhibitory control and affective processing in the prefrontal cortex: neuropsychological studies in the common marmoset. Cereb. Cortex 10, 252–262.
Rockland, K. S. (1985). A reticular pattern of intrinsic connections in primate area V2 (area 18). J. Comp. Neurol. 235, 467–478.
Rockland, K. S., and Lund, J. S. (1982). Widespread periodic intrinsic connections in the tree shrew visual cortex. Science 215, 1532–1534.
Rockland, K. S., and Lund, J. S. (1983). Intrinsic laminar lattice connections in primate visual cortex. J. Comp. Neurol. 216, 303–318.
Rockland, K. S., Lund, J. S., and Humphrey, A. L. (1982). Anatomical banding of intrinsic connections in striate cortex of tree shrews (Tupaia glis). J. Comp. Neurol. 209, 41–58.
Rolls, E. T. (2000). “The orbitofrontal cortex,” in The Prefrontal Cortex, eds A. C. Roberts, T. W. Robbins, and L. Weiskrantz (Oxford: Oxford University Press), 67–86.
Roth, G., and Dicke, U. (2005). Evolution of the brain and intelligence. Trends Cogn. Sci. 9, 250–257.
Rothnie, P., Kabaso, D., Hof, P. R., Henry, B. I., and Wearne, S. L. (2005). Functionally relevant measures of spatial complexity in neuronal dendritic arbors. J. Theor. Biol. 238, 505–526.
Sakai, K., Rowe, J. B., and Passingham, R. E. (2002). Active maintenance in prefrontal area 46 creates distractor-resistant memory. Nat. Neurosci. 5, 479–484.
Schofield, B. R., Hallman, L. E., and Lin, C.-S. (1987). Morphology of corticotectal cells in the primary visual cortex of hooded rats. J. Comp. Neurol. 261, 85–97.
Segev, I., and Rall, W. (1998). Excitable dendrites and spines: earlier theoretical insights elucidate recent direct observations. Trends Neurosci. 21, 453–460.
Shinomoto, S., Miyazaki, Y., Tamura, H., and Fujita, I. (2005). Regional and laminar differences in in vivo firing patterns of primate cortical neurons. J. Neurophysiol. 94, 567–575.
Sholl, D. A. (1953). Dendritic organization in the neurons of the visual and motor cortices of the cat. J. Anat. 87, 387–406.
Soloway, A. S., Pucak, M. L., Melchitzky, D. S., and Lewis, D. A. (2002). Dendritic morphology of callosal and ipsilateral projection neurons in monkey prefrontal cortex. Neuroscience 109, 461–471.
Spruston, N. (2008). Pyramidal neurons: dendritic structure and synaptic integration. Nat. Rev. Neurosci. 9, 206–221.
Spruston, N., Stuart, G., and Häusser, M. (1999). “Dendritic integration,” in Dendrites, eds G. Stuart, N. Spruston, and M. Häusser (New York: Oxford University Press), 231–270.
Stepanyants, A., Hof, P. R., and Chklovskii, D. B. (2002). Geometry and structural plasticity of synaptic connectivity. Neuron 34, 275–288.
Stuart, G. J., Spruston, N., Sackman, B., and Häusser, M. (1997). Action potential initiation and backpropagation in neurons of the mammalian CNS. Trends Neurosci. 20, 125–131.
Treves, A. (2005). Frontal latching networks: a possible neural basis for infinite recursion. Cogn. Neuropsychol. 22, 276–291.
T’so, D. Y., and Gilbert, C. D. (1988). The organization of chromatic and spatial interactions in the primate striate cortex. J. Neurosci. 8, 1712–1727.
T’so, D. Y., Gilbert, C. D., and Wiesel, T. N. (1986). Relationships between horizontal interactions and functional architecture in the cat striate cortex as revealed by cross-correlation analysis. J. Neurosci. 6, 1160–1170.
Valverde, F. (1967). Apical dendritic spines of the visual cortex and light deprivation in the mouse. Exp. Brain Res. 3, 337–352.
Vetter, P., Roth, A., and Häusser, M. (2001). Propagation of action potentials in dendrites depends on dendritic morphology. J. Neurophysiol. 85, 926–937.
Vogt, C., and Vogt, O. (1919). Allgemeine ergebnisse unserer hirnforschung. J. Psychol. Neurol. 25, 279–462.
Walker, A. E. (1940). A cytoarchitectural study of the prefrontal areas of the macaque monkey. J. Comp. Neurol. 73, 59–86.
Wang, X.-J. (2001). Synaptic reverberation underlying mnemonic persistent activity. Trends Neurosci. 24, 455–463.
White, E. L. (1989). Cortical Circuits: Synaptic Organization of the Cerebral Cortex. Structure, Function and Theory. Boston: Birkhaüser.
Wilson, F. A. W., ó Scalaidhe, S. P., and Goldman-Rakic, P. S. (1993). Dissociation of object and spatial processing domains in primate prefrontal cortex. Science 260, 1955–1958.
Keywords: macaque, baboon, human, guenon, spine, primate, cognition, connectivity
Citation: Elston GN, Benavides-Piccione R, Elston A, Manger PR and DeFelipe J (2011) Pyramidal cells in prefrontal cortex of primates: marked differences in neuronal structure among species. Front. Neuroanat. 5:2. doi: 10.3389/fnana.2011.00002
Received: 15 November 2010;
Paper pending published: 13 December 2010;
Accepted: 11 January 2011;
Published online: 10 February 2011.
Edited by:
Agustín González, Universidad Complutense de Madrid, SpainReviewed by:
Kathleen S. Rockland, Massachusetts Institute of Technology, USAPatrick R. Hof, Mount Sinai School of Medicine, USA
Copyright: © 2011 Elston, Benavides-Piccione, Elston, Manger and DeFelipe. This is an open-access article subject to an exclusive license agreement between the authors and Frontiers Media SA, which permits unrestricted use, distribution, and reproduction in any medium, provided the original authors and source are credited.
*Correspondence: Guy N. Elston, Centre for Cognitive Neuroscience, 60 Duke Road, Doonan, Sunshine Coast, QLD 4562, Australia. e-mail:Z3V5ZWxzdG9uQHlhaG9vLmNvbQ==