 Amir F. Al-Bakri1*
 Ahmed Tahseen Muslim2
 Moneer K. Faraj3Wamedh Esam Matti2
 Radana Vilimkova Kahankova4,5Dariusz Mikolajewski6,7
 Waldemar Karwowski8
 Aleksandra Kawala-Sterniuk9*
- 1Department of Biomedical Engineering, College of Engineering, University of Babylon, Babylon, Iraq
- 2Al-Witri Hospital for Neurosciences, Baghdad, Iraq
- 3Department of Clinical Neurophysiology, College of Medicine, University of Baghdad, Baghdad, Iraq
- 4Faculty of Electrical Engineering, Automatic Control and Informatics, Opole University of Technology, Opole, Poland
- 5Department of Cybernetics and Biomedical Engineering, Faculty of Electrical Engineering and Computer Science, VSB–Technical University of Ostrava, Ostrava, Czechia
- 6Institute of Computer Science, Kazimierz Wielki University in Bydgoszcz, Bydgoszcz, Poland
- 7Neuropsychological Research Unit, 2nd Clinic of the Psychiatry and Psychiatric Rehabilitation, Medical University in Lublin, Lublin, Poland
- 8Computational Neuroergonomics Laboratory, Department of Industrial Engineering and Management Systems, University of Central Florida, Orlando, FL, United States
- 9Department of Artificial Intelligence, Faculty of Information and Communication Technology, Wroclaw University of Science and Technology, Wroclaw, Poland
Introduction: Accurate localization of the epileptogenic zone is essential for surgical treatment of drug-resistant epilepsy. Standard presurgical evaluations rely on multimodal neuroimaging techniques, but these may be limited by availability and interpretive challenges. This study aimed to assess the concordance between zones identified by ictal semiology and a novel distributed electrical source localization technique, CLARA, and to evaluate their impact on postsurgical outcomes.
Methods: This retrospective study included 16 patients with at least three recorded seizures. Ictal semiology was analyzed subjectively using video electroencephalography (VEEG) by a multidisciplinary team of neurologists, neurophysiologists, and radiologists, who determined the presumed epileptogenic zone at the lobar level. CLARA was subsequently applied to identify the computed zone based on ictal and/or interictal biomarker activities. The concordance between the presumed and computed zones was assessed qualitatively. Postsurgical outcomes were examined in relation to the extent of resection of the CLARA-defined zones.
Results: Among thirteen patients with sufficient data for analysis, qualitative comparison showed 77% concordance and 23% partial concordance between the presumed and computed zones. Postsurgical follow-up revealed seizure freedom in one patient with cavernoma following complete resection of the CLARA-defined zone. In contrast, patients with incomplete resection of this region continued to experience seizures.
Discussion: The findings support the potential value of CLARA as an adjunctive neuroimaging technique in the presurgical evaluation of epilepsy. By providing an additional layer of verification, CLARA may improve the accuracy of epileptogenic zone localization when used alongside established modalities such as PET, SPECT, fMRI, and MRI. Its adaptability and lower resource requirements suggest particular utility in centers with limited access to advanced medical equipment and specialized personnel. Broader implementation of CLARA could enhance presurgical decision-making and contribute to improved surgical outcomes for epilepsy patients.
1 Introduction
Epilepsy affects ~1% of the global population, with around 30% of patients being resistant to medical treatment (Sander, 2003). For those with drug-resistant focal epilepsy, surgical removal of the seizure-generating area is often an effective option (Kwan and Brodie, 2000). Successful identification and excision of this region can lead to favorable outcomes, with 30%–85% of patients achieving seizure freedom (Rosenow and Lüders, 2001; Kim et al., 2024).
Epilepsy is frequently associated with clinical signs supported by abnormal electrical activity originating in specific brain regions. These clinical signs, or semiology, can manifest as significant changes in motor or behavioral activity, with or without loss of consciousness (Eadie and Bladin, 2001). Semiology is valuable for determining the location of the symptomatogenic zone, which is typically close to the epileptogenic zone, and can achieve up to 74% lateralization and 77% localization accuracy (Chowdhury et al., 2021; Elwan et al., 2018). Relevant semiology is usually obtained through careful analysis of the patient's history, video telemetry, and electroencephalogram (EEG) recordings during multiple events (Frazzini et al., 2022; Hirfanoglu et al., 2007; Otárula and Schuele, 2024). However, interpreting semiology can be complex and requires expert clinicians for accurate diagnosis and presurgical evaluation (Foldvary-Schaefer and Unnwongse, 2011; Otárula and Schuele, 2024).
In addition to clinical presentation, a multimodal presurgical examination is crucial for determining the location and extent of the seizure origin. Standard approaches include structural and functional MRI, PET, SPECT, conventional EEG, video-EEG, and neuropsychological testing (Ryvlin et al., 2014; Barnova et al., 2023; Sharma et al., 2019; Rikir et al., 2020). Neuroimaging tools can localize the seizure onset zone with up to 80% accuracy, depending on whether epileptic lesions are present (Knowlton et al., 2008; Barnova et al., 2023). This is important because the sensitivity of scalp recordings is low, particularly in non-lesional or extra-temporal lobe epilepsy. Moreover, such recordings are typically analyzed visually, leading to subjective interpretations (Singh et al., 2022; Toole et al., 2019; Kawala-Sterniuk et al., 2021; Barnova et al., 2023). Despite these challenges, scalp studies remain valuable for source localization (Eom, 2023; Karikari and Koshechkin, 2023).
The findings from the aforementioned tools are somewhat subjective, relying heavily on the visual analysis and expertise of the diagnostician. Therefore, incorporating computational techniques to reduce subjectivity is necessary to enhance presurgical evaluation. Electrical source localization (ESL) is a non-invasive method that utilizes conventional brainwave recordings and applies empirical models of dipole and distributed source localization for imaging the epileptic brain (Plummer et al., 2008; Asadzadeh et al., 2020; Rikir et al., 2020). ESL employs interictal and ictal activity, such as spikes and slow delta waves, in conjunction with structural MRI, to determine the volumetric location of the seizure generator within a realistic head model for patients (Singh et al., 2022; Herrendorf et al., 2000; Michel and Brunet, 2019).
With the increase in the number of EEG channels, the sensitivity of ESL in localizing the epileptogenic focus can reach up to 94%, surpassing other imaging tools such as PET (up to 66%), SPECT (up to 64%), and MRI for lesional epilepsy (up to 76%) (Brodbeck et al., 2011; Duez et al., 2019; Brinkmann, 2024). Accurately determining and safely resecting the epileptogenic zone significantly enhances the likelihood of achieving seizure freedom for patients. In this study, we applied a novel neuroimaging ESL technique called Classic LORETA Recursively Applied (CLARA) (Irandoost et al., 2023) using BESA Research 7.1 software (Hoechstetter et al., 2010) and assessed its performance. This technique is intended as an additional neuroimaging tool to verify and enhance the presurgical evaluation conducted with standard tools at our hospital, such as semiology, MRI, and video-EEG, particularly for patients being considered for lobectomy (Kim et al., 2024; Rampp et al., 2024).
BESA is a reliable and user-friendly commercial software that offers several advanced ESL models, including Dipole, CLARA, LORETA, and Cortical-CLARA, each with distinct advantages (Iordanov et al., 2014, 2018):
• Dipole model—ideal for representing small clusters of active neurons, such as those in epileptic regions.
• CLARA and LORETA—suitable for modeling widespread brain activity, including both superficial and deep structures, making them effective for analyzing fundamental brain rhythms such as alpha waves.
• Cortical-CLARA model—focuses on estimating neural activity localized to the cortical surface.
For our analysis, which involves both epileptiform discharge activity and fundamental rhythms (e.g., alpha, beta), we chose CLARA over LORETA. CLARA outperforms LORETA by producing clearer source images with reduced blurring and better differentiation of closely located brain regions. It enhances spatial resolution by iteratively excluding low-activity regions, recalculating the source distribution, and retaining the areas with the strongest activation.
2 Materials and methods
In this study, 24-h video EEG recordings were monitored and analyzed by neurophysiologists and neurologists, whose expertise ensured a thorough examination of the data and provided critical insights into the neurophysiological aspects under investigation.
2.1 Data acquisition
Clinical data were obtained from 24-h video-EEG (VEEG) recordings of 16 patients diagnosed with epilepsy. These recordings were conducted retrospectively between 2021 and 2024 at the Epilepsy Monitoring Unit of Dr. Saad Al-Witry Hospital for Neurosciences in Baghdad, Iraq. Each recording was performed at a sampling rate of 256 Hz using 19 surface electrodes placed according to the international 10–20 system.
The clinical evaluation process involved both neurologists and neurophysiologists, who used VEEG recordings in combination with MRI scans to localize the symptomatogenic zone at the lobar level and define the seizure onset zone (SOZ). Subsequently, a biomedical engineering expert specializing in brain signal processing applied the CLARA method (Classical LORETA Analysis Recursively Applied) to further refine the localization of the epileptogenic zone.
All patient data were collected in full compliance with ethical and regulatory standards. Written informed consent was obtained from all participants prior to inclusion in the study. The research was conducted in accordance with the Declaration of Helsinki and received ethical approval from the Ministry of Health and Environment of Iraq, the Al-Russafa Health Directorate, and Dr. Saad Al-Witry Hospital for Neurosciences (Approval No. 2, dated July 14th, 2024; Protocol/Form Nos. 20240714 and 02/2021).
This study was conducted within a hospital setting specializing in adult neurology; accordingly, pediatric patients were not included. Additionally, patient selection was non-random and based on convenience-based criteria, for example, the inclusion of adult patients from our institution who were medicine-resistant and considered good candidates for lobectomy.
To remove artifacts, a 1 − 70 Hz band-pass filter was applied. All analyses were conducted retrospectively using BESA Research 7.1 (trial version) and the Natus EEG machine, with the option to export data in European Data Format (EDF). Although the initial plan was to test 16 patients with at least three clear seizures, only 14 were ultimately selected for analysis.
2.2 Criteria for patient and seizure feature detection
Epileptic features appearing during the ictal phases of seizure onset and/or epileptiform discharge activities occurring during the interictal phases were visually inspected and labeled after applying a common average montage. Only 14 patients, aged 16–45 years, who exhibited prominent epileptic characteristics in VEEG, clear semiology, and a clear MRI report were selected for CLARA analysis. These features varied among patients.
The following epilepsy characteristics were considered (Beniczky et al., 2013; Cabrerizo et al., 2011; Foldvary et al., 2001; Mattioli et al., 2022):
1. Rhythmic activity—delta, theta, and alpha waves.
2. Paroxysmal fast activity—rhythmic activity above 13 Hz, such as beta and gamma waves.
3. Epileptiform discharge activity—spikes and spike-wave complexes.
From the entire recording of each patient, at least three suitable 5-min EEG windows containing clear ictal and/or interictal features were extracted and used for the CLARA analyses.
2.3 Averaging the repetitive waveforms
Using BESA Research 7.1, an additional band-pass filter (0.5 − 30 Hz) was applied to the 5-min EEG windows. To compute the grand average of similar repetitive waveforms, the following steps, based on Ortiz-Mantilla et al. (2012), were followed:
1. Main channel identification—the main channel was selected through visual inspection, identifying the channel with the most prominent epileptic features (e.g., spikes, beta activity) and highest amplitude relative to others.
2. Positive peaks marking and 2D voltage head distribution generation—positive peaks in the selected channel were manually marked, and a 2D voltage head distribution was generated to visualize spatial voltage variations across all channels.
3. Peaks with similar distribution labeling—peaks with similar temporal and spatial distributions were grouped as pattern 1. Due to variability, strict pattern definitions were not always feasible; therefore, classification focused on visually similar peaks.
4. Fixed time window definition—a fixed time window was set around each peak to capture the waveform duration: ±12.5 ms for delta waves at 2 Hz, ±2.5 ms for alpha waves at 10 Hz, and custom windows for spikes based on their width.
5. Repetitive waveform averaging across all channels—the selected peaks were averaged across all channels to produce a grand average waveform, which was then used for source localization analysis.
2.4 Source localization analyses
Due to the unavailability of individual MRI images in the hospital database, an age-matched average MRI template provided by the BESA software was used to reconstruct a realistic head model.
The average waveform, within its defined time window across channels, was selected for epileptic source localization analysis using BESA Research 7.1 (Figure 1). In Figure 2, examples of 2D voltage distributions for six peaks are shown. Peaks labeled as pattern 1 (blue solid arrow) exhibited similar 2D mappings, while peaks with differing 2D mappings (red dashed arrow) were excluded from further analysis. Figures 1, 2 show representative ictal epileptic characteristics used in source localization for different patients. Only peaks with matching 2D voltage distributions were labeled as pattern 1 for each characteristic.
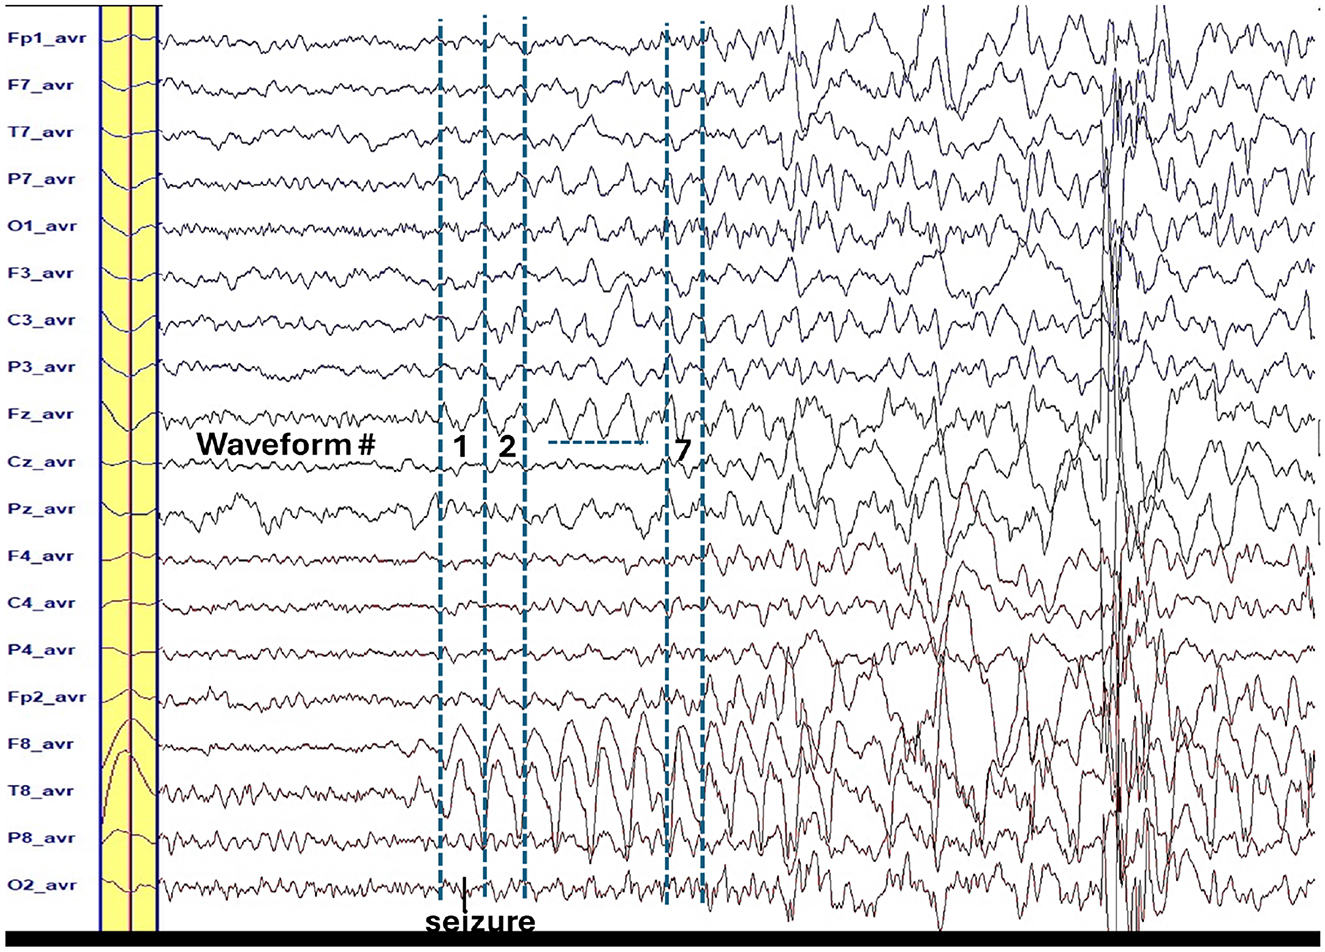
Figure 1. The yellow bar is the average waveform for the repetitive seven waveforms of the ictal slow wave (2 Hz). The peaks of these waveforms have similar 2-D voltage distribution (see Figure 2). Time window is ±60 ms around the peak that is the highest at the T8-avr channel.
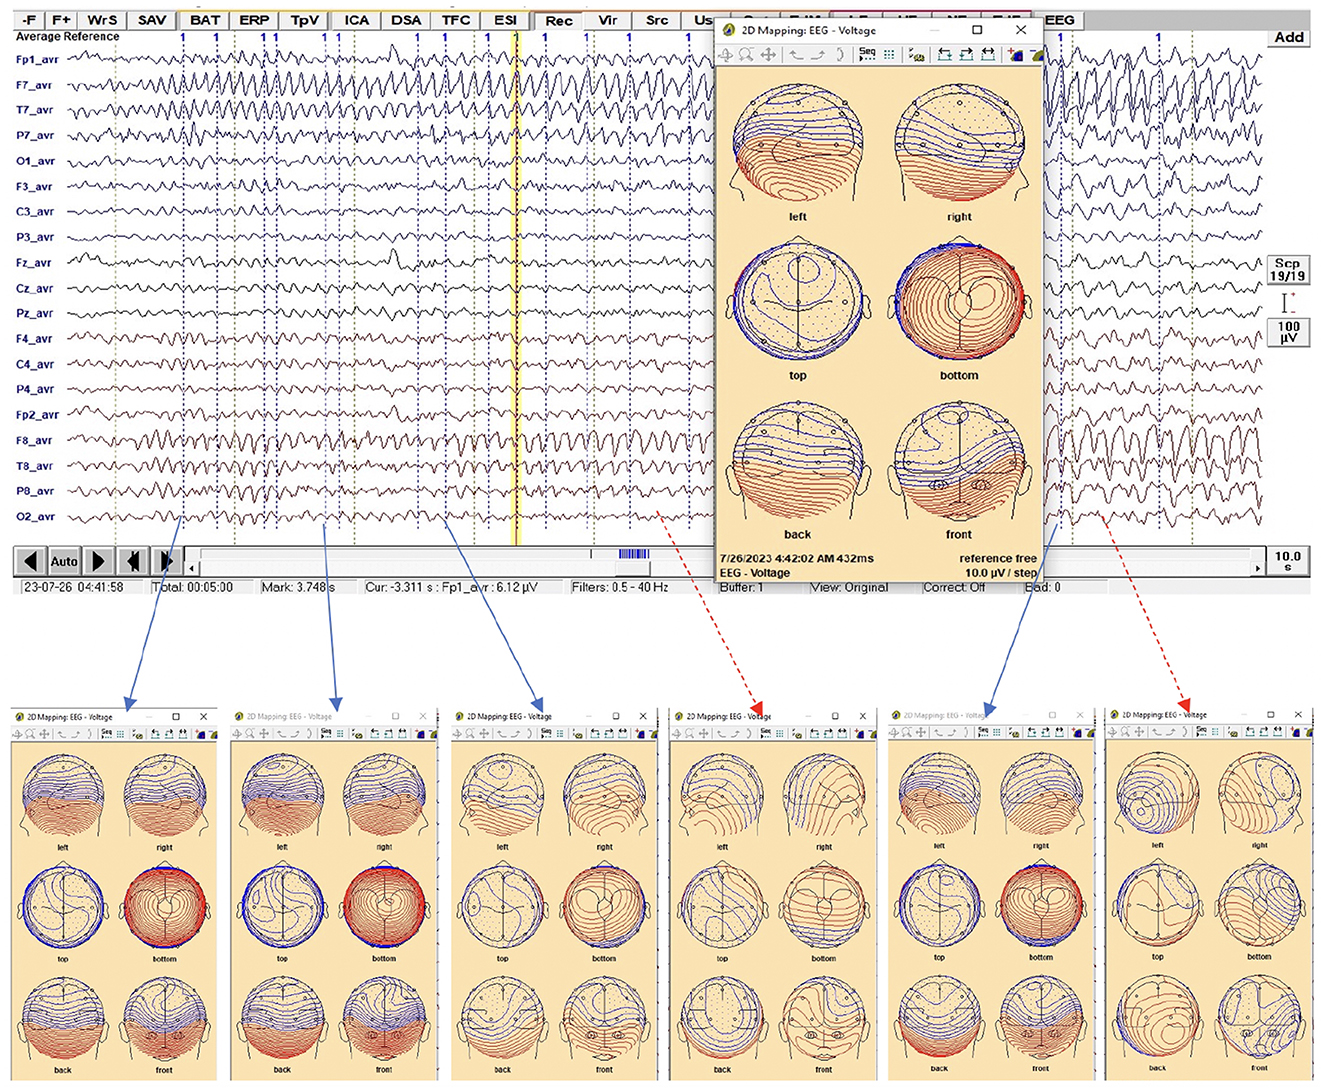
Figure 2. EEG trace during the ictal phase that has the epileptic feature which is alpha for this patient. The only peaks along the feature that provided similar 2-D voltage distribution were selected and labeled as pattern 1, where the 2-D mapping window is displayed when a right click is made at any time point on the EEG (yellow vertical line).
For source localization, the average waveform was co-registered with the age-appropriate MRI template. Principal component analysis (PCA) was then applied to the grand average waveform across channels to reduce dimensionality and identify the most significant components with the highest variance (Figure 3, top panel).
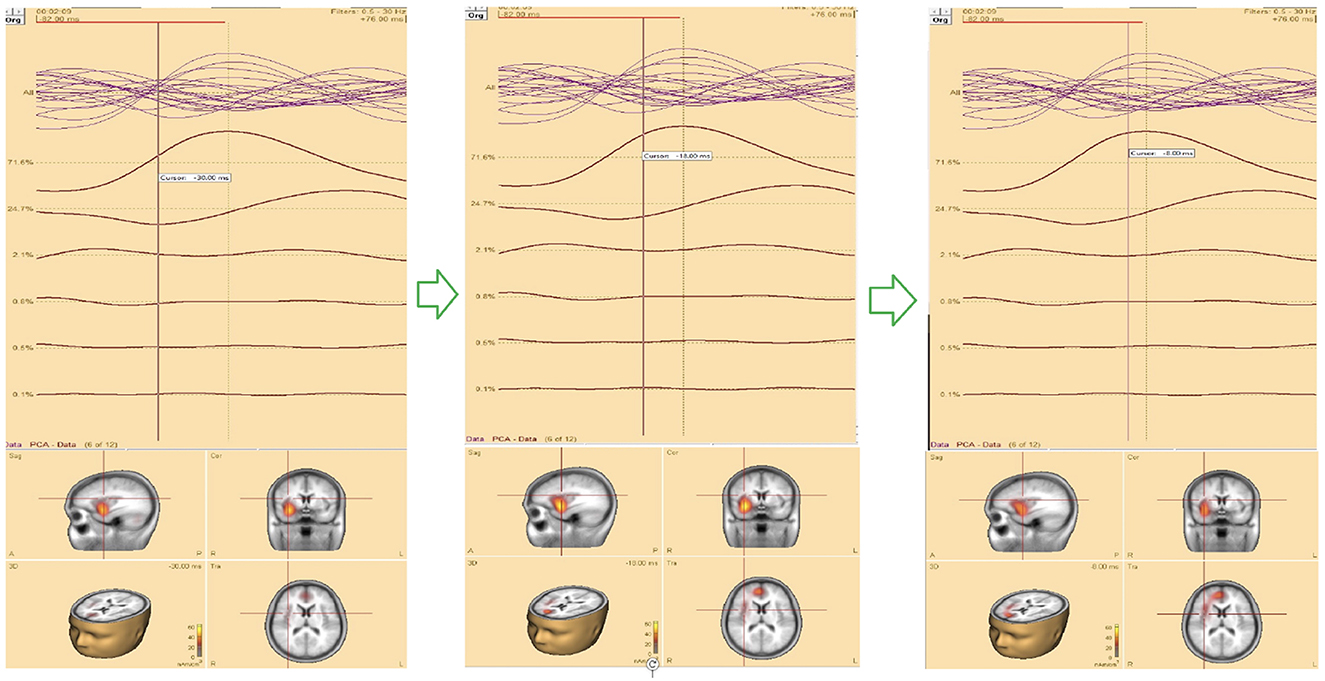
Figure 3. (Top) The upper trace is the butterfly of the average waveform of all channels (100 ms duration). The lower traces are the PCA components of the average waveform that are showed from high to low based on their contributed variances, where the first component has the highest variance (98.1%) when the rising part of the average waveform is selected (35 ms duration), and (bottom) Initial SOZ and its extension corresponding to different time. Left: only initial SOZ at temporal lobe (@t = −30 ms), middle: SOZ at temporal lobe and slightly extension into frontal lobe (@t = −18 ms), right: complete SOZ at temporal and frontal lobes (@t = −6 ms).
Theoretically, the rising segment of epileptic signals—from onset to maximum peak-contains the most critical information about onset activity. Analyzing this portion improves the accuracy of source localization (Ding et al., 2007; Lantz et al., 2003; Mălîia et al., 2016).
In this study, we refined and selected the rising segment of the average waveform, ensuring that the first PCA component accounted for ≥95% of the total variance. This approach minimized the residual signal between the modeled and observed EEG, thereby increasing the accuracy of focal area identification. The selected segment was then analyzed using the Classical LORETA Recursively Applied (CLARA) method (Iordanov et al., 2014, 2018) (see Figure 2).
One advantage of BESA Research 7.1 is its ability to navigate through the selected EEG signal (e.g., the rising segment) and identify the corresponding seizure onset zone (SOZ). This functionality was particularly valuable for pinpointing the initial SOZ and mapping its extension.
2.5 Epileptic zones concordance
Following presurgical epilepsy evaluation guidelines, the clinical findings from semiology, supported independently by VEEG and MRI, were obtained by specialists from different disciplines. The information from each specialty was then integrated to identify the candidate epileptic zone.
To qualitatively estimate the overlap between visually identified brain regions, we compared the presumed epileptic zone, determined by neurologists, neurophysiologists, and radiologists, with the computed epileptic zone obtained using CLARA (Tortora et al., 2022). The analysis focused on the four main cerebral lobes (frontal, temporal, parietal, occipital) without further subdivision.
The class of concordance was defined as follows:
1. Concordant: the presumed and computed epileptic zones overlapped entirely.
2. Partially concordant: the zones overlapped within the same region but were not fully aligned.
3. Discordant-ipsilateral: the zones were in different regions within the same hemisphere.
4. Discordant-contralateral: the zones were located in opposite hemispheres.
5. Uninformative: no localization could be determined.
Partially concordant refers to overlapping zones within the same region (e.g., temporal lobe), but not fully aligned. Discordant describes zones in different regions (e.g., frontal vs. temporal lobe). Ipsilateral means the zones are in the same hemisphere (left or right). Contralateral refers to zones in opposite hemispheres (left vs. right).
3 Results
The demographics, semiology, presumed and computed seizure onset zones (SOZ), and concordance classifications are summarized in Table 1. The table also lists seizure states (interictal and ictal) and identifies the EEG channels with the most significant epileptic features.
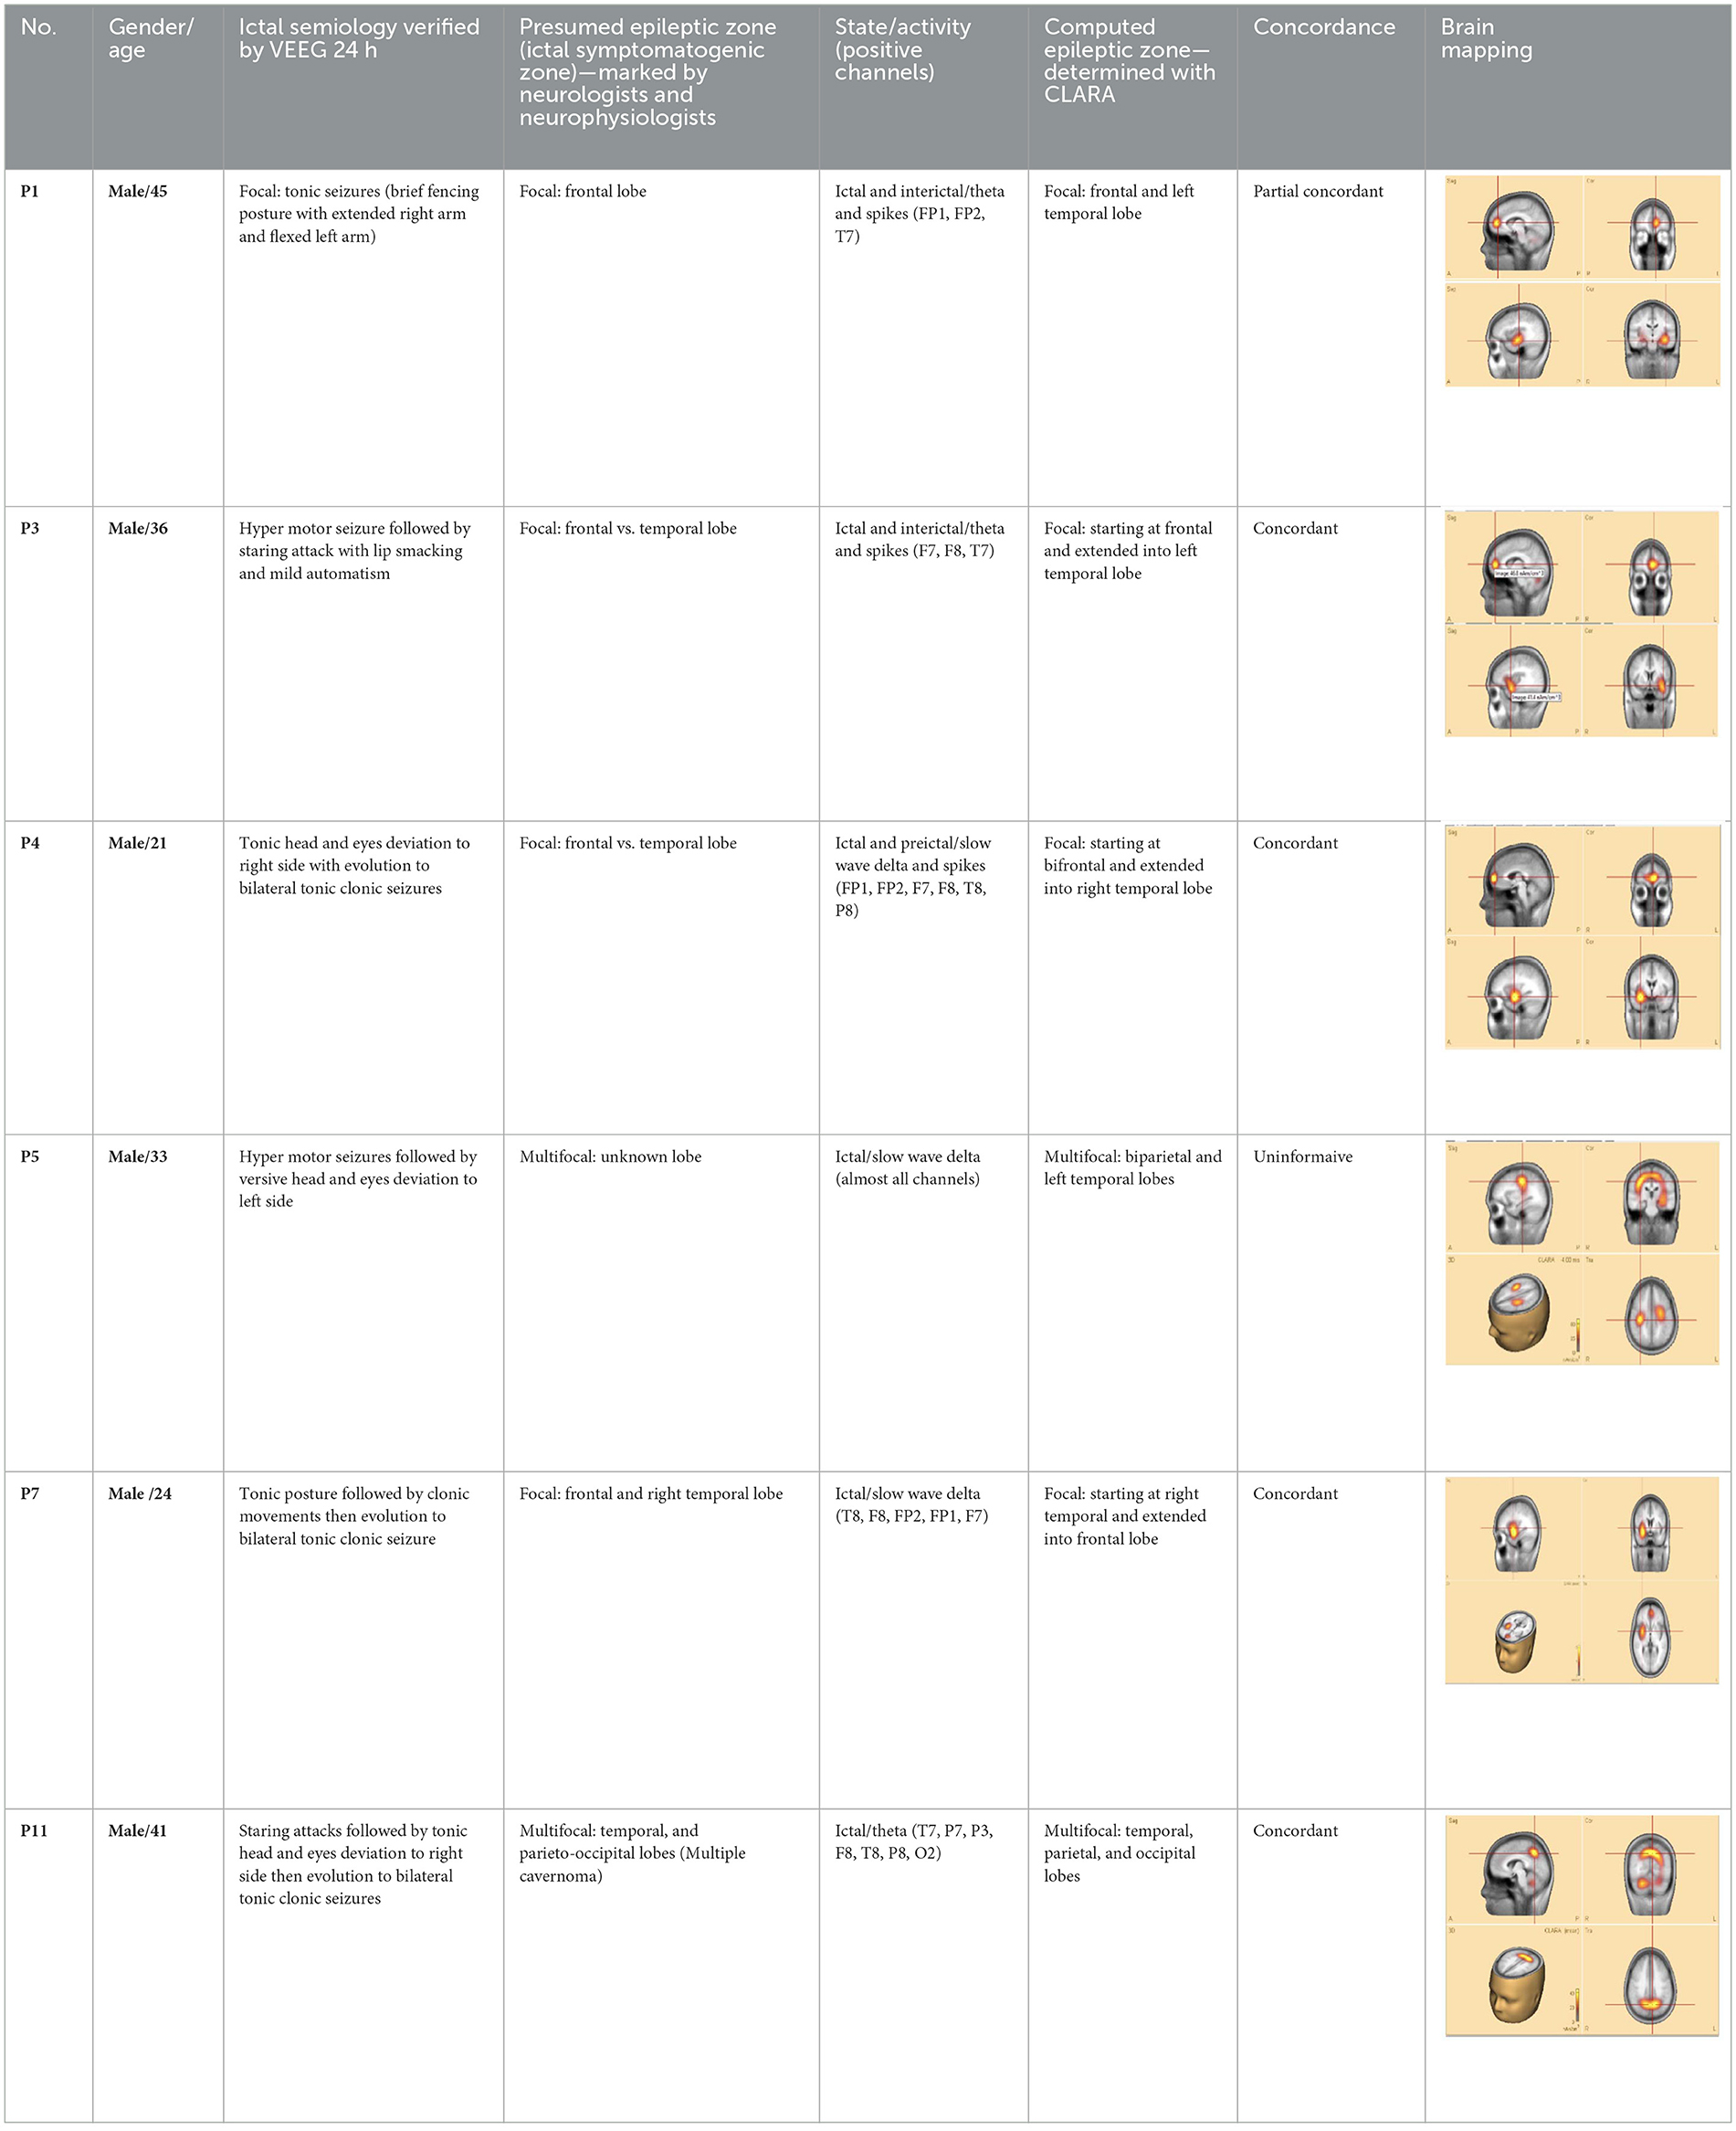
Table 1. Clinical data, presumed zone and computed zone supported by CLARA brain mapping, and concordance level.
Each patient exhibited unique semiology. Classification was based on the literature (Blair, 2012; Fotedar et al., 2022; Jan and Girvin, 2008; Menghi et al., 2018) and the authors' clinical expertise. Fourteen patients were diagnosed with focal epilepsy and two with multifocal epilepsy. Among focal epilepsy cases, three patients had unilateral temporal lobe epilepsy (left or right). These temporal epilepsy patients underwent surgical intervention and were followed for at least 1 year postoperatively.
Of the 16 patients, 14 demonstrated clear, high-amplitude ictal and/or interictal epileptic features during 24-h EEG monitoring. These features were consistent across the recording period. They included regular or irregular slow delta, theta, alpha, beta, arrhythmic waves, and spike or spike–wave complexes. The expression of these features varied among patients. In two cases (patients 15 and 16), the ictal features were either too low in amplitude or masked by other EEG patterns, such as sleep activity. Thus, these patients were excluded from CLARA analysis.
When epileptic features stood out above baseline, the 2D voltage distribution maps for most waveform peaks within the pattern were uniform and consistent (see Figure 2). Using the averaged waveform from this pattern with an appropriate time window proved advantageous for source localization.
Analysis revealed that the first PCA component accounted for over 95% of the variance. Selecting the rising portion of the average waveform with optimized duration increased this effect. Focusing on this segment improved the precision of SOZ localization.
To assess seizure onset dynamics and identify potential propagation zones, CLARA was applied to multiple time points within the rising phase of the epileptic feature. This analysis revealed that in five patients (P1, P2, P8, P9, and P10), the SOZ remained consistent within a single lobe.
Three patients (P4, P5, P11) exhibited seizure onset zones (SOZ; regions where seizures originate) in multiple lobes, while six patients (P3, P6, P7, P12, P13) demonstrated SOZ with extensions into different lobes (Figure 3, bottom panel). For example, in patient P7, the initial SOZ and its subsequent propagation to other lobes could be tracked across different time points within the selected rising phase of the epileptic waveform. At the conclusion of the study, three of the 16 patients were excluded from the concordance analysis. Two patients (P15, P16) were excluded prior to CLARA computation (Combinatorial Localization Algorithm for Rapid Analysis; a computational tool for identifying seizure onset zones) due to the absence of a clear ictal pattern, and one patient (P5) was excluded after CLARA analysis because of a multifocal epileptic presentation with an indeterminate seizure onset. Among the remaining patients, the presumed and computed SOZ completely overlapped in 10 cases and partially overlapped in 3 cases, corresponding to a concordance rate of 77% and a partial concordance rate of 23%.
To empirically validate the clinical relevance of the CLARA method (Combinatorial Localization Algorithm for Rapid Analysis), we examined the relationship between post-surgical outcomes and resection of the CLARA-identified area. Three patients who underwent lobectomy (surgical removal of a brain lobe) were available for retrospective analysis:
1. Patient P11—the CLARA-identified area corresponded to the center of the epileptic focus involving multiple cavernomas in the left temporal and parieto-occipital lobes. These lesions had been surgically resected several years earlier at our hospital. The patient has remained seizure-free with medication for more than 2 years. Retrospective analysis of pre-surgical VEEG confirmed that the CLARA-identified zone was located entirely within the previously resected region, illustrating a case in which surgical targeting of the CLARA area was associated with successful seizure control.
2. Patients P2 and P8—both were initially evaluated at our hospital, with preliminary reports indicating left temporal epilepsy without further specification. Each subsequently underwent left temporal lobectomy at different centers, but neither experienced clinical improvement. Upon returning for follow-up, we applied the ESL methodology, which revealed that the CLARA-identified area was located in the left mesial and/or lateral temporal lobe. In both cases, surgical resection had been confined primarily to the lateral temporal lobe (Figure 4). The most plausible explanation is that the main epileptic focus identified by CLARA was either incompletely resected or missed entirely. However, other contributing factors, such as surgical technique, underlying pathology, or network-level epilepsy mechanisms, cannot be excluded.
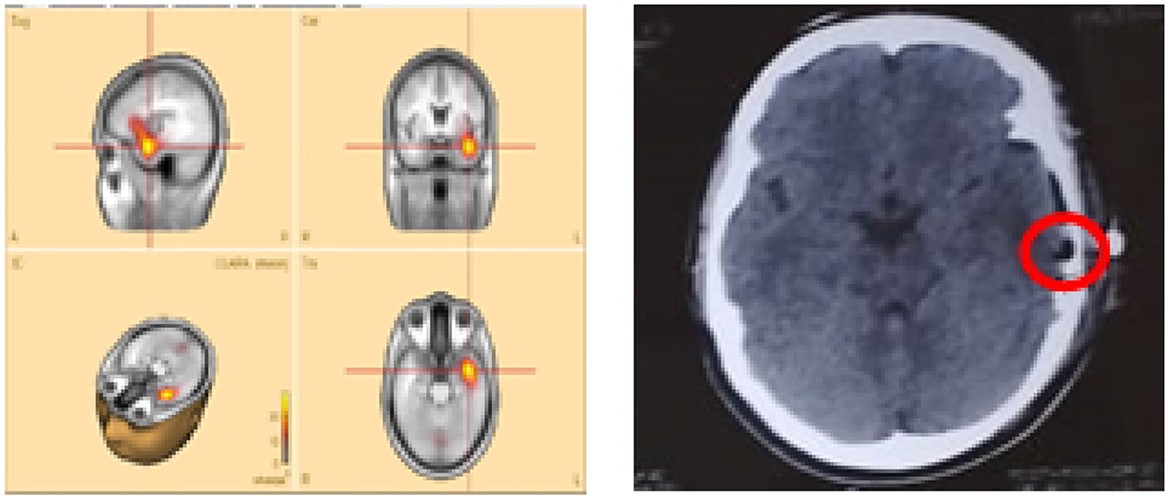
Figure 4. Sample patient no. 8. (Left) the CLARA area, and (right) the resected area in the post-surgical CT-scan.
Figure 4 illustrates patient P8, whose CLARA-identified zone was located in the left mesial temporal lobe near the temporal pole. Surgical resection (removal of brain tissue) was limited to the superior temporal gyrus of the lateral temporal lobe. Postoperative CT imaging confirmed only a small resection volume, and no clinical improvement was observed. Histopathological data were not available for this case.
4 Discussion
Pre-surgical brain mapping generally follows minimal guidelines. Neurologists typically rely on ictal semiology to identify the SOZ, while neurophysiologists use interictal and/or ictal EEG features to estimate its location. These approaches, however, remain inherently subjective and may provide insufficient precision for guiding surgical intervention.
There is no universally reliable semiology for all seizure types, particularly for extratemporal seizures. Moreover, epileptic discharges recorded on scalp EEG can spread rapidly across multiple channels, complicating the accurate determination of the SOZ and its potential propagation. As a result, reliance on semiology and visual EEG inspection alone can limit the accuracy of pre-surgical localization.
This study evaluated the performance of the CLARA method using BESA Research 7.1 software, which offers multiple electrical source localization (ESL) techniques. CLARA analyzes characteristic epileptic patterns to determine both the location and size of the seizure onset zone (SOZ). It can track EEG signal changes on a microsecond scale, enabling identification of the earliest epileptic activity and distinguishing the initial SOZ from its subsequent spread or extension.
The ictal and interictal features analyzed in this study likely originated from the epileptogenic zone. Accordingly, we focused on prominent epileptic features during the ictal period—such as slow waves, alpha waves, and other rhythmic or arrhythmic patterns—associated with at least three seizures. Interictal events, such as epileptic spikes or spike–wave complexes identified by physicians, were also analyzed. Incorporating both ictal and interictal features improves CLARA's ability to localize the SOZ.
In many patients, the CLARA-identified regions for ictal and interictal features overlapped within the same brain region, indicating robustness in identifying the SOZ across seizure phases.
The most definitive way to validate a new epileptic brain imaging technique is to compare its predicted SOZ with post-surgical outcomes following resection. In this study, one patient with multiple cavernomas underwent successful brain lobectomy, resulting in more than 2 years of seizure freedom. CLARA correctly identified the central area of the cavernomas in the left temporal and parieto-occipital lobes. In contrast, two other patients who underwent left temporal lobectomy at other hospitals experienced no clinical improvement.
Unfortunately, for these latter patients, no detailed records were available on the pre-surgical SOZ localization methods used. CLARA analysis showed that although both the CLARA-identified and resected regions were within the left temporal lobe, they did not fully overlap (Figure 4). This finding underscores the importance of accurate SOZ localization prior to surgery.
Neurosurgeons often take a conservative approach, such as removing a portion of the temporal lobe along with the amygdala and hippocampus in temporal lobe epilepsy cases. Ideally, surgical planning should aim for precise resection of only the epileptogenic tissue—whether temporal or extratemporal—while preserving as much functional cortex as possible. For example, in temporal lobectomy, ESL results can inform whether to:
1. Perform partial hippocampal resection (removing only the head) vs. complete hippocampal resection (extending to the tectal plate).
2. Resect or preserve the dominant superior temporal gyrus.
While the localization accuracy in this study was acceptable, there is room for improvement. To enhance the accuracy of ESL-based localization, we recommend:
1. Applying a conventional zero-phase bandpass filter (0.5 − 30 Hz) to extract epileptic features from the cleanest EEG segments, preserving maximum brain signal integrity without complex denoising.
2. Maximizing the number of repetitive waveforms with similar 2-D voltage distributions to improve the signal-to-noise ratio and obtain a representative average waveform.
3. Selecting an optimal segment between the onset and peak of the averaged waveform, ensuring the first PCA component explains (≥95%) of the variance for better source localization.
4. Co-registering the ESL solution with the patient's own MRI for realistic head modeling.
5. In advanced clinical research settings:
(a) Use high-density EEG (≥25 electrodes) for full-head coverage and improved spatial resolution.
(b) Co-register EEG data with patient-specific MRI, PET, and SPECT to achieve multimodal imaging and more precise SOZ localization.
In this study, the comparison was qualitative and restricted to the lobar level. We found minimal differences when comparing ictal and interictal CLARA zones, particularly when both were located in the same lobe. Therefore, further ictal-vs.-interictal comparison was not warranted for this dataset. However, future studies using high-density EEG (≥25 electrodes) and sub-lobar analysis may yield further insights.
This study has several limitations. The boundaries of the presumed and computed zones were not precisely delineated, which prevented a quantitative evaluation. As such, a qualitative concordance analysis was performed. Only 13 patients had usable data for concordance assessment, and only three had available post-surgical outcome information. This small sample size limits statistical power and generalizability, highlighting the need for further research in larger, more diverse cohorts.
Additionally, due to the lack of individual anatomical MRIs, CLARA source localization was performed using the standard MRI template provided by BESA. While this can reduce localization precision, especially for sub-lobar mapping, our primary analysis was at the lobar level, where the risk of significant mislocalization is lower. To improve anatomical accuracy, we used age-specific MRI templates rather than generic pediatric or adult models. These templates, in combination with FEM/BEM head modeling, cover a broad age range and reduce anatomical mismatch while maintaining feasibility across patient populations.
5 Conclusion
Unlike advanced epilepsy centers, many healthcare facilities lack access to comprehensive neuroimaging tools. Cost-effective, robust, and reliable ESL techniques could significantly improve the accuracy of seizure onset zone (SOZ) localization in these settings. The present study demonstrates a high concordance between the CLARA method and ictal semiology. This is further supported by favorable surgical outcomes in some patients following traditional lobectomy. Moreover, CLARA consistently identified the same brain regions across different epileptic features during both interictal and ictal periods. This reinforces its reliability for SOZ determination.
These results suggest that CLARA can serve as a valuable adjunct to clinical semiology and other neuroimaging techniques. This may enhance the precision of SOZ localization. In less advanced centers, integrating the ESL technique with the recommended steps outlined in this study may enable neurosurgeons to target specific epileptogenic regions, such as the mesial temporal or neocortical areas. This approach avoids relying on broader resections, such as traditional lobectomies. A more selective approach could maximize preservation of brain function while still achieving seizure freedom.
Although the CLARA technique itself is not novel, being an established feature of BESA software, the innovation of this work lies in its practical application within a resource-limited environment. Such settings are often characterized by restricted access to advanced imaging modalities (e.g., PET), reliance on low-channel EEG systems, and a shortage of specialized personnel. This study highlights the integration of CLARA with clinical semiology and video-EEG (VEEG) at the lobar level, providing a more objective and reproducible localization strategy. Importantly, we validated this approach against surgical outcomes, demonstrating its clinical relevance for presurgical evaluation where conventional resources are limited.
A promising future enhancement involves acquiring and analyzing ictal and/or interictal epileptic features during deep sleep. EEG recordings in deep sleep typically contain fewer artifacts and exhibit higher signal-to-noise ratios (SNR). Automated methods for detecting sleep phases in surface EEG, such as those described by Al-Bakri et al. (2018), could further refine the localization process. Adopting this approach has the potential to advance epileptogenic zone mapping and improve patient outcomes.
5.1 Study limitations
This study has several limitations that must be considered when interpreting the results. First, the small sample size limits generalizability and reduces statistical power. A larger cohort could validate the conclusions and make them more applicable across diverse patient groups. The lack of individualized MRIs for each participant is another limitation. Using a standard MRI template was needed due to the unavailability of individual scans. However, this may introduce localization bias and decrease the precision of source localization, especially at the sub-lobar level. Age-specific templates help address this, but it remains a constraint. Future studies should use individual MRIs when possible.
Finally, selection bias may also influence the results. The study used specific patient characteristics or inclusion criteria, which might limit sample representativeness. Future research should minimize such biases by including a more diverse set of participants and employing randomized selection methods where possible.
Data availability statement
The raw data supporting the conclusions of this article will be made available by the authors, without undue reservation.
Ethics statement
The studies involving humans were approved by Ministry of Health and Environment of Iraq, the Al-Russafa Health Directorate, and Dr. Saad Al-Witry Hospital for Neurosciences (Approval No. 2, dated 14/07/2024; Protocol/Form Numbers: 20240714 and 02/2021). The studies were conducted in accordance with the local legislation and institutional requirements. The participants provided their written informed consent to participate in this study.
Author contributions
AA-B: Conceptualization, Data curation, Formal analysis, Investigation, Methodology, Project administration, Resources, Visualization, Writing – original draft, Writing – review & editing. AM: Data curation, Formal analysis, Investigation, Methodology, Project administration, Supervision, Validation, Writing – original draft. MF: Data curation, Investigation, Methodology, Project administration, Resources, Supervision, Validation, Writing – original draft. WE: Conceptualization, Data curation, Investigation, Methodology, Project administration, Resources, Supervision, Validation, Writing – original draft. RV: Formal analysis, Software, Supervision, Validation, Visualization, Writing – original draft, Writing – review & editing. DM: Visualization, Writing – review & editing, Formal analysis. WK: Supervision, Validation, Writing – review & editing, Formal analysis. AK-S: Formal analysis, Investigation, Methodology, Supervision, Validation, Visualization, Writing – original draft, Writing – review & editing, Software.
Funding
The author(s) declare that financial support was received for the research and/or publication of this article. Dr. Vilimkova Kahankova was funded by National Agency of Academic Exchange under the Ulam NAWA Programme with project no. BPN/ULM/2023/1/00065. The publication fees was provided by the Department of Industrial Engineering and Management Systems, University of Central Florida, USA.
Acknowledgments
This project was supported by the BESA software team, which allowed us to work on the trail version of the BESA research 7.1. We also thank the neurosurgeons, Dr. Hussein J. Kadhim, and Dr. Ahmed Maan Taha working at Al-Witri Hospital for Neurosciences, for giving advice to this study.
Conflict of interest
The authors declare that the research was conducted in the absence of any commercial or financial relationships that could be construed as a potential conflict of interest.
The author(s) declared that they were an editorial board member of Frontiers, at the time of submission. This had no impact on the peer review process and the final decision.
Generative AI statement
The author(s) declare that no Gen AI was used in the creation of this manuscript.
Any alternative text (alt text) provided alongside figures in this article has been generated by Frontiers with the support of artificial intelligence and reasonable efforts have been made to ensure accuracy, including review by the authors wherever possible. If you identify any issues, please contact us.
Publisher's note
All claims expressed in this article are solely those of the authors and do not necessarily represent those of their affiliated organizations, or those of the publisher, the editors and the reviewers. Any product that may be evaluated in this article, or claim that may be made by its manufacturer, is not guaranteed or endorsed by the publisher.
References
Al-Bakri, A. F., Yaghouby, F., Besio, W., Ding, L., Modur, P., Sunderam, S., et al. (2018). “Effect of vigilance changes on the incidence of high frequency oscillations in the epileptic brain,” in 2018 40th Annual International Conference of the IEEE Engineering in Medicine and Biology Society (EMBC) (Honolulu, HI: IEEE), 991–994. doi: 10.1109/EMBC.2018.8512339
Asadzadeh, S., Rezaii, T. Y., Beheshti, S., Delpak, A., and Meshgini, S. (2020). A systematic review of EEG source localization techniques and their applications on diagnosis of brain abnormalities. J. Neurosci. Methods 339:108740. doi: 10.1016/j.jneumeth.2020.108740
Barnova, K., Mikolasova, M., Kahankova, R. V., Jaros, R., Kawala-Sterniuk, A., Snasel, V., et al. (2023). Implementation of artificial intelligence and machine learning-based methods in brain-computer interaction. Comput. Biol. Med. 163:107135. doi: 10.1016/j.compbiomed.2023.107135
Beniczky, S., Lantz, G., Rosenzweig, I., Åkeson, P., Pedersen, B., Pinborg, L. H., et al. (2013). Source localization of rhythmic ictal EEG activity: a study of diagnostic accuracy following stard criteria. Epilepsia 54, 1743–1752. doi: 10.1111/epi.12339
Blair, R. D. (2012). Temporal lobe epilepsy semiology. Epilepsy Res. Treat. 2012:751510. doi: 10.1155/2012/751510
Brinkmann, B. H. (2024). Technical considerations in EEG source imaging. J. Clin. Neurophysiol. 41, 2–7. doi: 10.1097/WNP.0000000000001029
Brodbeck, V., Spinelli, L., Lascano, A. M., Wissmeier, M., Vargas, M.-I., Vulliemoz, S., et al. (2011). Electroencephalographic source imaging: a prospective study of 152 operated epileptic patients. Brain 134, 2887–2897. doi: 10.1093/brain/awr243
Cabrerizo, M., Goryawala, M., Jayakar, P., Barreto, A., Khizroev, S., Adjouadi, M., et al. (2011). “Accurate 3D source localization of focal epileptic foci using interictal EEG spikes,” in 2011 IEEE Signal Processing in Medicine and Biology Symposium (SPMB) (Brooklyn, NY: IEEE), 1–6. doi: 10.1109/SPMB.2011.6120106
Chowdhury, F. A., Silva, R., Whatley, B., and Walker, M. C. (2021). Localisation in focal epilepsy: a practical guide. Pract. Neurol. 21, 481–491. doi: 10.1136/practneurol-2019-002341
Ding, L., Wilke, C., Xu, B., Xu, X., Van Drongelen, W., Kohrman, M., et al. (2007). EEG source imaging: correlating source locations and extents with electrocorticography and surgical resections in epilepsy patients. J. Clin. Neurophysiol. 24, 130–136. doi: 10.1097/WNP.0b013e318038fd52
Duez, L., Tankisi, H., Hansen, P. O., Sidenius, P., Sabers, A., Pinborg, L. H., et al. (2019). Electromagnetic source imaging in presurgical workup of patients with epilepsy: a prospective study. Neurology 92, e576–e586. doi: 10.1212/WNL.0000000000006877
Eadie, M., and Bladin, P. F. (2001). A Disease Once Sacked: A History of the Medical Understanding of Epilepsy. Sydney, NSW: John Libbey & Co.
Elwan, S., Alexopoulos, A., Silveira, D. C., and Kotagal, P. (2018). Lateralizing and localizing value of seizure semiology: comparison with scalp EEG, MRI and pet in patients successfully treated with resective epilepsy surgery. Seizure 61, 203–208. doi: 10.1016/j.seizure.2018.08.026
Eom, T.-H. (2023). Electroencephalography source localization. Clin. Exp. Pediatrics 66:201. doi: 10.3345/cep.2022.00962
Foldvary, N., Klem, G., Hammel, J., Bingaman, W., Najm, I., and Lüders, H. (2001). The localizing value of ictal EEG in focal epilepsy. Neurology 57, 2022–2028. doi: 10.1212/WNL.57.11.2022
Foldvary-Schaefer, N., and Unnwongse, K. (2011). Localizing and lateralizing features of auras and seizures. Epilepsy Behav. 20, 160–166. doi: 10.1016/j.yebeh.2010.08.034
Fotedar, N., Gajera, P., Pyatka, N., Nasralla, S., Kubota, T., Vaca, G. F.-B., et al. (2022). A descriptive study of eye and head movements in versive seizures. Seizure 98, 44–50. doi: 10.1016/j.seizure.2022.04.003
Frazzini, V., Cousyn, L., and Navarro, V. (2022). Semiology, EEG, and neuroimaging findings in temporal lobe epilepsies. Handb. Clin. Neurol. 187, 489–518. doi: 10.1016/B978-0-12-823493-8.00021-3
Herrendorf, G., Steinhoff, B., Kolle, R., Baudewig, J., Waberski, T., Buchner, H., et al. (2000). Dipole-source analysis in a realistic head model in patients with focal epilepsy. Epilepsia 41, 71–80. doi: 10.1111/j.1528-1157.2000.tb01508.x
Hirfanoglu, T., Serdaroglu, A., Cansu, A., Bilir, E., and Gucuyener, K. (2007). Semiological seizure classification: before and after video- EEG monitoring of seizures. Pediatr. Neurol. 36, 231–235. doi: 10.1016/j.pediatrneurol.2006.12.002
Hoechstetter, K., Berg, P., and Scherg, M. (2010). “BESA research tutorial 4: distributed source imaging,” in BESA Research Tutorial 1–29.
Iordanov, T., Bornfleth, H., Wolters, C. H., Pasheva, V., Venkov, G., Lanfer, B., et al. (2018). Loreta with cortical constraint: choosing an adequate surface laplacian operator. Front. Neurosci. 12:746. doi: 10.3389/fnins.2018.00746
Iordanov, T., Hoechstetter, K., Berg, P., Paul-Jordanov, I., and Scherg, M. (2014). “Clara: classical loreta analysis recursively applied,” in 20th Annual Meeting of Organization of Human Brain Mapping (OHBM) (Hamburg), 8–12.
Irandoost, S. A., Badv, R. S., Oghabian, M. A., Yarali, B., Malamiri, R. A., Hashemi, H., et al. (2023). Non-invasive electrical source imaging for localizing epileptiform discharges in children with focal epilepsy based on developing country's limitations. Innov. J. Pediatrics 33:e121981. doi: 10.5812/ijp-121981
Jan, M. M., and Girvin, J. P. (2008). Seizure semiology: value in identifying seizure origin. Can. J. Neurol. Sci. 35, 22–30. doi: 10.1017/S0317167100007526
Karikari, E., and Koshechkin, K. A. (2023). Review on brain-computer interface technologies in healthcare. Biophys. Rev. 15, 1351–1358. doi: 10.1007/s12551-023-01138-6
Kawala-Sterniuk, A., Browarska, N., Al-Bakri, A., Pelc, M., Zygarlicki, J., Sidikova, M., et al. (2021). Summary of over fifty years with brain-computer interfaces—a review. Brain Sci. 11:43. doi: 10.3390/brainsci11010043
Kim, S.-T., Kim, S. E., Lee, D. A., Lee, H.-J., and Park, K. M. (2024). Anti-seizure medication response and the glymphatic system in patients with focal epilepsy. Eur. J. Neurol. 31:e16097. doi: 10.1111/ene.16097
Knowlton, R. C., Elgavish, R. A., Bartolucci, A., Ojha, B., Limdi, N., Blount, J., et al. (2008). Functional imaging: II. prediction of epilepsy surgery outcome. Ann. Neurol. 64, 35–41. doi: 10.1002/ana.21419
Kwan, P., and Brodie, M. J. (2000). Early identification of refractory epilepsy. New Engl. J. Med. 342, 314–319. doi: 10.1056/NEJM200002033420503
Lantz, G., Spinelli, L., Seeck, M., de Peralta Menendez, R. G., Sottas, C. C., and Michel, C. M. (2003). Propagation of interictal epileptiform activity can lead to erroneous source localizations: a 128-channel EEG mapping study. J. Clin. Neurophysiol. 20, 311–319. doi: 10.1097/00004691-200309000-00003
Mălîia, M. D., Meritam, P., Scherg, M., Fabricius, M., Rubboli, G., Mîndruţă, I., et al. (2016). Epileptiform discharge propagation: analyzing spikes from the onset to the peak. Clin. Neurophysiol. 127, 2127–2133. doi: 10.1016/j.clinph.2015.12.021
Mattioli, P., Cleeren, E., Hadady, L., Cossu, A., Cloppenborg, T., Arnaldi, D., et al. (2022). Electric source imaging in presurgical evaluation of epilepsy: an inter-analyser agreement study. Diagnostics 12:2303. doi: 10.3390/diagnostics12102303
Menghi, V., Bisulli, F., Tinuper, P., and Nobili, L. (2018). Sleep-related hypermotor epilepsy: prevalence, impact and management strategies. Nat. Sci. Sleep 10, 317–326. doi: 10.2147/NSS.S152624
Michel, C. M., and Brunet, D. (2019). EEG source imaging: a practical review of the analysis steps. Front. Neurol. 10:325. doi: 10.3389/fneur.2019.00325
Ortiz-Mantilla, S., Hämäläinen, J. A., and Benasich, A. A. (2012). Time course of ERP generators to syllables in infants: a source localization study using age-appropriate brain templates. Neuroimage 59, 3275–3287. doi: 10.1016/j.neuroimage.2011.11.048
Otárula, K. A. G., and Schuele, S. (2024). Ambulatory EEG-video. Epilepsy Behav. 151:109615. doi: 10.1016/j.yebeh.2023.109615
Plummer, C., Harvey, A. S., and Cook, M. (2008). EEG source localization in focal epilepsy: where are we now? Epilepsia 49, 201–218. doi: 10.1111/j.1528-1167.2007.01381.x
Rampp, S., Müller-Voggel, N., Hamer, H., Doerfler, A., Brandner, S., and Buchfelder, M. (2024). Interictal electrical source imaging. J. Clin. Neurophysiol. 41, 19–26. doi: 10.1097/WNP.0000000000001012
Rikir, E., Maillard, L. G., Abdallah, C., Gavaret, M., Bartolomei, F., Vignal, J.-P., et al. (2020). Respective contribution of ictal and inter-ictal electrical source imaging to epileptogenic zone localization. Brain Topogr. 33, 384–402. doi: 10.1007/s10548-020-00768-3
Rosenow, F., and Lüders, H. (2001). Presurgical evaluation of epilepsy. Brain 124, 1683–1700. doi: 10.1093/brain/124.9.1683
Ryvlin, P., Cross, J. H., and Rheims, S. (2014). Epilepsy surgery in children and adults. Lancet Neurol. 13, 1114–1126. doi: 10.1016/S1474-4422(14)70156-5
Sander, J. W. (2003). The epidemiology of epilepsy revisited. Curr. Opin. Neurol. 16, 165–170. doi: 10.1097/00019052-200304000-00008
Sharma, P., Seeck, M., and Beniczky, S. (2019). Accuracy of interictal and ictal electric and magnetic source imaging: a systematic review and meta-analysis. Front. Neurol. 10:1250. doi: 10.3389/fneur.2019.01250
Singh, J., Ebersole, J. S., and Brinkmann, B. H. (2022). From theory to practical fundamentals of electroencephalographic source imaging in localizing the epileptogenic zone. Epilepsia 63, 2476–2490. doi: 10.1111/epi.17361
Toole, C., Martinez-Juárez, I. E., Gaitanis, J. N., Blum, A., Sunderam, S., Ding, L., et al. (2019). Source localization of high-frequency activity in tripolar electroencephalography of patients with epilepsy. Epilepsy Behav. 101:106519. doi: 10.1016/j.yebeh.2019.106519
Tortora, D., Cataldi, M., Severino, M., Consales, A., Pacetti, M., Parodi, C., et al. (2022). Comparison of qualitative and quantitative analyses of MR-arterial spin labeling perfusion data for the assessment of pediatric patients with focal epilepsies. Diagnostics 12:811. doi: 10.3390/diagnostics12040811
Keywords: epilepsy, brain signals, VEEG, brain imaging, classical LORETA analysis recursively applied (CLARA)
Citation: Al-Bakri AF, Muslim AT, Faraj MK, Esam Matti W, Vilimkova Kahankova R, Mikolajewski D, Karwowski W and Kawala-Sterniuk A (2025) Epileptic brain imaging by source localization CLARA supported by ictal-based semiology and VEEG in resource-limited settings. Front. Neuroinform. 19:1661617. doi: 10.3389/fninf.2025.1661617
Received: 08 July 2025; Accepted: 12 August 2025;
Published: 29 August 2025.
Edited by:
Gabor Juhasz, Eötvös Loránd University, HungaryReviewed by:
Miguel Ley Nácher, Hospital del Mar, Parc de Salut Mar, SpainJacob Bunyamin, Monash University, Australia
Copyright © 2025 Al-Bakri, Muslim, Faraj, Esam Matti, Vilimkova Kahankova, Mikolajewski, Karwowski and Kawala-Sterniuk. This is an open-access article distributed under the terms of the Creative Commons Attribution License (CC BY). The use, distribution or reproduction in other forums is permitted, provided the original author(s) and the copyright owner(s) are credited and that the original publication in this journal is cited, in accordance with accepted academic practice. No use, distribution or reproduction is permitted which does not comply with these terms.
*Correspondence: Amir F. Al-Bakri, YW1pci5hbGJha3JpODBAZ21haWwuY29t; Aleksandra Kawala-Sterniuk, YWxla3NhbmRyYS5rYXdhbGEtc3Rlcm5pdWtAcHdyLmVkdS5wbA==