 Erik D. Fagerholm
 Hirokazu Tanaka
 Milan Brázdil
- 1First Department of Neurology, St. Anne’s University Hospital and Faculty of Medicine, Masaryk University, Brno, Czechia
- 2Faculty of Information Technology, Tokyo City University, Tokyo, Japan
Introduction: Neural activity can be described in terms of probability distributions that are continuously evolving in time. Characterizing how these distributions are reshaped as they pass between cortical regions is key to understanding how information is organized in the brain.
Methods: We developed a mathematical framework that represents these transformations as information-theoretic gradient flows — dynamical trajectories that follow the steepest ascent of entropy and expectation. The relative strengths of these two functionals provide interpretable measures of how neural probability distributions change as they propagate within neural systems. Following construct validation in silico, we applied the framework to publicly available continuous ΔF/F two-photon calcium recordings from the mouse visual cortex.
Results: The analysis revealed consistent bi-directional transformations between the rostrolateral area and the primary visual cortex across all five mice. These findings demonstrate that the relative contributions of entropy and expectation can be disambiguated and used to describe information flow within cortical networks.
Discussion: We introduce a framework for decomposing neural signal transformations into interpretable information-theoretic components. Beyond the mouse visual cortex, the method can be applied to diverse neuroimaging modalities and scales, thereby providing a generalizable approach for quantifying how information geometry shapes cortical communication.
Introduction
The electrical activity in the brain reflects a combination of hidden internal states which, although not directly observable, can be inferred via the signals picked up by neuroimaging devices (Fiser et al., 2010; Friston, 2005; Ma et al., 2006). One way to describe these signals is in terms of probability distributions evolving in time. As conditions change in the brain, the probability distributions shift accordingly, reflecting an ongoing reorganization of internal representations. Understanding the processes by which probability distributions transform as they pass among brain regions remains a central challenge in computational neuroscience.
Changes in neural activity can be analyzed by studying how specific functionals act on probability distributions. Two key examples of such functionals are entropy (Fagerholm et al., 2023; Keshmiri, 2020; Luczak, 2024) and expectation (Gerstner and Kistler, 2002; Helias et al., 2014; Lánskı and Sacerdote, 2001), where the former widens the variance and the latter shifts the mean of a given probability distribution. Each functional is associated, via its gradient, with a specific flow across the space of probability densities. This geometric (Nielsen, 2022) perspective allows for a decomposition of transformations into interpretable information-theoretic components.
We describe how neural activity distributions change when viewed at different observational scales, and formalize these changes using information-theoretic geometry. The adaptation of neural distributions, central to predictive coding (Clark, 2013; Rao and Ballard, 1999) and efficient representation (Barlow, 1961; Simoncelli and Olshausen, 2001; Wei and Stocker, 2015), corresponds to systematic transformations in probability space. By expressing these transformations as gradient flows, we provide a mathematical description of how distributions evolve under the competing influences of variability (entropy) and stability (expectation). We show that in the specific case of a centered symmetric distribution, entropy and expectation form orthogonal components, and are thus able to be added as basis flows.
Previous work on neural signal transmissions has been largely focused on statistical dependencies between observed activation patterns (Bastos and Schoffelen, 2016; Friston, 2011). For instance, metrics such as mutual information (Borst and Theunissen, 1999; Panzeri et al., 2017) and Granger causality (Seth et al., 2015) quantify how strongly activity in one region predicts activity in another. However, these metrics do not capture how the full probability distributions transform across regions. This is precisely the missing component that our methodology addresses.
While the present study applies the framework to continuous ΔF/F calcium signals, the formulation itself is modality-agnostic. Because it operates on empirical probability densities, rather than on “raw” measurements, the same principles can be applied to spiking activity. This is achieved by constructing firing-rate distributions or by using smooth approximations of Poisson processes — a standard approach in population coding models.
We validate this framework in silico and then extract dominant flows linking regions within the murine visual cortex, captured using two-photon imaging. The visual cortex in mice is particularly well-suited to our study, given that adjacent areas therein exhibit coordinated patterns of activity (Felleman and Van Essen, 1991; Harris et al., 2019) across functionally specialized regions (Andermann and Moore, 2006; Glickfeld et al., 2013; Marshel et al., 2011). Beyond this specific application, our approach introduces a generalizable method for analysing any scenario in which distributions are transformed — not just among cortical regions, but also between measurement devices, or across spatiotemporal scales.
Materials and methods
Here we formalize how probability distributions transform when the observation scale changes. This formulation reveals two flows — one linked to entropy and the other to expectation. In the case of a centered symmetric distribution these two flows form orthogonal bases for information-theoretic transformations.
We begin with the following definitions:
x ∈ ℝn: the state of the system, represented by an n-dimensional variable.
λS ∈ ℝ+: a positive-valued parameter that controls the scale of observation.
q (x; λS): a probability density function over x, conditioned on the observation scale λS, which remains normalized for all scales:
We define the space of all valid (smooth, positive, normalized) probability distributions as the information space 𝒫:
which yields a nonlinear manifold of valid distributions within the space of all possible functions.
Power law generators: Due to the ubiquity of power laws in the analysis of neural systems (Fiser et al., 2010), we investigate how the probability distribution q (x; λS) changes to a new distribution via:
where the partition function in the denominator ensures correct normalization of the new distribution for all values of λS.
We next analyze the form of Equation 3 for very small changes in scale. Specifically, we seek the associated generator (Amari and Nagaoka, 2000) — i.e., the infinitesimal power law transformation associated with an increase in λS. As motivated by Noether’s theorem (Noether, 1983) and Lie theory (Cohn, 1957), the derivation of a generator creates a powerful tool that allows for the recovery of arbitrary transformations.
To see how this applies to our particular case, we begin by defining the scale parameter λS in terms of an arbitrarily small constant ε:
thereby allowing for any scale parameter λS to be defined by the iterated application of ε.
Applying Equation 4 to Equation 3, we obtain:
Next, using the fact that ex ≈ 1 + x for small x, we expand q1 + ε to first order in ε and use the identities: q1 + ε = qqε, and qqε = qeε log q, to linearize the effect of the power law transform:
which evaluates Equation 3 near λS = 1.
To ensure that the transformed density remains normalized, we divide Equation 6 by its associated partition function:
Substituting the normalization condition from Equation 1 into the denominator, and using the definition of the mean:
Equation 7 simplifies to:
Finally, we use the fact that for small x and y to linearize Equation 9, thereby yielding the power law generator:
which can equivalently be expressed as the following differential equation:
Power laws and entropic flow: We now note that the generator derived in Equation 10 includes a term qlogq, which resembles the integrand of entropy S [q], hinting at a connection between power law transformations and entropy:
We investigate this connection by calculating in which direction entropy increases most rapidly, within the space of valid probability distributions 𝒫 in Equation 2. This direction is given by the functional gradient of the negative entropy in Equation 12:
Equation 13 has a mean given by:
which, using Equations 1, 8, can be written as:
We define an entropic flow vS as the mean gradient in Equation 15 subtracted from the gradient in Equation 13. This has the effect of projecting the gradient onto the manifold 𝒫 of valid probability densities in Equation 2:
which, using Equations 13, 15, reads:
i.e., we discover exactly the same expression as in Equation 11, meaning that we can write:
This reveals a relationship between entropic flow and power law transformations indexed by a scale parameter λS.
Generalized flow: The form of Equation 18 can be generalized to arbitrary functionals ℱ [q], which define continuous trajectories through information space 𝒫 via associated flow parameters λℱ. The flow of ℱ [q] preserves the geometric structure of Equation 18, in terms of a projected gradient on the log density of q, while allowing for arbitrary functionals:
Here, the logq term is not an artefact of the entropic expression in Equation 18. Rather, logq persists in the generalized flow expression in Equation 19 because λℱ parameterizes a flow of the form ∂q/∂λℱ ∼ q, which maps to ∂logq/∂λℱ. Equation 19 therefore yields a class of projected gradient flows vF which depend on the choice of functional ℱ.
Basis flows: Thus far we have established that:
1. Power law transformations are associated with entropic flow,
2. The power law/entropy link can be generalized to arbitrary functionals beyond entropy.
Given these two points, our next question is whether we can find a flow vℱ that is orthogonal to entropic flow vS, as this would allow for a decomposition into independent components. To find such an orthogonal flow, we require that the inner product between vℱ and vS equals zero:
where we can use Equations 17, 19 to write the covariance as:
which is equivalent to the covariance between logq and δℱ/δq under q (x):
The simplest class of ℱ is given by linear expectation:
with a functional derivative given by:
If we then assume a zero-mean Gaussian form for q (x), for which logq ∼ x2, Equation 22 becomes:
which satisfies the orthogonality condition in Equation 20, which in turn shows that entropy and expectation define orthogonal flows in the specific case of a centered symmetric distribution.
We next look for the transformation associated with the expectation functional using Equation 19:
which has a solution given by:
and hence:
where the partition function in the denominator ensures correct normalization.
Therefore, just as entropic flow arises from power law transformations in Equation 18, the expectation flow corresponds to an exponential tilt in Equation 28. Intuitively, the entropic and expectation flows capture how variance and expectation change with observational scale, respectively. We summarize the links between these two information-theoretic functionals and their associated geometric transformations in Table 1.
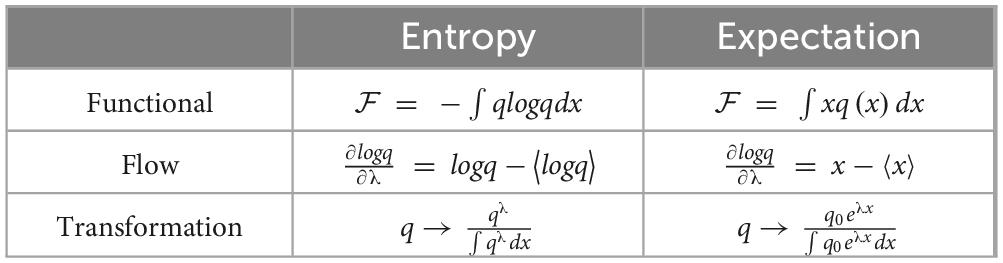
Table 1. Summary properties for entropy and expectation flows.
Synthetic data: Having established entropy and expectation as orthogonal basis functionals, we use Equations 17, 26 to define a mixed entropic-expectation flow combining both components:
where the coefficients α and β control the relative contributions of entropy and expectation, respectively.
To verify that the model parameters can be accurately recovered from data, we performed two in silico tests. The flow in Equation 29 was simulated using pre-specified α and β-values applied to samples drawn from: (1) a Gaussian process, and (2) a one-dimensional Langevin process with a time-varying oscillatory drift term. Recovery accuracy was assessed by comparing true versus fitted parameters and evaluating similarity between distributions using Wasserstein-2 distance, total variation, and L2 metrics.
Two-photon imaging data: We next applied the same mixed-flow framework to publicly available empirical data in the form of two-photon calcium-imaging recordings from five mice (Kumar et al., 2021). The dataset includes neuronal responses from six retinotopically defined visual areas: primary visual cortex (V1), lateromedial (LM), anterolateral (AL), rostrolateral (RL), anteromedial (AM), and posteromedial (PM) (Figure 1).
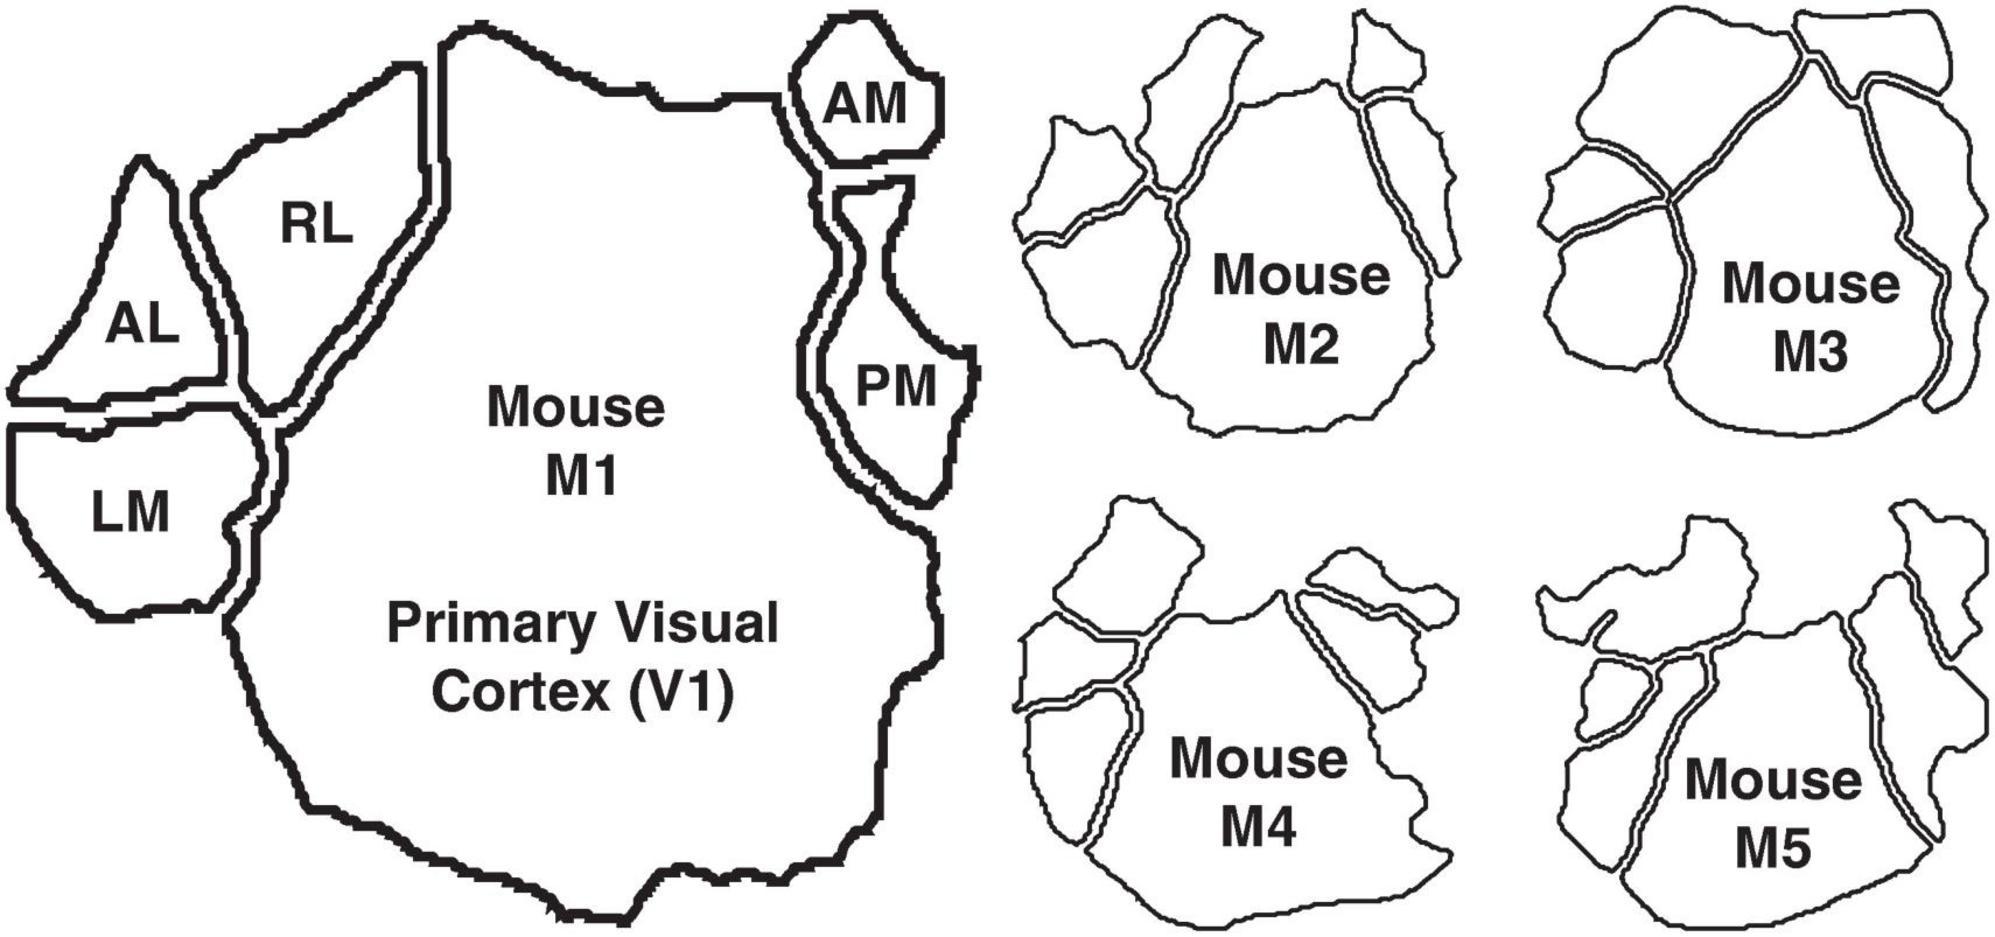
Figure 1. The murine visual cortex, consisting of V1, LM, AL, RL, AM, and PM. Mouse M1 is shown in the large outline and the other four mice M2–M5 are shown in the smaller outlines.
Visual stimuli consisted of natural movies (30–120 s) and resting-state recordings under a constant grey screen (5 min). ΔF/F traces were pre-processed, aligned to stimulus timing, and grouped by retinotopically defined area (Figure 2).
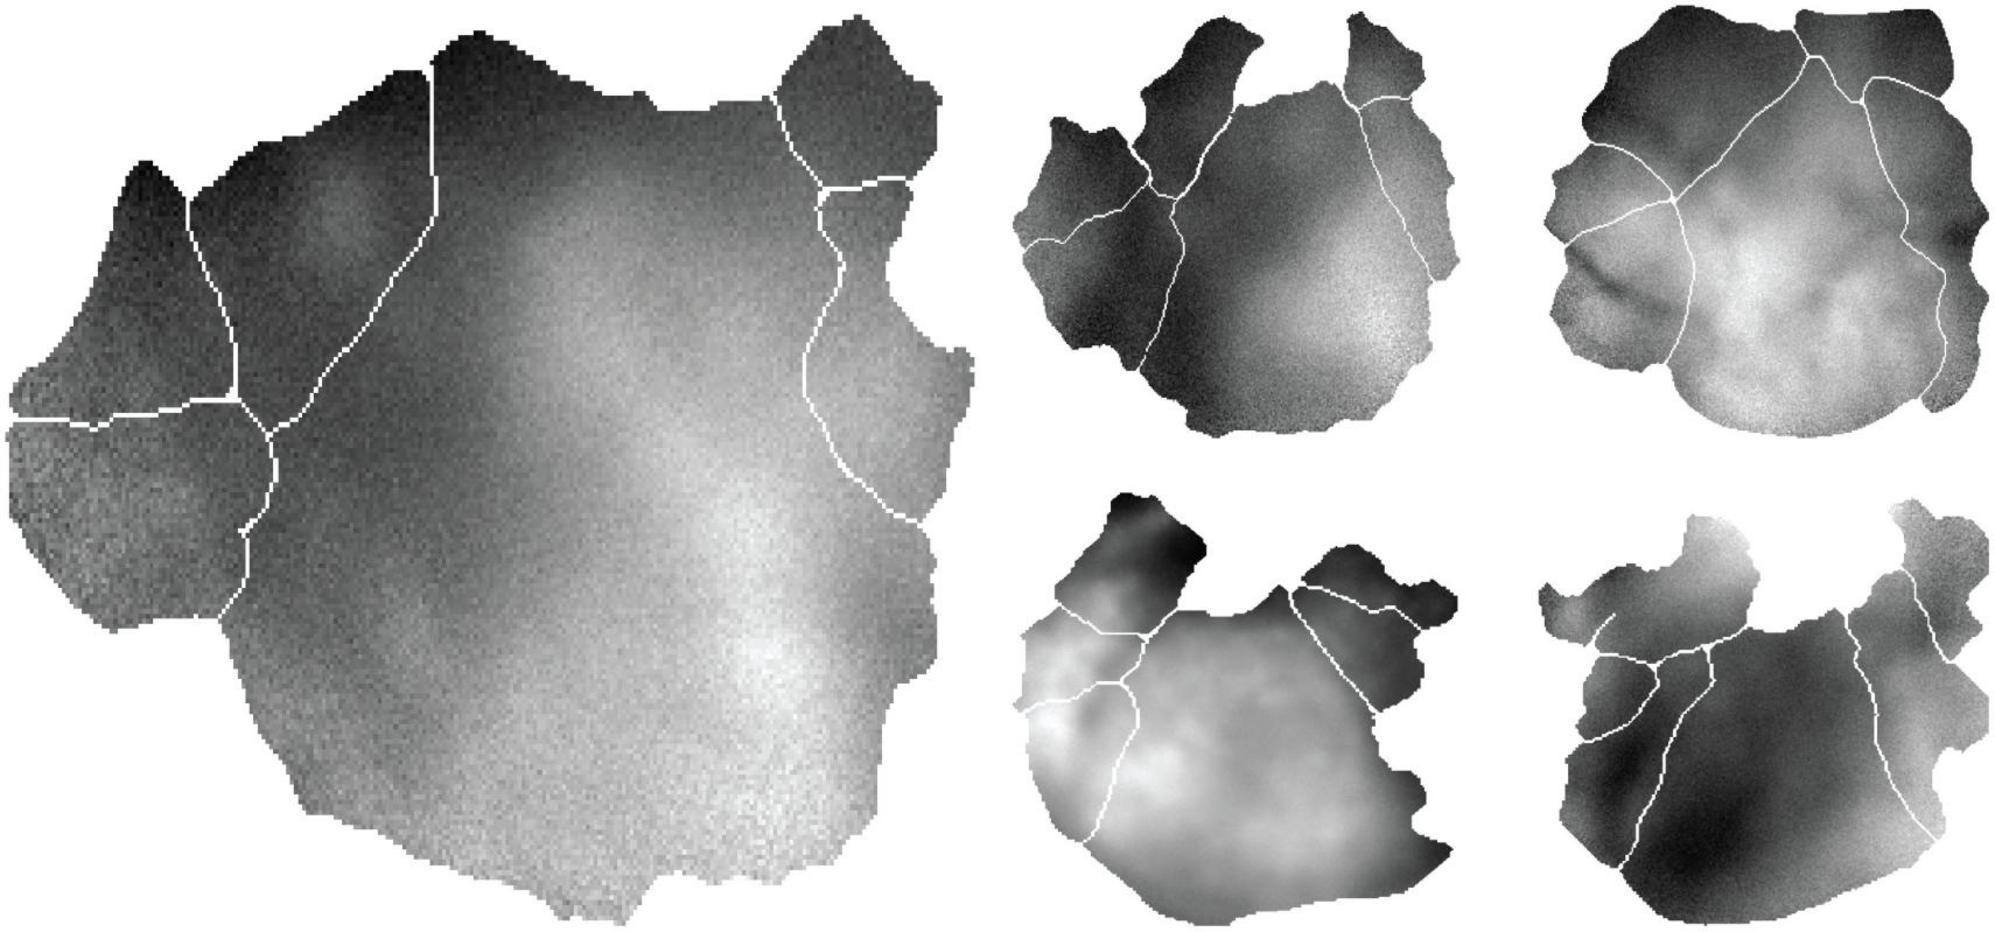
Figure 2. Mice M1-M5 in the same layout as Figure 1, each showing a single frame of fluorescence intensity for the indicator GCaMP6s. We show a segment of these data evolving in time in Supplementary Movie 1.
Model formulation: Although Equation 29 was derived for transformations within a single distribution under changes in observational scale, the same operator can describe transformations between marginal distributions of distinct brain regions. For regions A and B with empirical distributions pA (x) and pB (x), their relationship can be approximated as
where Tα,β denotes the mixed entropic–expectation flow operator. This treats inter-regional transformations as the best-fitting reweighting and tilting of pA in order to recover pB. The fitted coefficients α and β therefore quantify the relative influence of entropy- and expectation-driven transformations linking the two regions.
For time-series data, the same operator yields a predictive mapping from the activity of region A to the estimated signal of region B:
where qA (xA) is the empirical probability density of xA. The term with coefficient α reflects local log-density deviations (entropic component) and the term with coefficient β captures global mean deviations (expectation component).
Density estimation and parameter fitting: Empirical densities qA (xA) were recovered using Gaussian kernel density estimation (KDE) via MATLAB’s ksdensity function, which implements Silverman’s rule for bandwidth selection. This produces smooth, data-adaptive estimates suitable for evaluating log-density terms.
For each ordered region pair A→B, we optimized α and β by minimizing the L2 prediction error between the model-generated and observed time-series signals using MATLAB’s fmincon with the interior-point algorithm. The reverse direction B→A was modeled separately, allowing directional asymmetries to emerge from independently fitted parameters.
Validation and significance testing: To evaluate generalization, we implemented two complementary validation procedures:
1. A hold-out test: α and β were fitted on the first 80 % of each regional time series and tested on the remaining 20%.
2. A randomized cross-validation: 20 independent 80/20 splits were used to assess robustness to data segmentation. For each split, the coefficient of determination (R2) was computed between the predicted and empirical target signals. Across all region pairs, the difference between training and test performance was small [ΔR2 = (3.1 ± 0.4) × 10−2] indicating that the model generalizes well and does not overfit.
Statistical significance was assessed via temporal permutation. Each input time series was circularly shifted 1,000 times with random offsets within each session, and the transformation was refitted for each surrogate. p-values were computed as the proportion of surrogate R2 values greater than or equal to the empirical result. Multiple comparisons across all off-diagonal region pairs and mice were corrected using the Benjamini–Hochberg procedure (Benjamini and Hochberg, 1995) (q = 0.01), and results were additionally verified using Bonferroni adjustment.
Results
All results can be reproduced with the accompanying code (see Code Availability).
Synthetic data: Using known entropy (α) and expectation (β) flow parameters from Equation 29, we created the following two forward-generative models:
1. A Gaussian process undergoing noise-driven diffusion (Figure 3A).
2. A stochastic Langevin process with a sinusoidal drift (Figure 3B).
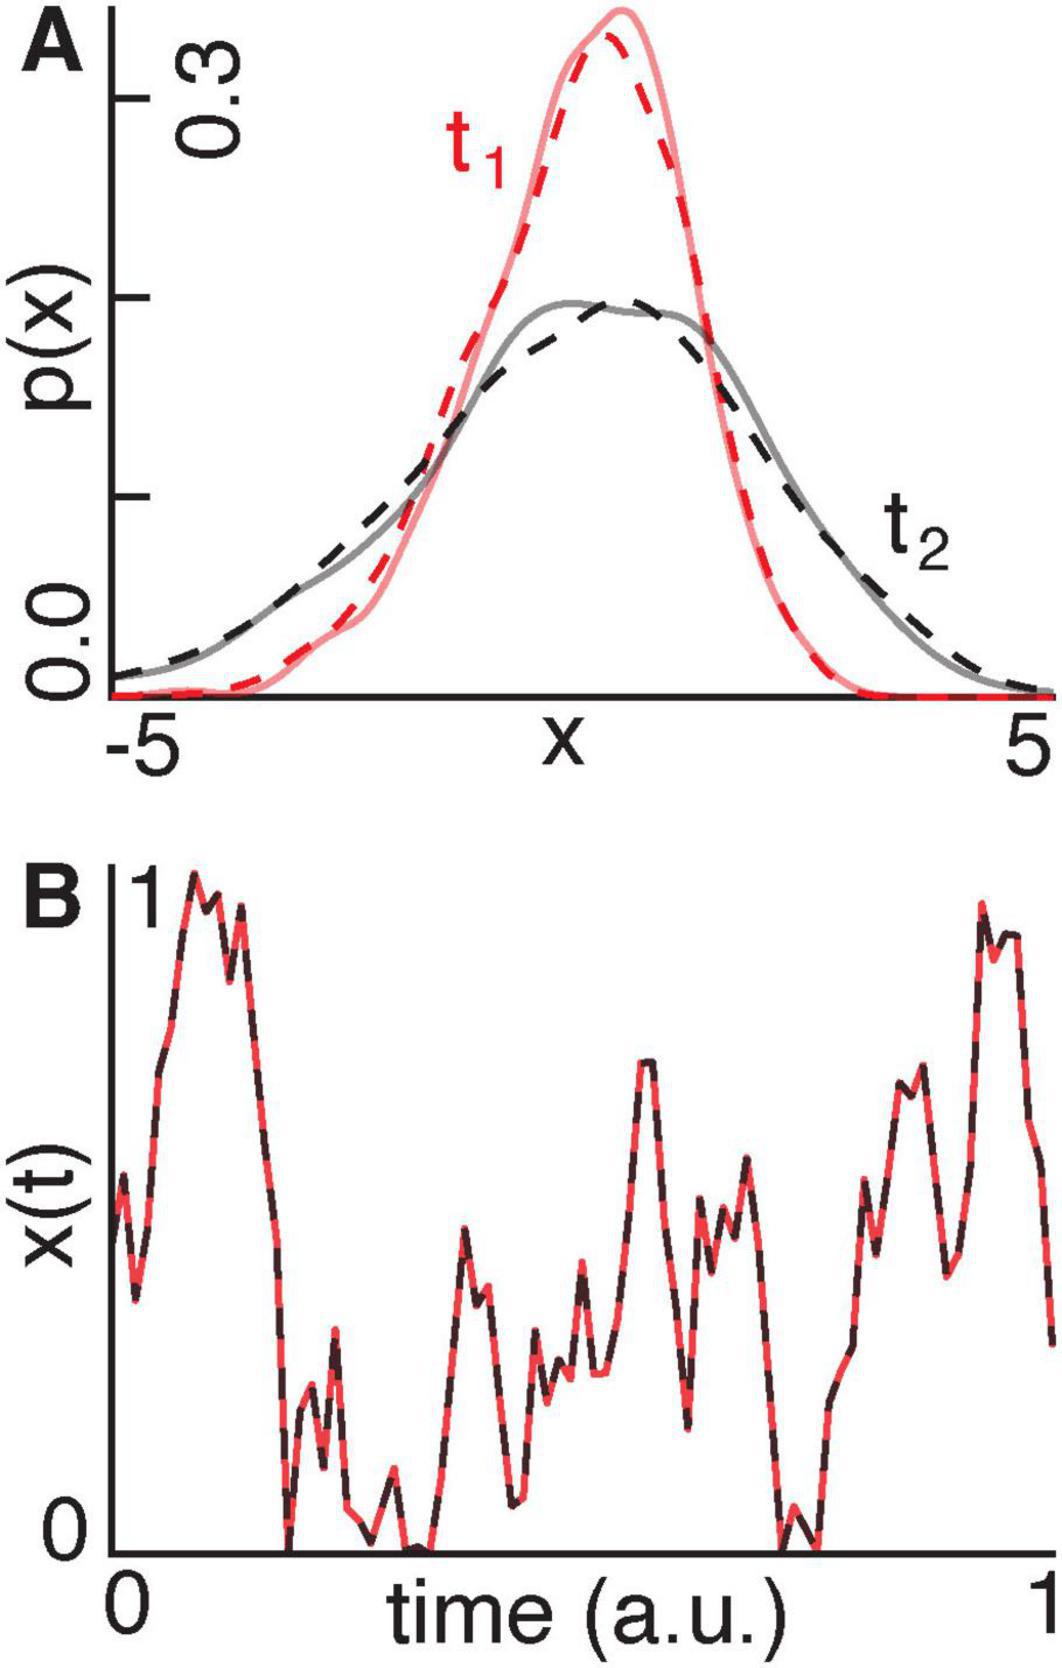
Figure 3. (A) We show a Gaussian distribution evolving according to a diffusion process at an early point in time t1 (red) and at a later point in time t2 (black). The solid and dashed lines indicate the distributions generated using ground-truth and recovered parameters, respectively. (B) A signal x(t) evolves according to a stochastic Langevin process with an oscillatory drift using ground-truth (red) and recovered (black) parameters.
In the case of the Gaussian process (Figure 3A), the model recovered α and β with errors of 24.4% and 19.8%, respectively. The recovered distributions accurately matched the ground-truth distributions across time, with an average squared Wasserstein-2 distance of 9.3 × 10⁻⁴, a total variation distance of 0.03, and a mean L2 error of 9.0 × 10⁻⁴. In the case of the Langevin process (Figure 3B), the recovered α and β-values deviated from the ground-truth values by 7.1% and 3.0%, respectively. The recovered signal closely tracked the ground-truth trajectory, with a total variation distance of 0.02 and an L2 error of 0.03.
Empirical data: We computed the first principal component of pixel activity within each region of the visual cortex and used the mixed-flow transformation from Equation 29 to model signals within one region, based on another region’s activity. We show an example of using the primary visual cortex (V1) to estimate the anteromedial area (AM) (R2 = 0.90, p = 0.001, Figure 4).
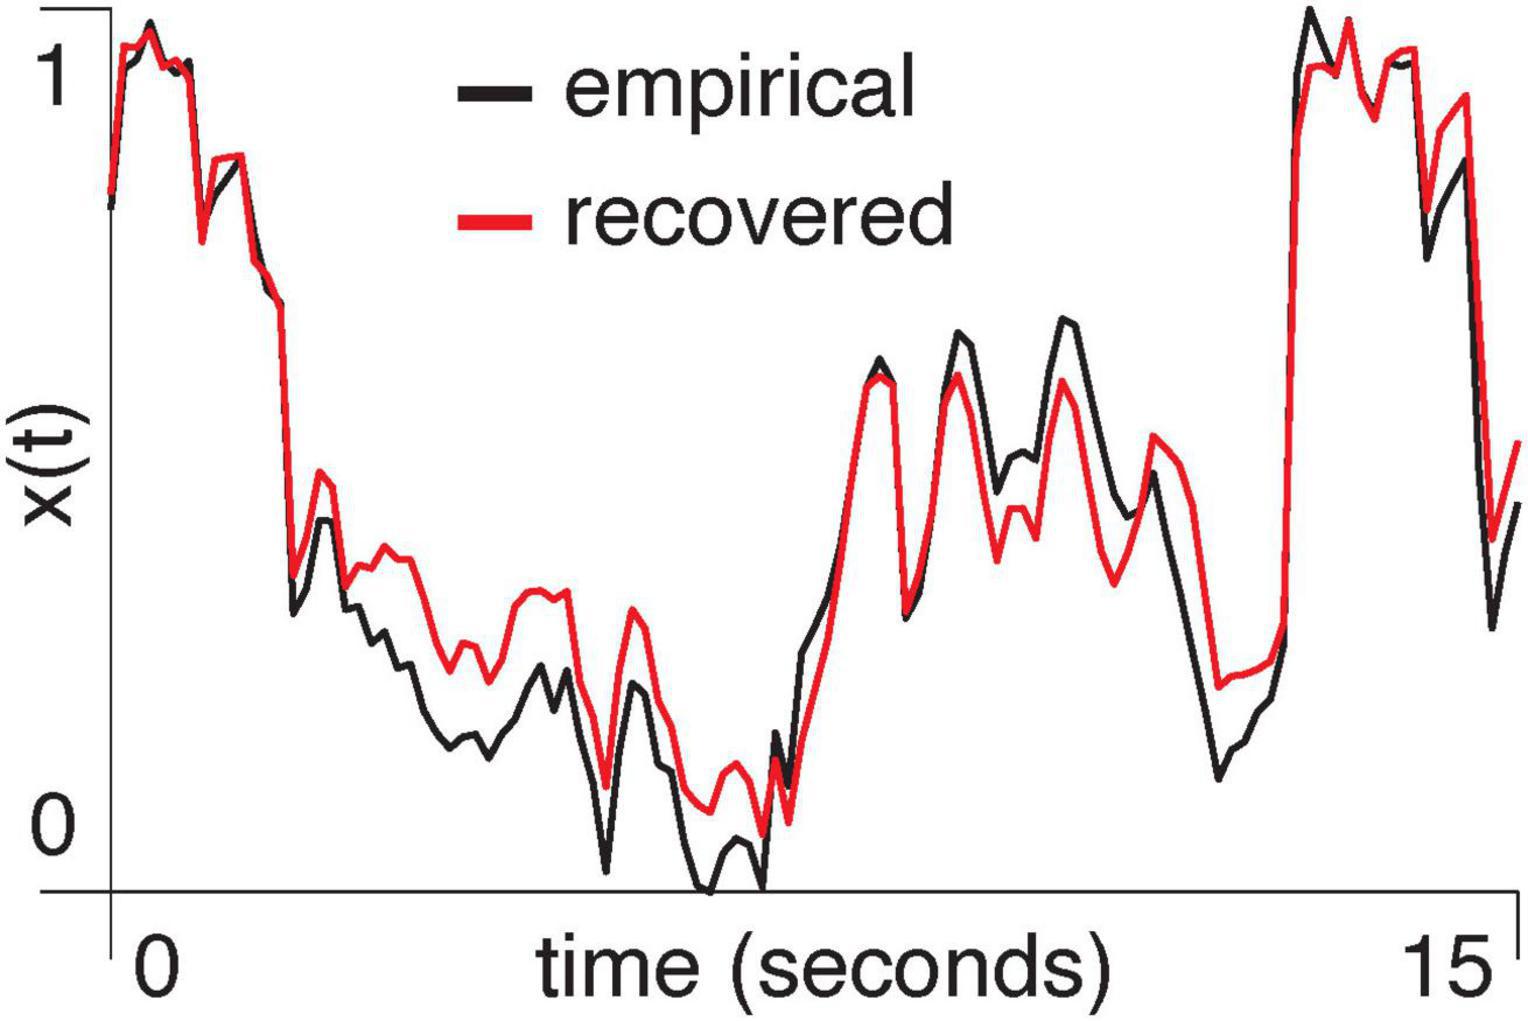
Figure 4. A segment of the normalized first principal component of two-photon signal amplitude from area AM in mouse M3 is shown in black. The red trace shows the result of using V1 to predict activity in AM with the mixed-flow transformation model.
Correcting for multiple comparisons using false discovery rate (FDR), we performed this same analysis for every pair of regions across mice (Figure 5).
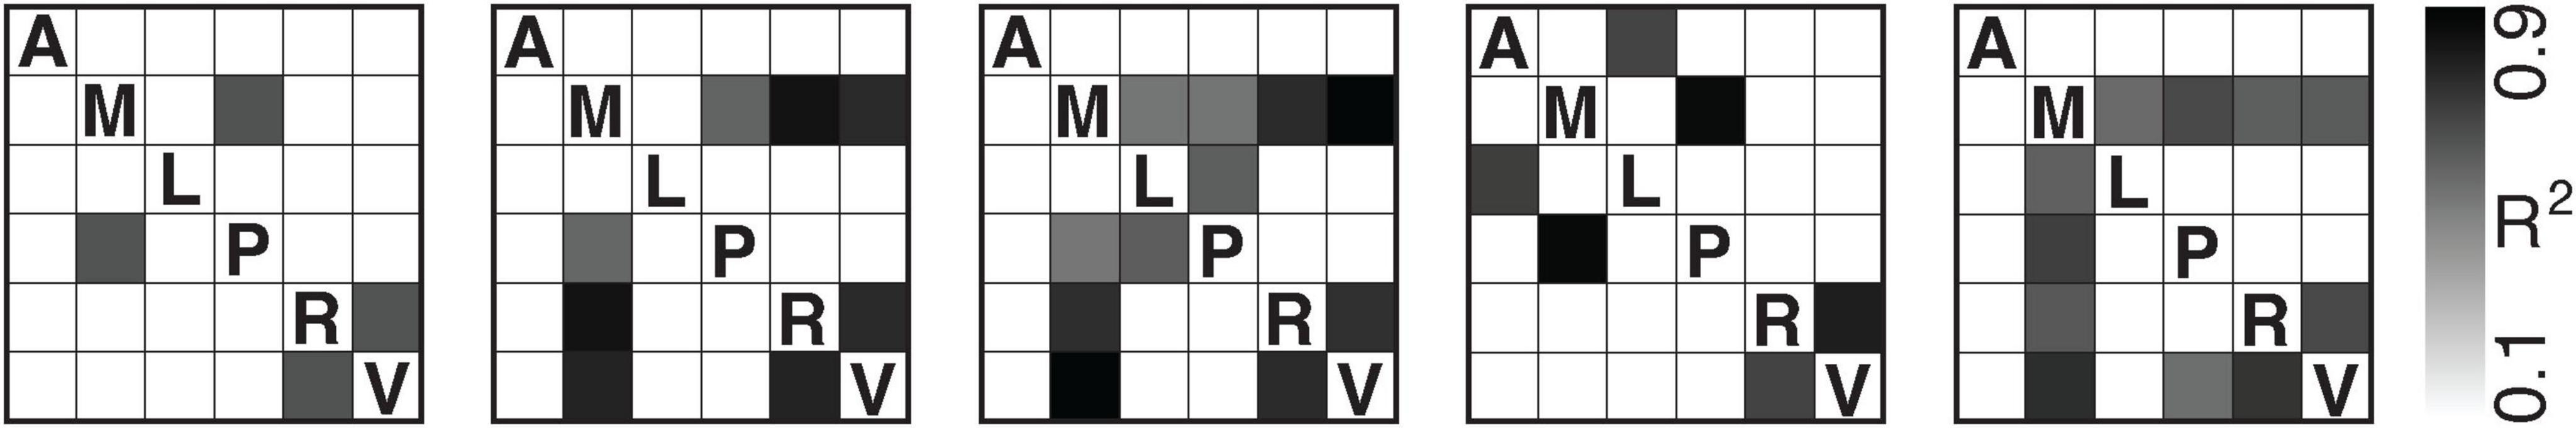
Figure 5. Pairwise directional predictability between brain regions: anterolateral (A), anteromedial (M), lateromedial (L), posteromedial (P), rostrolateral (R), and primary visual cortex (V). Each matrix corresponds to one mouse (M1–M5, left to right). Greyscale values indicate the coefficient of determination (R2) for directional prediction strength between each pair of cortical regions. Note that all values remain significant following FDR correction. We show the equivalent results using Bonferroni correction in Supplementary Figure 1.
The highest R2 values which are consistent across all five mice occur between the rostrolateral area and primary visual cortex. Across all region pairs, α averaged (−8.9 ± 8.0) × 10−6 and β −1.0 ± 0.1 (see Supplementary Table 1), indicating that expectation-driven transformations dominated the mappings.
Discussion
In this study, we formalize the link between the geometric structure of probability distributions and their information-theoretic content. Specifically, we show that transformations between zero-mean Gaussian distributions can be decomposed into orthogonal entropic and expectation-based components. The centered symmetric distribution assumption used here serves only as an analytically tractable illustration of orthogonal entropy and expectation flows, not as a biological constraint. We validated this framework on synthetic data and then applied it to two-photon neuroimaging from the murine visual cortex, demonstrating how information geometry can reveal structured transformations between populations.
Our analysis revealed a robust bi-directional transformation between the rostrolateral area (RL) and the primary visual cortex (V1). RL integrates visual input from V1 with movement- and task-related signals (Rasmussen et al., 2021), playing a role analogous to the parietal cortex in primates (D’Souza et al., 2022). The observed reciprocity between RL and V1 therefore suggests a loop consistent with predictive-coding theories, in which visual processing arises from reciprocal exchanges between hierarchical regions (Huang and Rao, 2011; Jurjut et al., 2017; Wang and Burkhalter, 2007).
The link between neural dynamics and information processing shown here also aligns with the efficient coding hypothesis, which posits that neural systems adapt their responses to match the statistical structure of sensory input (Manookin and Rieke, 2023). In our framework, entropic and expectation flows capture this adaptation by adjusting the spread and mean of neural activity. In communication-through-coherence (CTC) models (Fries, 2015), information exchange is most effective when inputs arrive during times of high excitability. Analogously, unpredictable sensory input corresponds to dominant entropic flow that broadens response range, whereas predictable or task-driven states correspond to dominant expectation flow that centers activity on relevant signal averages.
In our formulation, the entropy term quantifies the spread of activity distributions within each region, reflecting intrinsic variability, whereas the expectation term quantifies systematic mean shifts reflecting signal transfer between regions. The fitted coefficients α and β thus separate transformation components driven by shared fluctuations versus structured shifts. Regions with strong shared components exhibit higher joint predictability and lower divergence, whereas those dominated by independent fluctuations exhibit higher entropy but weaker coupling.
Traditional approaches such as Granger causality (Ding et al., 2006) or mutual information (Quian Quiroga and Panzeri, 2009) quantify statistical dependencies between regions but do not specify the form of the transformation linking them. Our framework addresses this gap by modeling how one region’s probability distribution is geometrically transformed into that of another. Under zero-mean Gaussian assumptions, the orthogonality of entropic and expectation flows ensures that these transformation components can be interpreted independently. In summary, we introduce a framework that decomposes information-geometric transformations between neural probability distributions into interpretable information-theoretic flow components. Although demonstrated here in the murine visual cortex, the same approach provides a versatile tool for testing theories of neural function across species, modalities, and scales.
Data availability statement
Publicly available datasets were analyzed in this study. This data can be found here: https://figshare.com/articles/dataset/Data_from_Functional_Parcellation_of_Mouse_Visual_Cortex_Using_Statistical_Techniques_Reveals_Response-Dependent_Clustering_of_Cortical_Processing_Areas_/13476522/1. All MATLAB code used to produce results is made available at: https://github.com/allavailablepubliccode/info_flow.
Ethics statement
The animal study was approved by the experiments for collecting the wide-field dataset were carried out under protocols approved by MIT’s Animal Care and Use Committee (Protocol Approval Number: 1020-099-23) and conform to NIH guidelines. The study was conducted in accordance with the local legislation and institutional requirements.
Author contributions
EDF: Conceptualization, Data curation, Formal analysis, Funding acquisition, Investigation, Methodology, Project administration, Resources, Software, Supervision, Validation, Visualization, Writing – original draft, Writing – review & editing. HT: Conceptualization, Data curation, Formal analysis, Funding acquisition, Investigation, Methodology, Project administration, Resources, Software, Supervision, Validation, Visualization, Writing – original draft, Writing – review & editing. MB: Conceptualization, Data curation, Formal analysis, Funding acquisition, Investigation, Methodology, Project administration, Resources, Software, Supervision, Validation, Visualization, Writing – original draft, Writing – review & editing.
Funding
The author(s) declare financial support was received for the research and/or publication of this article. EDF was supported by the Czech Health Research Agency (AZV, NW25-04-00226). HT was supported by Grant-in-Aid for Scientific Research (C) (22H05079, 22H05082, 25K14517), the Japan Society for the Promotion of Science, and Japan Science and Technology Agency (JST), and CREST grant number JPMJCR2433.
Acknowledgments
We acknowledge support from Masaryk University and project no. LX22NPO5107 (MEYS): Financed by European Union – Next Generation EU.
Conflict of interest
The authors declare that the research was conducted in the absence of any commercial or financial relationships that could be construed as a potential conflict of interest.
Generative AI statement
The authors declare that no Generative AI was used in the creation of this manuscript.
Any alternative text (alt text) provided alongside figures in this article has been generated by Frontiers with the support of artificial intelligence and reasonable efforts have been made to ensure accuracy, including review by the authors wherever possible. If you identify any issues, please contact us.
Publisher’s note
All claims expressed in this article are solely those of the authors and do not necessarily represent those of their affiliated organizations, or those of the publisher, the editors and the reviewers. Any product that may be evaluated in this article, or claim that may be made by its manufacturer, is not guaranteed or endorsed by the publisher.
Supplementary material
The Supplementary Material for this article can be found online at: https://www.frontiersin.org/articles/10.3389/fninf.2025.1700481/full#supplementary-material
References
Amari, S.-I., and Nagaoka, H. (2000). Methods of information geometry, Vol. 191. Providence: American Mathematical Society.
Andermann, M. L., and Moore, C. I. A. (2006). somatotopic map of vibrissa motion direction within a barrel column. Nat. Neurosci. 9, 543–551. doi: 10.1038/nn1671
Barlow, H. B. (1961). Possible principles underlying the transformation of sensory messages. Sensory Commun. 1, 217–233.
Bastos, A. M., and Schoffelen, J.-M. (2016). A tutorial review of functional connectivity analysis methods and their interpretational pitfalls. Front. Syst. Neurosci. 9:175. doi: 10.3389/fnsys.2015.00175
Benjamini, Y., and Hochberg, Y. (1995). Controlling the false discovery rate: A practical and powerful approach to multiple testing. J. R. Stat. Soc. Ser. B 57, 289–300. doi: 10.1111/j.2517-6161.1995.tb02031.x
Borst, A., and Theunissen, F. E. (1999). Information theory and neural coding. Nat. Neurosci. 2, 947–957. doi: 10.1038/14731
Clark, A. (2013). Whatever next? Predictive brains, situated agents, and the future of cognitive science. Behav. Brain Sci. 36, 181–204. doi: 10.1017/S0140525X12000477
Cohn, P. M. (1957). Cambridge Tracts in Mathematics and Mathematical Physics. Cambridge: Cambridge University Press.
D’Souza, R. D., Wang, Q., Ji, W., Meier, A., Kennedy, H., Knoblauch, K., et al. (2022). Hierarchical and nonhierarchical features of the mouse visual cortical network. Nat. Commun. 13:503. doi: 10.1038/s41467-022-28035-y
Ding, M., Chen, Y., and Bressler, S. L. (2006). “Granger causality: Basic theory and application to neuroscience,” in Handbook of time series analysis: Recent theoretical developments and applications, eds B. Schelter, M. Winterhalder, and J. Timmer (Hoboken, NJ: John Wiley & Sons), 437–460.
Fagerholm, E. D., Dezhina, Z., Moran, R. J., Turkheimer, F. E., and Leech, R. A. (2023). primer on entropy in neuroscience. Neurosci. Biobehav. Rev. 146:105070. doi: 10.1016/j.neubiorev.2023.105070
Felleman, D. J., and Van Essen, D. C. (1991). Distributed hierarchical processing in the primate cerebral cortex. Cereb. cortex 1, 1–47. doi: 10.1093/cercor/1.1.1-a
Fiser, J., Berkes, P., Orbán, G., and Lengyel, M. (2010). Statistically optimal perception and learning: From behavior to neural representations. Trends Cogn. Sci. 14, 119–130. doi: 10.1016/j.tics.2010.01.003
Fries, P. (2015). Rhythms for cognition: Communication through coherence. Neuron 88, 220–235. doi: 10.1016/j.neuron.2015.09.034
Friston, K. (2005). A theory of cortical responses. Philos. Trans. R. Soc. B Biol. Sci. 360, 815–836. doi: 10.1098/rstb.2005.1622
Friston, K. J. (2011). Functional and effective connectivity: A review. Brain Connect. 1, 13–36. doi: 10.1089/brain.2011.0008
Gerstner, W., and Kistler, W. M. (2002). Spiking neuron models: Single neurons, populations, plasticity. Cambridge: Cambridge university press.
Glickfeld, L. L., Andermann, M. L., Bonin, V., and Reid, R. C. (2013). Cortico-cortical projections in mouse visual cortex are functionally target specific. Nat. Neurosci. 16, 219–226. doi: 10.1038/nn.3300
Harris, J. A., Mihalas, S., Hirokawa, K., Whitesell, J., Choi, H., Bernard, A., et al. (2019). Hierarchical organization of cortical and thalamic connectivity. Nature 575, 195–202. doi: 10.1038/s41586-019-1716-z
Helias, M., Tetzlaff, T., and Diesmann, M. (2014). The correlation structure of local neuronal networks intrinsically results from recurrent dynamics. PLoS Comput. Biol. 10:e1003428. doi: 10.1371/journal.pcbi.1003428
Huang, Y., and Rao, R. P. (2011). Predictive coding. Wiley Interdiscip. Rev. Cogn. Sci. 2, 580–593. doi: 10.1002/wcs.142
Jurjut, O., Georgieva, P., Busse, L., and Katzner, S. (2017). Learning enhances sensory processing in mouse V1 before improving behavior. J. Neurosci. 37, 6460–6474. doi: 10.1523/JNEUROSCI.3485-16.2017
Kumar, M. G., Hu, M., Ramanujan, A., Sur, M., and Murthy, H. A. (2021). Functional parcellation of mouse visual cortex using statistical techniques reveals response-dependent clustering of cortical processing areas. PLoS Comput. Biol. 17:e1008548. doi: 10.1371/journal.pcbi.1008548
Lánskı, P., and Sacerdote, L. (2001). The Ornstein–Uhlenbeck neuronal model with signal-dependent noise. Phys. Lett. A 285, 132–140. doi: 10.1016/S0375-9601(01)00340-1
Ma, W. J., Beck, J. M., Latham, P. E., and Pouget, A. (2006). Bayesian inference with probabilistic population codes. Nat. Neurosci. 9, 1432–1438. doi: 10.1038/nn1790
Manookin, M. B., and Rieke, F. (2023). Two sides of the same coin: Efficient and predictive neural coding. Annu. Rev. Vis. Sci. 9, 293–311. doi: 10.1146/annurev-vision-112122-020941
Marshel, J. H., Garrett, M. E., Nauhaus, I., and Callaway, E. M. (2011). Functional specialization of seven mouse visual cortical areas. Neuron 72, 1040–1054. doi: 10.1016/j.neuron.2011.12.004
Noether, E. (1983). “Invariante variationsprobleme,” in Gesammelte Abhandlungen-Collected Papers (Berlin: Springer), 231–239.
Panzeri, S., Harvey, C. D., Piasini, E., Latham, P. E., and Fellin, T. (2017). Cracking the neural code for sensory perception by combining statistics, intervention, and behavior. Neuron 93, 491–507. doi: 10.1016/j.neuron.2016.12.036
Quian Quiroga, R., and Panzeri, S. (2009). Extracting information from neuronal populations: Information theory and decoding approaches. Nat. Rev. Neurosc. 10, 173–185. doi: 10.1038/nrn2578
Rao, R. P., and Ballard, D. H. (1999). Predictive coding in the visual cortex: A functional interpretation of some extra-classical receptive-field effects. Nat. Neurosci. 2, 79–87. doi: 10.1038/4580
Rasmussen, R. N., Matsumoto, A., Arvin, S., and Yonehara, K. (2021). Binocular integration of retinal motion information underlies optic flow processing by the cortex. Curr. Biol. 31, 1165–1174. e1166. doi: 10.1016/j.cub.2020.12.034
Seth, A. K., Barrett, A. B., and Barnett, L. (2015). Granger causality analysis in neuroscience and neuroimaging. J. Neurosci. 35, 3293–3297. doi: 10.1523/JNEUROSCI.4399-14.2015
Simoncelli, E. P., and Olshausen, B. A. (2001). Natural image statistics and neural representation. Annu. Rev. Neurosci. 24, 1193–1216. doi: 10.1146/annurev.neuro.24.1.1193
Wang, Q., and Burkhalter, A. (2007). Area map of mouse visual cortex. J. Comp. Neurol. 502, 339–357. doi: 10.1002/cne.21286
Keywords: information geometry, gradient flows, neural connectivity, entropy, expectation, two photon, calcium imaging
Citation: Fagerholm ED, Tanaka H and Brázdil M (2025) Information-theoretic gradient flows in mouse visual cortex. Front. Neuroinform. 19:1700481. doi: 10.3389/fninf.2025.1700481
Received: 06 September 2025; Accepted: 14 October 2025;
Published: 30 October 2025.
Edited by:
Pedro Antonio Valdes-Sosa, University of Electronic Science and Technology of China, ChinaCopyright © 2025 Fagerholm, Tanaka and Brázdil. This is an open-access article distributed under the terms of the Creative Commons Attribution License (CC BY). The use, distribution or reproduction in other forums is permitted, provided the original author(s) and the copyright owner(s) are credited and that the original publication in this journal is cited, in accordance with accepted academic practice. No use, distribution or reproduction is permitted which does not comply with these terms.
*Correspondence: Erik D. Fagerholm, ZXJpay5kYW5pZWwuZmFnZXJob2xtQG1lZC5tdW5pLmN6