 Hui Yao
 Mengxue Yang1,2†
 Xin Jiang
 Tao Sun
 Molin Li
 Xuefeng Tang
- 1Department of Pathology, Chongqing General Hospital, Chongqing University, Chongqing, China
- 2Chongqing Medical University, Chongqing, China
- 3Department of Pathology, Zhaotong First People’s Hospital, Zhaotong, Yunnan, China
- 4Hangzhou Medipath Intelligent Technology Co., Ltd., Hangzhou, Zhejiang, China
Introduction: Osteosarcoma is the most common malignant tumor of bone tissue in adolescents, and precise pathological diagnosis is the primary foundation for establishing the most effective treatment plan. The pathological evaluation of tumor necrosis after chemotherapy is crucial for assessing therapeutic efficacy in osteosarcoma patients. However, pathologists often face several challenges during the diagnosis and evaluation process.
Methods: To address these needs, we designed and developed a multi-model cascaded deep learning framework utilizing an advanced Vision Mamba (ViM) model as the core network architecture. The study employed one of the most comprehensive osteosarcoma datasets, sourced from: (1) real-world data from 68 osteosarcoma patients collected at Chongqing General Hospital, and (2) publicly available osteosarcoma assessment data from the University of Texas Southwestern/UT Dallas. Pathological images were annotated using the Palgo pathology image artificial intelligence self-training platform according to algorithm requirements. A triple verification mechanism of annotation, review, and archiving was implemented, and Palgo’s integrated interactive algorithm correction mechanism was used to continuously refine the data annotation process.
Results and Discussion: The model demonstrated Dice coefficient values of 0.83 or higher in tumor segmentation, osteosarcoma osteoid matrix segmentation, necrotic area segmentation, lung metastatic tumor segmentation, and lung metastatic osteoid matrix segmentation. For necrosis classification, overall osteosarcoma subtypes, and localized osteosarcoma subtypes, the area under the receiver operating characteristics curve (AUC), sensitivity, specificity, positive predictive value (PPV), and negative predictive value (NPV) all exceeded 90%. The proposed model exhibited excellent performance, indicating high potential for future clinical application in osteosarcoma patients. This framework shows promise for enhancing the precision and efficiency of pathological diagnosis and evaluation in osteosarcoma management.
1 Introduction
Osteosarcoma is a rare cancer, but it is the most common malignant bone cancer primarily affecting individuals between the ages of 10 and 30, making it the third most common cancer among children and adolescents (1, 2). Annually, there are approximately 4.4 cases per million children worldwide (3). The disease can be classified in various ways, including primary and secondary types. Primary osteosarcoma accounts for 75% of cases (3), typically occurring in children and young adults and presenting as abnormal bone growth, while secondary osteosarcoma is more common in adults with mature bones, usually triggered by another disease. Primary osteosarcoma also varies in form, with common types including intramedullary, parosteal, and periosteal osteosarcomas (4). In addition, osteosarcomas can be categorized as conventional central osteosarcoma (commonly featuring osteoblastic, chondroblastic, and fibroblastic cells), vascular spread type, intrabony type, and small cell osteosarcoma (5).
The most common sites for osteosarcoma are the femur (42%), tibia (19%), and humerus (10%) (6). Those located at the distal femur and proximal tibia have a survival rate of 50%–65%, however 25%–50% of patients with initial metastases succumb to pulmonary metastasis (7). Although the progression of localized and distant osteosarcoma metastases is slow, the presence or absence of metastasis is an important prognostic factor (8). Additionally, cancer cells often exhibit abnormal apoptotic mechanisms that promote tumor development and pose challenges for the effective treatment of tumors due to the resulting resistance to treatment (9). Thus, early detection and accurate prediction of treatment responses in osteosarcoma are crucial for improving patient prognosis.
Moreover, traditional pathological diagnosis relies heavily on the experience and expertise of pathologists, which is not only time-consuming but also susceptible to subjective judgment. With the explosive growth of medical image data, the limitations of manual analysis are becoming increasingly apparent. Computer-assisted detection (CAD) is essential to aid clinicians in examining histopathological images. CAD-based analysis of histopathological images is also a challenging field within biomedical image analysis (10). Recent studies based on medical data have shown that deep learning (DL) can be used to extract and analyze medical image information with great success (11, 12).
The use of artificial intelligence (AI) has revolutionized osteosarcoma research, with both traditional machine learning and DL techniques achieving significant advancements. For instance, traditional methods, such as random forest (RF) and support vector machines (SVMs) have demonstrated promising accuracy in classifying osteosarcoma based on metabolomic and histopathological data (26, 28). In addition, DL models, including convolutional neural networks (CNNs) and generative adversarial networks (GANs), have shown exceptional performance in tumor classification and segmentation, achieving detection accuracies as high as 96% (32, 40). Additionally, frameworks such as UNet [53] and Deeplab [57] have further enhanced segmentation precision, even with limited datasets.
`Recent advances in transformer-based models, such as the Vision Transformer (ViT), have introduced self-attention mechanisms that excel in capturing global image features (21). The Vision Mamba (ViM) model, a state-of-the-art alternative, reduces computational demands while maintaining high performance, operating at 2.8 times the speed of traditional ViT models and consuming 86.8% less GPU memory (23). Prognostic studies incorporating AI have also identified critical biomarkers and predictive models, such as DeepSurv, which outperform classical methods like Cox regression analysis in survival prediction (45). These advancements underscore the potential of AI in improving both diagnostic accuracy and prognostic evaluation in osteosarcoma studies.
In this study, we implemented the cutting-edge DL model Mamba (13), using it across various domains, including classification and image segmentation. Within the realm of DL, frameworks such as CNNs (14–20) and ViT (21) have achieved remarkable outcomes. CNNs excel at processing local patterns and textural details, but struggle with capturing the broader context and long-range dependencies within images. On the other hand, the transformer architecture (22), particularly the ViT, has outperformed in numerous visual tasks, leveraging its prowess in handling long-distance dependencies and sequential data processing. However, ViT models usually require extensive datasets for training and are computationally expensive. In this study, we used the advanced ViM model as our core network architecture, which operates at 2.8 times the speed of contemporary ViT models while consuming approximately 86.8% less GPU memory, thus offering an efficient alternative that mitigates the heavy computational demands of traditional transformer models (23).
Additionally, since digital pathological images are obtained by scanning histopathological images, whole slide imaging includes a vast amount of data, with a single histopathological unit containing numerous cells (24). Handling such big data with a single model presents significant challenges. Our study uses a multi-model cascading approach to effectively tackle this issue. In the low-magnification view, the first-stage model completes a general feature analysis and preliminary localization of tumor regions. Then, in the high-magnification view, subsequent models perform a detailed observation of specific tumor cell subtypes, enhancing diagnostic precision. In addition, through a branching structure, it is possible to parallel process additional pathological features, such as the diagnosis of lung metastasis, thus achieving a more comprehensive disease analysis and evaluation. This multi-model cascading and branching approach not only fully leverages the strengths of different models to enhance the efficiency and accuracy of processing large-scale pathological images, but also allows for flexible adjustments according to specific tasks, offering new possibilities for the intelligent diagnosis of complex diseases like osteosarcoma.
The structure of this article is as follows: After this introduction section, Section 2 describes the data collection and labeling process used in this study, and details how we use a multi-model cascading DL framework to detect osteosarcoma; Section 3 describes the analysis of the experimental results of osteosarcoma detection; finally, Section 4 discusses existing issues and directions for improvement.
2 Materials and methods
2.1 Materials
In this study, we used one of the most comprehensive datasets of osteosarcoma patients, obtained from two key sources: 1. real-world data from 68 osteosarcoma patients collected at the Chongqing General Hospital (from May 2012 to March 2022), and 2. publicly available osteosarcoma assessment data from the University of Texas (UT) Southwestern/UT Dallas, which includes records of 50 patients treated at Children’s Medical Center Dallas between 1995 and 2015 (https://wiki.cancerimagingarchive.net/pages/viewpage.action?pageId=52756935, accessed January 10, 2023) (25).
The clinical characteristics of 68 osteosarcoma patients are shown in Table 1, among whom 32 patients received preoperative chemotherapy. The chemotherapy regimens are summarized in Table 2. The inclusion and exclusion criteria for tissue slides were as follows:
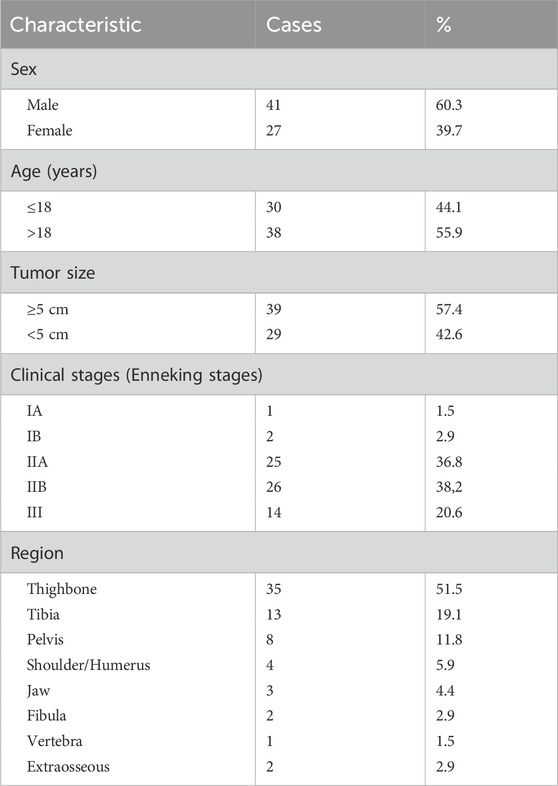
Table 1. Clinical characteristics in osteosarcoma patients (n = 68).
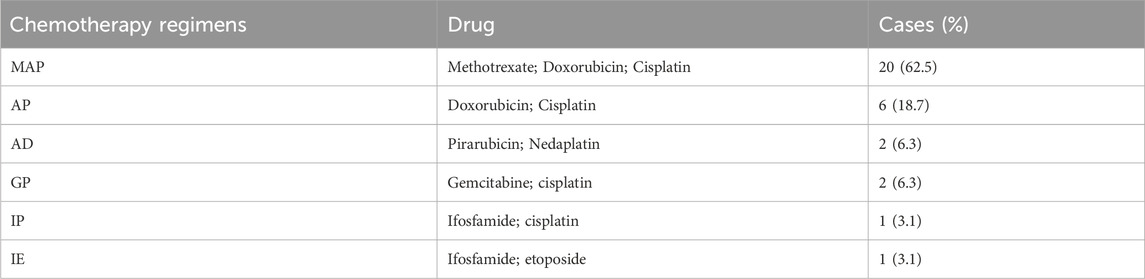
Table 2. Chemotherapy regimens for osteosarcoma patients (n = 32).
2.1.1 Inclusion criteria
1. Cases of osteosarcoma confirmed by histology and treatment efficacy.
2. Complete clinical data available.
3. Adequate tissue samples obtained.
4. Decalcified tissue, with well-preserved fixation, and satisfactory staining results.
2.1.2 Exclusion criteria
1. Specimens containing disputed elements where a diagnostic consensus could not be reached.
2. Poor-quality slides due to issues during the preparation process, such as overly thin or thick tissue sections, knife marks, cell distortion, or unsatisfactory staining.
To ensure the adequacy of the training data and prevent overfitting, we used not only conventional data augmentation techniques, such as color perturbation, rotation, and scaling, but also a pathology-specific large-tile random cropping method, provided by the Palgo platform, during training.
Palgo Pathology Image Artificial Intelligence Self-Training Platform (https://www.palgo.com.cn/) is an advanced AI tool for automated pathology image analysis. It integrates deep learning algorithms, annotation tools, and automated model optimization processes, enabling efficient training and deployment of customized AI models for pathology tasks. Pathology images were uploaded to the platform in standardized formats (e.g., JPEG or TIFF) and preprocessed using built-in augmentation tools. Model training was tailored to the specific task, employing a transfer learning approach with a pre-trained model, further fine-tuned on a labeled dataset to enhance task-specific performance. Automated hyperparameter tuning optimized learning rates and batch sizes, reducing manual intervention. Evaluation used a 20% hold-out test set with metrics including Dice Similarity Coefficient and Intersection-over-Union (IoU). The platform’s self-training capabilities enabled customization of convolutional neural network (CNN) architectures for the specific task. Its interactive annotation tool expedited high-quality training data creation, while the visual analytics dashboard allowed real-time monitoring of performance. The Palgo platform was pivotal in achieving efficient and accurate renal pathology image segmentation, reducing manual annotation efforts while maintaining high performance. These methods were crucial in ensuring the robustness and adequacy of the training data, as detailed below.
From the Chongqing General Hospital, we collected data from 68 osteosarcoma patients, including 40 cases of osteoblastic osteosarcoma, 13 cases of chondroblastic osteosarcoma, 7 cases of fibroblastic osteosarcoma, and 8 cases of other rare osteosarcoma subtypes. In total, we obtained 128 whole slide images (WSIs) stained with hematoxylin and eosin (H&E) staining, including 9 lung metastasis samples. The data statistics used in each cascaded algorithm are provided in Table 3. For example, in the tumor region segmentation algorithm, the training set included annotations for 2,035 tumors, while the test set had annotations for 150 tumors. Similarly, in the tumor cell segmentation algorithm, four types of cells were labeled: osteoblastic, chondroblastic, fibroblastic, and other cells. Osteoblastic cells were the most prevalent, with 23,799 labeled training targets and 327 test targets. For necrosis classification, the training set contained 1,248 non-necrotic samples and 244 necrotic samples, while the test set included 101 non-necrotic and 22 necrotic samples. More detailed statistics are given in Table 3.
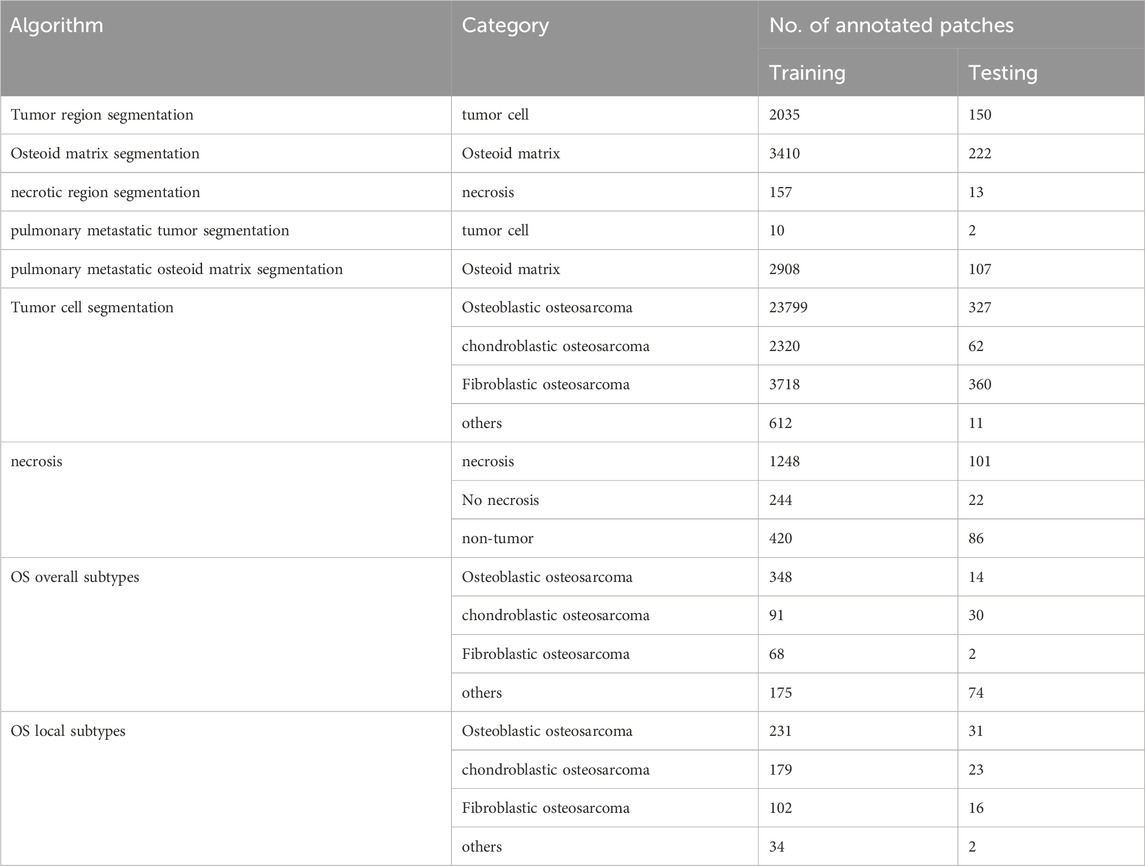
Table 3. Details of data annotation for each algorithm.
All annotations were performed by three mid-level pathologists from Chongqing General Hospital, each with over 5 years of diagnostic experience. These annotations were then reviewed by two senior pathologists with over 10 years of experience to ensure accuracy. It is worth noting that each WSI has a resolution of approximately 100,000 × 100,000 pixels, but for training purposes, we used smaller image tiles, each with size of 1,024 × 1,024 pixels. To further increase the dataset, we used the random scaling and cropping method of Palgo, which generates around 100 random tiles from the effective regions of each WSI during each round of training. Compared to traditional fixed-tile methods, this approach ensures that the characteristics of each tile differ throughout the training process, while also allowing for multiple labeled regions to be processed in a single WSI. For example, in the tumor region segmentation task, using 128 WSIs resulted in approximately 12,800 tiles per training round. The labeling process also used the tiling approach, with annotations distributed randomly across the tiles.
Additionally, we used the publicly available osteosarcoma dataset from the UT Southwestern/UT Dallas to evaluate viable and necrotic tumors. This dataset consists of H&E-stained osteosarcoma histopathological images and includes records of 50 patients treated at Children’s Medical Center Dallas between 1995 and 2015. It is one of the most commonly used datasets in the research community. The dataset comprises 1,144 images, each sized 1,024 × 1,024 pixels, and was annotated by two clinical experts. In our study, we directly used the fixed-tile method from this dataset.
2.2 Algorithms
The aim of this study was to develop and validate a multi-model cascaded DL framework for the intelligent diagnosis of osteosarcoma from pathological images. By combining state-of-the-art DL models, particularly the ViM network and ViM UNet (ViM-UNet) architecture, we have constructed a comprehensive analysis system capable of accurately identifying and segmenting key features in osteosarcoma pathology images, including viable tissue regions, tumor areas, bone-like matrix, necrotic zones, as well as performing fine classification of tumor cells and detecting lung metastasis tumors.
2.2.1 Classification models
The analysis system developed in this study incorporates the latest ViM network as a feature extractor for image classification. As shown in Figure 1A, different from the original ViM model, in this study the network structure is divided into four stages, using patch merging between each stage to reduce the feature map size and double the channel numbers from the original. Notably, between the original input image and Stage 1, this study uses the same patch embedding structure as that in a Swin transformer network, which directly reduces the feature map to 1/4 of its original size (26, 27). The Virtual Storage Software (VSS) block is the core module in each stage, as depicted in Figure 1B, with the most important two-dimensional (2D) Selective Scan (SS2D) adopting a structure similar to that of ViM-UNet (28). In our study, this structure effectively extracts classification features and achieves good classification results. In addition, it serves as a consistent backbone and encoder for the subsequent segmentation model.
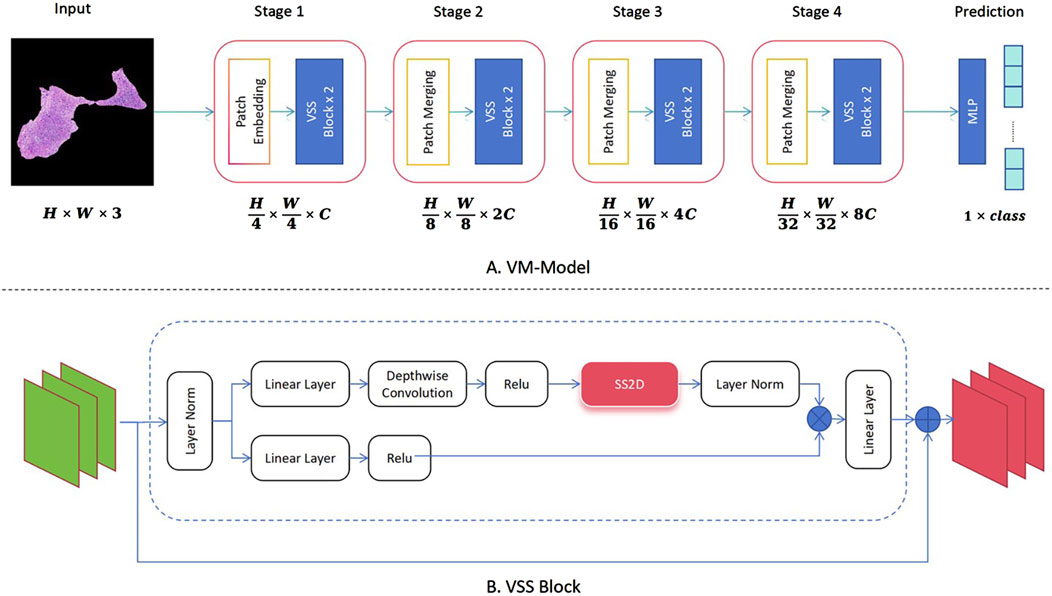
Figure 1. Implementation of the classification algorithm using Vision Mamba (ViM) as the feature extraction network. (A) Complete classification network structure of the ViM model. (B) Specific composition of the core VSS block module.
2.2.2 Segmentation models
In this study, the ViM network and ViM-UNet are combined to form the image-based segmentation network, as shown in Figure 2. The VSS block used in this study is the same as that used in the classification model shown in Figure 1A. Unlike ViM-UNet, in this study the commonly used skip connection structure is used in UNet to achieve feature fusion between the encoder and decoder, as shown in Figure 2B. Additionally, patch expanding is used as the upsampling module, with the structure detailed in Figure 2C. It must be noted that, in this study, in order to maintain consistency with the input feature map size, in the final stage of the decoder the patch expanding structure outputs four times the channels in the linear layer compared to before, thus transforming the feature map from (H × W×2C --> H × W × 16C). Another difference from ViM-UNet (28) is that due to the larger pixels of the pathology images compared to other medical images, a tile-based segmentation approach is used for prediction. This involves pre-scaling the images with fixed-scale proportional scaling, then dividing the scaled images into fixed-size tiles with overlap for full-image segmentation. Each tile is individually analyzed using the aforementioned network for prediction, and the results are then stitched back together. In addition, a linear distance-weighted fusion method is applied to the junctions for seamless integration.
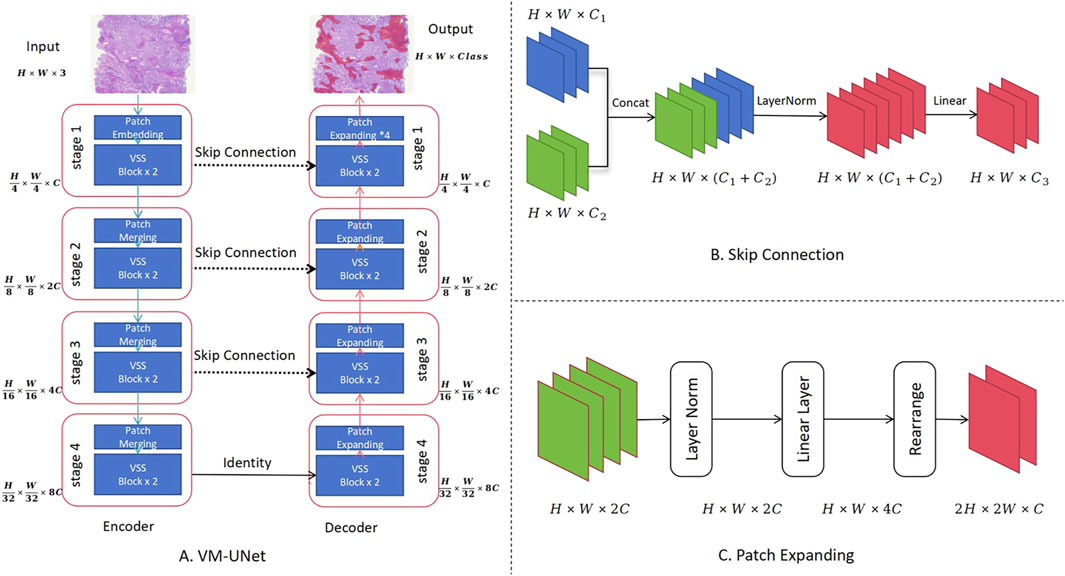
Figure 2. Use of the Vision Mamba UNet (ViM-UNet) as the image-based segmentation network. (A) The complete UNet structure is shown, including the encoder and decoder. (B) Diagram showing how the skip connection structure achieves feature fusion between the encoder and decoder. (C) Diagram showing how the patch expanding structure, actually implemented, achieves sampling and feature recovery.
2.2.3 Model cascading
The Palgo platform was used in this study to design the model cascade strategy, as shown in Figure 3, achieving a gradual refinement of the extraction of pathological features from coarse to fine by performing the analysis at different resolutions and perspectives. The initial model swiftly identifies and locates key tissue regions at low magnifications, while subsequent models perform more detailed analysis and classification at higher magnifications to ensure comprehensive and accurate pathological diagnosis. The data flow within the cascade uses a “threshold + type gating structure” to automatically control the downstream algorithm data. For example, in the gate algorithm for excluding osteoid matrix, positions judged to be osteoid matrix within tumors are automatically removed before detailed analysis of tumor cells. Details of magnification levels (e.g., mpp = 5.0, 2.0, 0.23), input sizes, and gating thresholds used at each stage are comprehensively summarized in Supplementary Table S2.
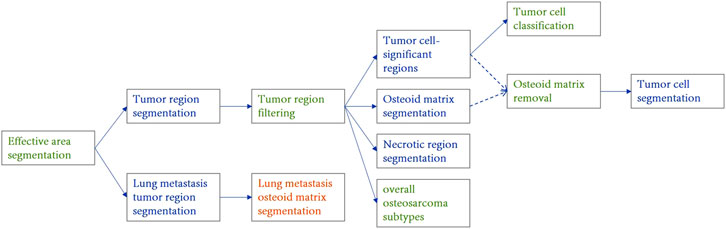
Figure 3. Structural diagram of the osteosarcoma cascaded model ensemble. The blue component represents the instance segmentation network, the yellow component represents the semantic segmentation network, and the green component represents the image classification or filtering module. Different stages operate at specific image resolutions (e.g., mpp = 5.0, 2.0, 0.23) and are connected via gated logic based on confidence and area thresholds. Detailed parameters are provided in Supplementary Table S2.
In this study, tissue region localization and tumor area positioning are achieved at low magnifications, osteoid matrix segmentation and necrotic area localization at medium magnifications, and tumor cell identification and specific tumor type classification at high magnifications. The overall subtype classification for osteosarcoma is determined through a global view, while the localized osteosarcoma subtypes (in the tumor cell cascaded classification module) focus on the determination of the subtype of the most prominent tumor regions at high magnifications. Tumor cell segmentation further identifies and locates tumor cells based on their specific types.
To account for the histological heterogeneity of osteosarcoma, we designed two complementary subtype classification strategies in the cascade:
1. Overall subtype classification, which determines the dominant subtype by aggregating the total predicted area of each subtype across the entire slide;
2. Localized subtype classification, which determines the dominant subtype based on the number of positively predicted tiles for each subtype within high-magnification tumor cell regions.
The block-count-based localized subtype classification emphasizes discrete, high-grade foci (e.g., chondroblastic or fibroblastic areas) that, despite their small size, are clinically significant. Compared to area-based methods easily biased by large low-grade regions, this approach more accurately reflects the focal heterogeneity of aggressive subtypes and aligns with pathological assessment and clinical decision-making.
2.2.4 Training methods
In this study, a multi-round weakly supervised training scheme with manual intervention was used, continuously optimizing and adjusting model performance by incorporating expert knowledge and feedback at different stages. Also, by combining data augmentation, transfer learning, and fine-grained annotation strategies, the limited pathological image resources are fully utilized to enhance the generalization ability and diagnostic accuracy of the model. Additionally, the initial model undergoes transfer learning after training on a large-scale dataset. The model uses the Adam optimizer and implements a learning rate warm-up strategy. The loss function used is the cross-entropy loss, applying the cross-entropy loss at each pixel for the segmentation task.
To improve methodological transparency and ensure reproducibility, the complete training configuration (including optimizer settings, learning rate schedules, and pathology-specific augmentation strategies) is described in Supplementary Text S1. In addition, task-specific hyperparameters such as input resolution, patch size, and batch size for each model are summarized in Supplementary Table S1.
2.3 Statistical analysis
In this study, a comprehensive statistical analysis was conducted to evaluate the performance of the proposed multi-model cascaded DL framework in the detection and classification of various pathological features of osteosarcoma. The evaluation metrics included the Dice coefficient, intersection over union (IoU), sensitivity, specificity, precision, recall, false positive rate (FPR), true positive rate (TPR), negative predictive value (NPV), positive predictive value (PPV), false discovery rate (FDR), false omission rate (FOR), and overall accuracy (ACC). These metrics provided a holistic assessment of the capability of the model in localizing and segmenting tumor regions, osteoid matrix, necrotic areas, tumor cells, and pulmonary metastatic regions, as well as in classifying necrosis and subtypes of osteosarcoma.
For segmentation tasks, the Dice coefficient values and IoU values were the primary metrics used to measure the spatial overlap between predicted regions and ground truth. Sensitivity, specificity, and precision were used to assess the detection performance for each segmented category, while the FPR and TPR quantified the trade-off between false positives and true positives. For classification tasks, metrics such as area under the receiver operating characteristics (ROC) curve (AUC), precision-recall (PR) curves, and confusion matrices were used to evaluate the accuracy of necrosis detection, overall classification of osteosarcoma subtypes, and classification of localized osteosarcoma subtypes.
The statistical analysis was performed on both training and test datasets, with multiple evaluations performed for each model to ensure robustness and consistency. Special attention was given to the challenges posed by the variability and complexity of datasets, such as the segmentation of small-scale tumor regions and highly overlapping cellular structures. To address these challenges, we analyzed discrepancies in Dice scores for smaller objects and investigated the impact of limited sample sizes on the classification accuracy. All statistical calculations were performed using Python libraries, including Scikit-learn, to ensure precise and reproducible results.
3 Results
We performed a statistical analysis of the effectiveness of detecting various features in osteosarcoma pathology images. The detection tasks included the localization and segmentation of tumor regions, osteoid matrix, necrotic areas, tumor cell regions within the tumor, and pulmonary metastatic tumor regions. Additionally, we also assessed the classification results for overall osteosarcoma subtypes, localized osteosarcoma subtypes, and the presence of necrosis. The performance of the models was comprehensively evaluated using metrics such as Dice coefficient, IoU, sensitivity, specificity, precision, recall, FPR, TPR, NPV, PPV, FDR, FOR, and ACC.
3.1 Localization and segmentation of tumor regions, osteoid matrix, necrotic areas, tumor cell regions within the tumor, and pulmonary metastatic tumor regions
We used five segmentation models to determine the localization and perform the segmentation of tumor regions, osteoid matrix, necrotic areas, tumor cells within the tumor, and pulmonary metastatic tumor regions (the performance of each model is shown in Figure 4). All models used the ViM-UNet architecture. The best results for tumor region segmentation were achieved with both primary osteosarcoma and pulmonary metastasis tumor segmentation attaining over 0.95 Dice correlation value (see Table 4; Figure 4 for details). However, the tumor segmentation results showed a relatively high FPR, suggesting that some small targets were detected, which, despite not significantly affecting overall detection, did increase the FPR. To address this issue, we incorporated a small tumor region filtering classification algorithm to filter out these small targets (referred to as the tumor region filtering model in Figure 3). Additionally, ViM-UNet showed excellent performance in necrotic region segmentation, achieving a Dice score of 0.942.
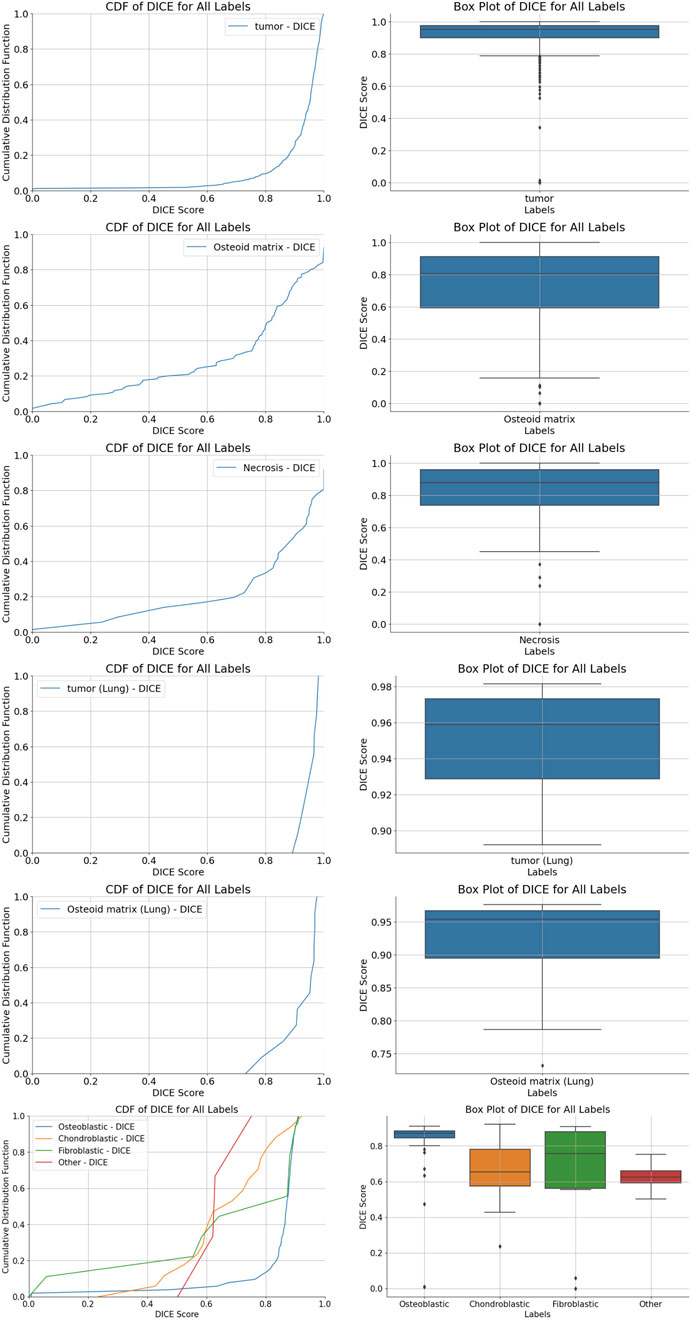
Figure 4. Cumulative distribution function (CDF) distribution of Dice coefficient values for various region segmentations. (A,B) tumor region segmentation; (C,D) osteoid matrix segmentation; (E,F) necrotic region segmentation; (G,H) pulmonary metastatic tumor segmentation; (I,J) pulmonary metastasis osteoid matrix segmentation; (K,L) tumor cell segmentation, along with boxplots of Dice coefficient scores for each algorithm.
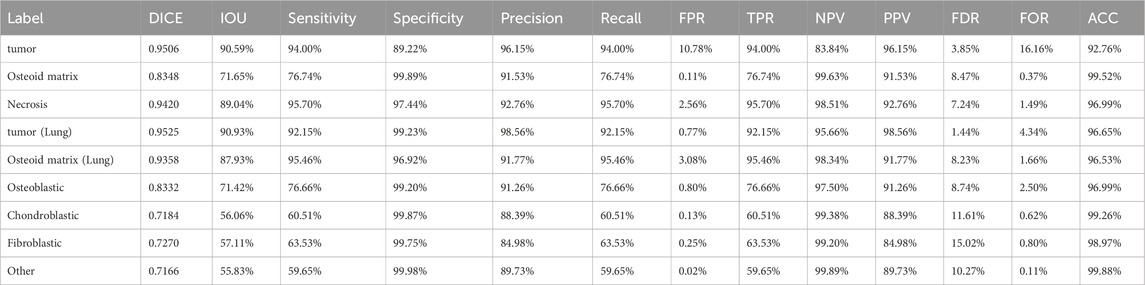
Table 4. Detailed values for tumor segmentation, osteosarcoma osseous matrix segmentation, necrotic area segmentation, lung metastasis tumor segmentation, lung metastasis osseous matrix segmentation, and tumor cell segmentation.
For osteoid matrix segmentation, the performance in pulmonary metastatic osteoid matrix (Dice score of 0.9358 was notably better than that in primary osteosarcoma (Dice score 0.8348). As shown in the upper part of Figure 5, the osteoid matrix features are highly distinguishable in pulmonary metastatic samples, making them easier to recognize. In primary osteosarcoma samples, where the pathology is more complex and there are many interfering structures like osteogenic tissue, periosteum, and cartilage, the segmentation task is more challenging. However, despite these complexities, the model still performed well in identifying osteoid matrix within osteosarcoma.
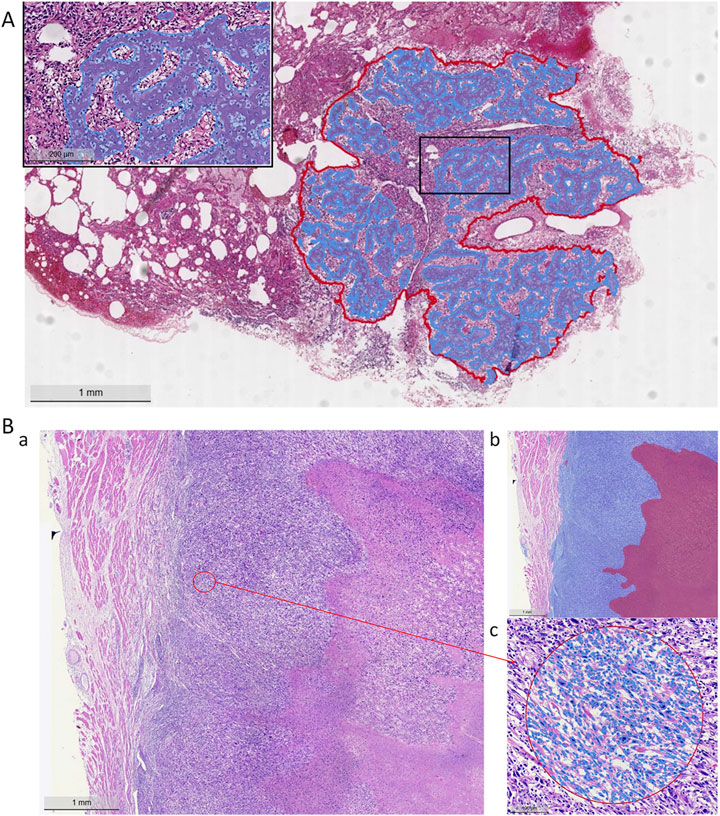
Figure 5. Model segmentation performance. (A) Lung metastasis tumor segmentation and osteoid matrix segmentation localization (red curve indicates the metastatic tumor area, blue curve indicates the osteoid matrix area). (B) Necrotic region segmentation and tumor cell identification (a: H&E staining image, b: blue area on the left indicates tumor cells, red area on the right indicates necrosis, c: tumor cell identification).
In the tumor cell segmentation task, the ViM-UNet model achieved accurate localization and subtype identification of osteoblastic, chondroblastic, and fibroblastic cells. As shown in Table 4 and Figure 4, the Dice scores for these subtypes were relatively lower (minimum 0.7184) compared to other segmentation tasks. This can be attributed to the small size of individual cells, which leads to higher sensitivity of the Dice metric to minor boundary deviations. Nevertheless, the model demonstrated high performance in terms of accuracy (minimum 97%), specificity, and precision. A detailed analysis of metric behavior for small target volumes is provided in Supplementary Text S2.
3.2 Classification results of overall osteosarcoma subtypes, localized osteosarcoma subtypes, and the presence of necrosis
We used three models to classify necrosis, overall osteosarcoma subtypes, and localized osteosarcoma subtypes. All these models were based on the ViM architecture, with input images scaled to a fixed size of 512 pixels. The PR curve, ROC curve, and confusion matrix for each model are shown in Figure 6. As shown in Table 5, the AUC, sensitivity, specificity, PPV, and NPV for necrosis classification, overall osteosarcoma subtypes, and localized osteosarcoma subtypes all exceeded 90%.
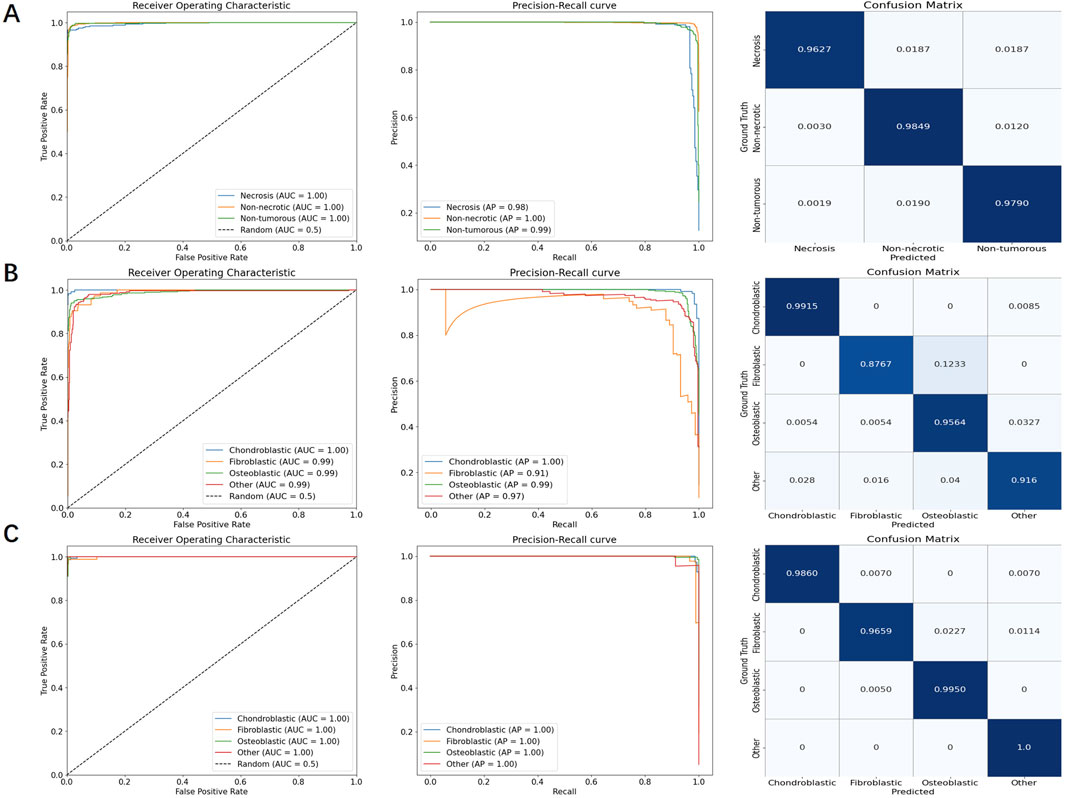
Figure 6. PR curves, ROC curves, and confusion matrices for necrosis classification, overall osteosarcoma subtypes, and localized osteosarcoma subtypes, respectively. (A) necrosis classification; (B) overall osteosarcoma subtypes; (C) localized osteosarcoma subtypes.
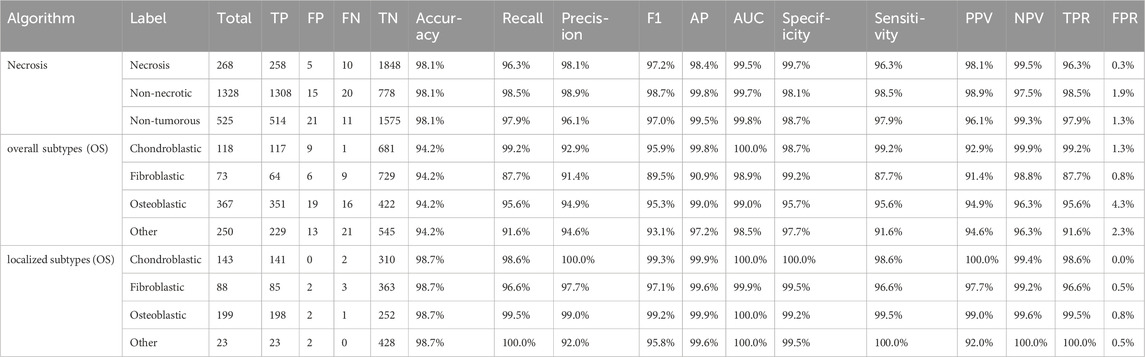
Table 5. FP, FN, AUC, sensitivity, specificity, PPV, and NPV values for necrosis classification, overall osteosarcoma subtypes, and localized osteosarcoma subtypes.
In particular, the tumor region filtering model, introduced earlier, was used to classify necrosis. This model not only filters out small targets (classified as “other”) but also identifies the presence of necrosis within tumors. The ROC curve showed an AUC of approximately 99.5%, while the PR curve showed an AP value of around 98.4%. Additionally, the confusion matrix revealed very few misclassifications between different categories.
For the specific classification of osteosarcoma subtypes, due to sample size limitations, we only examined three types, namely, chondroblastic, fibroblastic, and osteoblastic subtypes. Other subtypes, as well as non-tumor samples, were categorized as “other”. We evaluated both overall subtype classification (based on the entire segmented tumor region) and localized osteosarcoma subtype classification (based on significant regions within the tumor). A comparison of the results shown in Table 5 revealed that the detection of localized osteosarcoma subtypes outperformed that of overall osteosarcoma subtypes. The results in Figure 6 reveal that fibroblastic osteosarcoma was more prone to be misclassified as osteoblastic in overall subtype classification, but this error was significantly reduced in localized osteosarcoma subtype classification. This finding indicates that incorporating local detail significantly improves the accuracy of osteosarcoma subtype classification.
As demonstrated in Table 5, subtype classification achieved generally satisfactory performance when evaluated using false positive (FP) and false negative (FN) rates. Notably, the fibroblastic subtype showed a disproportionately high false negative rate (9 cases), representing approximately 12% of its total samples in the classification analysis. The confusion matrix in Figure 6 reveals that the majority of these misclassified fibroblastic cases were incorrectly categorized as osteoblastic. This observation underscores a particular diagnostic challenge in distinguishing between fibroblastic and osteoblastic subtypes, which may stem from their shared morphological characteristics. These results indicate that future studies should prioritize 1. enhanced feature representation for fibroblastic subtypes and 2. expanded training datasets to mitigate classification errors.
3.3 Patient-level analysis
To determine the final osteosarcoma subtype at the patient level, we used two aggregation strategies: one based on the total area of each subtype and the other on the block count of each subtype. For the overall osteosarcoma subtype analysis, the total area of each subtype was summed up across all slides for each patient, and the subtype with the largest area proportion was assigned as the overall subtype of the patient. Conversely, the localized osteosarcoma subtype analysis summed up the block counts of each subtype across all slides, classifying the subtype with the highest block proportion as the localized osteosarcoma subtype of the patient.
A comparative evaluation revealed notable differences in the classification performance. The overall osteosarcoma subtype analysis achieved a classification accuracy of 91.7%, but higher misclassification rates were observed, particularly between chondroblastic and fibroblastic subtypes. In contrast, the analysis of localized osteosarcoma subtypes demonstrated superior performance, with a classification accuracy of 96.7%. The finer granularity of block-level aggregation provided a more precise representation of tumor heterogeneity, significantly reducing subtype misclassification.
To validate these findings, we constructed confusion matrices for both methods (Figure 7), which revealed the classification performance of these methods. Patient-level aggregation, while integrating data from multiple slides for a holistic diagnosis, had a slightly lower accuracy than slide-level analysis. This discrepancy is due to the presence in certain cases of multiple coexisting subtypes within local regions, complicating subtype determination. Despite this, patient-level methods showed robust performance, emphasizing the importance of integrating multi-slide information for clinical workflows and offering potential for further refinement in osteosarcoma diagnostics.
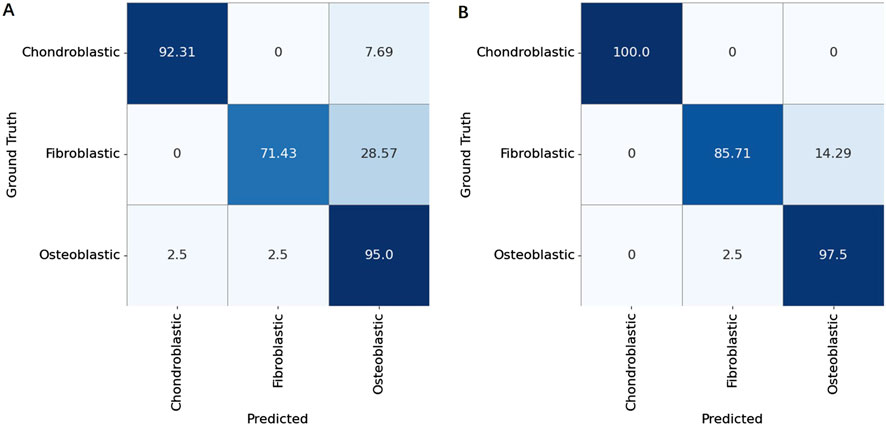
Figure 7. Confusion matrices for patient-level classification of osteosarcoma subtypes (Chondroblastic, Fibroblastic, and Osteoblastic) using two aggregation strategies. (A) Results obtained by aggregating tile-level predictions based on the overall area proportion of each subtype within a patient’s whole slide image. (B) Results obtained by aggregating tile-level predictions based on the local block count (majority voting of subdivided regions).
4 Discussion
Osteosarcoma, a highly malignant and heterogeneous tumor primarily affecting children and adolescents, presents significant challenges in diagnosis and classification. Although current treatment modalities, such as neoadjuvant chemotherapy (NAC) and surgery, are the gold standard, evaluating therapeutic outcomes remains labor-intensive and complex. This study addresses these challenges by developing a comprehensive multimodal cascaded DL framework. By integrating advanced models, including the ViM network and ViM-UNet architecture, the framework systematically analyzes viable, necrotic, and non-tumor regions, alongside classifying tumor subtypes and identifying metastatic features. These advancements represent substantial improvements in diagnostic accuracy and efficiency.
4.1 Comparative analysis with previous work
Unlike previous studies that predominantly focused on isolated tasks, such as segmentation or classification at the patch level, this study uniquely combines case-level, whole-slide, and localized analyses within a unified pipeline. Earlier studies, such as those by Mishra et al. and Aziz et al. (29, 30), achieved commendable accuracy, but operated within constrained scopes—focusing on either segmentation or classification without addressing the whole complexity of osteosarcoma pathology. On the other hand, our cascading workflow integrates these tasks hierarchically, enabling a comprehensive and clinically actionable evaluation. This structured methodology significantly outperforms traditional patch-based models, setting a new standard for AI application in pathology (Table 6).
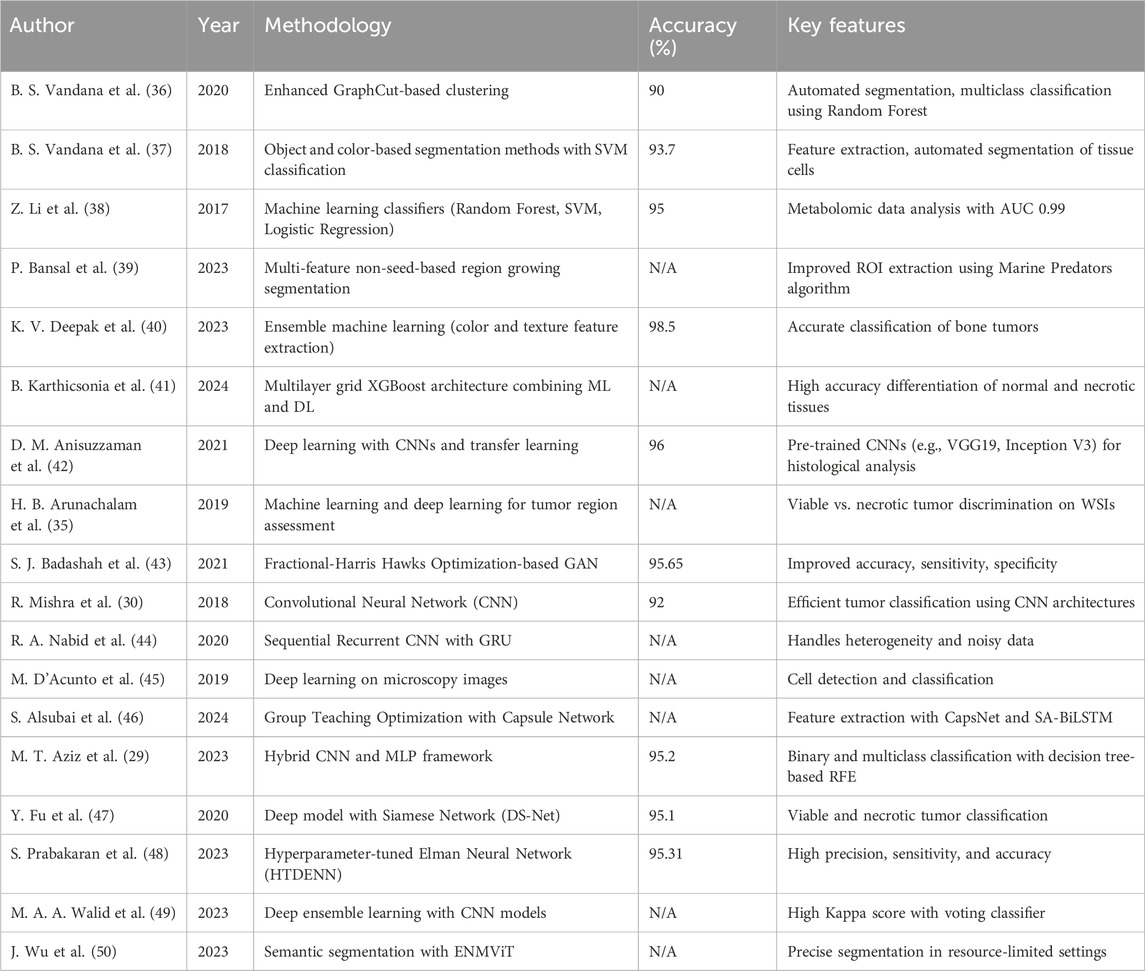
Table 6. Summary of similar sarcoma research studies.
4.2 Limitations and challenges
Despite its advancements, this study has several limitations:
1. Limited case-level samples: Osteosarcoma is a rare and heterogeneous malignancy, and both institutional and publicly available datasets are extremely limited. Our study combined a retrospective cohort from Chongqing General Hospital (2012–2022) and the public UT Southwestern dataset (1995–2015) to maximize sample diversity. We recognize that such pooling may introduce batch effects due to differences in staining protocols, scanning devices, and patient demographics. This remains one of the limitations of our work.
2. Regression model feasibility: Although the framework provides valuable quantitative outputs, building intelligent regression models for case-level analysis demands extensive sample sizes. The current dataset is insufficient to support the development of robust regression models.
3. Limitations of the pathological subtype classification: This study included some post-chemotherapy samples. Chemotherapy can lead to changes in the morphology of tumor cells, including alterations in size, shape, nuclear condensation, and reduced cytoplasm. At the same time, chemotherapy drugs can also affect the tumor stroma. After chemotherapy, the tumor stroma often exhibits fibrosis, foam cell reaction, and lymphocyte infiltration. In some cases, large areas of necrosis can be observed in tumors following chemotherapy. We study primarily focused on the three main subtypes of osteosarcoma. The number of pathological samples is limited, and some patients received preoperative chemotherapy, which influenced the morphology of tumor cells and introduced bias to the results. Additionally, a detailed analysis of less common subtypes was not performed, leading to an insufficient examination of the heterogeneity of osteosarcoma. However, fortunately, a significant area of necrosis was observed in the tumors of some patients who underwent chemotherapy. Our model identified the necrotic areas, which will be helpful for future assessments of chemotherapy effectiveness in these patients.
4. Subtype-specific classification strategy: To address osteosarcoma heterogeneity, this study employed both area-weighted and tile-level classification approaches. The tile-level method—based on majority voting of fixed-size patches proved more effective in detecting small, spatially confined subtypes. Compared to area-weighted statistics that may overlook focal high-grade components, the tile-based strategy enhances sensitivity to local variations and better reflects mixed histological patterns. This was especially evident in chondroblastic and fibroblastic subtypes, where improved classification performance was observed.
5. Limitations of metastatic samples: This study included some lung metastasis samples. Osteosarcoma primarily metastasizes through the bloodstream, with the lungs being the most common site of metastasis. During the metastatic process, it is possible that only a portion of the tumor cells spread. Due to the heterogeneity within the tumor, the metastatic tumor may exhibit different histological features compared to the primary tumor. Additionally, the microenvironment surrounding the metastatic tumor differs from that of the primary tumor. A combination of various factors contributes to the distinct pathological characteristics of the metastatic tumor. However, this study aimed to demonstrate the superiority of the cascade model within a workflow; whether lung metastasis has occurred is one of the branch outputs. Additionally, this study compared the effect of osteoid matrix between bone samples and lung metastasis samples and found that the model can still accurately identify osteoid matrix in lung metastasis samples. Therefore, lung metastasis samples were ultimately retained.
6. Clinical Integration: The absence of extensive clinical trials and real-world validation restricts the immediate applicability of the framework in medical practice. Prospective studies in clinical environments are critical to bridge this gap.
4.3 Future directions
To overcome the above limitations and expand the scope of the current study, the following areas will be prioritized in future research:
1. Dataset expansion: Acquiring larger and more diverse datasets will enhance model robustness and enable more generalized conclusions. This will also facilitate the development of regression models for predicting clinical outcomes based on case-level quantitative indicators.
2. Comprehensive subtype analysis: Broadening the analysis to include additional rare osteosarcoma subtypes will provide a more holistic understanding of the disease and its variations.
3. Prognostic modeling: Enhancing the accuracy of the model in identifying necrotic areas, and integrating this framework with prognostic tools like DeepSurv to predict patient outcomes and guide treatment strategies (31–35).
4. Clinical validation and workflow integration: Conducting extensive clinical trials to validate the performance of the framework in real-world settings and integrating it into clinical workflows to streamline diagnostic processes.
5. Self-supervised learning approaches: Reducing reliance on manual annotations by using unsupervised or self-supervised learning techniques, thereby enhancing scalability and adaptability.
4.4 Conclusion
This study represents a significant advancement in leveraging AI for the pathological analysis of osteosarcoma. By addressing the heterogeneity and complexity issues of osteosarcoma through a multimodal cascaded framework, this study enhances diagnostic precision while setting the stage for integrating AI-driven solutions into clinical workflows. Future work focusing on dataset expansion, subtype diversity, and clinical validation will ensure these advancements translate effectively into improving patient care and outcomes.
Data availability statement
The raw data supporting the conclusions of this article will be made available by the authors, without undue reservation.
Ethics statement
The studies involving humans were approved by the Medical Ethics Committee of Chongqing General Hospital. The studies were conducted in accordance with the local legislation and institutional requirements. Written informed consent for participation in this study was provided by the participants’ legal guardians/next of kin.
Author contributions
HY: Writing – original draft. MY: Writing – original draft. XJ: Writing – review and editing. HJ: Writing – review and editing. TS: Writing – review and editing. ML: Writing – review and editing. TW: Writing – review and editing. XT: Writing – review and editing.
Funding
The author(s) declare that financial support was received for the research and/or publication of this article. This work was supported by the Special Key Projects for Technological Innovation and Application Development of Chongqing (grant no. 2022TIAD-KPX0243), the Science and Health Research Project of Chongqing (grant no. 2023MSXM034).
Conflict of interest
Author TW was employed by Hangzhou Medipath Intelligent Technology Co., Ltd.
The remaining authors declare that the research was conducted in the absence of any commercial or financial relationships that could be construed as a potential conflict of interest.
Generative AI statement
The author(s) declare that no Generative AI was used in the creation of this manuscript.
Any alternative text (alt text) provided alongside figures in this article has been generated by Frontiers with the support of artificial intelligence and reasonable efforts have been made to ensure accuracy, including review by the authors wherever possible. If you identify any issues, please contact us.
Publisher’s note
All claims expressed in this article are solely those of the authors and do not necessarily represent those of their affiliated organizations, or those of the publisher, the editors and the reviewers. Any product that may be evaluated in this article, or claim that may be made by its manufacturer, is not guaranteed or endorsed by the publisher.
Supplementary material
The Supplementary Material for this article can be found online at: https://www.frontiersin.org/articles/10.3389/or.2025.1592408/full#supplementary-material
References
1. Geller, DS, and Gorlick, R. Osteosarcoma: a review of diagnosis, management, and treatment strategies. Clin Adv Hematol Oncol (2010) 8(10):705–18.
2. Wittig, JC, Bickels, J, Priebat, D, Jelinek, J, Kellar-Graney, K, Shmookler, B, et al. Osteosarcoma: a multidisciplinary approach to diagnosis and treatment. Am Fam Physician (2002) 65(6):1123–32. Available online at: https://pubmed.ncbi.nlm.nih.gov/11925089/ (Accessed August 15, 2024).
3. Eaton, BR, Schwarz, R, Vatner, R, Yeh, B, Claude, L, Indelicato, DJ, et al. Osteosarcoma. Pediatr Blood and Cancer (2021) 68(S2):e28352. doi:10.1002/pbc.28352
4. Schwab, JH, Antonescu, CR, Athanasian, EA, Boland, PJ, Healey, JH, and Morris, CD. A comparison of intramedullary and juxtacortical low-grade osteogenic sarcoma. Clin Orthopaedics and Relat Res (2008) 466(6):1318–22. doi:10.1007/s11999-008-0251-2
5. Harper, K, Sathiadoss, P, Saifuddin, A, and Sheikh, A. A review of imaging of surface sarcomas of bone. Skeletal Radiol (2021) 50(1):9–28. doi:10.1007/s00256-020-03546-1
6. Jaffe, N, Bruland, OS, and Bielack, S. Pediatric and adolescent osteosarcoma, 152. Springer Science and Business Media (2010). Available online at: https://www.google.com/books?hl=zh-CN&lr=&id=xu-macWfJMcC&oi=fnd&pg=PR3&dq=Pediatric+and+Adolescent+Osteosarcoma&ots=KCenqsagEI&sig=ivu_vozzTDrU1AhYEkbr2ohi_C4 (Accessed April 26, 2024).
7. De Nigris, F, Rossiello, R, Schiano, C, Arra, C, Williams-Ignarro, S, Barbieri, A, et al. Deletion of yin yang 1 protein in osteosarcoma cells on cell invasion and CXCR4/Angiogenesis and metastasis. Cancer Res (2008) 68(6):1797–808. doi:10.1158/0008-5472.CAN-07-5582
8. Li, W, Liu, Y, Liu, W, Tang, ZR, Dong, S, Li, W, et al. Machine learning-based prediction of lymph node metastasis among osteosarcoma patients. Front Oncol (2022) 12:797103. doi:10.3389/fonc.2022.797103
9. Pistritto, G, Trisciuoglio, D, Ceci, C, Garufi, A, and D’Orazi, G. Apoptosis as anticancer mechanism: function and dysfunction of its modulators and targeted therapeutic strategies. Aging (albany NY) (2016) 8(4):603–19. doi:10.18632/aging.100934
10. Xia, G, Ran, T, Wu, H, Wang, M, and Pan, J. The development of mask R-CNN to detect osteosarcoma and oste-ochondroma in X-ray radiographs. Computer Methods Biomech Biomed Eng Imaging and Visualization (2023) 11(5):1869–75. doi:10.1080/21681163.2023.2196577
11. Litjens, G, Sánchez, CI, Timofeeva, N, Hermsen, M, Nagtegaal, I, Kovacs, I, et al. Deep learning as a tool for increased accuracy and efficiency of histopathological diagnosis. Scientific Rep (2016) 6(1):26286. doi:10.1038/srep26286
12. Spanhol, FA, Oliveira, LS, Petitjean, C, and Heutte, L. Breast cancer histopathological image classification using convolutional neural networks. In: 2016 international joint conference on neural networks (IJCNN). IEEE (2016). p. 2560–7. Available online at: https://ieeexplore.ieee.org/abstract/document/7727519/ (Accessed April 26, 2024).
13. Gu, A, and Dao, T. Mamba: linear-time sequence modeling with selective state spaces. arXiv: arXiv:2312.00752 (2023). doi:10.48550/arXiv.2312.00752
14. Krizhevsky, A, Sutskever, I, and Hinton, GE. Imagenet classification with deep convolutional neural networks. Adv Neural Inf Process Syst (2012) 25. Available online at: https://proceedings.neurips.cc/paper/2012/hash/c399862d3b9d6b76c8436e924a68c45b-Abstract.html (Accessed April 26, 2024).
15. Simonyan, K, and Zisserman, A. Very deep convolutional networks for large-scale image recognition. arXiv: arXiv:1409.1556 (2015). Available online at: http://arxiv.org/abs/1409.1556 (Accessed April 26, 2024).
16. Szegedy, C, Liu, W, Jia, Y, Sermanet, P, Reed, S, Anguelov, D, et al. Going deeper with convolutions. In: Proceedings of the IEEE conference on computer vision and pattern recognition (2015). p. 1–9. Available online at: https://www.cv-foundation.org/openaccess/content_cvpr_2015/html/Szegedy_Going_Deeper_With_2015_CVPR_paper.html (Accessed April 26, 2024).
17. He, K, Zhang, X, Ren, S, and Sun, J. Deep residual learning for image recognition. In: Proceedings of the IEEE conference on computer vision and pattern recognition (2016). p. 770–8. Available online at: http://openaccess.thecvf.com/content_cvpr_2016/html/He_Deep_Residual_Learning_CVPR_2016_paper.html (Accessed April 26, 2024).
18. Huang, G, Liu, Z, Van Der Maaten, L, and Weinberger, KQ. Densely connected convolutional networks. In: Proceedings of the IEEE conference on computer vision and pattern recognition (2017). p. 4700–8. Available online at: http://openaccess.thecvf.com/content_cvpr_2017/html/Huang_Densely_Connected_Convolutional_CVPR_2017_paper.html (Accessed April 26, 2024).
19. Tan, M, and Le, Q. Efficientnet: rethinking model scaling for convolutional neural networks. In: International conference on machine learning. PMLR (2019). p. 6105–14. Available online at: http://proceedings.mlr.press/v97/tan19a.html?ref=jina-ai-gmbh.ghost.io (Accessed April 26, 2024).
20. Howard, AG, Zhu, M, Chen, B, Kalenichenko, D, Wang, W, Weyand, T, et al. MobileNets: efficient convolutional neural networks for Mobile vision applications. arXiv: arXiv: 1704.04861 (2017). Available online at: http://arxiv.org/abs/1704.04861 (Accessed April 26, 2024).
21. Dosovitskiy, A, Beyer, L, Kolesnikov, A, Weissenborn, D, Houlsby, N, et al. An image is worth 16x16 words: transformers for image recognition at scale. arXiv: arXiv:2010.11929 (2021). Available online at: http://arxiv.org/abs/2010.11929 (Accessed April 26, 2024).
22. Vaswani, A, Shazeer, N, Parmar, N, Uszkoreit, J, Jones, L, Gomez, AN, et al. Attention is all you need. Adv Neural Inf Process Syst (2017) 30. Available online at: https://proceedings.neurips.cc/paper/7181-attention-is-all (Accessed April 26, 2024).
23. Zhu, L, Liao, B, Zhang, Q, Wang, X, Liu, W, and Wang, X. Vision mamba: efficient visual representation learning with bidirectional state space model. arXiv: arXiv:2401.09417 (2024). doi:10.48550/arXiv.2401.09417
24. Asmaria, T, Mayasari, DA, Heryanto, MA, Kurniatie, M, Wati, R, and Aurellia, S. Osteosarcoma classification using convolutional neural network. In: Proceedings of the 2021 international conference on computer, control, informatics and its applications, virtual/online conference Indonesia: acm (2021). p. 26–30. doi:10.1145/3489088.3489093
25. Leavey, P, Sengupta, A, Rakheja, D, Daescu, O, Arunachalam, HB, and Mishra, R. Osteosarcoma data from ut southwestern/ut dallas for viable and necrotic tumor assessment. Cancer Imaging Arch (2019) 14. doi:10.7937/tcia.2019.bvhjhdas
26. Liu, Z, Lin, Y, Cao, Y, Hu, H, Wei, Y, Zhang, Z, et al. Swin transformer: hierarchical vision transformer using shifted windows. In: Proceedings of the IEEE/CVF international conference on computer vision (2021). p. 10012–22. Available online at: https://openaccess.thecvf.com/content/ICCV2021/html/Liu_Swin_Transformer_Hierarchical_Vision_Transformer_Using_Shifted_Windows_ICCV_2021_paper (Accessed April 29, 2024).
27. Cao, H, Wang, Y, Chen, J, Jiang, D, Zhang, X, Tian, Q, et al. “Swin-unet: unet-like pure transformer for medical image segmentation,” in Lecture Notes Computer Sci, Computer vision – ECCV 2022 workshops, L Karlinsky, T Michaeli, and K Nishino, Eds, vol. 13803, Cham: Springer Nature Switzerland (2023), pp. 205–18. doi:10.1007/978-3-031-25066-8_9
28. Ruan, J, and Xiang, S. VM-UNet: vision mamba UNet for medical image segmentation. arXiv: arXiv:2402.02491 (2024). doi:10.48550/arXiv.2402.02491
29. Aziz, T, Mahmud, SMH, Elahe, MF, Jahan, H, Rahman, MH, Nandi, D, et al. A novel hybrid approach for classifying osteosarcoma using deep feature extraction and multilayer perceptron. Diagnostics (2023) 13:2106. doi:10.3390/diagnostics13122106
30. Mishra, R, Daescu, O, Leavey, P, Rakheja, D, and Sengupta, A. Convolutional neural network for histopathological analysis of osteosarcoma. J Comput Biol (2018) 25(3):313–25. doi:10.1089/cmb.2017.0153
31. Liu, F, Xing, L, Zhang, X, and Zhang, X. A four-pseudogene classifier identified by machine learning serves as a novel prognostic marker for survival of osteosarcoma. Genes (2019) 10(6):414. doi:10.3390/genes10060414
32. Liu, Y, Xie, L, Wang, D, and Xia, K. A deep learning algorithm with good prediction efficacy for cancer-specific survival in osteosarcoma: a retrospective study. PLOS ONE (2023) 18:e0286841. doi:10.1371/journal.pone.0286841
33. Cheng, D, Liu, D, Li, X, Mi, Z, Zhang, Z, Tao, W, et al. A deep learning model for accurately predicting cancer-specific survival in patients with primary bone sarcoma of the extremity: a population-based study. Clin Transl Oncol (2023) 26(3):709–19. doi:10.1007/s12094-023-03291-6
34. Qu, H, Jiang, J, Zhan, X, Liang, Y, Guo, Q, Liu, P, et al. Integrating artificial intelligence in osteosarcoma prognosis: the prognostic significance of SERPINE2 and CPT1B biomarkers. Sci Rep (2024) 14(1):4318. doi:10.1038/s41598-024-54222-6
35. Arunachalam, HB, Mishra, R, Daescu, O, Cederberg, K, Rakheja, D, Sengupta, A, et al. Viable and necrotic tumor assessment from whole slide images of osteosarcoma using machine-learning and deep-learning models (2019).
36. Vandana, BS, Antony, PJ, and Alva, SR. Analysis of malignancy using enhanced GraphCut-Based clustering for diagnosis of bone cancer. In: M Tuba, S Akashe, and A Joshi, editors. Information and communication technology for sustainable development, 933. Singapore: Springer Singapore (2020). p. 453–62. doi:10.1007/978-981-13-7166-0_45Adv Intell Syst Comput
37. Vandana, BS, Antony, PJ, and Alva, SR. Significant feature extraction automated framework for cancer diagnosis from bone histopathology images. In: 2018 international conference on advances in computing, communications and informatics (ICACCI) (2018). p. 1046–51. doi:10.1109/ICACCI.2018.8554534
38. Li, Z, Soroushmehr, SMR, Hua, Y, Mao, M, Qiu, Y, and Najarian, K. Classifying osteosarcoma patients using machine learning approaches. In: 2017 39th annual international conference of the IEEE engineering in medicine and biology society (EMBC) (2017). p. 82–5. doi:10.1109/EMBC.2017.8036768
39. Bansal, P, Singhal, A, and Gehlot, K. Osteosarcoma detection from whole slide images using multi-feature non-seed-based region growing segmentation and feature extraction. Neural Process Lett (2023) 55(4):3671–93. doi:10.1007/s11063-022-10914-6
40. Deepak, KV, and Bharanidharan, R. Osteosarcoma detection in histopathology images using ensemble machine learning techniques. Biomed Signal Process Control (2023) 86:105281. doi:10.1016/j.bspc.2023.105281
41. Karthicsonia, B, and Vanitha, M. Multilayer grid XG boost architecture based automatic osteosarcoma classification. Biomed Signal Process Control (2024) 90:105782. doi:10.1016/j.bspc.2023.105782
42. Anisuzzaman, DM, Barzekar, H, Tong, L, Luo, J, and Yu, Z. A deep learning study on osteosarcoma detection from histological images (2021).
43. Badashah, SJ, Basha, SS, Ahamed, SR, and Subba Rao, SPV. Fractional-harris hawks optimization-based generative adversarial network for osteosarcoma detection using renyi entropy-hybrid fusion. Int J Intell Syst (2021) 36(10):6007–31. doi:10.1002/int.22539
44. Nabid, RA, Rahman, ML, and Hossain, MF. Classification of osteosarcoma tumor from histological image using sequential RCNN. In: 2020 11th international conference on electrical and computer engineering (ICECE). Dhaka, Bangladesh: IEEE (2020). p. 363–6. doi:10.1109/ICECE51571.2020.9393159
45. D’Acunto, M, Martinelli, M, and Moroni, D. From human mesenchymal stromal cells to osteosarcoma cells classification by deep learning. J Intell and Fuzzy Syst (2019) 37(6):7199–206. doi:10.3233/JIFS-179332
46. Alsubai, S, Dutta, AK, Alghayadh, F, Gilkaramenthi, R, Ishak, MK, Karim, FK, et al. Group teaching optimization with deep learning-driven osteosarcoma detection using histopathological images. IEEE Access (2024) 12:34089–98. doi:10.1109/access.2024.3371518
47. Fu, Y, Xue, P, Ji, H, Cui, W, and Dong, E. Deep model with Siamese network for viable and necrotic tumor regions assessment in osteosarcoma. Med Phys (2020) 47(10):4895–905. doi:10.1002/mp.14397
48. Prabakaran, S, and Mary Praveena, S. Robust hyperparameter tuned deep elman neural network for the diagnosis of osteosarcoma on histology images. J Intell and Fuzzy Syst (2023) 45(4):5987–6003. doi:10.3233/JIFS-233484
49. Walid, MAA, Mollick, S, Shill, PC, Baowaly, MK, Islam, MR, Ahamad, MM, et al. Adapted deep ensemble learning-based voting classifier for osteosarcoma cancer classification. Diagnostics (2023) 13(19):3155. doi:10.3390/diagnostics13193155
Keywords: osteosarcoma, multi-model cascaded deep learning framework, pathological diagnosis, vision mamba model, adolescent
Citation: Yao H, Yang M, Jiang X, Jia H, Sun T, Li M, Wang T and Tang X (2025) Research on the application of a multi-model cascaded deep learning framework in the pathological diagnosis of osteosarcoma. Oncol. Rev. 19:1592408. doi: 10.3389/or.2025.1592408
Received: 12 March 2025; Accepted: 20 October 2025;
Published: 12 November 2025.
Edited by:
Rajeev K. Azad, University of North Texas, United StatesReviewed by:
Qiqi Xie, Indiana University Bloomington, United StatesPankita H. Pandya, Indiana University Bloomington, United States
Gerardo Cuamani-Mitznahuatl, ABC Medical Center, Mexico
Copyright © 2025 Yao, Yang, Jiang, Jia, Sun, Li, Wang and Tang. This is an open-access article distributed under the terms of the Creative Commons Attribution License (CC BY). The use, distribution or reproduction in other forums is permitted, provided the original author(s) and the copyright owner(s) are credited and that the original publication in this journal is cited, in accordance with accepted academic practice. No use, distribution or reproduction is permitted which does not comply with these terms.
*Correspondence: Xuefeng Tang, dHhmYXR5QDE2My5jb20=
†These authors have contributed equally to this work and share first authorship