Abstract
Background:
Previous studies have reported that quantum noise inherently present in CT images hinders the generation of CT-based ventilation image (CTVI), while quantum noise reduction approaches that do not affect CTVI have not yet been reported.
Aims:
The purpose of this study was to evaluate the impact of noise reduction preprocessing on the accuracy and robustness of CTVI in relation to quantum noise present in CT images.
Methods and material:
To reproduce the quantum noise, Gaussian noise (SD: 30, 80, 150 HU) was added to each inhalation and exhalation CT image. CTVIref and CTVInoise was generated from CTref and CTnoise. A median filter and the noise reduction by the CNN were also applied to the CT image, which contained the quantum noise, and CTVImed and CTVIcnn was created in the same manner as CTVIref. We evaluated whether the regions classified as high, middle, or low in CTVIref were accurately represented as high, middle, or low in CTVInoise, CTVImed and CTVIcnn. Additionally, to evaluate the ventilation function of each voxel, we compared two-dimensional histograms of CTVIref, CTVInoise, CTVImed and CTVIcnn.
Statistical analysis used:
Cohen's kappa coefficient and Spearman's correlation were used to assess the agreement between CTVIref and each of the following: CTVInoise, CTVImed, and CTVIcnn.
Results:
CTVIcnn significantly improved categorical consistency and voxel-level correlation of CTVI, particularly under high-noise conditions (150 HU), outperforming both CTVInoise and CTVImed.
Conclusions:
CNN-based denoising effectively improved the accuracy and robustness of CTVI under quantum noise.
1 Introduction
A variety of imaging modalities exist to assess pulmonary ventilation. Examples include computed tomography (CT), dual-energy CT, magnetic resonance imaging, single-photon emission computed tomography (SPECT), and positron emission tomography (PET). These techniques can accurately assess the three-dimensional (3D) distribution of ventilatory function in a patient's lungs (1–3). In radiation therapy, treatment plans that utilize routine CT imaging and deformable image registration (DIR) to generate CT-based ventilation images (CTVIs) have demonstrated the ability to avoid areas of high ventilatory function within the lungs (4). The approach aims to reduce the dose administered to regions with elevated ventilatory function, creating a more targeted and personalized treatment strategy. This approach not only enhances the accuracy of predicting adverse lung events but also contributes to a more effective reduction in the occurrence of such events during treatment (5, 6). CT scans are used as part of routine radiation treatment procedures for most lung cancer patients and can provide additional functional information about the patient without requiring additional functional imaging equipment or methods. Treatment planning with CTVI is a practical, high-resolution, cost-effective, and time-saving approach that can be performed based on four-dimensional (4D) or expiratory and inspiratory CT images (4–9).
Studies are currently underway to validate the accuracy of CTVI. Radionuclide imaging is widely used to assess pulmonary function and is considered the standard of choice for assessing other functional imaging modalities (7, 8). Recent studies have demonstrated that CT-based and SPECT ventilatory function imaging have good spatial measurement accuracy and correlation (9, 10). In addition, clinical trials demonstrate that radiotherapy using CTVI significantly reduces dose to ventilated lung regions (NCT02528942, NCT02308709, NCT02843568) (11).
Accurate assessment of pulmonary ventilation function is crucial for using CTVI in treatment planning. Small changes in DIR parameters have been reported to cause large relative changes in the CTVI (12). The study noted that DIR-based images may not show accurate ventilatory function even when the spatial accuracy of the deformations is acceptable using target registration error (TRE). The quantum noise in CT images does not significantly affect the accuracy of DIR but may hinder the generation of accurate CTVI (13). A nonrigid alveoli phantom was developed to evaluate the CTVI, based on the assumption that an accuracy validation phantom is required to investigate the causes of these obstacles and improve CTVI accuracy (14). However, various problems related to CTVI methods have not yet been solved. It has been demonstrated that there is a significant difference in the CTVI produced via DIR when different DIR parameters are used, even after meeting the tolerance for DIR accuracy with this phantom (15).
CT images inevitably contain quantum noise, owing to the nature of x-ray images. It is desirable to use high-resolution CT images to create the CTVI. CTVI is used for both treatment planning and tracking pulmonary ventilation function using cone-beam CT acquired during treatment. Therefore, the accuracy of the CTVI must be independent of the CT image quality. To achieve this, the image quality must be improved using noise reduction and image correction techniques. Consequently, it could improve the accuracy of treatment planning and patient outcomes. Therefore, CTVI plays a crucial role in radiotherapy treatment planning, and it is desirable to improve its reliability and robustness through various methods.
In recent years, in addition to conventional filtering techniques such as median and Gaussian filters (16), image denoising methods using artificial intelligence (AI) have also been increasingly utilized in the field of medical imaging. In particular, deep learning methods based on convolutional neural networks (CNNs) have attracted attention as they can suppress noise while preserving structural details (17–19). Such AI-based preprocessing techniques are being explored as potential means to enhance the robustness and reproducibility of CT-based functional imaging, including CTVI.
In this study, we used a nonrigid alveoli phantom with ventilation functionality, which we developed as the world's first quality control tool for CTVI. We investigated the effect of preprocessing using both a conventional median filter and a deep learning-based denoising model on the accuracy and robustness of CTVIs. The purpose of this study is to evaluate how preprocessing methods, including AI-based denoising, affect the quality of CTVI, and to clarify their potential to improve robustness and accuracy in clinical applications.
2 Subjects and methods
2.1 CT datasets
The expiratory and inspiratory CT images were acquired using a 16-row detector CT scanner (Aquilion LB, Toshiba Medical Systems, Otawara, Japan). Image resolution was set to 0.78 × 0.78 × 3 mm, and a helical scan protocol was used. The scan parameters were set to 120 kVp, 300 mA, rotation time of 0.5 s, and slice thickness of 3.0 mm. The nonrigid alveoli phantom comprised an acrylic cylinder filled with polyurethane foam simulating alveoli, a polyurethane membrane simulating the diaphragm, a metal rod with piston function simulating respiratory muscles, and a polyurethane tube simulating the airway (14). Various motion patterns can be programmed to simulate breathing patterns of various frequencies. Additionally, airflow can be controlled by pressure changes in the vessel owing to diaphragm movement. The phantom was placed horizontally and adjusted to align with the longitudinal axis of the CT system. The respiratory cycle of the phantom was set to 10 s. The normal respiratory cycle is approximately 4 s; however, to focus only on quantum noise, the respiratory cycle of the phantom was set at which the motion artifact was as small as possible.
2.2 Simulation of quantum noise and noise reduction by the median filter
Additional noise was applied to the CT images to simulate the quantum noise in a simplified manner. The amplitude of quantum noise can be mathematically approximated by a Gaussian distribution (20). In this study, a Python script was developed to add noise with varying standard deviation [0–150 Hounsfield units (HU)] based on a normal distribution. Quantum noise was added using this script to a set of three pairs of expiratory and inspiratory images (30, 80, and 150 HU) to simulate the quantum noise in the CT images, as shown in Figure 1. We developed a script to calculate the median filter for the CT images with simulated quantum noise and fit it to all simulated noise. The filter used a kernel size of 3 × 3.
Figure 1

Comparison of exhale CT images simulating different noise levels.
2.3 Noise reduction by the deep learning-based denoising model
We constructed a denoising model based on a two-dimensional U-Net architecture (24) (Figure 2), with a network depth of 3 and an initial number of filters set to 32. The input to the model was a noisy image, and the output was the corresponding denoised image. To enable fair comparison with conventional filtering methods, no normalization was applied to the pixel values. Each image had a resolution of 512 × 512 pixels, and 131 slices were used per subject. For training, 14 types of Gaussian noise with standard deviations of 10, 20, 50, 60, 70, 100, 110, 120, 130, 140, 170, 180, 190, and 200 HU were added to clean images. For validation, noise levels of 40, 90, and 160 HU were used, and for testing, levels of 30, 80, and 150 HU were selected. The model was trained using the Adam optimizer with a batch size of 8 for up to 500 epochs. The L1 norm loss is defined as shown in Equation 1:
Figure 2

The denoising model based on a two-dimensional U-Net architecture.
where and denote the predicted and ground-truth pixel values, respectively, and N is the total number of pixels. For the validation dataset, the clean images were used as the ground truth, and the model yielding the lowest loss between the output and the clean images was selected for final testing. All training and evaluation were performed on a workstation equipped with an Intel Core i9-9920X 3.5 GHz twelve-core processor, 32 GB RAM, and an NVIDIA GeForce RTX 2080 Ti GPU running Ubuntu 22.04.4 LTS with NVIDIA Driver 535.183.01, CUDA 12.1, and cuDNN 8.9.7.29-1.
2.4 Deformable image registration
In this study, the inhalation image was deformed to match the reference expiration image. Deformations were performed on a set of ten pairs of expiratory and inspiratory images: the reference image CTref without additional noise, CTnoise with noise (30, 80, and 150 HU), and CTmed and CTcnn, which are denoised versions of CTnoise using a median filter and the CNN model, respectively. Deformable image registration was performed using NiftyReg (version 1.4.2), a free and open-source software package for non-rigid image registration. NiftyReg uses a B-spline-based free-form deformation algorithm, which estimates the transformation between moving and reference images by optimizing a normalized mutual information while applying smoothness constraints. The DIR parameters used for these deformations were the optimal parameters reported in a previous study (15): “bending-energy penalty term,” introduced in the cost function to smooth deformations; “max number of iterations,” which affects the computation time; “number of levels to perform,” which refers to the number of optimization calculations; and “Jacobian-based penalty term,” which penalizes large local volume changes and prevents folding (21). The deformation was performed in four steps, following the deformation strategy previously reported as optimal in earlier studies (15). Each step was visually checked, and if the deformation was over-deformed, the deformation step was omitted. The deformation vector field was obtained at each step. It was input at the next step and integrated for each deformation. The CT scans in this study were performed in one imaging session and the phantom outline was not moving; therefore, no rigid registration was performed before the deformation process.
2.5 CT-based ventilation imaging
The sum of the deformation vector field acquired for each of the seven paired sets was converted to a Jacobian determinant to obtain the respective CTVIref, CTVInoise (30, 80, and 150 HU), and CTVImed (30, 80, and 150 HU), and CTVIcnn (30, 80, and 150 HU). The DIR-based Jacobian metric was developed by Reinhardt et al. and is a measure of spatial volume change; it ensures that local volume changes do not alter the signal throughout the volume (22). The Jacobian determinant was calculated for each voxel in the phantom using (Equation 2).where ux, uy, and uz are the x, y, and z components of u, respectively. Jacobian determinant measures the expansion and contraction at position (x, y, z) in the image. When Jacobian determinant is greater than one, local tissue expansion is present, and when Jacobian determinant is less than one, local tissue contraction is present. Jacobian determinant is a relative measure of ventilatory functionality on a voxel-by-voxel basis within the lung.
2.6 Evaluation of spatial deformation accuracy by DIR
Twenty-five landmarks were manually placed by an experienced medical physicist in a volume near the pulmonary vessels and bronchi in a nonrigid alveoli phantom (Figure 3). The target displacement error, that is, the displacement of a landmark due to respiratory motion, was measured as the Euclidean distance between the exhalation and inhalation images. The Euclidean distance was calculated using the formula shown in Equation 3:
Figure 3

Twenty-five landmark setups placed in a volume near the pulmonary vessels and bronchi in a nonrigid alveoli phantom.
where (xr, yr, zr) and (xt, yt, zt) are the landmark coordinates of the reference and target images, respectively. To evaluate the spatial accuracy of DIR with added noise, we used the Euclidean distance between the corresponding landmarks defined in the expiratory and deformed inspiratory images to calculate the Euclidean distance, which is denoted as TRE. TRE represents the spatial 3D distance discrepancy. When the deformed image perfectly matches the reference expiratory image (Euclidean distance = 0), TRE is equal to zero. Relative spatial accuracy was evaluated and compared with the spatial accuracy of the reference noiseless DIR.
2.7 Global consistency analysis using kappa statistics
To evaluate the clinical consistency of CTVI for treatment planning, each voxel in the CTVI was categorized into three regions—high, middle, and low ventilation—by evenly dividing the range of ventilation values in CTVIref. This categorization reflects a typical clinical scenario where high-ventilation regions are avoided during irradiation. The same classification thresholds were applied to all other CTVIs, including CTVInoise (30, 80, and 150 HU), CTVImed (30, 80, and 150 HU), and CTVIcnn (30, 80, and 150 HU). Although the absolute ventilation values may differ, consistency was defined as the regions categorized as high, middle, or low in CTVIref being similarly categorized in the compared CTVIs. To quantify consistency, the proportion of voxels in each test CTVI that retained the same categorical label (high, middle, or low) as in CTVIref was calculated. The degree of agreement was assessed using Cohen's kappa coefficient.
2.8 Voxel-based local evaluation using 2D histograms and spearman correlation
To evaluate the consistency of local ventilation function in each voxel, a two-dimensional (2D) histogram was constructed by plotting the Jacobian determinant value of each voxel in CTVIref against the corresponding value in CTVInoise (30, 80, and 150 HU). Similarly, 2D histograms were created for CTVImed (30, 80, and 150 HU) and CTVIcnn (30, 80, and 150 HU), which were generated by denoising CTnoise using a median filter and the CNN model, respectively. All histograms were generated based on voxel-wise spatial correspondence with CTVIref, enabling direct comparison of local ventilation values. Spearman's rank correlation coefficients were calculated from the 2D histograms to evaluate the consistency between each CTVI and the reference.
3 Results
3.1 Evaluation of DIR spatial deformation accuracy
Figure 4 presents a comparison of TRE values, indicating the spatial accuracy of DIR between CT images containing noise and CT image pairs with noise removed using the median filter and CNN-based denoising. The average displacement between the expiratory and inspiratory CT images was 14.59 ± 6.42 mm. The mean TRE values of the 25 landmarks were 1.39 ± 0.89 mm (maximum 2.95 mm) for CTref. The mean TRE values of the 25 landmarks were 1.22 ± 0.65 mm (maximum 2.54 mm), 0.71 ± 0.45 mm (maximum 1.89 mm), and 1.10 ± 0.83 mm (maximum 2.71 mm) for CTnoise (30, 80, and 150 HU). The mean TRE values for CTmed were 1.78 ± 0.71 mm (maximum 2.93 mm), 1.77 ± 0.78 mm (maximum 2.94 mm), and 1.42 ± 0.65 mm (maximum 2.80 mm) at 30, 80, and 150 HU, respectively. The mean TRE values for CTcnn were 1.34 ± 0.00 mm (maximum 2.55 mm), 1.28 ± 0.00 mm (maximum 2.82 mm), and 1.22 ± 0.00 mm (maximum 2.45 mm) at 30, 80, and 150 HU, respectively. TREs for all conditions, including noisy and denoised images, remained within 3 mm. When comparing mean TRE values between CTnoise and denoised images at each noise level, TREs were higher in CTmed, while CTcnn yielded values similar to or slightly higher than CTnoise.
Figure 4

Comparison of TRE values was performed for cTnoise, cTmed, cTcnn, and cTref at different noise levels (30, 80, and 150 HU), where cTref represents the DIR results based on CT images without added quantum noise. In this context, movement indicates the displacement caused by respiratory motion between the expiratory and inspiratory phases.
3.2 Evaluation of CTVIs
3.2.1 Visual assessment of CTVIs
Figure 5 shows a visual comparison of CTVIs, including CTVIref, CTVInoise, CTVImed, and CTVIcnn at different noise levels. The visual assessment reveals that, compared to CTVIref, the location of high-functioning regions near the diaphragm remains consistent. However, additional high-functioning regions not observed in CTVIref are present, and the resolution of ventilatory function distribution is reduced. The visual assessment indicates that CTVImed (30 HU) is closer to CTVIref than the corresponding CTVInoise shown in Figure 5, suggesting that noise reduction improves the visual accuracy of CTVI under lower noise conditions. CTVIcnn appear visually closer to CTVIref than CTVInoise at all noise levels, indicating that noise reduction improves the visual accuracy of CTVI. Among the three noise levels, CTVIcnn at 150 HU shows a particularly notable improvement over CTVInoise, suggesting that CNN-based denoising enhances the visualization of ventilation distribution under high noise conditions.
Figure 5
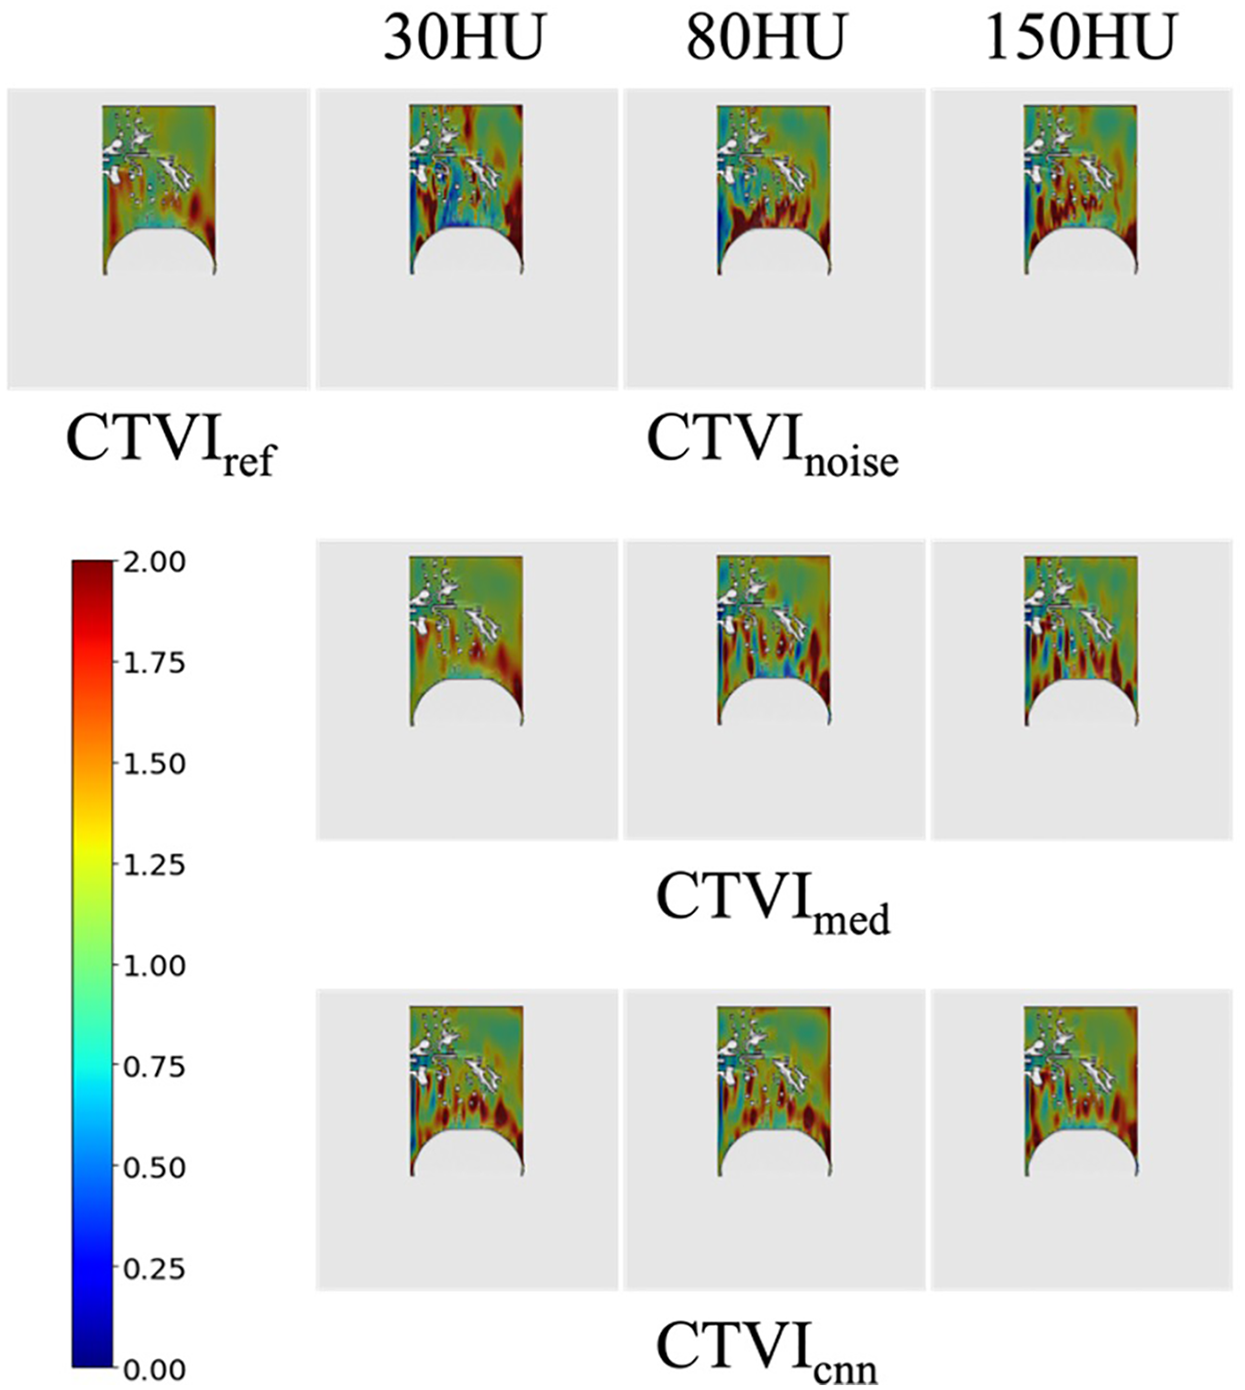
CTVInoise, CTVImed and CTVIcnn at different noise levels. High-functioning regions are shown in red, while regions with decreased lung ventilation are displayed in blue.
3.2.2 Global consistency analysis using kappa statistics
To evaluate the clinical utility of CTVI for treatment planning, ventilation values in CTVIref were evenly divided into three regions: high, middle, and low ventilation. The same categorization was applied to CTVInoise, CTVImed and CTVIcnn at each noise level. Consistency was defined as regions categorized as high, middle, or low in CTVIref being similarly categorized in CTVInoise, CTVImed and CTVIcnn, regardless of absolute ventilation values. If the categorizations were perfectly consistent, the percentage of voxels correctly matching high, middle, and low regions would be 33.3% for each category. Figure 6 summarizes the percentage of voxels that correctly matched high, middle, and low regions between CTVIref and CTVInoise. For example, at 30 HU noise, only 11.32%, 12.64%, and 12.22% of voxels in the high, middle, and low regions of CTVIref were correctly identified in CTVInoise, respectively, with notable mismatches such as 14.36% of voxels categorized as low in CTVIref being misclassified as high in CTVInoise. In contrast, CTVImed at 30 HU showed substantially improved agreement, with 21.26%, 22.81%, and 23.18% correctly matching the high, middle, and low regions of CTVIref, respectively. Additionally, at 80 HU noise, CTVImed also demonstrated an improvement in consistency compared to CTVInoise. The percentages of voxels correctly categorized as high, middle, and low in CTVImed were 21.24%, 20.02%, and 22.34%, respectively, indicating a better agreement with CTVIref compared to CTVInoise, where the corresponding percentages were only 12.15%, 12.89%, and 12.07%. This result highlights that the noise reduction processing improved clinical consistency not only at 30 HU but also at 80 HU noise levels. In addition, CTVIcnn showed consistent improvement across all noise levels. Notably, at 150 HU, the consistency between CTVIcnn and CTVIref was significantly higher than that of CTVInoise. The percentage of correctly matched voxels was 26.23%, 28.91%, and 26.85% for high, middle, and low ventilation regions, respectively, compared to only 12.03%, 13.25%, and 12.67% for CTVInoise. These results highlight that CNN-based denoising particularly improves clinical consistency under high-noise conditions. Cohen's kappa coefficients further quantified the agreement between CTVIref and both CTVInoise and CTVImed. Table 1 presents these results, showing that kappa values for CTVInoise were 0.043, 0.057, and 0.069 at noise levels of 30 HU, 80 HU, and 150 HU, respectively. For CTVImed, the kappa values were significantly higher at lower noise levels (0.51 at 30 HU and 0.45 at 80 HU), but the consistency diminished at 150 HU (0.083). CTVIcnn exhibited consistently high kappa values across all noise levels, with 0.60 at 30 HU, 0.51 at 80 HU, and 0.73 at 150 HU, indicating superior categorical agreement with CTVIref compared to both CTVInoise and CTVImed. These results support the effectiveness of CNN-based denoising in preserving clinically relevant ventilation patterns, even under high noise conditions.
Figure 6

Proportion of categorized voxels across high, middle, and low ventilation regions for CTVInoise, CTVImed and CTVIcnn compared to CTVIref. The horizontal axis represents CTVIref, while the vertical axis shows the three ventilation categories (high, middle, and low) for CTVInoise, CTVImed and CTVIcnn. Darker colors indicate higher agreement in classification.
Table 1
| CTVI methods | 30 HU (P value) | 80 HU (P value) | 150 HU (P value) |
|---|---|---|---|
| CTVInoise | 0.043 (<.0001) | 0.057 (<.0001) | 0.069 (<.0001) |
| CTVImed | 0.51 (<.0001) | 0.45 (<.0001) | 0.083 (<.0001) |
| CTVIcnn | 0.60(<.0001) | 0.51 (<.0001) | 0.73 (<.0001) |
Cohen's kappa coefficients of CTVIs for CTVIref.
3.2.3 Voxel-based local evaluation using 2D histograms and spearman correlation
To assess the consistency of local ventilation function, a voxel-by-voxel comparison between CTVIref and both CTVInoise, CTVImed and CTVIcnn was conducted using 2D histograms (Figure 7). These histograms demonstrate that the distribution improves as it approaches y = x, indicating greater consistency with CTVIref. At a noise level of 30 HU, the histogram of CTVImed shows a marked improvement in consistency compared to CTVInoise, as the distribution is more concentrated along y = x. However, at noise levels of 80 and 150 HU, no significant improvement was observed. In contrast, CTVIcnn demonstrated a different trend: while there was no notable improvement in the 2D histograms at 30 and 80 HU, the histogram at 150 HU showed greater alignment with the y = x line, suggesting improved voxel-level consistency. Table 2 presents the Spearman correlation coefficients for these comparisons. The results show that CTVImed exhibits better correlation with CTVIref than CTVInoise at lower noise levels, but the correlation decreases as the noise level increases. Despite this, a statistically significant trend toward improvement is observed (<.0001). The Spearman correlation coefficients for CTVIcnn were 0.59, 0.65, and 0.83 at 30, 80, and 150 HU, respectively. This indicates that although CTVIcnn did not improve correlation at lower noise levels, it showed a substantial improvement at 150 HU (<.0001).
Figure 7

Two-dimensional histograms of CTVInoise, CTVImed and CTVIcnn at different noise levels with respect to CTVIref. The horizontal axis represents CTVIref, while the vertical axis shows the voxel-based lung ventilation of CTVInoise, CTVImed and CTVIcnn. Perfect agreement is indicated by the histogram distribution along y = x.
Table 2
| CTVI methods | 30 HU (P value) | 80 HU (P value) | 150 HU (P value) |
|---|---|---|---|
| CTVInoise | 0.61 (<.0001) | 0.59 (<.0001) | 0.33 (<.0001) |
| CTVImed | 0.87 (<.0001) | 0.70 (<.0001) | 0.61 (<.0001) |
| CTVIcnn | 0.59 (<.0001) | 0.65 (<.0001) | 0.83 (<.0001) |
Spearman correlation coefficients of CTVIs for CTVIref.
4 Discussion
Despite the extensive body of research on CTVI (4–10), few studies have employed phantoms capable of replicating human-like ventilation in the context of clinical applications. While it is well known that noise significantly affects CT image analysis, the impact of noise reduction preprocessing on the accuracy and consistency of CTVI remains insufficiently explored. In this study, quantum noise was simulated in CT images using a nonrigid alveoli phantom designed to mimic lung motion.
In this study, the spatial accuracy of the DIR was evaluated by simulating noise levels from 0 to 150 HU. For all CTref, CTnoise, CTmed and CTcnn, the deformation accuracy was within 3 mm of the tolerances given in TG-132 (23), regardless of the noise level. Although previous studies have investigated noise levels of 200 HU (13), in the initial experiments of this study, the noise level of 200 HU resulted in over-deformation due to DIR for the same deformation parameters, and an accurate CTVI could not be established. This result suggests that noise levels above 200 HU significantly affect the deformation accuracy of the DIR. High noise levels may lead to errors in the DIR algorithm. Therefore, the results of this study suggest that the DIR technique has sufficient accuracy for generating CTVI at quantum noise levels up to 150 HU. Although all TRE values were within the TG-132 tolerance of 3 mm, CTmed and CTcnn exhibited slightly higher TREs compared to CTnoise. One possible explanation is that the denoising process may have smoothed out anatomical features critical for deformable registration, resulting in slightly reduced precision. Alternatively, mild quantum noise may have enhanced local contrast in CTnoise, unintentionally aiding DIR alignment. However, these differences remained within the clinically acceptable margin and are unlikely to affect the final CTVI outcome.
Table 1; Figure 6 illustrate the impact of quantum noise and the application of preprocessing filters on the consistency of CTVI from a clinical perspective. When using CTVI for treatment planning, lung ventilation is categorized into three levels—high, middle, and low—and treatment plans are designed to avoid high-function regions. In CTVIref, approximately 33% of the lung ventilation is classified into each category. Ideally, in cases of accurate classification, the relationships between CTVIref, CTVInoise, CTVImed and CTVIcnn should result in high-high, middle-middle, and low-low matches approaching 33%. Focusing on CTVInoise, the maximum agreement across all noise levels was only 13.25%, indicating significant misclassification of lung ventilation when quantum noise is present. In contrast, CTVImed achieved over 20% agreement in all ventilation categories at noise levels below 80 HU. A particularly important observation is the proportion of regions classified as high in CTVIref but misclassified as low. This proportion was kept below 4.3% at its maximum. In addition, CNN-based denoising further improved the consistency of CTVI at all noise levels. Notably, CTVIcnn achieved the highest agreement with CTVIref, particularly under high-noise conditions. At 150 HU, CNN showed the greatest improvement in both categorical agreement and voxel-wise correlation (κ = 0.73, Spearman ρ = 0.83), outperforming both CTVInoise and CTVImed. These results indicate that CNN-based denoising has strong potential to enhance the robustness of CTVI, even under clinically challenging noise conditions.
Table 2; Figure 7 focus on the voxel-level accuracy of CTVI, demonstrating the local effects of quantum noise and the application of preprocessing filters on CTVI accuracy using two-dimensional histograms and Spearman correlation. The results of this study confirmed that as noise levels increase, the accuracy of CTVI decreases, proving that quantum noise is a significant factor that hinders the accuracy of CTVI. However, CNN-based denoising yielded stronger improvements in correlation, especially at 150 HU, suggesting it is a more robust solution in high-noise environments.
Interestingly, while Cohen's kappa coefficients and Spearman correlation coefficients generally showed consistent trends, some discrepancies were noted. For example, at 150 HU, CTVImed yielded a relatively high Spearman correlation (ρ = 0.61) but a low kappa value (κ = 0.083), suggesting that voxel-wise rankings were preserved even though many values crossed categorical thresholds. Conversely, at 30 HU, CTVIcnn showed a high kappa (κ = 0.60) despite having a lower Spearman correlation (ρ = 0.59), indicating that category-level agreement was strong, while voxel value variations limited rank correlation. These findings emphasize that categorical and continuous metrics capture different aspects of agreement, and highlight the need for using both to comprehensively evaluate CTVI accuracy.
Limitations of this study include the lack of comparison with vendor-provided denoising techniques and the absence of hybrid preprocessing strategies. Future work should explore combining CNN-based and conventional filtering approaches and testing these methods in patient datasets.
5 Conclusion
This study quantitatively evaluated the effect of preprocessing on the accuracy and robustness of the CTVI using a nonrigid alveoli phantom with ventilation functionality, developed as the world's first quality control tool for CTVI. We demonstrated that quantum noise significantly impairs the accuracy and consistency of CTVI. While median filtering was shown to be a simple and effective method for mitigating this effect, CNN-based denoising provided superior performance, particularly under high-noise conditions. These findings suggest that both conventional and AI-based preprocessing approaches contribute to improving the quality of CTVI, with deep learning methods offering strong potential to enhance robustness and accuracy in clinical applications.
Statements
Data availability statement
The original contributions presented in the study are included in the article/Supplementary Material, further inquiries can be directed to the corresponding author.
Author contributions
SM: Conceptualization, Investigation, Methodology, Writing – original draft. HF: Methodology, Project administration, Writing – review & editing. KY: Data curation, Methodology, Writing – review & editing. NK: Data curation, Formal analysis, Investigation, Validation, Writing – review & editing. MT: Formal analysis, Investigation, Writing – review & editing. HN: Formal analysis, Investigation, Writing – review & editing. SM: Data curation, Methodology, Writing – review & editing. FT: Investigation, Methodology, Writing – review & editing. TF: Supervision, Writing – review & editing.
Funding
The author(s) declare that financial support was received for the research and/or publication of this article. This work was supported by JSPS KAKENHI Grant Number JP22K15891.
Acknowledgments
The authors would like to thank Editage (https://www.editage.jp) for the English language review.
Conflict of interest
The authors declare that the research was conducted in the absence of any commercial or financial relationships that could be construed as a potential conflict of interest.
Generative AI statement
The author(s) declare that no Generative AI was used in the creation of this manuscript.
Publisher’s note
All claims expressed in this article are solely those of the authors and do not necessarily represent those of their affiliated organizations, or those of the publisher, the editors and the reviewers. Any product that may be evaluated in this article, or claim that may be made by its manufacturer, is not guaranteed or endorsed by the publisher.
References
1.
Suga K . Technical and analytical advances in pulmonary ventilation SPECT with xenon-133 gas and tc-99m-technegas. Ann Nucl Med. (2002) 16:303–10. 10.1007/BF02988614
2.
van Beek EJR Wild JM Kauczor H-U Schreiber W Mugler JP 3rd de Lange EE . Functional MRI of the lung using hyperpolarized 3-helium gas. J Magn Reson Imaging. (2004) 20:540–54. 10.1002/jmri.20154
3.
Harris RS Schuster DP . Visualizing lung function with positron emission tomography. J Appl Physiol (1985). (2007) 102:448–58. 10.1152/japplphysiol.00763.2006
4.
Latifi K Forster KM Hoffe SE Dilling TJ van Elmpt W Dekker A et al Dependence of ventilation image derived from 4D CT on deformable image registration and ventilation algorithms. J Appl Clin Med Phys. (2013) 14:4247. 10.1120/jacmp.v14i4.4247
5.
Yamamoto T Kabus S von Berg J Lorenz C Keall PJ . Impact of four-dimensional computed tomography pulmonary ventilation imaging-based functional avoidance for lung cancer radiotherapy. Int J Radiat Oncol Biol Phys. (2011) 79:279–88. 10.1016/j.ijrobp.2010.02.008
6.
Yaremko BP Guerrero TM Noyola-Martinez J Guerra R Lege DG Nguyen LT et al Reduction of normal lung irradiation in locally advanced non-small-cell lung cancer patients, using ventilation images for functional avoidance. Int J Radiat Oncol Biol Phys. (2007) 68:562–71. 10.1016/j.ijrobp.2007.01.044
7.
Eslick EM Kipritidis J Gradinscak D Stevens MJ Bailey DL Harris B et al CT ventilation imaging derived from breath hold CT exhibits good regional accuracy with galligas PET. Radiother Oncol. (2018) 127:267–73. 10.1016/j.radonc.2017.12.010
8.
Kipritidis J Tahir BA Cazoulat G Hofman MS Siva S Callahan J et al The VAMPIRE challenge: a multi-institutional validation study of CT ventilation imaging. Med Phys. (2019) 46:1198–217. 10.1002/mp.13346
9.
Castillo R Castillo E McCurdy M Gomez DR Block AM Bergsma D et al Spatial correspondence of 4D CT ventilation and SPECT pulmonary perfusion defects in patients with malignant airway stenosis. Phys Med Biol. (2012) 57:1855–71. 10.1088/0031-9155/57/7/1855
10.
Yamamoto T Kabus S Lorenz C Mittra E Hong JC Chung M et al Pulmonary ventilation imaging based on 4-dimensional computed tomography: comparison with pulmonary function tests and SPECT ventilation images. Int J Radiat Oncol Biol Phys. (2014) 90:414–22. 10.1016/j.ijrobp.2014.06.006
11.
Yamamoto T Kabus S Bal M Keall PJ Moran A Wright C et al Four-dimensional computed tomography ventilation image guided lung functional avoidance radiation therapy: a single-arm prospective pilot clinical trial. Int J Radiat Oncol Biol Phys. (2022) 115:1144–54. 10.1016/j.ijrobp.2022.11.026
12.
Castillo E Castillo R Vinogradskiy Y Guerrero T . The numerical stability of transformation-based CT ventilation. Int J Comput Assist Radiol Surg. (2017) 12:569–80. 10.1007/s11548-016-1509-x
13.
Latifi K Huang T-C Feygelman V Budzevich MM Moros EG Dilling TJ et al Effects of quantum noise in 4D-CT on deformable image registration and derived ventilation data. Phys Med Biol. (2013) 58:7661–72. 10.1088/0031-9155/58/21/7661
14.
Miyakawa S Tachibana H Moriya S Kurosawa T Nishio T Sato M . Design and development of a nonrigid phantom for the quantitative evaluation of DIR-based mapping of simulated pulmonary ventilation. Med Phys. (2018) 45:3496–505. 10.1002/mp.13017
15.
Miyakawa S Tachibana H Moriya S Kurosawa T Nishio T . Evaluation of deformation parameters for deformable image registration-based ventilation imaging using an air-ventilating non-rigid phantom. Phys Med. (2018) 50:20–5. 10.1016/j.ejmp.2018.05.016
16.
Gonzalez RC Woods RE . Digital Image Processing. 4th ed. Boston, MA: Pearson (2018).
17.
Chen H Zhang Y Kalra MK Lin F Chen Y Liao P et al Low-dose CT with a residual encoder-decoder convolutional neural network (RED-CNN). IEEE Trans Med Imaging. (2017) 36:2524–35. 10.1109/TMI.2017.2715284
18.
Zhang K Zuo W Chen Y Meng D Zhang L . Beyond a Gaussian denoiser: residual learning of deep CNN for image denoising. IEEE Trans Image Process. (2017) 26:3142–55. 10.1109/TIP.2017.2662206
19.
Yang Q Yan P Zhang Y Yu H Shi Y Mou X et al Low-dose CT image denoising using a generative adversarial network with Wasserstein distance and perceptual loss. IEEE Trans Med Imaging. (2018) 37(6):1348–57. 10.1109/TMI.2018.2827462
20.
Herman GT . Image reconstruction from projections. In: The Fundamentals of Computerized Tomography. New York: Academic Press (1980). p. 141–2.
21.
Modat M . Lung registration using the NiftyReg package. Med Image Anal Clin Grand Chall. (2010):33–42.
22.
Reinhardt JM Ding K Cao K Christensen GE Hoffman EA Bodas SV . Registration-based estimates of local lung tissue expansion compared to xenon CT measures of specific ventilation. Med Image Anal. (2008) 12:752–63. 10.1016/j.media.2008.03.007
23.
Brock KK Mutic S McNutt TR Li H Kessler ML . Use of image registration and fusion algorithms and techniques in radiotherapy: report of the AAPM radiation therapy committee task group No. 132. Med Phys. (2017) 44:e43–76. 10.1002/mp.12256
24.
Ronneberger O Fischer P Brox T . U-Net: convolutional networks for biomedical image segmentation. In: Medical Image Computing and Computer-Assisted Intervention – MICCAI 2015. Springer International Publishing (2015). p. 234–41.
Summary
Keywords
computed tomography-based ventilation image, deformable image registration, noise reduction, nonrigid alveoli phantom, radiotherapy
Citation
Miyakawa S, Fuse H, Yasue K, Koori N, Takahashi M, Nosaka H, Moriya S, Tomita F and Fujisaki T (2025) Assessing the consistency of CT-based ventilation imaging under noise reduction processing with simulated quantum noise using a nonrigid alveoli phantom. Front. Radiol. 5:1567267. doi: 10.3389/fradi.2025.1567267
Received
27 January 2025
Accepted
17 June 2025
Published
09 July 2025
Volume
5 - 2025
Edited by
Sokratis Makrogiannis, Delaware State University, United States
Reviewed by
Xi Wang, The Chinese University of Hong Kong, China
Kwang-Hyun Uhm, Korea University, Republic of Korea
Updates
Copyright
© 2025 Miyakawa, Fuse, Yasue, Koori, Takahashi, Nosaka, Moriya, Tomita and Fujisaki.
This is an open-access article distributed under the terms of the Creative Commons Attribution License (CC BY). The use, distribution or reproduction in other forums is permitted, provided the original author(s) and the copyright owner(s) are credited and that the original publication in this journal is cited, in accordance with accepted academic practice. No use, distribution or reproduction is permitted which does not comply with these terms.
* Correspondence: Shin Miyakawa miyakawashi@ipu.ac.jp
Disclaimer
All claims expressed in this article are solely those of the authors and do not necessarily represent those of their affiliated organizations, or those of the publisher, the editors and the reviewers. Any product that may be evaluated in this article or claim that may be made by its manufacturer is not guaranteed or endorsed by the publisher.