 Elaine Symanski1,2*
 Kristina W. Whitworth1,2
 Hector Mendez-Figueroa3
 Kjersti M. Aagaard4
 Iman Moussa1
 Juan Alvarez1Adrien Chardon Fabian1
 Kurunthachalam Kannan5
 Cheryl L. Walker1,6Cristian Coarfa1,6
 Melissa A. Suter4Hamisu M. Salihu7
- 1Center for Precision Environmental Health, Baylor College of Medicine, Houston, TX, United States
- 2Section of Epidemiology and Population Sciences, Department of Medicine, Baylor College of Medicine, Houston, TX, United States
- 3Division of Maternal-Fetal Medicine, Department of Obstetrics, Gynecology and Reproductive Sciences, McGovern Medical School at UTHealth, Houston, TX, United States
- 4Division of Maternal-Fetal Medicine, Department of Obstetrics & Gynecology, Baylor College of Medicine & Texas Children’s Hospital, Houston, TX, United States
- 5New York State Department of Health, Wadsworth Center, Albany, NY, United States
- 6Department of Molecular and Cell Biology, Baylor College of Medicine, Houston, TX, United States
- 7Department of Family and Community Medicine, Baylor College of Medicine, Houston, TX, United States
Introduction: The Maternal and Infant Environmental Health Riskscape (MIEHR) Center was established to address the interplay among chemical and non-chemical stressors in the biological, physical, social, and built environments that disproportionately impact perinatal health among Black pregnant people in a large and diverse urban area with documented disparities in the U.S.
Methods: The MIEHR cohort is recruiting non-Hispanic Black and non-Hispanic white pregnant people who deliver their infants at major obstetric hospitals in Houston, Texas. At enrollment, all participants are asked to provide urine samples for chemical [metals, cotinine, and polycyclic aromatic hydrocarbons (PAHs)] analyses and blood samples. A subset of the cohort is asked to provide oral and vaginal swabs, and fecal samples. Questionnaire and electronic health record data gather information about residential address history during pregnancy, pregnancy history and prenatal care, sociodemographic and lifestyle factors, experiences of discrimination and stress, and sources of social support. Using information on where a participant lived during their pregnancy, features of their neighborhood environment are characterized. We provide summaries of key individual- and neighborhood-level features of the entire cohort, as well as for Black and white participants separately.
Results: Between April 2021 and February 2023, 1,244 pregnant people were recruited. Nearly all participants provided urine samples and slightly less than half provided blood samples. PAH exposure patterns as assessed on 47% of participants thus far showed varying levels depending on metabolite as compared to previous studies. Additionally, analyses suggest differences between Black and white pregnant people in experiences of discrimination, stress, and levels of social support, as well as in neighborhood characteristics.
Discussion: Our findings to date highlight racial differences in experiences of discrimination, stress, and levels of support, as well as neighborhood characteristics. Recruitment of the cohort is ongoing and additional neighborhood metrics are being constructed. Biospecimens will be analyzed for metals and PAH metabolites (urine samples), miRNAs (plasma samples) and the microbiome (oral swabs). Once enrollment ends, formal assessments are planned to elucidate individual- and neighborhood-level features in the environmental riskscape that contribute to Black-White disparities in perinatal health.
Introduction
Despite major breakthroughs in medical care, health inequities persist among U.S. populations and are especially consequential for pregnant people and their children. As compared with other racial and ethnic groups, Black pregnant people suffer the highest risks of poor pregnancy outcomes in the nation. Essentially unchanged from the period 2007 to 2016 (1), pregnancy-related mortality in 2020 was almost 3 times higher among Black as compared to white pregnant people (2). There are also disparities in the prevalence of preterm birth, which is a primary cause of perinatal death and a risk factor for adverse health outcomes for an infant throughout the life course (3), with a prevalence of 14.4% and 9.1% among Black and non-Hispanic white populations, respectively (4). Similar to national trends, racial inequities in health outcomes are strikingly evident in Harris County, Texas (5), the third most populous county in the nation and home to Houston, a city with an immensely diverse population and more families living below the poverty line than the rest of Texas or the nation (6). Pointedly, Houston and Harris County both earned an “F” in the March of Dimes 2022 Report Card for preterm birth (7).
Though not well-understood, racial disparities in perinatal health are likely related to factors other than genetics, behavior, access to health care or individual-level socioeconomic status (8–12). Indeed, the American College of Obstetricians and Gynecologists (ACOG) recognizes the importance of structural racism (i.e., macro-level conditions that limit opportunities, resources, and well-being of less privileged groups) on influencing maternal and infant health outcomes (13). Because of redlining and other exclusionary practices of financial lenders, Black communities have been historically burdened by housing discrimination and neighborhood segregation (14), leading to limited investments in communities of color including grocery stores, schools and health care facilities, and a higher concentration of industries and hazardous wastes sites nearby (15). The siting of key sources of pollution located within or near Black neighborhoods results in another form of structural racism, i.e., environmental injustice, with residents in these communities experiencing a disproportionate burden of environmental exposures to contaminants in the air they breathe, water they drink, and where their children play (16–19).
Owing to critical gaps in our understanding of Black-White disparities in perinatal health, we established the Maternal and Infant Environmental Health Riskscape (MIEHR) Center, an NIH P50 Center of Excellence on Environmental Health Disparities Research, with an overall goal to evaluate the impact of multiple stressors on adverse maternal and infant outcomes in the greater Houston area. Premised on an environmental riskscape framework (20), we are examining chemical and non-chemical stressors in the biological, physical, social, and built environments that contribute to racial disparities in perinatal health, either directly or in combination with each other. Moreover, the study location provides a nexus for research on the impact of the environment on perinatal health disparities as Houston is the most diverse city in the nation (21) and is unfortunately also plagued by income disparities, with far greater of proportions of Hispanic (22%) and Black (20%) residents who live in poverty as compared with non-Hispanic white residents (5%) (22). In this paper, we describe the protocols being used in recruitment of the MIEHR cohort and provide exposure profiles for the cohort (and separately for Black and white participants) enrolled through February 28, 2023.
Methods
Recruitment
The MIEHR cohort has a goal of recruiting ∼1,200 non-Hispanic Black and non-Hispanic white maternal-infant dyads from three large academic OB/GYN hospitals in the Texas Medical Center (TMC) in Houston, Texas (see Figure 1). Enrollment began in April 2021 at Memorial Hermann Hospital followed by enrollment at Ben Taub Hospital in July 2021 and at Texas Children's Pavilion for Women in June 2022. Eligibility criteria include the following: resident of the 8-county greater Houston area (Brazoria, Chambers, Fort Bend, Galveston, Harris, Liberty, Montgomery, or Waller County); 18 years of age or older; non-Hispanic Black/African American or non-Hispanic White, by self-identification; singleton delivery with no identified congenital anomaly; cognitively aware enough to participate in the study (i.e., able to provide informed consent); and English-speaker. The study protocol has been reviewed and approved by the IRBs at Baylor College of Medicine and The University of Texas Health Science Center at Houston under a reliance agreement.
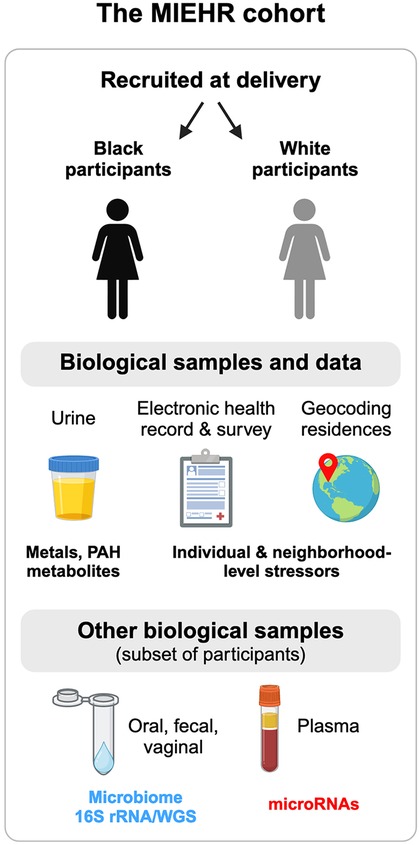
Figure 1. Overview of the MIEHR cohort recruited at major obstetric hospitals in Houston, Texas (April 2021-onwards) and the research projects underway. This image was created with BioRender.com.
Potential participants are initially identified using unified electronic health record (EHR) systems at each hospital enabling ready access, identification, and patient scheduling and tracking. Each weekday, trained obstetrics research coordinators review records of potential pregnant people who have been admitted for labor and delivery during the previous 24-hr period (or 72-hr period for Monday mornings) as well as antepartum and postpartum lists of patients. Potentially eligible participants are approached by research coordinators at a time when it does not interfere with their clinical care to verbally confirm eligibility. Potential participants who are interested and eligible (meeting inclusion and exclusion criteria) are assigned a study identifier and written informed consent is obtained.
Questionnaire administration
Once consented, research coordinators administer a questionnaire electronically in REDCap, which is HIPAA–compliant and secure. The questionnaire seeks information about the following: maternal and paternal sociodemographics; residential history during pregnancy; pregnancy history and prenatal care; tobacco, alcohol, and other substance use during pregnancy; antibiotic and probiotic use during pregnancy; and maternal family health history. We also ask participants whether they are willing to be recontacted for participation in additional research activities for which they or their child may be eligible in the future and if yes, to provide their contact information. Data are also abstracted from EHRs including: maternal height and pre-pregnancy weight, insurance status, vaccination history during pregnancy, comorbidities and chronic diagnoses, prior pregnancy history, obstetric complications and diagnoses related to the index pregnancy, date of last menstrual period, dates of all ultrasounds received and associated fetal biometry (estimated fetal weight, head circumference, biparietal diameter, abdominal circumference), date of delivery, type of delivery (e.g., vaginal, cesarean), infant sex, infant anthropometry (head circumference, weight, length), and infant Apgar scores.
Biological sample collection
All participants are provided the opportunity to provide urine and blood biospecimens. A subset of pregnant people at Ben Taub Hospital and Texas Children's Pavilion for Women are asked to also provide oral and vaginal swabs and fecal samples, as well as consent to collect oral and fecal/meconium from their infants. Blood samples are collected in 10 ml EDTA lavender top tubes, preferably during routine blood draws, and are immediately (within one hour) transported in coolers with frozen gel packs to the laboratory for processing. Spot urine samples are collected in sterile 100 ml urine specimen containers and stored with fecal samples and oral and vaginal swabs (if collected) in a cooler with a gel pack until they are transported to the laboratory on the same day that they are collected. Whole blood, plasma and urine samples are aliquoted in 1.5 ml sterile cryovials. All samples are stored at −80°C. Maternal oral swabs will undergo 16S ribosomal RNA (16S rRNA) and whole genome sequencing (WGS), microRNAs (miRNAs) will be profiled in plasma, and metals and monohydroxylated polycyclic aromatic hydrocarbons (OH-PAHs) metabolites will be measured in urine samples (see below). All other biological samples are being banked for use and analyses in future studies.
Individual-level exposures to non-chemical stressors (discrimination, stress and social support)
As part of the questionnaire, we administered Krieger's Experiences of Discrimination (EOD) scale, a validated nine-item measure about lifetime experiences of unfair treatment in different settings that has demonstrated high internal consistency and test-retest reliability (23). Specifically, pregnant people are asked how many times they have ever experienced discrimination in the following situations: at school; getting a job; at work; getting housing; getting medical care; getting service in a store/restaurant; getting credit, bank loans or a mortgage; on the street or in a public setting; from the police or in the courts. Responses on the EOD are coded as 0 (“never”), 1 (“once”), 2.5 (“2–3 times”), and 5 (“4 or more times”) and summed to compute situation and frequency scores that range from 0 to 9 and 0 to 45, respectively, where higher scores indicate greater experiences of discrimination (23). We also ask questions assessing participant's perceptions of stress in their lives and during their pregnancy (not stressful, average stress, very stressful), as well as the level of support from the father of their babies and from families and friends (none, a little, a good amount, and an excellent amount). Lastly, because the greater Houston area is prone to weather-related and industrial disasters (24) and stressful life events have the potential to increase risks of adverse birth outcomes (25), we ask about experiences related to Hurricane Harvey (that resulted in catastrophic flooding in the Houston area in August of 2017 and thereafter), as well as the COVID-19 pandemic.
Individual-level exposures to chemical stressors
Cotinine, a marker of tobacco smoke exposure and the following OH-PAH metabolites are being assessed in maternal urine samples: 1-hydroxynaphthalene (1-NAP), 2- hydroxynaphthalene (2-NAP), 2- hydroxyphenanthrene (2-PHE), 3-hydroxyphenanthrene (3-PHE), 4-hydroxyphenanthrene (4-PHE), combined 1/9- hydroxyphenanthrene (1/9-PHE), combined 2/3/9- hydroxyfluorene (2/3/9-FLUO), 1-hydroxypyrene (1-PYR), 3-hydroxybenzo[c]phenanthrene (3-BCP), 1-hydroxychrysene (1-CHRY), 6-hydroxychrysene (6-CHRY), and 1-hydroxybenz[a]anthracene (1-BAA). Extraction of PAH metabolites from urine was performed by liquid-liquid extraction followed by liquid chromatography-tandem mass spectrometry (LC-MS/MS) analysis (26). Briefly, urine samples were spiked with an isotopically labeled internal standard mixture and mixed with 1 ml of 0.5 M ammonium acetate buffer containing 200 units/ml of β-glucuronidase/sulfatase enzyme (MP Biomedicals, LLC, Solon, OH, USA). The urine samples were incubated overnight (∼16 h) at 37°C. Urine samples were then diluted by the addition of 2 ml of water followed by extraction using a mixture of 80% pentane: 20% toluene (v/v). PAH metabolites were chromatographically separated using a Waters Acquity I-Class UPLC system (Waters Corporation; Milford, MA, USA) connected with an Acquity UPLC BEH C18 column (50 × 2.1 mm, 1.7 µm, Waters; Milford, MA, USA). Identification and quantification of PAH metabolites was performed on an ABSCIEX 5,500 triple quadrupole mass spectrometer (Applied Biosystems; Foster City, CA, USA). Quality assurance protocols include analysis of two Standard Reference Materials (SRM 3,672, SRM 3,673) containing certified values for several PAH metabolites. HPLC grade water was used for sample/procedural blanks. We replaced urinary concentrations of PAHs below the limit of detection (LOD) with values of the LOD divided by √2 (27). To account for urine dilution, creatine concentrations were also measured, and urinary OH-PAH metabolite concentrations were adjusted for creatinine concentrations. Urinary concentrations of 40 metals are also being measured (Lithium, Beryllium, Vanadium, Chromium, Manganese, Cobalt, Nickel, Copper, Zinc, Arsenic, Selenium, Rubidium, Strontium, Molybdenum, Cadmium, Tin, Antimony, Tellurium, Cesium, Barium, Tungsten, Thallium, Lead, Uranium; in addition to 16 rare-earth metals) and will be reported on in the future.
Neighborhood-level exposures to non-chemical and chemical stressors
Participants' residential addresses at delivery and during pregnancy are geocoded using ArcGIS Pro (version 3.1, Esri, Redlands, CA). We are developing several area-level measures and linking them with a mother's residential history to inform specific aspects of their social, built, and physical neighborhood environments. A few of these measures are discussed in more detail below.
Proximity to point sources of pollution
Given that disparities in residential proximity to industrial facilities based on race/ethnicity and socioeconomic position have been documented (28), we are constructing metrics that will allow us to evaluate exposure risks associated with living near point sources of air pollution. To date, we have accessed location information on all national and state Superfund sites in the 8-county study area (n = 46) (29) and computed residential distance (based on address at delivery) to the nearest site for MIEHR study participants. Future work will construct similar metrics related to proximity to major roadways and other point or area sources of pollution.
Tree canopy coverage
We computed the percentage of tree canopy surrounding a participant's residence using data from the National Land Cover Database (NLCD) tree canopy dataset for 2021 that provides the proportion of tree canopy within 30 × 30 m2 gridded cells. Using ArcGIS Pro's Zonal Statistics as Table Tool, we averaged the percentages of tree canopy of all cells in which the centroid of the cell was contained within a 300 m buffer of a mother's residence.
Socioeconomic deprivation
We used U.S. Census American Community Survey (ACS) five-year (2016–2020) estimates of socioeconomic and demographic variables to construct Area Deprivation Index (ADI) for all census tracts in the study area. ADI is a composite measure of neighborhood socioeconomic disadvantage that incorporates information on education, employment, income, poverty, household, and housing characteristics (30). We applied the R “Sociome” package to construct estimates that includes 15 original ACS variables for constructing ADI (the number of households without a telephone and the number of occupied housing units without complete plumbing were excluded from the computation) (31). Higher ADI scores indicate greater neighborhood deprivation.
Social vulnerability
We downloaded data for the social vulnerability index (SVI) from the Centers for Disease Control and Prevention (CDC)/Agency for Toxic Substances and Disease Registry (ATSDR). The SVI is a census tract-level composite metric comprised of 15 neighborhood characteristics in four domains (socioeconomic factors, household composition and disability, minority status and language, and housing type and transportation) and identifies communities at risk for public health emergencies related to natural and anthropogenic disasters (32). Higher SVI values indicate higher risk.
Racialized economic segregation
As proposed by Krieger et al. (33), we constructed the Index of Concentration at the Extremes (ICE) combined for race and income for all census tracts in our 8-county study area, using data from the U.S. Census ACS. ICE is a spatial measure of racialized economic segregation and here, we contrasted census-tract level differences between the proportions of high-income (>$100,000) non-Hispanic white persons and low-income (<$25,000) non-Hispanic Black persons. ICE has values ranging from −1 (areas of extreme economic and racial privilege) to 1 (areas of extreme economic and racial privilege).
Food access
We downloaded census-tract level indicators of food access for the 8-county study area from the USDA Food Access Research Atlas for 2019, including proportion of housing units that are without a vehicle and beyond ½ mile from a supermarket (34).
Statistical analyses
We sought to characterize individual and neighborhood characteristics among pregnant people who enrolled in the MIEHR cohort. We calculated descriptive statistics for individual-level sociodemographic, behavioral, and health history information collected from questionnaires or abstracted from EHRs; data are presented both overall and by race. We also summarized the responses to the EOD scale and questions about sources of stress and social support by race. We computed summary statistics including the mean and standard deviation, selected percentiles, and detection frequency for urinary concentrations of selected OH-PAHs with at least 50% of values above the LOD (i.e., 1-NAP, 2-NAP, 2-PHEN, 3-PHEN, 2/3/9-FLUO and 1-PYR), as well as cotinine. Spearman rank correlation analysis was conducted between cotinine and OH-PAHs. Over the 8-county study area, we categorized values of ADI, ICE, and SVI into quintiles whereas we classified food access by tertiles because of a highly skewed distribution. We linked the census tract of a pregnant person's residence at delivery to the appropriate quantile of each metric and evaluated the percentile breakdown of neighborhood features for the study population together and stratified by race. Statistical or spatial analyses were performed in SAS (version 9.4) or ArcGIS (version 3.1.2).
Results
As of February 28, 2023, 1,244 pregnant people were enrolled in the MIEHR cohort: 926 (74.4%) at Memorial Hermann Hospital, 211 (17.0%) at Texas Children's Pavilion for Women and 107 (8.6%) at Ben Taub Hospital. In total, nearly 80% of participants agreed to be re-contacted. Almost all participants (n = 1,241, 99.8%) provided urine samples and 595 (49.8%) provided blood samples. We also compared pregnant people who provided blood samples to the total cohort and there were little differences in the sociodemographic characteristics between these two groups. Among participants who were offered the opportunity to provide additional biological samples (n = 318), most (93.1%) provided oral swabs whereas relatively few provided vaginal swabs (24.2%) or fecal (15.1%) samples.
Table 1 presents a sociodemographic breakdown of the MIEHR cohort. Fifty-six percent of pregnant people were between the ages of 25–34 when they delivered their infants; most (61.1%) were non-Hispanic Black. Similar proportions of pregnant people report an annual household income of less than $35,000 (35.5%) or $75,000 or more (38.5%). Most pregnant people did not smoke (96%) or use alcohol (87.3%) during their pregnancy. There are notable differences in the sociodemographic profiles of Black and white pregnant people in the MIEHR cohort: 33.2% of Black pregnant people were less than 25 years of age when they delivered their infants as compared to 8.3% of white pregnant people; almost two-thirds (63.4%) of Black pregnant people were single as compared to 10.1% of white pregnant people; there was a five-fold difference in the percentage of Black pregnant people with household incomes lower than $35,000 as compared to white pregnant people; and a greater proportion of Black pregnant people as compared to white pregnant people initiated prenatal care at or after 13 weeks (21.1% vs. 6.8%). Regarding lifestyle factors, while the prevalence was low in both groups, there was almost a 3-fold increase in the proportion of white pregnant people as compared to Black pregnant people who reported using alcohol during their pregnancy (20.7% vs. 7.6%, respectively). As shown in Figure 2, the MIEHR cohort comes from a large, dispersed, geographic area in greater Houston. Over three-fourths of pregnant people (76.7%) did not move during their pregnancy. Among pregnant people who lived at more than one address while pregnant, 266 (21.4%) reported one move, 17 (1.4%) reported two moves, and 3 (0.2%) reported three moves.

Table 1. Sociodemographic characteristics of MIEHR study participants, greater Houston area, April 2021—February 2023, N = 1,244.
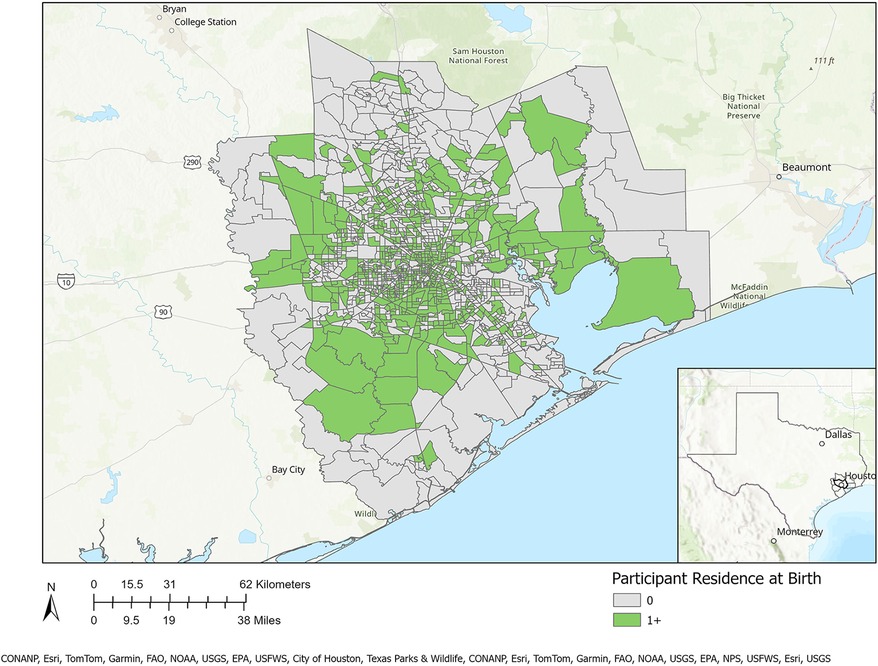
Figure 2. Residential locations of MIEHR cohort participants recruited through February 2023 in the greater Houston (8-county) study area (census tracts with residential locations of at least one study participant are shaded in green).
Individual-level exposures: non-chemical stressors (discrimination, stress and social support)
Table 2 reports on experiences of lifetime discrimination reported by pregnant people in different settings. In total, 83.9% of white participants reported no experiences of lifetime discrimination as compared to 47.4% of Black participants. The most common situations for Black participants reported experiencing discrimination were when they were getting services in a store or restaurant (32.5%), on the street or in a public setting (31.7%) or at work (30.5%). The summary scores for frequency of experiencing discrimination were 5.8 (SD = 8.7) and 0.9 (SD = 2.8) among Black and white participants, respectively. Table 3 summarizes stress experiences following the arrival of Hurricane Harvey in August 2017 and during the COVID-19 pandemic. A larger proportion of Black pregnant people (38.0%) than white pregnant people (16.9%) reported being impacted by Hurricane Harvey and had higher levels of stress in all contexts (i.e., new or worsened respiratory conditions; new or worsened anxiety; new or worsened depression; displaced from home; experienced extensive property loss or damage; or experienced new or worsened financial hardship). While more white than Black participants report that they or a family member tested positive for SARS-CoV-2, a greater proportion of Black participants reported that they (or a family member) were hospitalized. The financial impact of the COVID-19 pandemic in terms of employment (reductions in wages, hour worked or job loss) was greater among white participants (64.3%) as compared to Black participants (49.9%) whereas more Black than white participants had difficulty with getting food (15.3 vs. 7.9%), housing (13.3 vs. 2.7%) or transportation (11.6 vs. 2.9%).
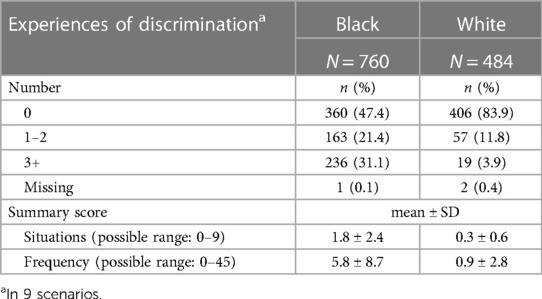
Table 2. Experiences of discrimination of MIEHR study participants, greater Houston area, April 2021—February 2023.
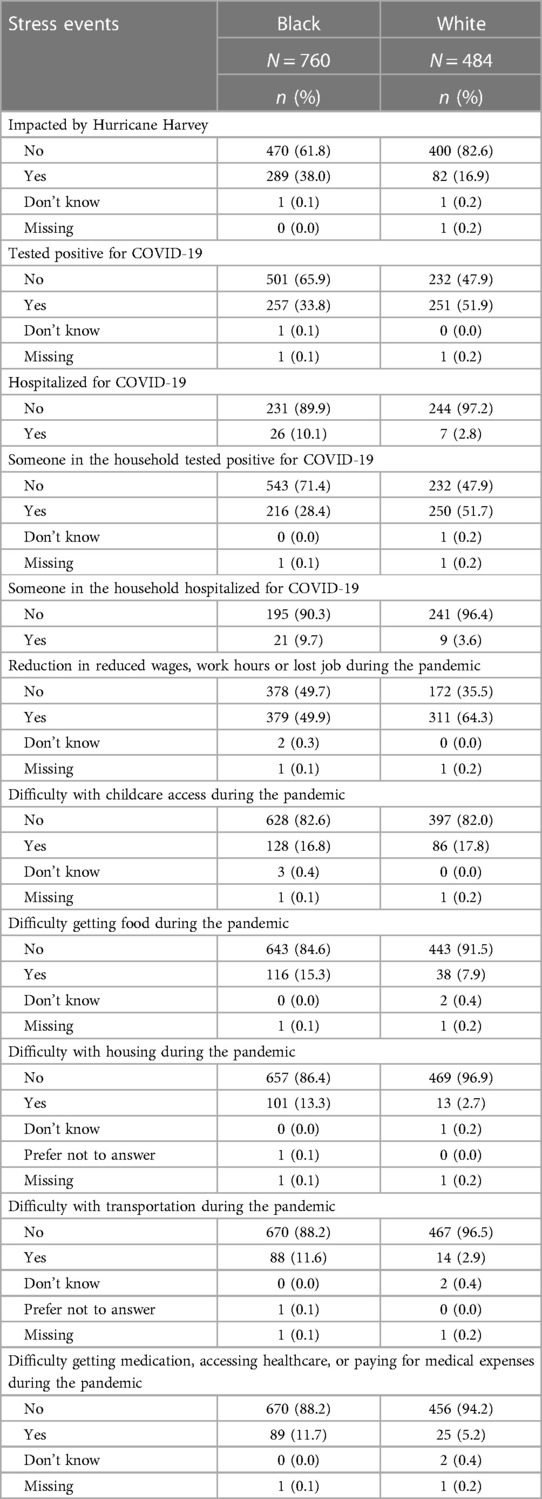
Table 3. Stress events during hurricane harvey (August 2017) and the COVID-19 pandemic, MIEHR study participants, greater Houston area, April 2021—February 2023.
In contrast to experiences following Hurricane Harvey or during the COVID-19 pandemic, higher proportions of Black as compared to white pregnant people reported “not stressful” when asked about the amount of stress during their pregnancy (30.4% vs. 11.0%) whereas the proportions of participants reporting “very stressful” were similar between the groups (see Table 4). Also shown in Table 4 are summaries of responses about assistance and support from the father or family members and friends. Whereas 83.5% of white participants reported receiving an “excellent amount” of support from the father, only 57.5% of Black participants reported this same level of support. There were also differences by race for participants receiving low levels of social support with 17.5% of Black participants reporting “a little” or “none”, as compared to 5.4% of white participants. In contrast, there were modest differences by race in the amount of assistance and support from family members and friends.
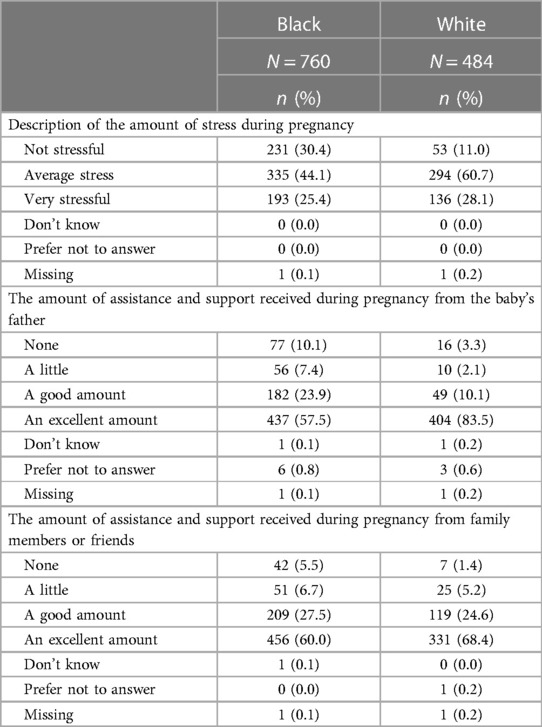
Table 4. Stress and support during pregnancy, by race, of MIEHR study participants, greater Houston area, April 2021—February 2023.
Individual-level exposures: chemical stressors
Urinary concentrations of OH-PAH metabolites (μg/g creatinine) for 579 study participants showed that at least 50% of the values were above the LOD for 1-NAP (100%), 2-NAP (100%), 2/3/9-FLUO (83.8%), 1/9-PHEN (74.1%), 2-PHEN (58.2%), and 1-PYR (57.2%). The 50th (25th and 75th) percentiles for these PAH metabolites were 0.634 (0.384,1.107) (1-NAP), 5.844 (3.136, 10.595) (2-NAP), 0.032 (0.020, 0.053) (2-PHEN), 0.040 (0.023, 0.072) (1/9-PHEN), 0.070 (0.044, 0.127) (2/3/9-FLUO) and 0.036 (0.022, 0.062) (1-PYR) μg/g creatinine (Figure 3). Because PAHs are constituents of cigarette smoke, a heat map of the Spearman rank correlation coefficients for these OH-PAHs as well as cotinine was performed as shown in Supplementary Figure S1. Pair-wise correlations ranged from 0.085 to 0.690 and most (n = 14; 66.7%) of the correlation coefficients were 0.5 or lower. The highest correlations were observed between 2-PHEN and 1-PYY (0.69), 2-PHEN and 2/3/9-FLUOR (0.67), 1/9-PHEN and 2/3/9-FLUOR (0.66), 2-PHEN and 1/9-PHEN (0.65), 1/9-PHEN and 1-PYR (0.63), 2/3/9-FLUOR and 1-PYY (0.57) and 1-NAP and 2-NAP (0.54).
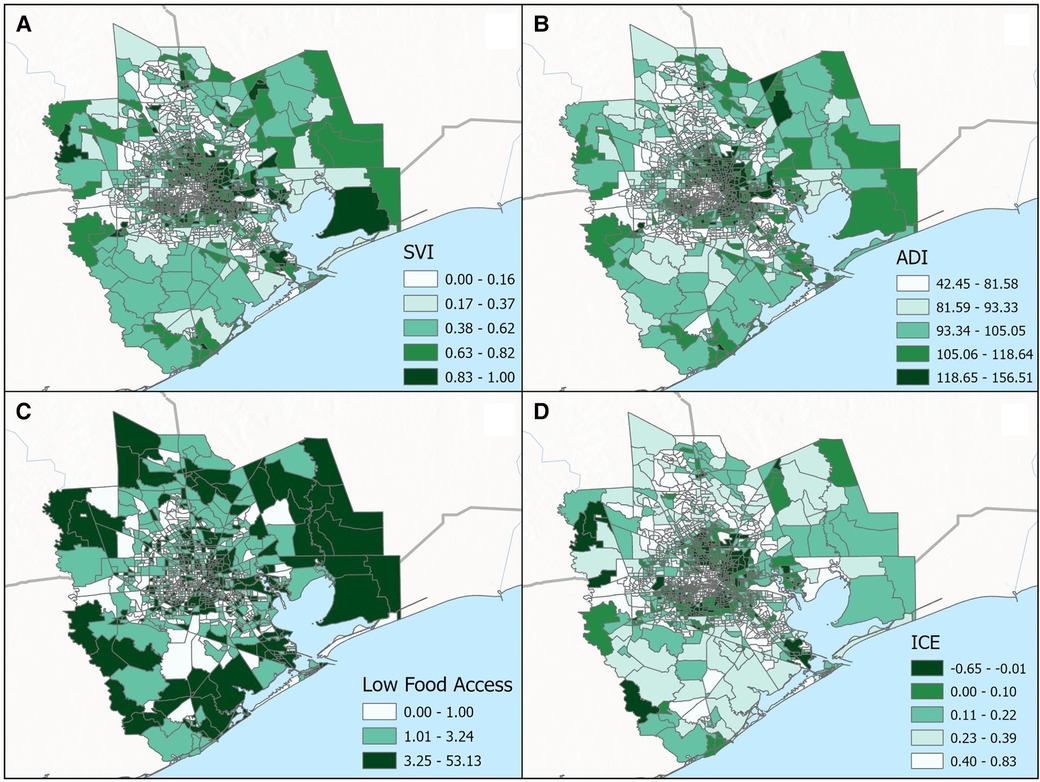
Figure 3. Categorical breakdown across census tracts for the (A) social vulnerability index (SVI), (B) area deprivation index (ADI), (C) low food access and (D) index of concentration at the extremes (ICE) for the greater Houston (8-county) study area.
Neighborhood-level exposures: Non-chemical stressors (tree canopy, socioeconomic deprivation, social vulnerability, residential segregation, food access)
In total, the median proportion of tree canopy cover within 300 m of participant's residence at delivery was 9%; 95% of participants were classified as having less than 23% tree canopy cover near their homes. There were little differences in this metric of residential greenness by race—the 25th, 50th, and 75th percentiles of tree canopy cover were 4.8, 9.4, and 15.4% for white participants and 4.8, 9.0 and 13.3% for Black participants. Figure 4 displays the spatial distribution of census tract-level ADI, SVI, ICE and Food Access for the 8-county study area. As shown in Table 5, substantially larger proportions of Black participants as compared to white participants lived in neighborhoods with: (1) high levels of socioeconomic disadvantage (upper two quintiles for ADI: 64.5% vs. 17.5%, respectively), (2) greater risk for public health emergencies (upper two quintiles for SVI: 59.8% vs. 19.6%, respectively), (3) higher levels of racialized economic segregation (lower two quintiles of ICE: 73.8% vs. 19.7%, respectively) and (4) the lowest levels of food access (upper tertile of food access: 49.7% vs. 16.7%, respectively).
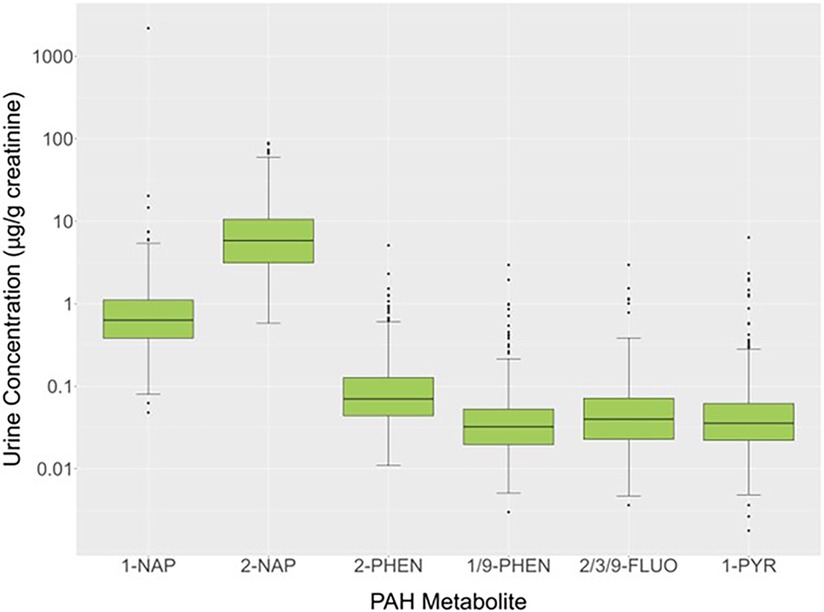
Figure 4. Box plots of OH-PAHS for a subset of the MIEHR cohort (n = 579).
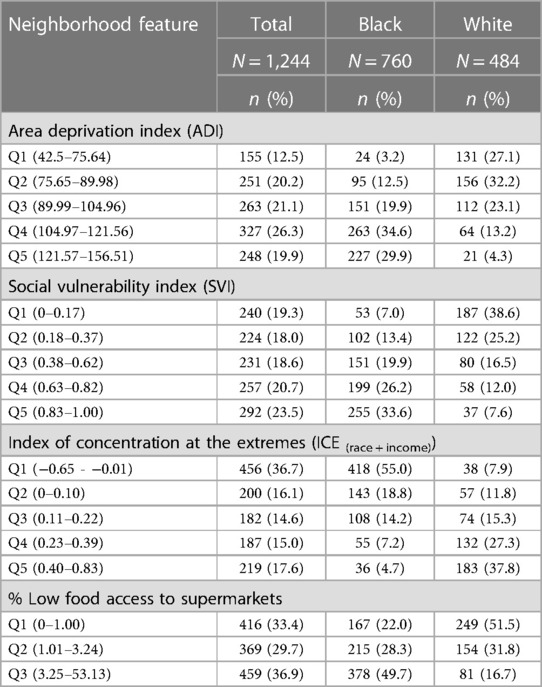
Table 5. Neighborhood features of MIEHR study participants, greater Houston area, April 2021—February 2023.
Neighborhood-level exposures: chemical stressors (proximity to superfund sites)
The median value from a participant's residence to the closest Superfund site was 3.62 miles, with the residences of Black participants slightly closer to a site (3.40 miles) as compared to residences of white participants (3.90 miles). The interquartile range of residential distances to the nearest Superfund site was 3.61 miles for all participants, and 3.38 and 4.05 miles for Black and white participants, respectively.
Discussion
Black pregnant people suffer the highest risks of poor pregnancy outcomes in the nation and the reasons for this disparity are poorly understood. Hence, we established the MIEHR cohort in a large and diverse urban area in the U.S. to unravel factors that help to explain Black-White disparities in preterm birth and other perinatal outcomes. Our focus is on examining effects of chemical and non-chemical stressors in the biological, physical, social, and built environments, i.e., the environmental riskscape, which contribute to racial disparities in maternal and child health. Extensive data is being collected in the MIEHR cohort through administration of questionnaires and EHR abstraction, along with collection of biological samples for chemical, miRNA, and microbiome assessments. Beyond individual-level factors, features of a pregnant person's neighborhood environment are also being characterized. Initial analysis of individual- and neighborhood-level factors among the 1,244 pregnant people enrolled in MIEHR through the end of February 2023 suggests differences between Black and white pregnant people in experiences of discrimination, stress, and levels of support, as well as in characteristics of their neighborhoods.
An earlier meta-analysis of the epidemiologic evidence reported significant albeit relatively small impacts of individual-level sources of psychosocial stress on adverse birth outcomes (35). Stress during pregnancy is associated with increased concentrations of catecholamines (36) and activation of the hypothalamic-pituitary-adrenal (HPA) axis that triggers a cascade of events culminating in the release of cortisol (35, 37), which crosses the placenta and may adversely impact fetal development and parturition (37). Our findings regarding racial differences in stress levels depended on whether questions were specific to events (like Hurricane Harvey or the pandemic) or were general in nature. In the aftermath of specific disasters, Black participants reported experiencing higher levels of stress than white participants, while reports of general stress were lower among Black as compared with white participants. Findings from the literature have been mixed. In one study and contrary to our findings, perceived stress levels, as assessed using Cohen's Perceived Stress Scale (PSS-14 ≥ 30), were greater among Black (24.7%) than white (7.7%) pregnant participants from Philadelphia, PA (38). On the other hand in a study using the Pregnancy Risk Assessment Monitoring System (PRAMS) data from 2012 to 2013, the prevalence of traumatic stressors were higher among white participants as compared to Black participants whereas there were little differences for either financial or relationship stressors (39).
A recent review points to a greater role for stressors like racial discrimination on increased risks for adverse birth outcomes (40). Consistent with prior findings that individuals of color have greater opportunity to experience stressful conditions due to the intersection of race and gender (41), Black pregnant people in the MIEHR cohort experienced greater discrimination as compared to their white counterparts. Our findings are similar to results from an earlier investigation of 112 pregnant people who were recruited in Chicago, Illinois that used the same scale as we applied in our study (42), as well as in a recently published cross-sectional analysis of 198 women that relied on a different tool (the Schedule of Racist Events measure) to assess discrimination (43).
Whereas there were modest differences in levels of support from family members and friends for Black and white pregnant people in our study, white pregnant people generally reported receiving higher levels of paternal support. The benefits of social support are hypothesized to operate through several pathways by reducing inflammation and biological aging. Population-based studies have reported Black-White differences in biological aging (44, 45), as well as inverse associations among Black (but not white) adults who participate in more social groups (44). A pilot study of 49 pregnant Black participants reported inverse associations between social support and pro-inflammatory cytokines (IL-2, IL-5, andIL-6) (46). While results from a systematic review and metanalysis suggest associations between low social support and increased risks for preterm birth, especially among participants with high stress levels (pooled OR of 1.52 (95% CI, 1.18, 1.97) (47), a consensus document from the March of Dimes concluded the evidence was insufficient regarding the role of social support in explaining Black-white disparities in preterm birth (48).
Neighborhoods represent shared physical characteristics, social and economic resources, and social interaction among residents (49, 50). Neighborhood socioeconomic disadvantage, which is a well-studied attribute of the neighborhood environment, has been consistently associated with adverse perinatal health even after controlling for individual-level factors (49, 51–53). Moreover, consistent with the hypothesis of a psychosocial pathway through which the residential environment adversely impacts pregnant people (54), studies have found in non-pregnant populations that neighborhood conditions associated with disadvantage are conducive to stress (55) and are linked to increased cumulative biological risk, allostatic load and cortisol levels (56–59). In our study, we found substantially larger proportions of Black participants as compared to white participants lived in neighborhoods with high levels of socioeconomic disadvantage. Similarly, based on assessment of ICE and SVI, higher proportions of Black women lived in neighborhoods that were socially and racially isolated or at elevated risk for natural or industrial disasters, respectively. While the evidence for the impact of residential greenspace on perinatal health is mixed (60), we are also computing metrics of greenness surrounding homes that a participants lived in during their pregnancy, including at delivery. Not surprisingly in an urban area such as Greater Houston, on average, there was less than 10% of tree canopy near a participant's residence and we found little differences in residential greenness between Black and white participants.
Given inequalities in the spatial distribution of environmental hazards, disadvantaged communities experience a higher burden of exposure to chemical stressors as evidenced in studies conducted across the U.S (17, 61, 62)., as well as in large urban areas (63, 64) including Houston (65). Hence, our focus on factors in the environmental riskscape extends to such stressors, particularly exposures to metals and PAHs in the physical environment that can occur via multiple pathways (ingestion, inhalation, or skin contact). Oxidative stress is a common pathway for metal-induced physiologic perturbations and subsequent toxicities (66, 67) and has been implicated in PAH toxicity as well (68, 69). During pregnancy, oxidative stress may result in alterations in signaling pathways, protein modifications, activation of inflammatory pathways and DNA oxidation; all of which may impact vascular function at the maternal placental interface (70).
Comparison of measured urinary concentrations of OH-PAHs in the present investigation with those previously reported in other populations, either during pregnancy or around the time of delivery is limited given differences in adjustment for urine dilution; as such, our comparisons were restricted to studies where OH-PAH concentrations were adjusted for creatinine. Median 1-PYR concentrations in our study (0.036 μg/g creatinine) were similar to levels measured in investigations conducted on pregnant people in Brazil (0.030 μg/g creatinine) and Saudia Arabia (0.050 μg/g creatinine) whereas they were lower than previously reported in studies from the Czech Republic (0.120 μg/g creatinine) (71), Japan (0.124 μg/g creatinine) (72), Poland (0.35 μg/g creatinine) (73), Haojiang, China (0.570 μg/g creatinine) (74), Taiyuan, China (1.83 μg/g creatinine) (75) and Iran (6.5 μg/g creatinine) (76). For 1-NAP, levels measured in the MIEHR cohort (median = 0.630 μg/g creatinine) fell between those reported in other studies. Whereas lower values were reported for pregnant people living in the Czech Republic (0.40 μg/g creatinine) (71), 1-NAP values were considerably higher in investigations in Iran (4.6 μg/g creatinine) and Brazil (16.99 μg/g creatinine) (77). For 2-NAP, concentrations were higher in our study when compared to levels in pregnant people in South Korea (78) [arithmetic mean (AM) = 9.44 μg/g creatinine vs. 0.010 μg/g creatinine], Canada [geometric mean (GM) = 6.002 μg/g creatinine vs. 2.61 μg/g creatinine] (79), Brazil (median = 5.84 μg/g creatinine vs. 3.62 μg/g creatinine vs.) or Iran (median = 5.84 μg/g creatinine vs. 2.5 μg/g creatinine). In contrast, median levels of 2-PHEN of 0.032 μg/g creatinine in the MIEHR cohort were low relative to reports in the Czech Republic (71) (0.170 μg/g creatinine), China (80) (0.109 μg/g creatinine), or Poland (73) (0.430 μg/g creatinine). Overall, PAH exposure patterns varied in our cohort compared to pregnant people in other countries; also, where comparisons could be made, concentrations in our study were similar (2-NAP) or lower (1-NAP and 1-PYR) than those reported for NHANES for either females ages 3 and older or adults ages 20 and older (81).
Future directions
We continue to enroll pregnant people in the MIEHR cohort. Analyses of urinary metal concentrations are underway as are maternal oral microbiome testing and miRNA analyses in plasma samples. Work is also ongoing to characterize a participant's neighborhood environment more fully by developing metrics for proximity to major roadways and other major pollution sources. With complete cohort data, we will formally evaluate differences in exposure profiles between Black and white cohort members and associations between exposure to the mixture of metal and OH-PAH metabolites and perinatal health outcomes, as well as the potential modifying role of neighborhood stressors on these associations. We are also planning on developing disparity-aware classifiers to identify the most informative set of features that predict risk for preterm birth for Black and white women. Future studies will continue to follow up pregnant participants and their children to evaluate the impact of the environmental riskscape on their longer-term health and well-being.
Data availability statement
The datasets presented in this article are not readily available because de-identified data will be made available according to the restrictions as specified in the IRB protocol. Requests to access data should be directed toZWxhaW5lLnN5bWFuc2tpQGJjbS5lZHU=.
Ethics statement
The studies involving humans were approved by Baylor College of Medicine Institutional Review Board. The studies were conducted in accordance with the local legislation and institutional requirements. The participants provided their written informed consent to participate in this study.
Author contributions
ES: Conceptualization, Data curation, Formal Analysis, Funding acquisition, Methodology, Project administration, Resources, Supervision, Writing – original draft, Writing – review & editing. KW: Conceptualization, Methodology, Supervision, Writing – review & editing. HM-F: Supervision, Writing – review & editing. KA: Supervision, Writing – review & editing. IM: Data curation, Formal Analysis, Writing – review & editing. JA: Data curation, Formal Analysis, Writing – review & editing. AC: Data curation, Visualization, Writing – review & editing. KK: Formal Analysis, Writing – review & editing. CW: Writing – review & editing. CC: Writing – review & editing. MS: Writing – review & editing. HS: Writing – review & editing.
Funding
The author(s) declare financial support was received for the research, authorship, and/or publication of this article.
This work was supported by the MIEHR Research Center (P50MD015496) funded by the National Institute of Minority Health and Health Disparities (NIMHD), the National Institute of Environmental Health Sciences (NIEHS) and the Eunice Kennedy Shriver National Institute of Child Health and Human Development (NICHD) and the NIEHS Gulf Coast Center for Precision Environmental Health (GC-CPEH) (P30ES030285). Additional support was provided by P42ES027725 to KA, CC and MS. CC also received support through the Cancer Prevention Institute of Texas (CPRIT) (RP210227 and RP200504).
Acknowledgments
We thank the MIEHR cohort members for their participation in this study and are grateful to the MIEHR Community Advisory Board (CAB) for their input throughout the study. We acknowledge Katrina Korenek, Jia Chen and Sunbola Ashimi Ademola for their efforts in overseeing field activities, the field staff for recruitment of study participants, the Population Sciences Biorepository at BCM for processing and storing biological samples, and Sandra Grimm and Mingze Yuan for preparation of figures.
Conflict of interest
The authors declare that the research was conducted in the absence of any commercial or financial relationships that could be construed as a potential conflict of interest.
The reviewer CH declared a past co-authorship with the author KK to the handling editor.
The author(s) declared that they were an editorial board member of Frontiers, at the time of submission. This had no impact on the peer review process and the final decision.
Publisher's note
All claims expressed in this article are solely those of the authors and do not necessarily represent those of their affiliated organizations, or those of the publisher, the editors and the reviewers. Any product that may be evaluated in this article, or claim that may be made by its manufacturer, is not guaranteed or endorsed by the publisher.
Supplementary material
The Supplementary Material for this article can be found online at: https://www.frontiersin.org/articles/10.3389/frph.2024.1304717/full#supplementary-material
References
1. Centers for Disease Control and Prevention. Infographic: Racial/Ethnic Disparities in Pregnancy-Related Deaths — United States, 2007–2016. Available online at: https://www.cdc.gov/reproductivehealth/maternal-mortality/disparities-pregnancy-related-deaths/infographic.html (updated April 22, 2022).
2. Centers for Disease Control and Prevention. Maternal Mortality Rates in the United States. Available online at: https://www.cdc.gov/nchs/data/hestat/maternal-mortality/2020/E-stat-Maternal-Mortality-Rates-2022.pdf (updated February 23, 2022; cited June 7, 2022).
3. McKinnon B, Yang S, Kramer MS, Bushnik T, Sheppard AJ, Kaufman JS. Comparison of black-white disparities in preterm birth between Canada and the United States. CMAJ. (2016) 188(1):E19–26. doi: 10.1503/cmaj.150464
4. U.S. Centers for Disease Control and Prevention (CDC). Premature Birth 2021. Available online at: https://www.cdc.gov/reproductivehealth/features/premature-birth/index.html (cited 6/3, 2022).
5. Kinder Institute for Urban Research. What Accounts for Health Disparities? Findings from the Houston Surveys (2001–2013). (2014).
6. WelfareInfo. Poverty in Houston, Texas. (2019). Available online at: https://www.welfareinfo.org/poverty-rate/texas/houston#by-race (Accessed June 3, 2022).
7. March of Dimes. 2022 March of Dimes Report Card for Texas March of Dimes Foundation. (2022). Available online at: https://www.marchofdimes.org/peristats/reports/texas/report-card (Accessed May 18, 2023).
8. Alexander GR, Kogan MD, Himes JH, Mor JM, Goldenberg R. Racial differences in birthweight for gestational age and infant mortality in extremely-low-risk US populations. Paediatr Perinat Epidemiol. (1999) 13(2):205–17. doi: 10.1046/j.1365-3016.1999.00174.x
9. Kramer MS, Ananth CV, Platt RW, Joseph KS. US Black vs white disparities in foetal growth: physiological or pathological? Int J Epidemiol. (2006) 35(5):1187–95. doi: 10.1093/ije/dyl125
10. Owen CM, Goldstein EH, Clayton JA, Segars JH. Racial and ethnic health disparities in reproductive medicine: an evidence-based overview. Semin Reprod Med. (2013) 31(5):317–24. doi: 10.1055/s-0033-1348889
11. Thoma ME, Drew LB, Hirai AH, Kim TY, Fenelon A, Shenassa ED. Black-white disparities in preterm birth: geographic, social, and health determinants. Am J Prev Med. (2019) 57(5):675–86. doi: 10.1016/j.amepre.2019.07.007
12. Johnson JD, Green CA, Vladutiu CJ, Manuck TA. Racial disparities in prematurity persist among women of high socioeconomic status. Am J Obstet Gynecol MFM. (2020) 2(3):100104. doi: 10.1016/j.ajogmf.2020.100104
13. ACOG Committee Opinion No. 649: racial and ethnic disparities in obstetrics and gynecology. Obstet Gynecol. (2015) 126(6):e130–e4. doi: 10.1097/AOG.0000000000001213
14. Bailey ZD, Feldman JM, Bassett MT. How structural racism works—racist policies as a root cause of U. S. Racial Health Inequities. N Engl J Med. (2021) 384(8):768–73. doi: 10.1056/NEJMms2025396
15. Paula AB, Elaine A, Dwayne P, Tina K, Nicole H. Systemic and structural racism: definitions, examples, health damages, and approaches to dismantling. Health Aff (Millwood). (2022) 41(2):171–3. doi: 10.1377/hlthaff.2021.01394
16. Colmer J, Hardman I, Shimshack J, Voorheis J. Disparities in PM (2.5) air pollution in the United States. Science. (2020) 369(6503):575–8. doi: 10.1126/science.aaz9353
17. Miranda ML, Edwards SE, Keating MH, Paul CJ. Making the environmental justice grade: the relative burden of air pollution exposure in the United States. Int J Environ Res Public Health. (2011) 8(6):1755–71. doi: 10.3390/ijerph8061755
18. Woodruff TJ, Parker JD, Kyle AD, Schoendorf KC. Disparities in exposure to air pollution during pregnancy. Environ Health Perspect. (2003) 111(7):942–6. doi: 10.1289/ehp.5317
19. Zou B, Peng F, Wan N, Mamady K, Wilson GJ. Spatial cluster detection of air pollution exposure inequities across the United States. PLoS One. (2014) 9(3):e91917. doi: 10.1371/journal.pone.0091917
20. Morello-Frosch R, Shenassa ED. The environmental “riskscape” and social inequality: implications for explaining maternal and child health disparities. Environ Health Perspect. (2006) 114(8):1150–3. doi: 10.1289/ehp.8930
21. McCann A. 2023’s Most Diverse Cities in the U.S.: WalletHub. (2023). Available online at: https://wallethub.com/edu/most-diverse-cities/12690 (updated May 17, 2023; cited July 30 2023).
22. Houston Health Department. Health Disparity and Health Inequity Houston, Texas Houston Health Department. (2020).
23. Krieger N, Smith K, Naishadham D, Hartman C, Barbeau EM. Experiences of discrimination: validity and reliability of a self-report measure for population health research on racism and health. Soc Sci Med. (2005) 61(7):1576–96. doi: 10.1016/j.socscimed.2005.03.006
24. Symanski E, An Han H, Han I, McDaniel M, Whitworth KW, McCurdy S, et al. Responding to natural and industrial disasters: partnerships and lessons learned. Disaster Med Public Health Prep. (2022) 16(3):885–8. doi: 10.1017/dmp.2020.467
25. Ding X, Liang M, Wu Y, Zhao T, Qu G, Zhang J, et al. The impact of prenatal stressful life events on adverse birth outcomes: a systematic review and meta-analysis. J Affect Disord. (2021) 287:406–16. doi: 10.1016/j.jad.2021.03.083
26. Guo Y, Senthilkumar K, Alomirah H, Moon H-B, Minh TB, Mohd MA, et al. Concentrations and profiles of urinary polycyclic aromatic hydrocarbon metabolites (OH-PAHs) in several Asian Countries. Environ Sci Technol. (2013) 47(6):2932–8. doi: 10.1021/es3052262
27. Hornung RW, Reed LD. Estimation of average concentration in the presence of nondetectable values. Appl Occup Environ Hyg. (1990) 5(1):46–51. doi: 10.1080/1047322X.1990.10389587
28. Mohai P, Lantz PM, Morenoff J, House JS, Mero RP. Racial and socioeconomic disparities in residential proximity to polluting industrial facilities: evidence from the Americans’ changing lives study. Am J Public Health. (2009) 99(Suppl 3):S649–56. doi: 10.2105/AJPH.2007.131383
29. Texas Commission on Environmental Quality. Superfund Sites by County. (2023). Available online at: https://www.tceq.texas.gov/remediation/superfund/sites/county (updated March 14, 2023; cited July 30, 2023).
30. Singh GK. Area deprivation and widening inequalities in US mortality, 1969–1998. Am J Public Health. (2003) 93(7):1137–43. doi: 10.2105/AJPH.93.7.1137
31. Krieger N, Dalton J, Wang C, Perzynski A. Sociome: Operationalizing Social Determinants of Health Data for Researchers V. 2.2.0 ed2022.
32. Centers for Disease Control and Prevention/Agency for Toxic Substances and Disease Registry. At a Glance: CDC/ATSDR Social Vulnerability Index 2020. Geospatial Research, Analysis, and Services Program. CDC/ATSDR Social Vulnerability Index Database [Texas]. (2020). Available online at: https://www.atsdr.cdc.gov/placeandhealth/svi/at-a-glance_svi.html (updated October 26, 2022).
33. Krieger N, Waterman PD, Spasojevic J, Li W, Maduro G, Van Wye G. Public health monitoring of privilege and deprivation with the index of concentration at the extremes. Am J Public Health. (2016) 106(2):256–63. doi: 10.2105/AJPH.2015.302955
34. USDA. Food Access Resarch Atlas. (2019). Available online at: https://www.ers.usda.gov/data-products/food-access-research-atlas/ (updated July 10, 2023).
35. Littleton HL, Bye K, Buck K, Amacker A. Psychosocial stress during pregnancy and perinatal outcomes: a meta-analytic review. J Psychosom Obstet Gynaecol. (2010) 31(4):219–28. doi: 10.3109/0167482X.2010.518776
36. Hobel C, Culhane J. Role of psychosocial and nutritional stress on poor pregnancy outcome. J Nutr. (2003) 133(5 Suppl 2):1709S–17S. doi: 10.1093/jn/133.5.1709S
37. Hobel CJ, Goldstein A, Barrett ES. Psychosocial stress and pregnancy outcome. Clin Obstet Gynecol. (2008) 51(2):333–48. doi: 10.1097/GRF.0b013e31816f2709
38. Kornfield SL, Riis VM, McCarthy C, Elovitz MA, Burris HH. Maternal perceived stress and the increased risk of preterm birth in a majority non-hispanic black pregnancy cohort. J Perinatol. (2022) 42(6):708–13. doi: 10.1038/s41372-021-01186-4
39. Almeida J, Becares L, Erbetta K, Bettegowda VR, Ahluwalia IB. Racial/ethnic inequities in low birth weight and preterm birth: the role of multiple forms of stress. Matern Child Health J. (2018) 22(8):1154–63. doi: 10.1007/s10995-018-2500-7
40. van Daalen KR, Kaiser J, Kebede S, Cipriano G, Maimouni H, Olumese E, et al. Racial discrimination and adverse pregnancy outcomes: a systematic review and meta-analysis. BMJ Glob Health. (2022) 7(8):e1–28. doi: 10.1136/bmjgh-2022-009227
41. Watson LB, DeBlaere C, Langrehr KJ, Zelaya DG, Flores MJ. The influence of multiple oppressions on women of color’s experiences with insidious trauma. J Couns Psychol. (2016) 63(6):656–67. doi: 10.1037/cou0000165
42. Borders AE, Lai JS, Wolfe K, Qadir S, Peng J, Kim KY, et al. Using item response theory to optimize measurement of chronic stress in pregnancy. Soc Sci Res. (2017) 64:214–25. doi: 10.1016/j.ssresearch.2016.12.003
43. Johnson A, Dobbs PD, Coleman L, Maness S. Pregnancy-specific stress and racial discrimination among U.S. Women. Matern Child Health J. (2023) 27(2):328–34. doi: 10.1007/s10995-022-03567-3
44. Forrester S, Jacobs D, Zmora R, Schreiner P, Roger V, Kiefe CI. Racial differences in weathering and its associations with psychosocial stress: the CARDIA study. SSM Popul Health. (2019) 7:003–3. doi: 10.1016/j.ssmph.2018.11.003
45. Levine ME, Crimmins EM. Evidence of accelerated aging among African Americans and its implications for mortality. Soc Sci Med. (2014) 118:27–32. doi: 10.1016/j.socscimed.2014.07.022
46. Giurgescu C, Sanguanklin N, Engeland CG, White-Traut RC, Park C, Mathews HL, et al. Relationships among psychosocial factors, biomarkers, preeclampsia, and preterm birth in African American women: a pilot. Appl Nurs Res. (2015) 28(1):e1–6. doi: 10.1016/j.apnr.2014.09.002
47. Hetherington E, Doktorchik C, Premji SS, McDonald SW, Tough SC, Sauve RS. Preterm birth and social support during pregnancy: a systematic review and meta-analysis. Paediatr Perinat Epidemiol. (2015) 29(6):523–35. doi: 10.1111/ppe.12225
48. Braveman P, Dominguez TP, Burke W, Dolan SM, Stevenson DK, Jackson FM, et al. Explaining the black-white disparity in preterm birth: a consensus statement from a multi-disciplinary scientific work group convened by the march of dimes. Front Reprod Health. (2021) 3:684207. doi: 10.3389/frph.2021.684207
49. Mutambudzi M, Meyer JD, Reisine S, Warren N. A review of recent literature on materialist and psychosocial models for racial and ethnic disparities in birth outcomes in the US, 2000–2014. Ethn Health. (2017) 22(3):311–32. doi: 10.1080/13557858.2016.1247150
50. O'Campo P, Caughy M. Methods in social epidemiology. In: Oakes JM, Kaufman JS, N.Y.: Jossey-Bass (2017). p. 158–176.
51. Vos AA, Posthumus AG, Bonsel GJ, Steegers EA, Denktas S. Deprived neighborhoods and adverse perinatal outcome: a systematic review and meta-analysis. Acta Obstet Gynecol Scand. (2014) 93(8):727–40. doi: 10.1111/aogs.12430
52. Metcalfe A, Lail P, Ghali WA, Sauve RS. The association between neighbourhoods and adverse birth outcomes: a systematic review and meta-analysis of multi-level studies. Paediatr Perinat Epidemiol. (2011) 25(3):236–45. doi: 10.1111/j.1365-3016.2011.01192.x
53. Ncube CN, Enquobahrie DA, Albert SM, Herrick AL, Burke JG. Association of neighborhood context with offspring risk of preterm birth and low birthweight: a systematic review and meta-analysis of population-based studies. Soc Sci Med. (2016) 153:156–64. doi: 10.1016/j.socscimed.2016.02.014
54. Morenoff JD. Neighborhood mechanisms and the spatial dynamics of birth weight. AJS. (2003) 108(5):976–1017. doi: 10.1086/374405
55. Schulz AJ, Mentz G, Lachance L, Zenk SN, Johnson J, Stokes C, et al. Do observed or perceived characteristics of the neighborhood environment mediate associations between neighborhood poverty and cumulative biological risk? Health Place. (2013) 24:147–56. doi: 10.1016/j.healthplace.2013.09.005
56. Bird CE, Seeman T, Escarce JJ, Basurto-Davila R, Finch BK, Dubowitz T, et al. Neighbourhood socioeconomic status and biological ‘wear and tear’ in a nationally representative sample of US adults. J Epidemiol Community Health. (2010) 64(10):860–5. doi: 10.1136/jech.2008.084814
57. Merkin SS, Basurto-Davila R, Karlamangla A, Bird CE, Lurie N, Escarce J, et al. Neighborhoods and cumulative biological risk profiles by race/ethnicity in a national sample of U. S. Adults: NHANES III. Ann Epidemiol. (2009) 19(3):194–201. doi: 10.1016/j.annepidem.2008.12.006
58. Barber S, Hickson DA, Kawachi I, Subramanian SV, Earls F. Neighborhood disadvantage and cumulative biological risk among a socioeconomically diverse sample of African American adults: an examination in the Jackson Heart Study. J Racial Ethn Health Disparities. (2016) 3(3):444–56. doi: 10.1007/s40615-015-0157-0
59. Hosseini F, Adha N, Zainol R, Isahak M, Nemati N. Neighborhood-level stress and circadian cortisol: a systematic review and meta-analysis. Iran J Public Health. (2014) 43(10):1324–34. PMCID: PMC4441885
60. Hu CY, Yang XJ, Gui SY, Ding K, Huang K, Fang Y, et al. Residential greenness and birth outcomes: a systematic review and meta-analysis of observational studies. Environ Res. (2021) 193:110599. doi: 10.1016/j.envres.2020.110599
61. Liu J, Clark LP, Bechle MJ, Hajat A, Kim SY, Robinson AL, et al. Disparities in air pollution exposure in the United States by race/ethnicity and income, 1990–2010. Environ Health Perspect. (2021) 129(12):127005. doi: 10.1289/EHP8584
62. Jbaily A, Zhou X, Liu J, Lee TH, Kamareddine L, Verguet S, et al. Air pollution exposure disparities across US population and income groups. Nature. (2022) 601(7892):228–33. doi: 10.1038/s41586-021-04190-y
63. Pope R, Wu J, Boone C. Spatial patterns of air pollutants and social groups: a distributive environmental justice study in the phoenix metropolitan region of USA. Environ Manag. (2016) 58(5):753–66. doi: 10.1007/s00267-016-0741-z
64. Bramble K, Blanco MN, Doubleday A, Gassett AJ, Hajat A, Marshall JD, et al. Exposure disparities by income, race and ethnicity, and historic redlining grade in the greater Seattle area for ultrafine particles and other air pollutants. Environ Health Perspect. (2023) 131(7):77004. doi: 10.1289/EHP11662
65. Han I, Guo Y, Afshar M, Stock TH, Symanski E. Comparison of trace elements in size-fractionated particles in two communities with contrasting socioeconomic status in Houston, TX. Environ Monit Assess. (2017) 189(2):67. doi: 10.1007/s10661-017-5780-2
66. Valko M, Morris H, Cronin MT. Metals, toxicity and oxidative stress. Curr Med Chem. (2005) 12(10):1161–208. doi: 10.2174/0929867053764635
67. Al-Gubory KH. Environmental pollutants and lifestyle factors induce oxidative stress and poor prenatal development. Reprod Biomed Online. (2014) 29(1):17–31. doi: 10.1016/j.rbmo.2014.03.002
68. Agarwal P, Singh L, Anand M, Taneja A. Association between placental polycyclic aromatic hydrocarbons (PAHS), oxidative stress, and preterm delivery: a case-control study. Arch Environ Contam Toxicol. (2018) 74(2):218–27. doi: 10.1007/s00244-017-0455-0
69. Ferguson KK, McElrath TF, Pace GG, Weller D, Zeng L, Pennathur S, et al. Urinary polycyclic aromatic hydrocarbon metabolite associations with biomarkers of inflammation, angiogenesis, and oxidative stress in pregnant women. Environ Sci Technol. (2017) 51(8):4652–60. doi: 10.1021/acs.est.7b01252
70. Burton GJ, Jauniaux E. Oxidative stress. Best Pract Res Clin Obstet Gynaecol. (2011) 25(3):287–99. doi: 10.1016/j.bpobgyn.2010.10.016
71. Urbancova K, Dvorakova D, Gramblicka T, Sram RJ, Hajslova J, Pulkrabova J. Comparison of polycyclic aromatic hydrocarbon metabolite concentrations in urine of mothers and their newborns. Sci Total Environ. (2020) 723:138116. doi: 10.1016/j.scitotenv.2020.138116
72. Suzuki Y, Niwa M, Yoshinaga J, Mizumoto Y, Serizawa S, Shiraishi H. Prenatal exposure to phthalate esters and PAHs and birth outcomes. Environ Int. (2010) 36(7):699–704. doi: 10.1016/j.envint.2010.05.003
73. Polanska K, Hanke W, Dettbarn G, Sobala W, Gromadzinska J, Magnus P, et al. The determination of polycyclic aromatic hydrocarbons in the urine of non-smoking Polish pregnant women. Sci Total Environ. (2014) 487:102–9. doi: 10.1016/j.scitotenv.2014.04.006
74. Huo X, Wu Y, Xu L, Zeng X, Qin Q, Xu X. Maternal urinary metabolites of PAHs and its association with adverse birth outcomes in an intensive e-waste recycling area. Environ Pollut. (2019) 245:453–61. doi: 10.1016/j.envpol.2018.10.098
75. Nie J, Li J, Cheng L, Li Y, Deng Y, Yan Z, et al. Maternal urinary 2-hydroxynaphthalene and birth outcomes in Taiyuan, China. Environ Health. (2018) 17(1):91. doi: 10.1186/s12940-018-0436-4
76. Salami F, Hajizadeh Y, Yadegarfar G, Ebrahimpour K, Pourzamani H, Poursafa P. Urinary levels of PAH metabolites in pregnant women and their correlation with sociodemographic factors and PM2.5 exposure in an urban and a suburban area. Air Qual Atmos Health. (2021) 14(5):653–65. doi: 10.1007/s11869-020-00969-6
77. Cesila CA, Souza MCO, Cruz JC, Bocato MZ, Campiglia AD, Barbosa F. Biomonitoring of polycyclic aromatic hydrocarbons in Brazilian pregnant women: urinary levels and health risk assessment. Environ Res. (2023) 235:116571. doi: 10.1016/j.envres.2023.116571
78. Lamichhane DK, Leem JH, Kim HC, Lee JY, Park MS, Jung DY, et al. Impact of prenatal exposure to polycyclic aromatic hydrocarbons from maternal diet on birth outcomes: a birth cohort study in Korea. Public Health Nutr. (2016) 19(14):2562–71. doi: 10.1017/S1368980016000550
79. Nethery E, Wheeler AJ, Fisher M, Sjodin A, Li Z, Romanoff LC, et al. Urinary polycyclic aromatic hydrocarbons as a biomarker of exposure to PAHs in air: a pilot study among pregnant women. J Expo Sci Environ Epidemiol. (2012) 22(1):70–81. doi: 10.1038/jes.2011.32
80. Lou XY, Wu PR, Guo Y. Urinary metabolites of polycyclic aromatic hydrocarbons in pregnant women and their association with a biomarker of oxidative stress. Environ Sci Pollut Res Int. (2019) 26(26):27281–90. doi: 10.1007/s11356-019-05855-y
81. Prevention CfDCa, Services USDoHaH. National Report on Human Exposure to Environmental Chemicals. Updated March 2022. (2022). Available online at: https://www.cdc.gov/exposurereport/
Keywords: MIEHR, environment, health disparities, maternal health, preterm birth, neighborhood, stress
Citation: Symanski E, Whitworth KW, Mendez-Figueroa H, Aagaard KM, Moussa I, Alvarez J, Chardon Fabian A, Kannan K, Walker CL, Coarfa C, Suter MA and Salihu HM (2024) The Maternal and Infant Environmental Health Riskscape study of perinatal disparities in greater Houston: rationale, study design and participant profiles. Front. Reprod. Health 6:1304717. doi: 10.3389/frph.2024.1304717
Received: 29 September 2023; Accepted: 1 April 2024;
Published: 22 April 2024.
Edited by:
Kristen Rappazzo, United States Environmental Protection Agency (EPA), United StatesReviewed by:
Shanaz Ghuman, Durban University of Technology, South AfricaCaitlin G. Howe, Dartmouth College, United States
© 2024 Symanski, Whitworth, Mendez-Figueroa, Aagaard, Moussa, Alvarez, Chardon Fabian, Kannan, Walker, Coarfa, Suter and Salihu. This is an open-access article distributed under the terms of the Creative Commons Attribution License (CC BY). The use, distribution or reproduction in other forums is permitted, provided the original author(s) and the copyright owner(s) are credited and that the original publication in this journal is cited, in accordance with accepted academic practice. No use, distribution or reproduction is permitted which does not comply with these terms.
*Correspondence: Elaine Symanski ZWxhaW5lLnN5bWFuc2tpQGJjbS5lZHU=