 Deborah A. Theodore1*‡
 Craig J. Heck1,2,‡
 Simian Huang1
 Yuije Huang2April Autry3Brit Sovic1Cynthia Yang3Sarah Ann Anderson-Burnett3,4Caroline Ray3Eloise Austin1Joshua Rotbert3
 Jason Zucker1Marina Catallozzi3,4,5
 Delivette Castor1,2,†Magdalena E. Sobieszczyk1,†
- 1Division of Infectious Diseases, Department of Medicine, Columbia University Irving Medical Center, New York, NY, United States
- 2Department of Epidemiology, Columbia University Mailman School of Public Health, New York, NY, United States
- 3Barnard College, Health & Wellness, Barnard College, New York, NY, United States
- 4Division of Child and Adolescent Health, Department of Pediatrics, Columbia University Irving Medical Center, New York, NY, United States
- 5Heilbrunn Department of Population & Family Health, Columbia University Mailman School of Public Health, New York, NY, United States
Introduction: Violence against women is a prevalent, preventable public health crisis. COVID-19 stressors and pandemic countermeasures may have exacerbated violence against women. Cisgender college women are particularly vulnerable to violence. Thus, we examined the prevalence and correlates of verbal/physical violence experienced and perpetrated among cisgender women enrolled at a New York City college over one year during the COVID-19 pandemic.
Methods: From a prospective cohort study, we analyzed data self-reported quarterly (T1, T2, T3, T4) between December 2020 and December 2021. Using generalized estimated equations (GEE) and logistic regression, we identified correlates of experienced and perpetrated violence among respondents who were partnered or cohabitating longitudinally and at each quarter, respectively. Multivariable models included all variables with unadjusted parameters X2 p-value ≤0.05.
Results: The prevalence of experienced violence was 52% (T1: N = 513), 30% (T2: N = 305), 33% (T3: N = 238), and 17% (T4: N = 180); prevalence of perpetrated violence was 38%, 17%, 21%, and 9%. Baseline correlates of experienced violence averaged over time (GEE) included race, living situation, loneliness, and condom use; correlates of perpetrated violence were school year, living situation, and perceived social support. Quarter-specific associations corroborated population averages: living with family members and low social support were associated with experienced violence at all timepoints except T4. Low social support was associated with higher odds of perpetrated violence at T1/T3. Other/Multiracial identity was associated with higher odds of violence experience at T3.
Conclusions: Living situation was associated with experienced and perpetrated violence in all analyses, necessitating further exploration of household conditions, family dynamics, and interpersonal factors. The protective association of social support with experienced and perpetrated violence also warrants investigation into forms of social engagement and cohesion. Racial differences in violence also require examination. Our findings can inform university policy development on violence and future violence research. Within or beyond epidemic conditions, universities should assess and strengthen violence prevention and support systems for young women by developing programming to promote social cohesion.
Introduction
Violence against women and girls is a pervasive, preventable public health problem. Global and United States national data show that one in three women have survived physical, sexual, or psychological intimate partner violence (IPV) or non-partner sexual violence in their lifetime (1, 2). Rising levels of violence against women were reported following the onset of the COVID-19 pandemic (3, 4). According to one systematic review and meta-analysis, lockdown policies were followed by an 8.1% increase in domestic violence (5). Consequences of the pandemic, such as stay-at-home orders, school closures, social isolation, financial insecurity, and substance use in the context of increased stress and/or mental illness, may have contributed to increased rates of violence. The impact of COVID-19 on violence may be attenuated by the socioeconomic vulnerability of families and women from minoritized communities (4, 6–8). Individuals diagnosed with COVID-19 were more likely to experience violence, possibly related to other social determinants of both SARS-CoV-2 acquisition and the epidemic of interpersonal violence (9, 10). Similarly, increases in IPV have been observed in previous infectious disease outbreaks and crisis situations (e.g., during outbreaks of Ebola, Cholera, Zika, and Nipah virus, and in the setting of earthquakes and other natural disasters) (9–12).
College-aged women faced relatively high levels of psychological distress and are vulnerable to intimate and non-intimate partner violence (13, 14). In Fall 2019, a national cross-sectional survey of American college students revealed that 12% of females experienced verbal violence from partners and 9% from non-partners, whereas 3% and 2% survived physical violence from these respective perpetrators (15). These statistics have remained relatively stable across independent samples throughout COVID-19 (16–18). Notably, most available data on violence survivorship among college women during the COVID-19 pandemic are cross-sectional, representing a single time point during the pandemic; few longitudinal studies have been published (10, 19).
Violence perpetrated (i.e., committed/enacted) by women is a less researched phenomenon. Historical data suggest between 10%–40% of college women perpetrate physical IPV, while between 40%–90% enact emotional violence (20). Although its measurement is negatively affected by stereotypes surrounding femininity, gender, and heteronormativity, evidence implies that woman-perpetrated sexual violence might not be a rare occurrence (21, 22). Research also supports that adverse childhood events and maladaptive personality traits and attitudes facilitate woman-perpetrated sexual violence (23–25).
Little is known about the longitudinal patterns and determinants of experienced and enacted violence among college women during COVID-19 pandemic. Measures of socializing (e.g., participation in organized sports, relationship status, perceived social support) have been associated with elevated vulnerability to violence. While the relationship between violence and certain health-risk behaviors is well established, associations with other aspects of health behaviors, including self-efficacy (e.g., condom use, hormonal contraceptive use), remain unclear temporally and in the pandemic context (26–28). The debate continues about the co-incident or causal relationship between pandemic behavior modification (e.g., substance use, changes in sexual behavior as a result of social distancing recommendations) and violence experience or perpetration (29–31). Additionally, the immediate and long-term consequences of violence, particularly at the formative stage of late adolescence and young adulthood, need to be elucidated.
Thus, we estimated the prevalence and social, psychological, and behavioral correlates of experienced and perpetrated physical and verbal violence among college women at successive stages of the COVID-19 pandemic. We hypothesized that during the COVID-19 pandemic, experienced and perpetrated violence would be high, associated with social connectivity, stability and health behaviors, and these associations would be modified over time.
Methods
Study design
From December 2020 to December 2021, this longitudinal cohort study prospectively followed college students, faculty, and staff affiliated with a New York City (NYC) residential college. Study methods have been previously described (13). In brief, emails containing study details and enrollment links were distributed in December 2020-January 2021 (T1) to everyone with an active institutional email address. Eligible participants were (1) enrolled students or employed faculty or staff, (2) at least 18 years old, (3) able to speak and understand English, and (4) able to provide written informed consent. After T1, participants were surveyed quarterly: March-April 2021 (T2), July-August 2021 (T3), and November-December 2021 (T4). This article adheres to the reporting standards established within The Strengthening the Reporting of Observational Studies in Epidemiology (STROBE) Statement (Supplementary Table S1) (32).
Participants
We restricted the analytic sample to students who self-identified as cisgender women and those either in relationships or living with family, friends, roommates, suitemates, or significant others (cohabitating) when the survey was administered.
Data collection
All data were collected by an anonymous, self-administered questionnaire that included sociodemographic, physical status, social, and psychological well-being information. All data were collected and managed using Research Electronic Data Capture (REDCap) (33).
Outcome measures
We explored two outcome measures: experienced violence and perpetrated violence. Topics surrounding violence were explored using questions developed around quarantine in another COVID-19 study and other emergency contexts, such as Hurricane Katrina (34, 35). Violence-related outcomes were asked only of respondents who were cohabiting or in a relationship.
We operationalized experienced violence, the primary outcome, as a partner, spouse, or cohabitating person subjecting the respondent to physical or verbal violence in the past 30 days. Physical violence included being pushed, grabbed, hit, slapped, kicked, or having something thrown at the respondent. Verbal violence involved yelling or saying things that make the other person feel bad, embarrassed, or frightened. The initial Likert response of, “Very Often, “Fairly Often, Sometimes, Almost Never, Never” was dichotomized into ever vs. never experienced violence in the past 30 days. We defined perpetrated violence, the co-primary outcome, as the respondent enacting physical or verbal violence on a partner, spouse, or cohabitating person in the past 30 days as defined above. Similarly, we dichotomized responses as ever vs. never perpetrated violence in the last 30 days. In keeping with other published analyses of violence, we further examined the joint occurrence of experiencing and perpetuating violence (36).
Correlates
Detailed descriptions of all correlates are presented in Supplementary Table S2. Demographic variables included age, ethnicity, race, school year at enrollment, living situation, and financial aid status. Social variables were relationship status, social group involvement, sports group involvement, loneliness, and social support. Substance use variables were tobacco smoking or vaping, alcohol consumption, and frequency of any of the following drugs used in the past 30 days: marijuana, cocaine, painkillers, heroin, sedatives, stimulants, club drugs, hallucinogens, or inhalants. Sexual behavior variables were recent sexual activity, condom use, and change in sexual behavior due to COVID-19. We also examined self-care/care-seeking behaviors based on COVID-19 symptoms and hormonal contraception use. The sociodemographic correlates phrasing and response items were aligned with NIH reporting guidelines. Sexual and drug use behavior correlates were drawn from standardized questions from the National Institute on Drug Abuse (NIDA). At the time of questionnaire development, there were limitations regarding availability of scales that were applicable and/or validated for use in the pandemic context.
Statistical methods
We described the sample using proportions for categorical variables and medians and interquartile ranges (IQR) for continuous variables.
Because pandemic countermeasures, mortality/morbidity rates, and interventions varied greatly over the cohort's observation period, we performed serial cross-sectional analyses of each quarterly survey rather than analyzing repeated measures. We conducted unadjusted and adjusted logistic regression analyses to estimate correlates of experienced and perpetrated violence, including correlates with a X2 p-values ≤0.05 for parameters in the adjusted model.
To estimate the average change in violence outcomes over time, we conducted a generalized estimating equations models (GEE) with an autoregressive correlation matrix and using the baseline values of the independent variables, carried forward. Only those with non-missing outcome data across all timepoints were included in the GEE models.
We performed all data management, transformation, and analysis in R (v.4.3.2).
Results
Sample characteristics
Of the 666 respondents that completed the T1 survey, 513 comprised the analytic sample after removing respondents who were faculty [n = 35], staff [n = 69)]), identified as transgender (n = 22), not living with others and not in a relationship (n = 22), or missing outcome data (n = 5). For the GEE analyses, 120 students had complete outcome data across quarters.
Table 1 shows the characteristics of the study sample at T1. The median age of participants was 20 (IQR: 19–21). Participants were predominantly White-identifying (62%) non-Hispanic (86%) students not on financial aid (57%), with even distribution across school years. Majority were single (70.6%) and living with others (58% with family, 40% with peers). Social group involvement was high (62%), while sports involvement was rare (14%). Loneliness (62%) and social support networks (74%) were common, whereas smoking (7%), alcohol consumption (31%), drug use (20%), hormonal contraception use (36%), and recent sexual activity (38%) were rare. Among those recently sexually active (n = 193), approximately half used condoms (52%, 101/193), and most reported that COVID-19 affected their sexual activities in some way (99%, 191/193). Of those who had ever experienced COVID-19 symptoms (n = 111), approximately half sought care from medical professionals (52%) and about one-third isolated but did not seek care (32%).
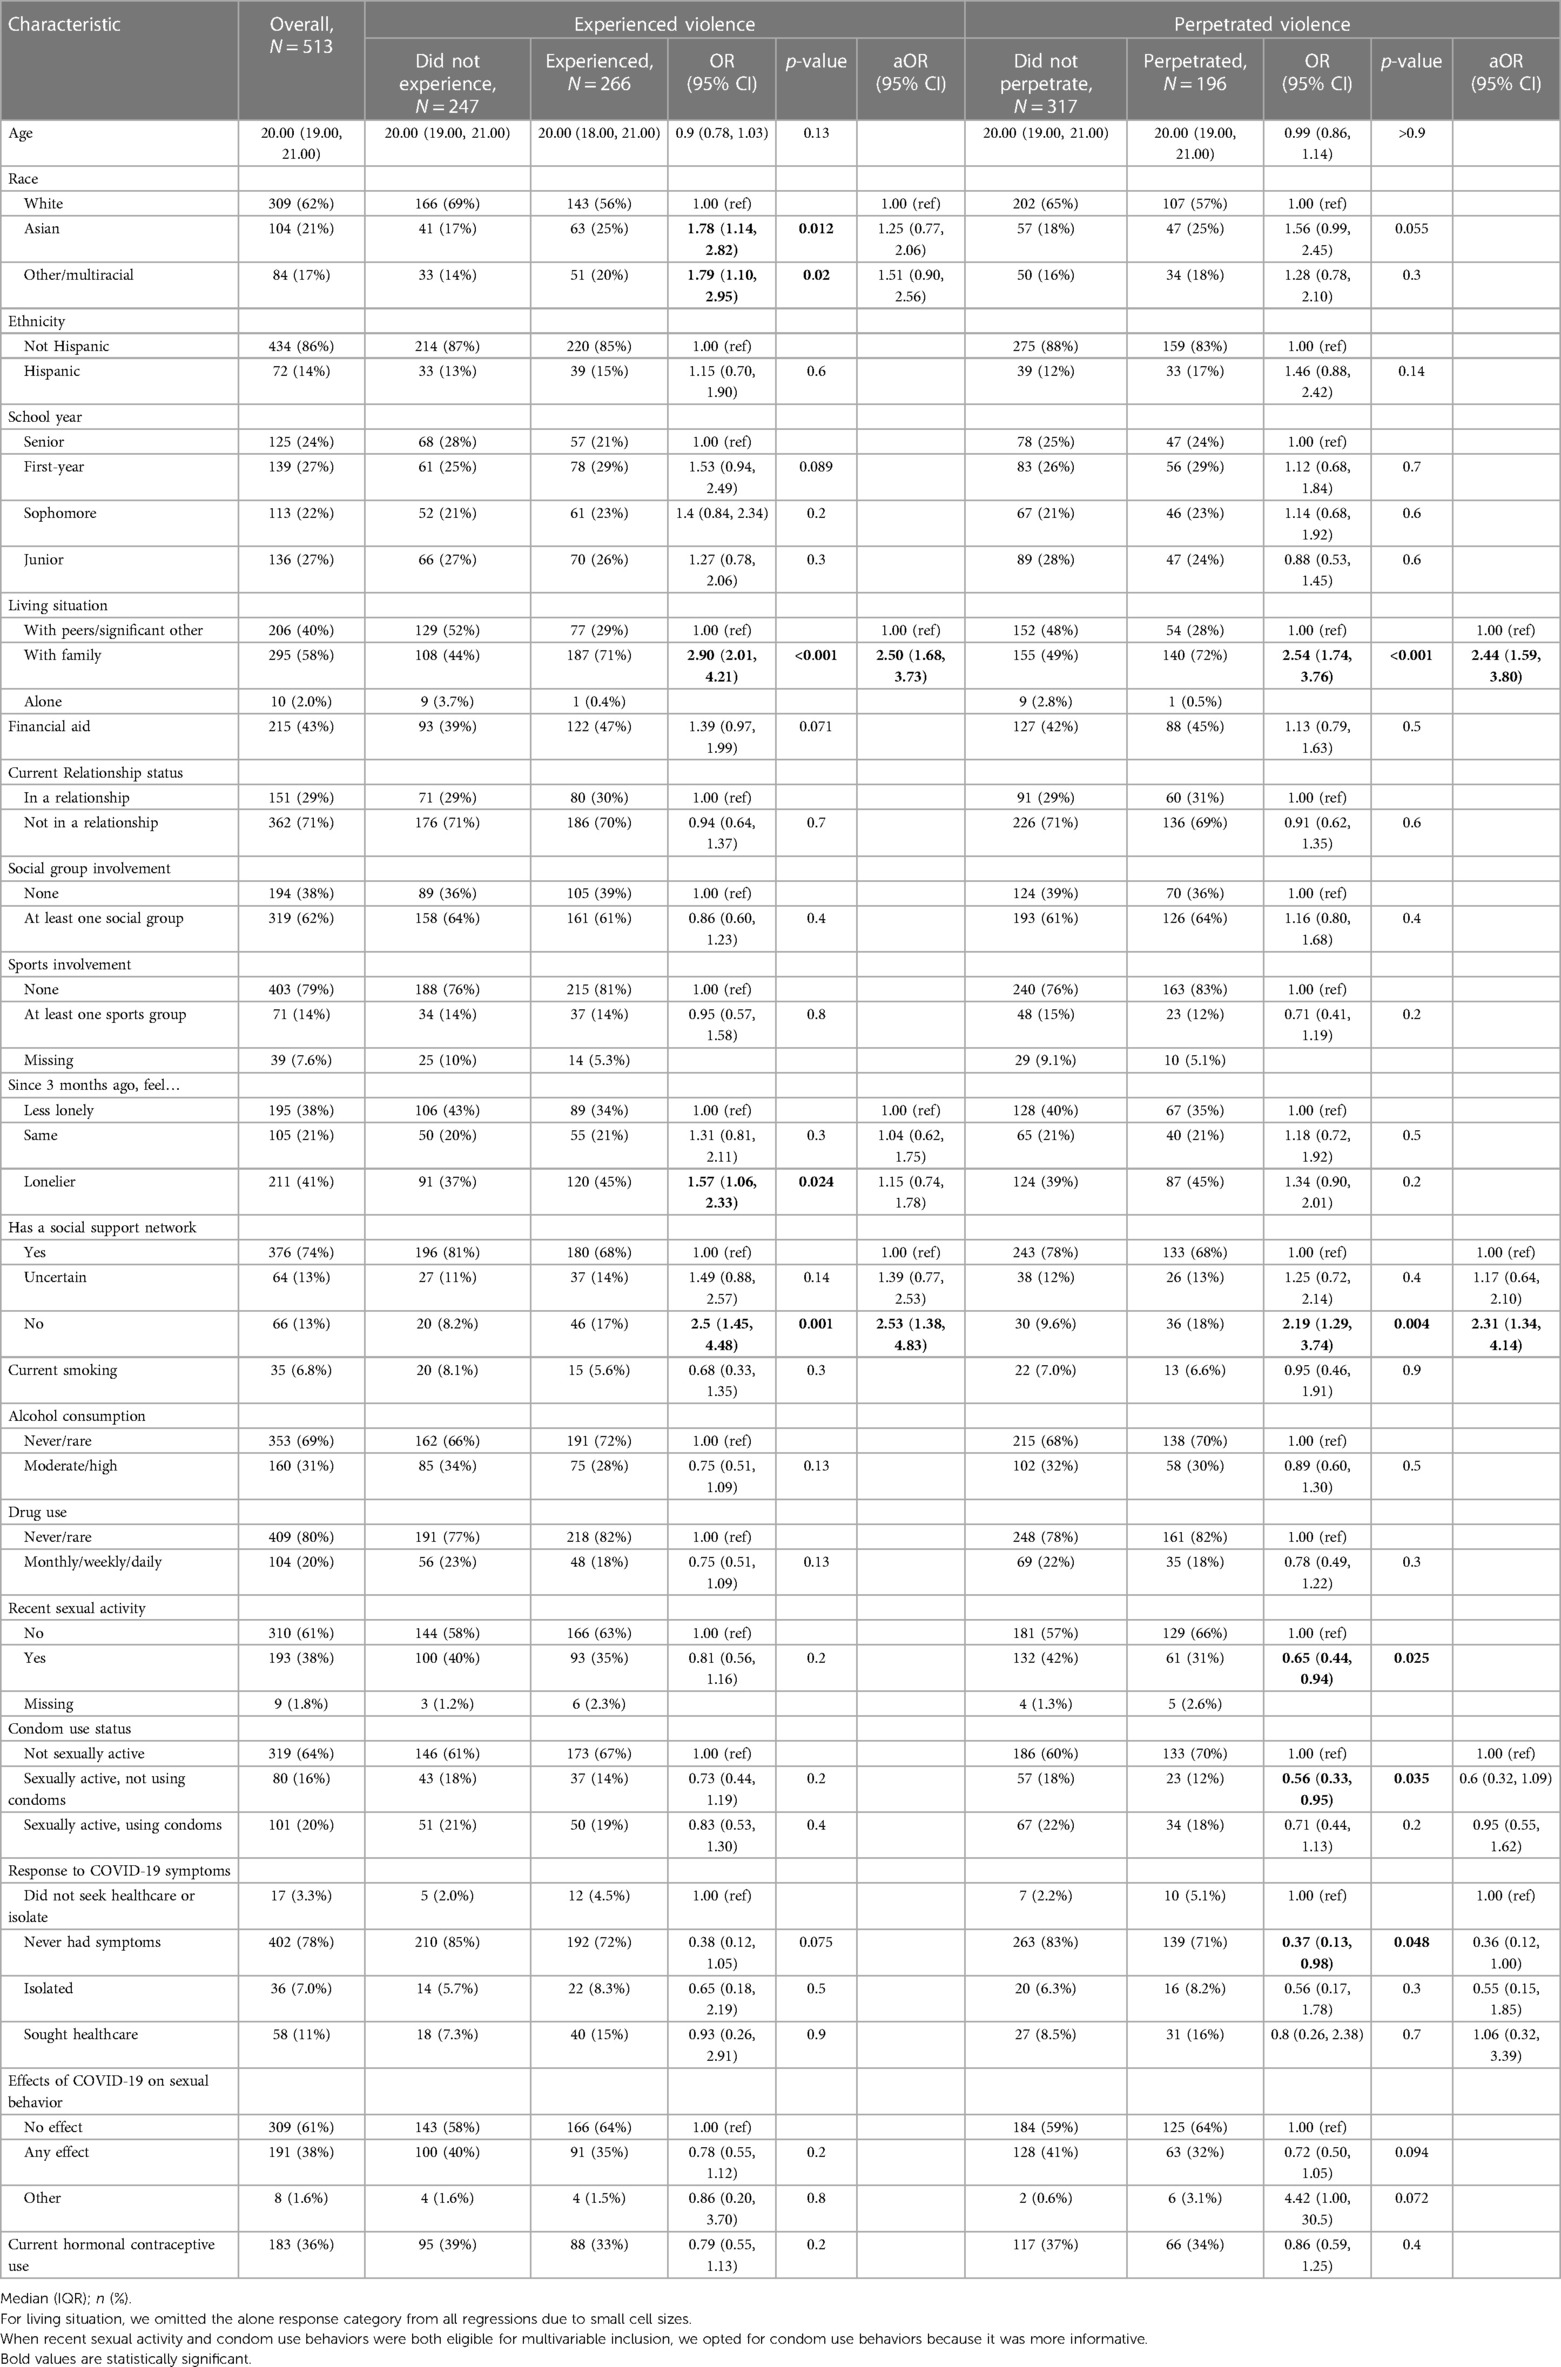
Table 1 Sample characteristics and experience and perpetration of violence at T1 (December 2020–January 2021).
Adjusted correlates of experienced and perpetrated violence
T1
Table 1 also contains the descriptive, unadjusted, and adjusted analyses of experienced and perpetrated violence at T1. Overall, 52% (266/513) of respondents experienced violence [89% verbal, 10% poly-victimization (verbal & physical), 1% physical] (Figure 1). In the adjusted model, living with family vs. peers/significant others [aOR=2.50 (1.68–3.73)] and lack of social support [aOR = 2.53 (1.38–4.83)] were associated with experienced violence.
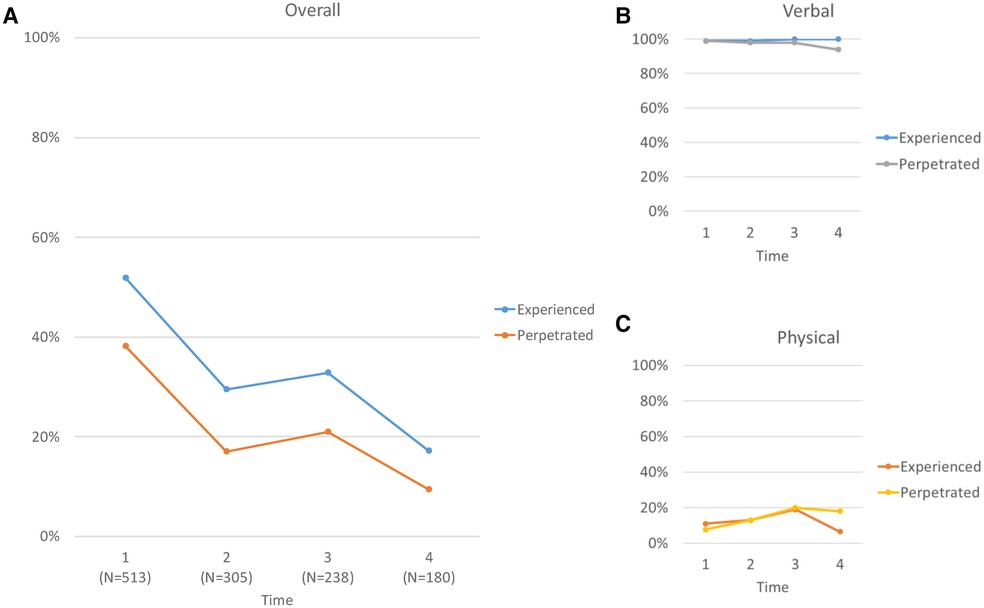
Figure 1 Experience and perpetration of violence over time. Panel A shows the joint experience of verbal and physical violence (blue) and the joint perpetration of verbal and physical violence (orange). Panel B shows the experience (blue) and perpetration (gray) of verbal violence. Panel C shows the experience (orange) and perpetration (yellow) of physical violence.
Comparatively, 38% (196/513) reported perpetrating violence (92% verbal, 7% poly-perpetration, 1% physical). After adjustment, living with family vs. peers/significant others [aOR = 2.44 (1.59, 3.80)] and lack of social support [aOR = 2.31 (1.34, 4.14)] were associated with increased perpetration.
T2
Table 2 highlights experienced and perpetrated violence during the second survey. Overall, 30% (90/305) reported experiencing violence (87% verbal, 12% poly-victimization, 1% physical). Respondents living with family vs. peers/significant others [aOR = 4.95 (2.74–9.10)] and those not feeling strong social support (uncertain support: aOR = 2.47 [1.21–5.01]; no support: aOR = 2.75 [1.20–6.28]) had a higher odds of experiencing violence.

Table 2 Sample characteristics and experience and perpetration of violence at T2 (March-April 2021).
Approximately 17% of respondents reported perpetrating violence (87% verbal, 12% poly-perpetration, 2% physical). After statistical adjustment, living with family vs. peers/significant others was the only variable associated with perpetrating violence [aOR = 3.71 (1.81–7.58)].
T3
Table 3 presents experienced and perpetrated violence at T3. Approximately 1 in 3 respondents experienced violence (81% verbal, 19% poly-victimization). Other/Multiracial identity [aOR = 6.01 (2.31–16.40)], living with family vs. peers/significant others [aOR = 4.77 (2.24–10.9)], and uncertain [aOR = 3.39 (1.33, 8.87)] or no [aOR = 5.23 (1.53–18.8)] social support were associated with higher odds of experienced violence.
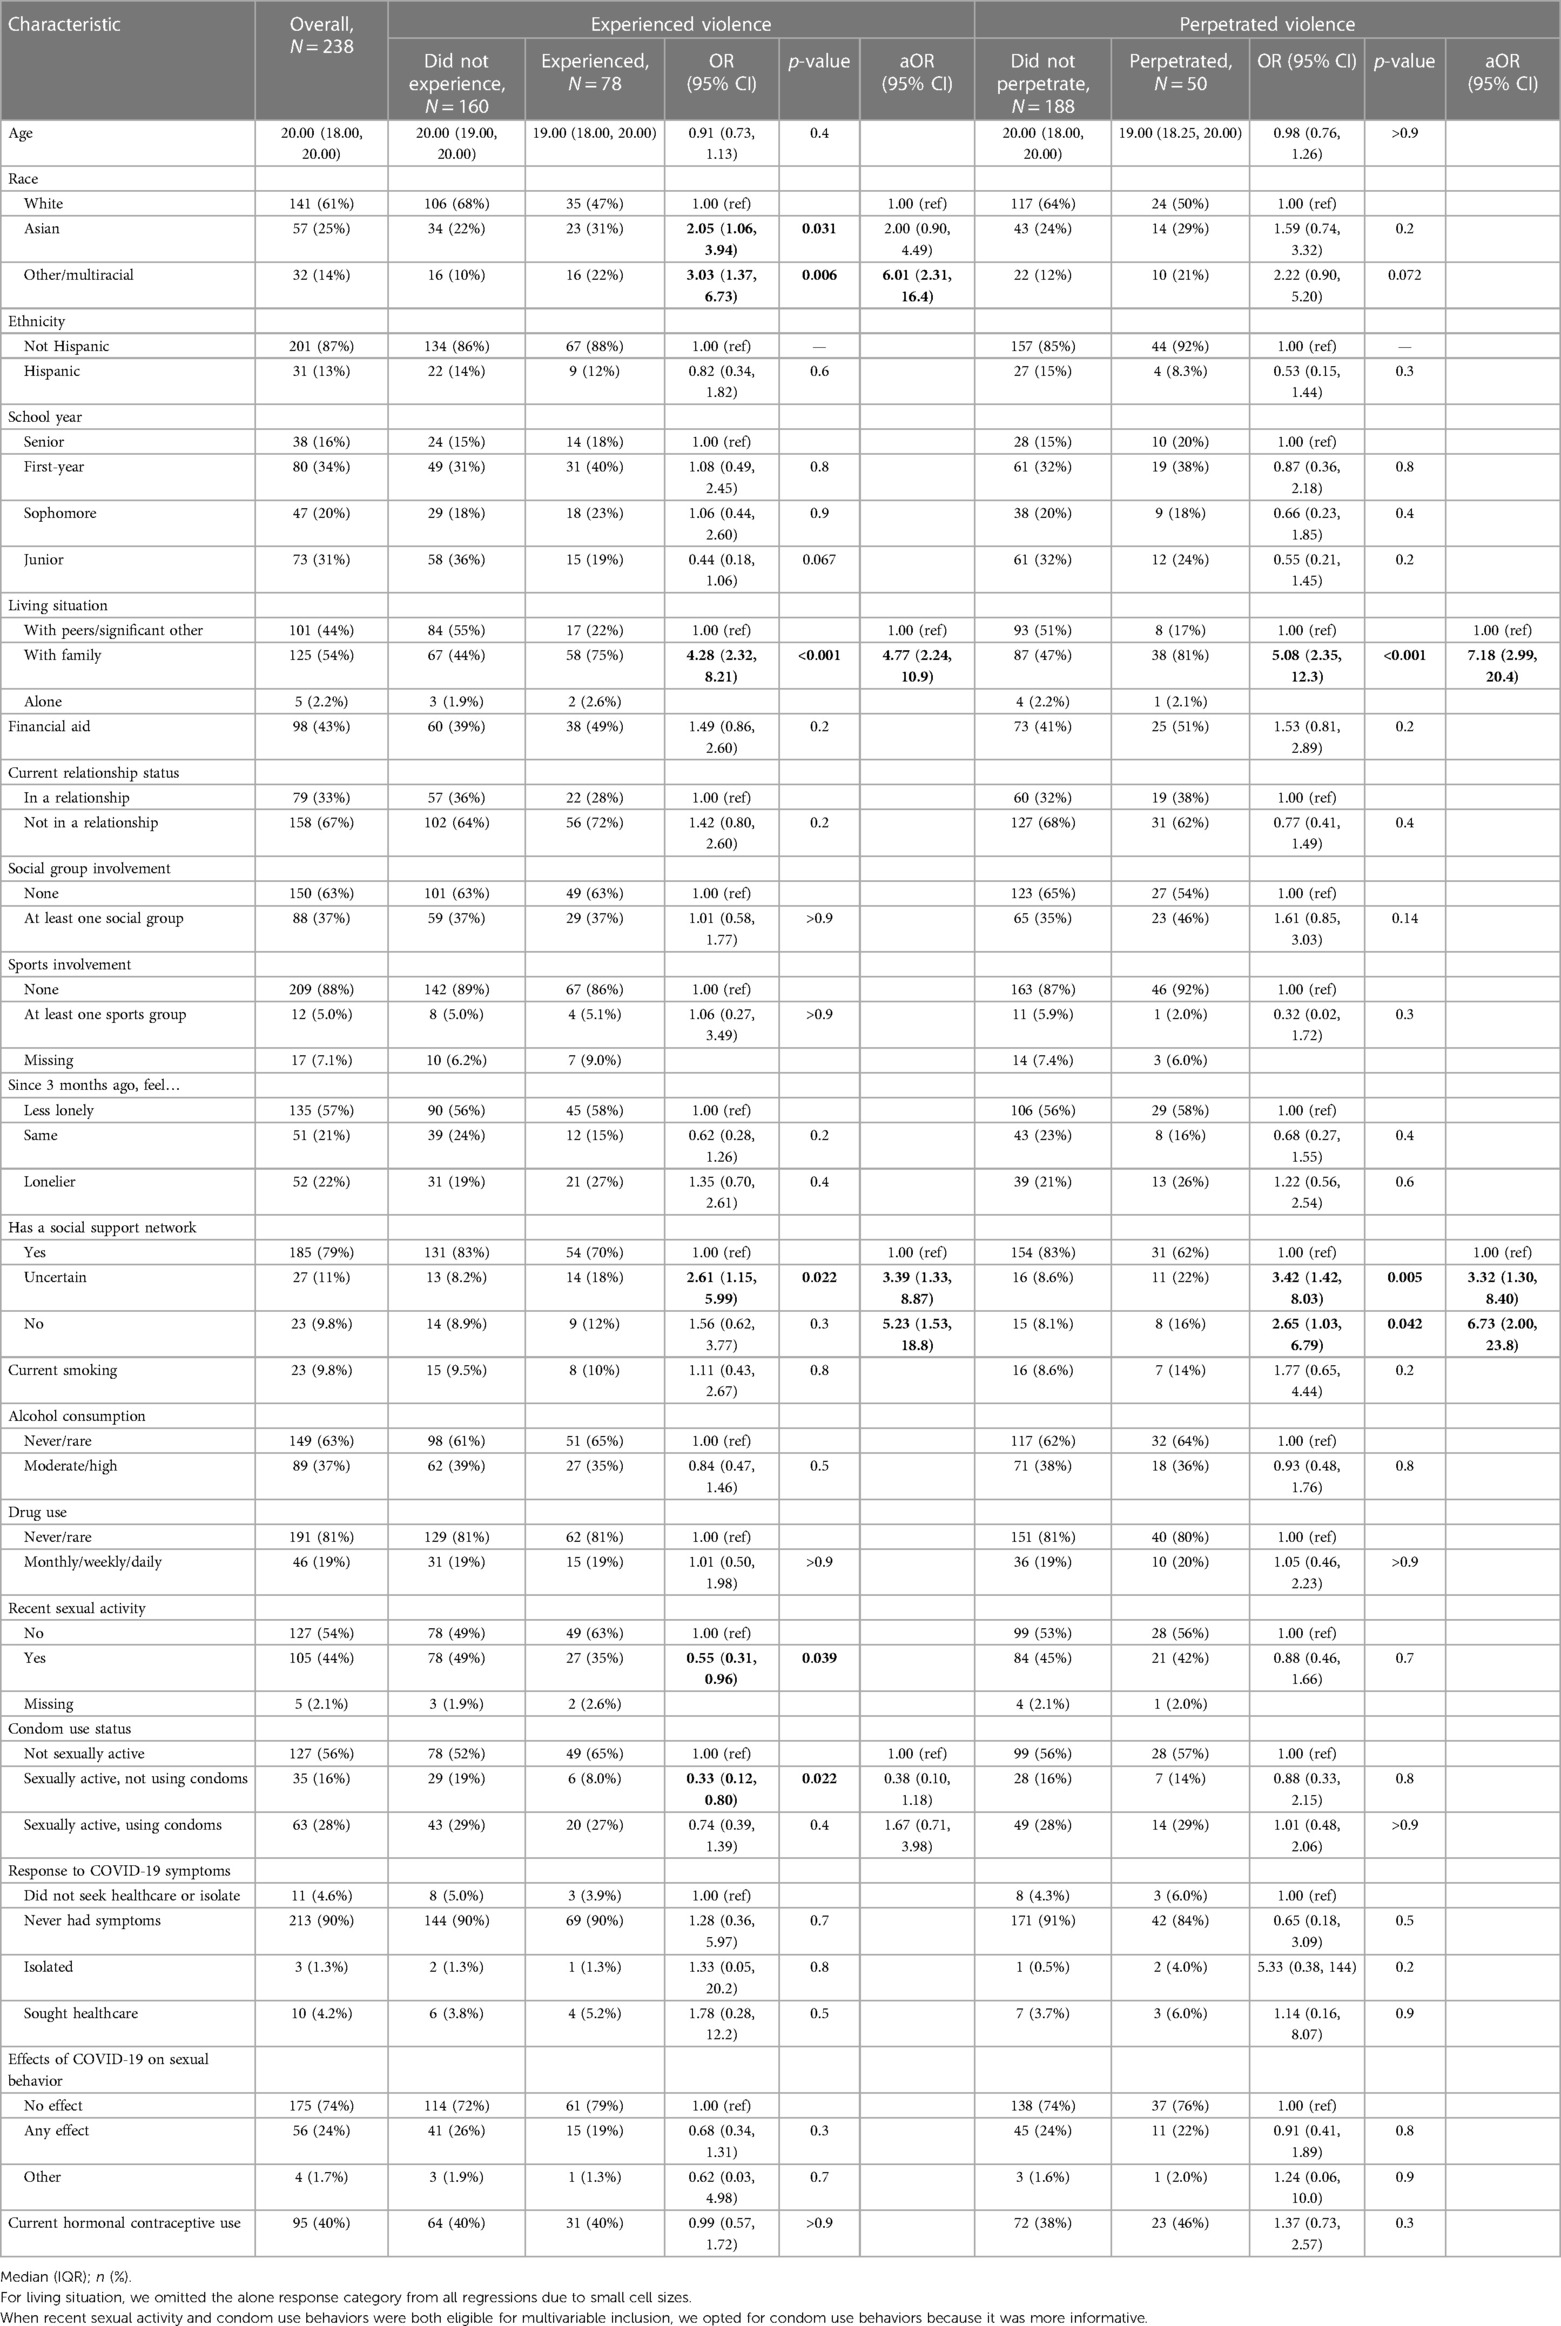
Table 3 Sample characteristics and experience and perpetration of violence at T3 (July–August 2021).
Around 1 in 5 students perpetrated physical violence (80% verbal, 18% poly-perpetration, 2% physical). Reports of perpetrated violence were associated with living with family vs. peers/significant others [aOR = 7.18 (2.99–20.4)] and lacking social support (uncertain support: aOR = 3.32 [1.30–8.40]; no support: aOR = 6.73 [2.00–23.8]).
T4
Table 4 shows descriptive, unadjusted and adjusted associations at T4. Overall, 17% reported experiencing violence (94% verbal, 6% poly-victimization) and 9% reported perpetrating violence (82% verbal, 12% poly-perpetration, 6% physical). Ultimately, no factors were associated with violence experience.
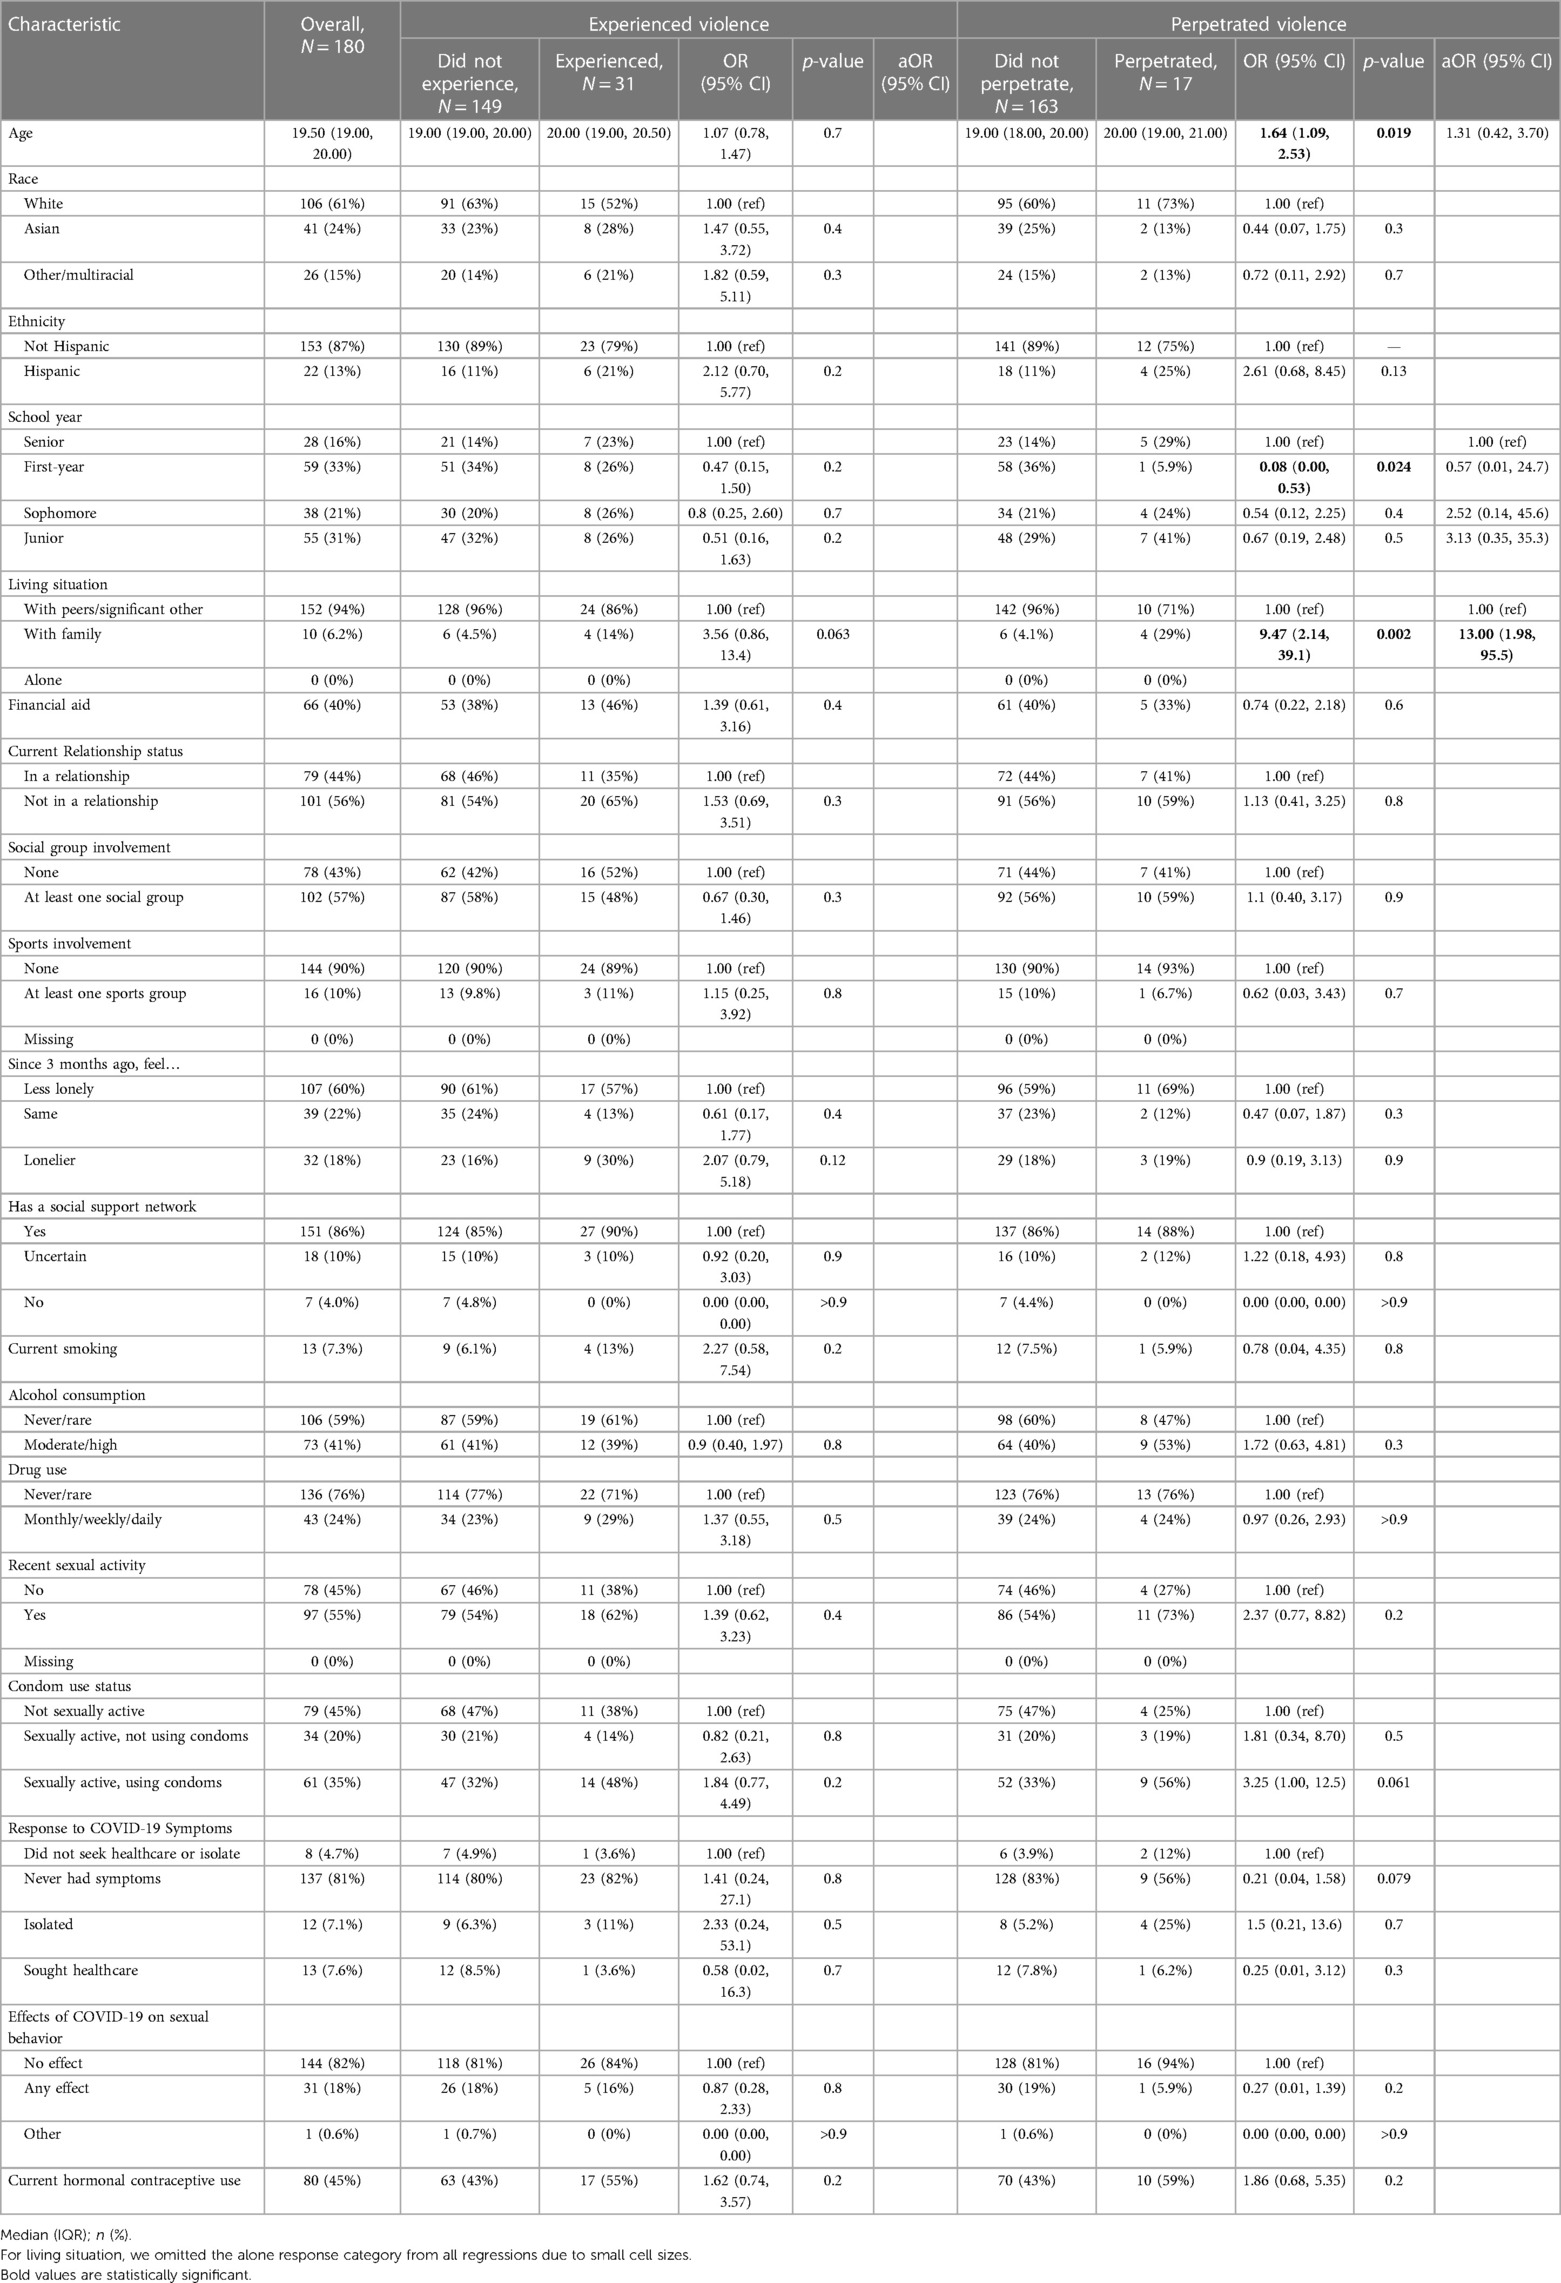
Table 4 Sample characteristics and experience and perpetration of violence at T4 (November-December 2021).
For violence perpetration, living with family was associated with increased reports of violence perpetration [aOR = 13.00 (1.98–95.5)].
Longitudinal trends in experienced and perpetrated violence: GEE of population average
The GEE sub-sample (N = 120) displayed similar outcome trends as the overall sample (Supplementary Table S3). Table 5 shows the unadjusted and adjusted associations estimated by the GEE model. Other/Multiracial identity [aOR = 2.33 (1.25–4.33), ref: White], living with family [aOR = 3.62 (2.24–5.83)], loneliness [aOR = 2.36 (1.36–4.12)], and condom use [aOR = 2.07 (1.20–3.57)] were associated with higher levels of experienced violence over time.
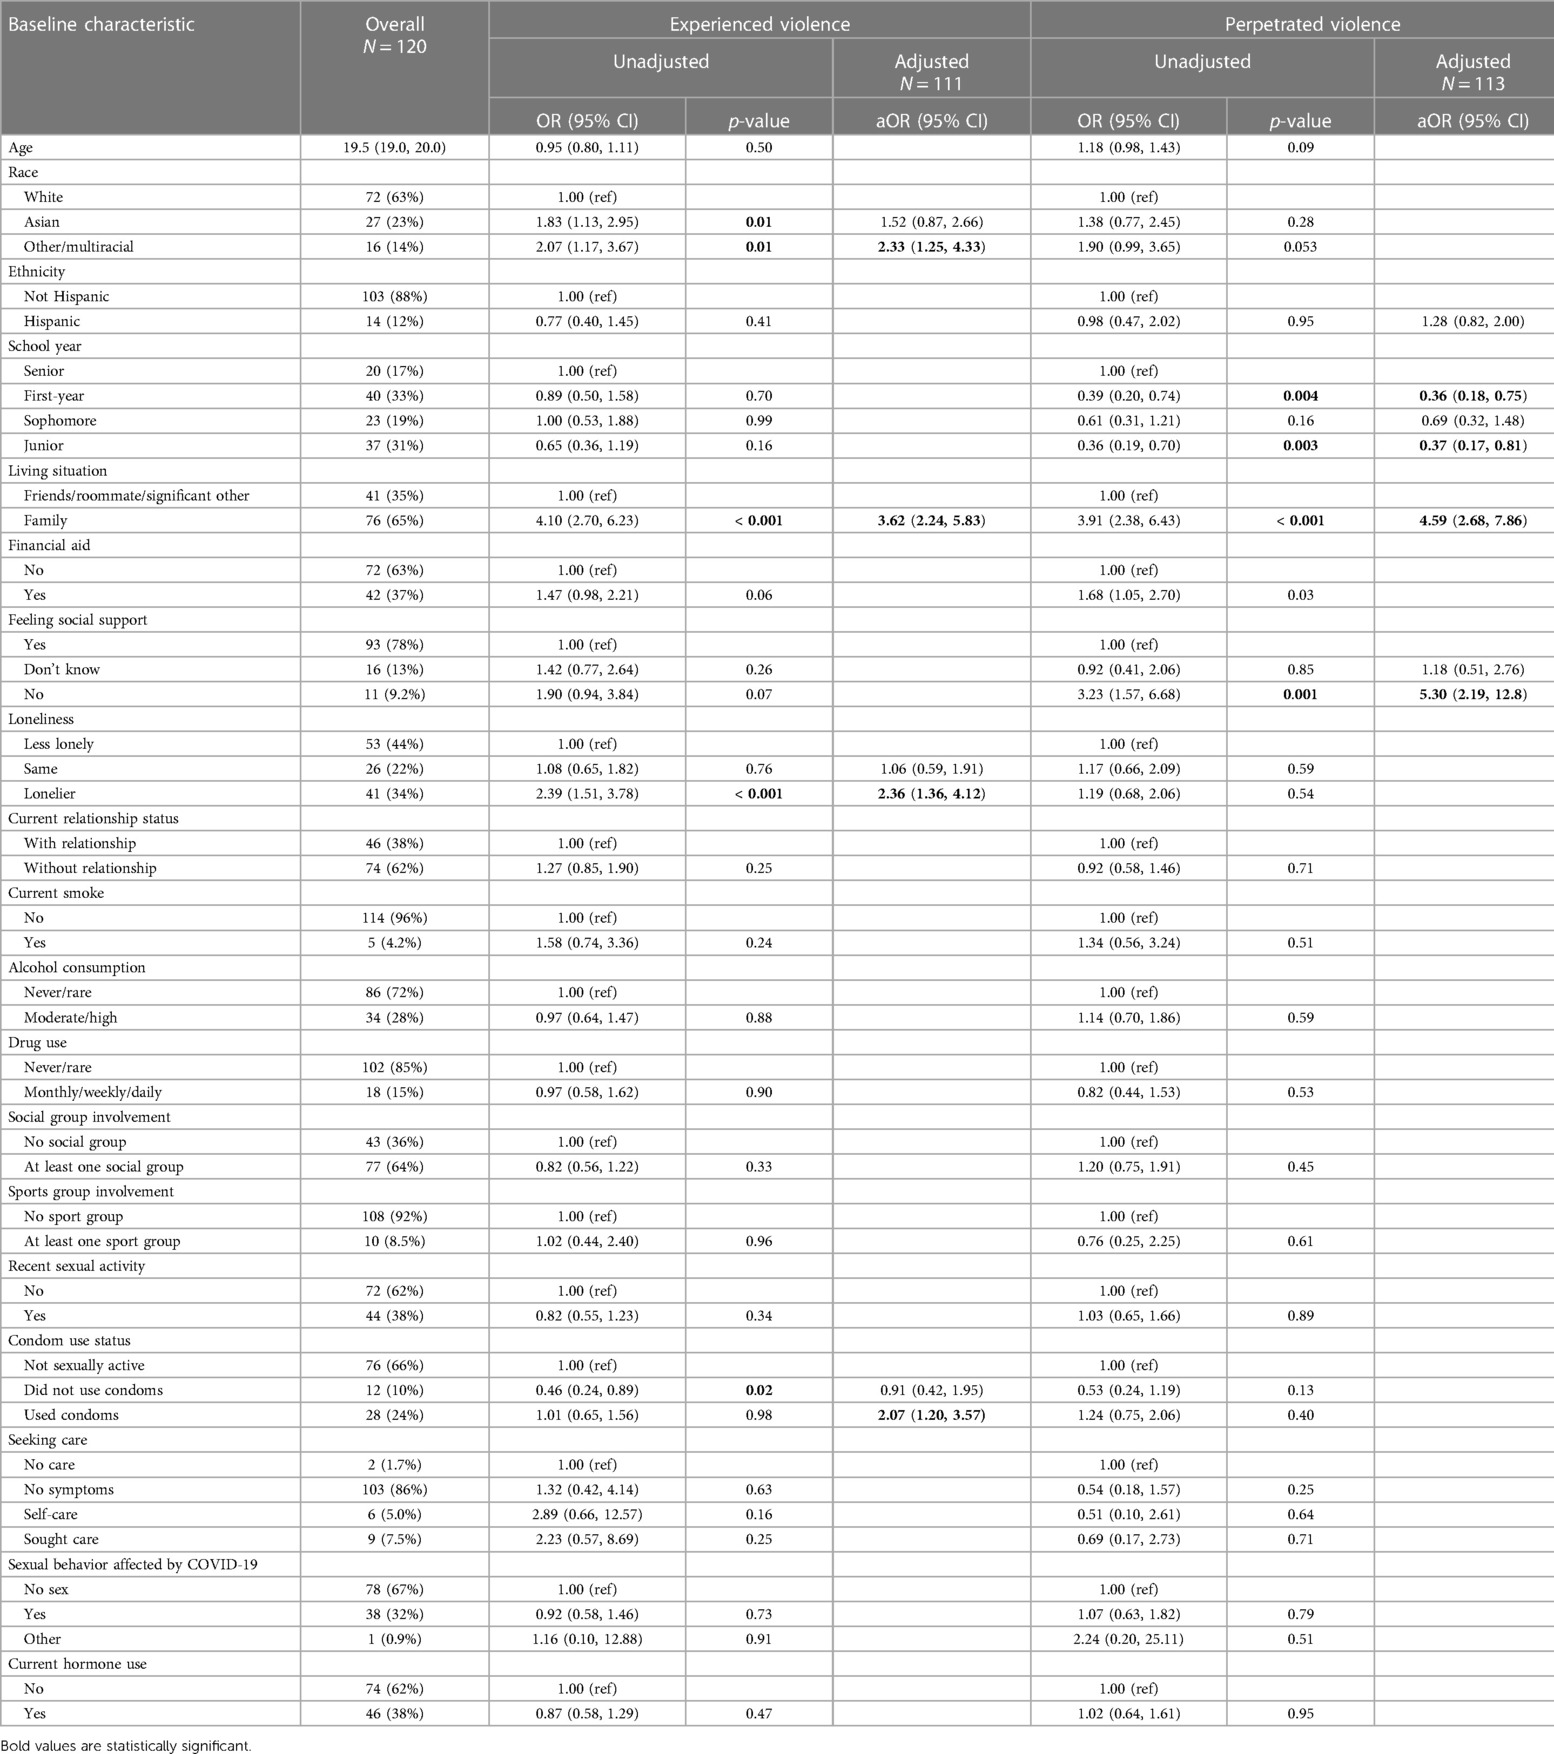
Table 5 Unadjusted and adjusted associations of baseline characteristics and experienced and perpetrated violence using generalized estimating equations (GEE).
Living with family [aOR = 4.59 (2.68–7.86)] and no social support [aOR = 5.30 (2.19–12.80)] were associated with higher levels of perpetrated violence over time, while school year (First year: aOR = 0.36 [0.18–0.75], Junior: aOR = 0.37 [0.17–0.81], ref: Senior) was associated with lower levels of perpetrated violence.
Discussion
In this sample of college women, self-reported experience of violence was high, and the majority of reported violence was verbal. About one-half of respondents experienced verbal/physical violence, and two-fifths of respondents perpetrated verbal/physical violence. Aside from a slight increase at T3, these outcomes decreased over time. Living with family compared with peers/significant others consistently increased odds of experienced (T1-T3) and perpetrated (T1-T4) violence. Low perceived social support also increased odds of violence experienced (T1-T3) and perpetrated (T1, T3) at most time points. Other/Multiracial identity was associated with higher odds of violence experience at T3. We observed proportions up to four times larger than levels estimated from a national survey of college students conducted during the same time. In the national survey, approximately 12% of female respondents experienced verbal violence from partners and non-partners (16–18, 37, 38).
The geographic location of our sample might contribute to this difference. NYC and its metro area were largely considered the epicenter of the early COVID-19 epidemic in America, characterized by the country's highest population density and early case detection and mortality rate. As a result, intensified pandemic-related stress and prolonged shelter-in-place directives may have influenced verbal violence perpetration and experience, respectively.
Data from a national survey of college students found verbal violence experience from all sources was relatively stable during the early pandemic and comparable to pre-pandemic levels (15–18). Conversely, among our study population, violence decreased over the study period, alongside relaxing of shelter-in-place and social distancing protocols, returning to in-person learning, and expanding eligibility and deployment of COVID-19 vaccines. This downward trend likely also reflects increased availability of access by violence victims/perpetrators to the suite of comprehensive support services offered by the host college, spanning the full-spectrum of medical care, psychosocial health care, and wrap-around coordination services. Our survey did not measure uptake of these services; thus, future examinations should consider exploring the potential effect of institutional services and resources on violence outcomes. The slight increase in violence at T3 corresponded with a mild uptick in NYC COVID-19 cases and summer vacation, possibly coinciding with changes in living situation, academic structure, and supportive social outlets, such as sports or arts groups. Of note, though we detected a downtrend trend in violence over the study period, even at the final timepoint, we still observed violence experiences that were five percentage points higher than national estimates (18).
The preponderance of experienced and perpetrated violence was verbal. Although not always viewed or perceived as abuse (39, 40), verbal violence can negatively affect health, psychosocial wellbeing, and development across the life course. A recent systematic review showed that college students' experience of verbal abuse can lead to emotional problems and coping issues, depression and poor mental wellbeing, increased alcohol use, and neurological vulnerabilities. Importantly, these experiences can outwardly manifest as cognitive desensitization, maladaptive beliefs regarding conflict, and increased perpetration and victimization of abuse and violence (41). Verbal violence from partners, peers, and/or adults can negatively affect academic achievement, self-esteem, reproductive decision-making, and sociability (42–45); it can also precede and/or co-occur with physical or sexual violence (42, 46, 47).
Although not commonly reported, we observed that physical violence among experiencers and perpetrators nearly doubled and tripled, respectively, between T1 and T3. A prior meta-analysis found connections between an increased propensity of woman-perpetrated physical aggression among those reporting interpersonal traumatic events and symptoms of post-traumatic stress disorder (PTSD) (48). It is possible that pandemic-induced PTSD symptoms manifested in our participants as time progressed and, subsequently, contributed to the perpetration of physical violence (49). The linear, concurrent increase in physical violence experience and perpetration between T1 and T3 also suggests some form of bidirectionality between perpetration and experienced. Also, unlike verbal violence, which consistently had lower perpetration than experience, physical violence perpetration exceeded experience after T2. These observations are interesting because pre-pandemic research among women survivors of IPV has shown that violence experience begets perpetration; independent perpetration (i.e., not in response to experiencing violence) was extremely rare (50). The dynamics of violence perpetration by women outside of intimate partner settings may differ; given the paucity of research, additional investigation of woman-perpetrated violence is needed to understand this phenomenon better.
We hypothesized that social connectivity would be associated with violence perpetration and experience, and we found living situation was consistently associated with violence; living with peers/significant others compared to living with family was associated with reduced violence experiences (T1-T3, GEE) and perpetration (T1-T4, GEE). Interruptions in in-person learning and varying availability of on-campus housing because of isolation requirements likely affected decision-making around choice of residence during successive waves of the pandemic. Higher financial, food and health insecurity as a result of the pandemic and associated lockdown policies may have contributed to increased household stress, which in turn may have impacted the likelihood of experiencing or perpetrating violence (51, 52). It is unclear from our findings whether violence was perpetrated by/enacted on family members themselves, whether there were non-familial members of the household engaged in violence, or whether the residential dynamics led students to have extra-residential relationships that were more likely to contain violence (although the latter is less likely give that relationship status on its own was not linked with violence). Regardless, our findings highlight that students living with family are particularly vulnerable to violence and merit intensified in-person and/or remote outreach and support services for harm mitigation. Flexible housing services, such as enabling early return to campus and/or staying on campus over breaks, may also help decrease violence experience and/or perpetration.
In our study, perceived lack of social support was strongly associated with experience and perpetration of violence at selected timepoints and in the GEE model. Our findings complement previous research, which has found that greater social support and housing services were associated with lower experience of abuse among domestic violence survivors during the pandemic (53). Social support may help reduce violence experiences by offering individuals a safe space to retreat to when disagreements are escalating; relatedly, supportive peers may help deescalate and/or regulate emotions before they manifest as enacted verbal/physical violence. Social support interventions have had notable success in increasing social networks and minimizing negative mental health outcomes among violence survivors (54). Given the modifiability of social support, colleges should make increased efforts to foster community and create social cohesion, which can attenuate violence among student populations (45).
At T3 and in the GEE model, racial identity was linked with violence; students identifying as Other/Multiracial had significantly higher violence experience than White-identifying students. Before the pandemic, non-White race has been identified as a variable associated with an increased risk of IPV (39). Other authors have highlighted the unequal experience of violence by women from racial and ethnic minority backgrounds during the pandemic (55–57). The social and economic ramifications of pandemic disruptions had an outsized impact on people who already faced marginalization (55–57). Notably, T3 was the first data collection period that did not coincide with the disbursement of COVID-19 stimulus checks, as the second and final checks were distributed at the beginning of T1 and T2 (58). Excluding New York (59), several states also ended pandemic employment benefits in June 2021 (60). Since financially marginalized populations, including non-dependent college students, benefitted considerably from this governmental support (61), financial strain and worry caused by the lack of checks during this survey period might have created a household milieu that facilitated verbal and/or physical violence (62, 63). Given the student body makeup of the host college, there is also a possibility that some of these students were international students, who were unable to travel home due to travel restrictions (64, 65). Since most domestic students likely left campus/NYC at T3 for summer break, isolation from peers, friends, and family abroad could have raised tensions among international students. Given their unique circumstances, greater insight into the experiences of international students during COVID-19 is needed.
In our study, moderate/high alcohol consumption was not associated with violence. Alcohol consumption and substance use were noticeably low among our cohort, which could suggest either that social desirability bias affected reported responses or that the study population differed in behavior compared with other college-aged populations (66). This finding may also suggest that the high levels of violence experience and perpetration observed in our sample are not meaningfully attributable to alcohol use, either as a coping mechanism for experience or an antecedent for perpetration. However, predictive longitudinal analyses would better illuminate the temporality of these relationships and assess if our findings are null due to contemporaneous measurements.
At T3, students who were sexually active and not using condoms had lower violence experience compared to those who were not sexually active. It is possible that here, lack of condom use signified trust and stability in relationships. Findings from the GEE models support this notion, as condom use—potentially indicating relational instability—and violence experience were positively associated.
There are several limitations to our study. First, since the violence questions were framed around partners or people living in the same domicile, we cannot discern the type of individuals involved in these violence experiences/perpetrations. Future research should try to distinguish between the different types of violence (e.g., intimate partner violence, familial violence, etc.) Second, the last follow-up survey period was in November-December 2021, and we could not assess the correlates of violence experience and perpetration as pandemic experiences slowly became normalized. Third, the analysis relied on self-reported data, which might have introduced recall or social desirability bias. Fourth, since we enrolled participants at a NYC college, generalizability may be limited. Fifth, we cannot establish temporality between the outcomes and correlates given our cross-sectional analyses; however, the longitudinal design enables us to identify temporally persistent and/or unique associations. Sixth, we did not measure exposure to or uptake of specific college-provided services that may have influenced violence prevention, post-care, or perpetration, suggesting there could be some level of unmeasured confounding affecting our analyses. Seventh, we analyzed physical and verbal violence in combination, and we did not measure sexual violence; future research should explore these individually using a larger sample size. Finally, small cell sizes for select variables may have introduced bias and/or affected model convergence.
Conclusions
Violence against women is a persistent global public health crisis that worsened during COVID-19, owing to pandemic countermeasures and increases in stressors worldwide. Historically, college women have been particularly vulnerable to violence, warranting investigation of their experiences during COVID-19. In our sample, violence experience was remarkably high, with verbal violence representing the majority of violence experienced and perpetrated. Living situation and level of social support emerged as important correlates. Understanding modifiable correlates of violence can guide the delivery of interventions to key populations to help mitigate social, relational, and behavioral factors that may increase vulnerability to violence in current and future pandemics. As part of pandemic health preparedness, universities should strengthen violence prevention and support systems for young women by developing programming to promote social cohesion; universities should then assess the impact of their programming on reports of violence in their community. In addition to impacting university practices in this manner, our findings can be used to promote development of university policy on violence and to guide directions for future violence research.
Data availability statement
The datasets presented in this article are not readily available because of their sensitive nature. Requests to access the datasets should be directed to Deborah A. Theodore,ZGF0MjEzMkBjdW1jLmNvbHVtYmlhLmVkdQ==.
Ethics statement
The studies involving humans were approved by Columbia University's institutional review board (#AAAT3032). The studies were conducted in accordance with the local legislation and institutional requirements. The participants provided their written informed consent to participate in this study.
Author contributions
DAT: Conceptualization, Data curation, Investigation, Methodology, Project administration, Supervision, Validation, Writing – original draft, Writing – review & editing. CJH: Conceptualization, Formal Analysis, Investigation, Methodology, Supervision, Validation, Visualization, Writing – original draft, Writing – review & editing. SH: Formal Analysis, Methodology, Writing – original draft, Writing – review & editing, Validation. YH: Formal Analysis, Methodology, Validation, Writing – original draft, Writing – review & editing. AA: Data curation, Methodology, Supervision, Validation, Writing – original draft, Writing – review & editing. BS: Data curation, Methodology, Validation, Writing – original draft, Writing – review & editing. CY: Methodology, Supervision, Validation, Writing – original draft, Writing – review & editing. SAA-B: Methodology, Supervision, Validation, Writing – original draft, Writing – review & editing. CR: Methodology, Supervision, Validation, Writing – original draft, Writing – review & editing. EA: Methodology, Supervision, Validation, Writing – original draft, Writing – review & editing. JR: Methodology, Supervision, Validation, Writing – original draft, Writing – review & editing. JZ: Methodology, Supervision, Validation, Writing – original draft, Writing – review & editing. MC: Methodology, Supervision, Validation, Writing – original draft, Writing – review & editing, Conceptualization, Data curation, Investigation, Project administration, Resources. DC: Conceptualization, Data curation, Investigation, Methodology, Project administration, Supervision, Validation, Writing – original draft, Writing – review & editing, Resources. MES: Conceptualization, Data curation, Investigation, Methodology, Project administration, Supervision, Validation, Writing – original draft, Writing – review & editing, Resources.
Funding
The author(s) declare financial support was received for the research, authorship, and/or publication of this article.
Research reported in this publication was supported by the National Institute of Allergy and Infectious Diseases of the National Institutes of Health (NIH) under award numbers 5UM1AI069470-14 and COVID-19 supplement to the award (MS, JZ, DT) and K23AI150378 (JZ). The content is solely the responsibility of the authors and does not necessarily represent the official views of the NIH.
Acknowledgments
We are extremely thankful for respondents' participation in this study, as this research would be impossible without their time and effort.
Conflict of interest
The authors declare that the research was conducted in the absence of any commercial or financial relationships that could be construed as a potential conflict of interest.
The author(s) declared that they were an editorial board member of Frontiers, at the time of submission. This had no impact on the peer review process and the final decision.
Publisher's note
All claims expressed in this article are solely those of the authors and do not necessarily represent those of their affiliated organizations, or those of the publisher, the editors and the reviewers. Any product that may be evaluated in this article, or claim that may be made by its manufacturer, is not guaranteed or endorsed by the publisher.
Supplementary material
The Supplementary Material for this article can be found online at: https://www.frontiersin.org/articles/10.3389/frph.2024.1366262/full#supplementary-material
References
2. Smith SG, Zhang X, Basile KC, Merrick MT, Wang J, Kresnow M, et al. The National Intimate Partner and Sexual Violence Survey (Nisvs): 2015 Data Brief – Updated Release. Atlanta, GA: National Center for Injury Prevention and Control, Centers for Disease Control and Prevention (2018).
3. Fogstad H, Langlois EV, Dey T. COVID-19 and violence against women and children: time to mitigate the shadow pandemic. Br Med J. (2021) 375:n2903. doi: 10.1136/bmj.n2903
4. Peraud W, Quintard B, Constant A. Factors associated with violence against women following the COVID-19 lockdown in France: results from a prospective online survey. PLoS One. (2021) 16(9):e0257193. doi: 10.1371/journal.pone.0257193
5. Piquero AR, Jennings WG, Jemison E, Kaukinen C, Knaul FM. Domestic violence during the COVID-19 pandemic-evidence from a systematic review and meta-analysis. J Crim Justice. (2021) 74:101806. doi: 10.1016/j.jcrimjus.2021.101806
6. Smith-Clapham AM, Childs JE, Cooley-Strickland M, Hampton-Anderson J, Novacek DM, Pemberton JV, et al. Implications of the COVID-19 pandemic on interpersonal violence within marginalized communities: toward a new prevention paradigm. Am J Public Health. (2023) 113(S2):S149–S56. doi: 10.2105/AJPH.2023.307289
7. Sánchez OR, Vale DB, Rodrigues L, Surita FG. Violence against women during the COVID-19 pandemic: an integrative review. Int J Gynaecol Obstet. (2020) 151(2):180–7. doi: 10.1002/ijgo.13365
8. McNeil A, Hicks L, Yalcinoz-Ucan B, Browne DT. Prevalence & correlates of intimate partner violence during COVID-19: a rapid review. J Fam Violence. (2023) 38(2):241–61. doi: 10.1007/s10896-022-00386-6
9. Iob E, Steptoe A, Fancourt D. Abuse, self-harm and suicidal ideation in the UK during the COVID-19 pandemic. Br J Psychiatry. (2020) 217(4):543–6. doi: 10.1192/bjp.2020.130
10. Davis M, Gilbar O, Padilla-Medina DM. Intimate partner violence victimization and perpetration among U.S. adults during the earliest stage of the COVID-19 pandemic. Violence Vict. (2021) 36(5):583–603. doi: 10.1891/vv-d-21-00005
11. Mittal S, Singh T. Gender-Based violence during COVID-19 pandemic: a mini-review. Front Global Women’s Health. (2020) 1. doi: 10.3389/fgwh.2020.00004
12. Oswald DL, Kaugars AS, Tait M. American women’s experiences with intimate partner violence during the start of the COVID-19 pandemic: risk factors and mental health implications. Violence Against Women. (2023) 29(6-7):1419–40. doi: 10.1177/10778012221117597
13. Heck CJ, Theodore DA, Sovic B, Austin E, Yang C, Rotbert J, et al. Correlates of psychological distress among undergraduate women engaged in remote learning through a New York city college during the COVID-19 pandemic. J Am Coll Health. (2023):1–10. doi: 10.1080/07448481.2022.2156797. [Epub ahead of print].36649543
14. Miller TW, Burcham B. Harassment, abuse, and violence on the college campus. In: Miller TW, editor. School Violence and Primary Prevention. New York, NY: Springer Science + Business Media, LLC (2023). p. 331–43.
15. American College Health Association. American College Health Association-National College Health Assessment Ii: Undergraduate Student Reference Group Data Report Fall 2019. Silver Spring, MD: American College Health Association (2020).
16. American College Health Association. American College Health Association-National College Health Assessment Iii: Undergraduate Student Reference Group Data Report Fall 2020. Silver Spring, MD: American College Health Association (2021).
17. American College Health Association. American College Health Association-National College Health Assessment Iii: Undergraduate Student Reference Group Data Report Spring 2021. Silver Spring, MD: American College Health Association (2021).
18. American College Health Association. American College Health Association-National College Health Assessment Iii: Undergraduate Student Reference Group Data Report Fall 2021. Silver Spring, MD: American College Health Association (2022).
19. Karakoc S, Dogan RA. Investigation of the effect of COVID-19 on attitudes of university students towards family violence. Z Gesundh Wiss. (2023):1–9. doi: 10.1007/s10389-023-01856-x. [Epub ahead of print].37361315
20. Williams JR, Ghandour RM, Kub JE. Female perpetration of violence in heterosexual intimate relationships: adolescence through adulthood. Trauma, Violence, & Abuse. (2008) 9(4):227–49. doi: 10.1177/1524838008324418
21. Stemple L, Meyer IH. The sexual victimization of men in America: new data challenge old assumptions. Am J Public Health. (2014) 104(6):e19–26. doi: 10.2105/AJPH.2014.301946
22. Stemple L, Flores A, Meyer IH. Sexual victimization perpetrated by women: federal data reveal surprising prevalence. Aggress Violent Behav. (2017) 34:302–11. doi: 10.1016/j.avb.2016.09.007
23. Krahé B, Waizenhöfer E, Möller I. Women’s sexual aggression against men: prevalence and predictors. Sex Roles. (2003) 49:219–32. doi: 10.1023/A:1024648106477
24. Russell TD, Doan CM, King AR. Sexually violent women: the pid-5, everyday sadism, and adversarial sexual attitudes predict female sexual aggression and coercion against male victims. Pers Individ Dif. (2017) 111:242–9. doi: 10.1016/j.paid.2017.02.019
25. Schatzel-Murphy EA, Harris DA, Knight RA, Milburn MA. Sexual coercion in men and women: similar behaviors, different predictors. Arch Sex Behav. (2009) 38:974–86. doi: 10.1007/s10508-009-9481-y
26. Breiding MJ, Black MC, Ryan GW. Chronic disease and health risk behaviors associated with intimate partner violence—18 US states/territories, 2005. Ann Epidemiol. (2008) 18(7):538–44. doi: 10.1016/j.annepidem.2008.02.005
27. Coker AL, Smith PH, Fadden MK. Intimate partner violence and disabilities among women attending family practice clinics. J Women’s Health. (2005) 14(9):829–38. doi: 10.1089/jwh.2005.14.829
28. El-Bassel N, Gilbert L, Witte S, Wu E, Gaeta T, Schilling R, et al. Intimate partner violence and substance abuse among minority women receiving care from an inner-city emergency department. Women’s Health Issues. (2003) 13(1):16–22. doi: 10.1016/S1049-3867(02)00142-1
29. McCarthy D, Felix RT, Crowley T. Personal factors influencing female students’ condom use at a higher education institution. Afr J Prim Health Care Fam Med. (2024) 16(1):4337. doi: 10.4102/phcfm.v16i1.4337
30. McCray KL, Evans JO, Lower-Hoppe LM, Brgoch SM, Ryder A. Does athlete status explain sexual violence victimization and perpetration on college campuses? A socio-ecological study. J Interpers Violence. (2023) 38(19–20):11067–90. doi: 10.1177/08862605231178356
31. Bonar EE, DeGue S, Abbey A, Coker AL, Lindquist CH, McCauley HL, et al. Prevention of sexual violence among college students: current challenges and future directions. J Am Coll Health. (2022) 70(2):575–88. doi: 10.1080/07448481.2020.1757681
32. Von Elm E, Altman DG, Egger M, Pocock SJ, Gøtzsche PC, Vandenbroucke JP. The strengthening the reporting of observational studies in epidemiology (strobe) statement: guidelines for reporting observational studies. Lancet. (2007) 370(9596):1453–7. doi: 10.1016/S0140-6736(07)61602-X
33. Harris PA, Taylor R, Minor BL, Elliott V, Fernandez M, O'Neal L, et al. The redcap consortium: building an international community of software platform partners. J Biomed Inform. (2019) 95:103208. doi: 10.1016/j.jbi.2019.103208
34. Schumacher JA, Coffey SF, Norris FH, Tracy M, Clements K, Galea S. Intimate partner violence and Hurricane Katrina: predictors and associated mental health outcomes. Violence Vict. (2010) 25(5):588–603. doi: 10.1891/0886-6708.25.5.588
35. Sun S, Sun X, Wei C, Shi L, Zhang Y, Operario D, et al. Domestic violence victimization among men who have sex with men in China during the COVID-19 lockdown. J Interpers Violence. (2022) 37(23–24):NP22135–50. doi: 10.1177/08862605211072149
36. Eustaquio PC, Olansky E, Lee K, Marcus R, Cha S, National HIV Behavioral Surveillance Among Transgender Women Study Group. Social support and the association between certain forms of violence and harassment and suicidal ideation among transgender women - national HIV behavioral surveillance among transgender women, seven urban areas, United States, 2019–2020. MMWR Suppl. (2024) 73(1):61–70. doi: 10.15585/mmwr.su7301a7
37. American College Health Association. American College Health Association-National College Health Assessment Iii: Undergraduate Student Reference Group Data Report Spring 2022. Silver Spring, MD: American College Health Association (2022).
38. American College Health Association. American College Health Association-National College Health Assessment Iii: Undergraduate Student Reference Group Data Report Fall 2022. Silver Spring, MD: American College Health Association (2023).
39. Walley-Jean JC. “It ain't a fight unless you hit me”: perceptions of intimate partner violence in a sample of African American college women. J Res Women Gender. (2019) 9(1):22–38.
40. Hannem S, Langan D, Stewart C. “Every couple has their fights…”: stigma and subjective narratives of verbal violence. Deviant Behav. (2015) 36(5):388–404. doi: 10.1080/01639625.2014.935688
41. Dube SR, Li ET, Fiorini G, Lin C, Singh N, Khamisa K, et al. Childhood verbal abuse as a child maltreatment subtype: a systematic review of the current evidence. Child Abuse Negl. (2023) 144:106394. doi: 10.1016/j.chiabu.2023.106394
42. Mengo C, Black BM. Violence victimization on a college campus: impact on gpa and school dropout. J Coll Stud Retention Res Theory Pract. (2016) 18(2):234–48. doi: 10.1177/1521025115584750
43. Karni-Vizer N, Walter O. The impact of verbal violence on body investment and self-worth among college students. J Aggress Maltreat Trauma. (2020) 29(3):314–31. doi: 10.1080/10926771.2018.1550831
44. Sutherland MA, Fantasia HC, Fontenot H. Reproductive coercion and partner violence among college women. J Obstetr Gynecol Neonat Nurs. (2015) 44(2):218–27. doi: 10.1111/1552-6909.12550
45. Patterson M, Prochnow T, Nelon J, Spadine M, Brown S, Lanning B. Egocentric network composition and structure relative to violence victimization among a sample of college students. J Am Coll Health. (2022) 70(7):2017–25. doi: 10.1080/07448481.2020.1841777
46. Pugh B, Becker P. Exploring definitions and prevalence of verbal sexual coercion and its relationship to consent to unwanted sex: implications for affirmative consent standards on college campuses. Behav Sci. (2018) 8(8):69. doi: 10.3390/bs8080069
47. Norris AL, Carey KB, Shepardson RL, Carey MP. Sexual revictimization in college women: mediational analyses testing hypothesized mechanisms for sexual coercion and sexual assault. J Interpers Violence. (2021) 36(13–14):6440–65. doi: 10.1177/0886260518817778
48. Augsburger M, Maercker A. Associations between trauma exposure, posttraumatic stress disorder, and aggression perpetrated by women. A meta-analysis. Clin Psychol Sci Pract. (2020) 27(1):e12322. doi: 10.1111/cpsp.12322
49. Chamaa F, Bahmad HF, Darwish B, Kobeissi JM, Hoballah M, Nassif SB, et al. Ptsd in the COVID-19 era. Curr Neuropharmacol. (2021) 19(12):2164. doi: 10.2174/1570159X19666210113152954
50. Holmes SC, Johnson NL, Rojas-Ashe EE, Ceroni TL, Fedele KM, Johnson DM. Prevalence and predictors of bidirectional violence in survivors of intimate partner violence residing at shelters. J Interpers Violence. (2019) 34(16):3492–515. doi: 10.1177/0886260516670183
51. Campbell AM. An increasing risk of family violence during the COVID-19 pandemic: strengthening community collaborations to save lives. Forensic Sci Int Rep. (2020) 2. doi: 10.1016/j.fsir.2020.100089
52. Mazza M, Marano G, Lai C, Janiri L, Sani G. Danger in danger: interpersonal violence during COVID-19 quarantine. Psychiatry Res. (2020) 289. doi: 10.1016/j.psychres.2020.113046
53. Chiaramonte D, Simmons C, Hamdan N, Ayeni OO, López-Zerón G, Farero A, et al. The impact of COVID-19 on the safety, housing stability, and mental health of unstably housed domestic violence survivors. J Community Psychol. (2022) 50(6):2659–81. doi: 10.1002/jcop.22765
54. Ogbe E, Harmon S, Van den Bergh R, Degomme O. A systematic review of intimate partner violence interventions focused on improving social support and/mental health outcomes of survivors. PLoS One. (2020) 15(6):e0235177. doi: 10.1371/journal.pone.0235177
55. Hassoun Ayoub L, Partridge T, Gómez JM. Two sides of the same coin: a mixed methods study of black Mothers’ experiences with violence, stressors, parenting, and coping during the COVID-19 pandemic. J Soc Issues. (2023) 79(2):667–93. doi: 10.1111/josi.12526
56. Ruiz A, Luebke J, Moore K, Vann AD, Gonzalez M Jr, Ochoa-Nordstrum B, et al. The impact of the COVID-19 pandemic on help-seeking behaviours of indigenous and black women experiencing intimate partner violence in the United States. J Adv Nurs. (2023) 79(7):2470–83. doi: 10.1111/jan.15528
57. Wong EY, Schachter A, Collins HN, Song L, Ta ML, Dawadi S, et al. Cross-sector monitoring and evaluation framework: social, economic, and health conditions impacted during the COVID-19 pandemic. Am J Public Health. (2021) 111(S3):S215–S23. doi: 10.2105/AJPH.2021.306422
58. The United States Government. Three Rounds of Stimulus Checks. See How Many Went out and for How Much: Pandemic Response Accountability Committee (2023). Available online at: https://www.pandemicoversight.gov/data-interactive-tools/data-stories/update-three-rounds-stimulus-checks-see-how-many-went-out-and (cited November 22, 2023).
59. New York State Department of Labor. Expiration of Federal Unemployment and Pandemic Benefits (2012). Available online at: https://dol.ny.gov/fedexp (cited November 22, 2023).
60. Gwyn N. Historic unemployment programs provided vital support to workers and the economy during pandemic, offer roadmap for future reform. Center Budget Plann Priorities Washington DC. (2022) 24:2022.
61. Li K, Foutz NZ, Cai Y, Liang Y, Gao S. Impacts of COVID-19 lockdowns and stimulus payments on low-income population’s spending in the United States. PloS One. (2021) 16(9):e0256407. doi: 10.1371/journal.pone.0256407
62. Schwab-Reese LM, Peek-Asa C, Parker E. Associations of financial stressors and physical intimate partner violence perpetration. Inj Epidemiol. (2016) 3:1–10. doi: 10.1186/s40621-015-0066-z
63. Sharma P, Khokhar A. Domestic violence and coping strategies among married adults during lockdown due to coronavirus disease (COVID-19) pandemic in India: a cross-sectional study. Disaster Med Public Health Prep. (2022) 16(5):1873–80. doi: 10.1017/dmp.2021.59
64. United States Department of State. Covid 19 Updates: Bureau of Educational and Cultural Affairs (2021). Available online at: https://eca.state.gov/covid-19-updates (cited November 22, 2023).
65. United States Department of Homeland Security. National Interest Exceptions for Eligible International Students (2021). Available online: https://studyinthestates.dhs.gov/2021/07/national-interest-exceptions-for-eligible-international-students (cited November 22, 2023).
Keywords: adolescent girls and young women, longitudinal analysis, college health, emotional violence, racial disparity
Citation: Theodore DA, Heck CJ, Huang S, Huang Y, Autry A, Sovic B, Yang C, Anderson-Burnett SA, Ray C, Austin E, Rotbert J, Zucker J, Catallozzi M, Castor D and Sobieszczyk ME (2024) Correlates of verbal and physical violence experienced and perpetrated among cisgender college women: serial cross-sections during one year of the COVID-19 pandemic. Front. Reprod. Health 6: 1366262. doi: 10.3389/frph.2024.1366262
Received: 5 January 2024; Accepted: 5 July 2024;
Published: 25 July 2024.
Edited by:
Charikleia Stefanaki, UNESCO Chair in Adolescent Health Care, GreeceReviewed by:
Aymery Constant, École des Hautes Etudes en Santé Publique, FranceSumaita Choudhury, University of Texas Health Science Center at Houston, United States
© 2024 Theodore, Heck, Huang, Huang, Autry, Sovic, Yang, Anderson-Burnett, Ray, Austin, Rotbert, Zucker, Catallozzi, Castor and Sobieszczyk. This is an open-access article distributed under the terms of the Creative Commons Attribution License (CC BY). The use, distribution or reproduction in other forums is permitted, provided the original author(s) and the copyright owner(s) are credited and that the original publication in this journal is cited, in accordance with accepted academic practice. No use, distribution or reproduction is permitted which does not comply with these terms.
*Correspondence: Deborah A. Theodore, ZGF0MjEzMkBjdW1jLmNvbHVtYmlhLmVkdQ==
†These authors have contributed equally to this work
‡These authors share first authorship