 Despina Giannadaki
 Christina Oikonomou1
- 1Cloudwater Ltd, Nicosia, Cyprus
- 2Frederick Research Center, Nicosia, Cyprus
- 3School of Engineering, Frederick University, Nicosia, Cyprus
The application of technological systems to monitor and provide nowcasting, forecasting and early warning of convective storms, such as Medicanes (hurricane-like cyclonic systems in the Mediterranean Sea), particularly on a short-term temporal and small-scale spatial context, is crucial to a wide spectrum of societal sectors including public safety, protection of agricultural production and protection of infrastructures. Weather forecast updates in Numerical Weather Prediction (NWP) models suffer from two main problems: a) The updates on impending weather conditions, including alerts for precipitation, are issued every 6 h b) These updates may not represent the real weather conditions near the area of interest. Increasing the spatial and temporal coverage by meteorological radars can help to face these issues; however, it is a very costly solution, involving high initial purchase costs, installation expenses, and ongoing maintenance. Alternative low-cost solutions, such as GNSSs (Global Navigation Satellite Systems) are necessary to enhance the continuous atmospheric sensing of various parameters in near-real time including water vapor, temperature, and pressure, by analyzing the signals received from GNSS satellites. The rapid spatiotemporal variations of Precipitable Water Vapor (PWV) in the low atmosphere comprises one more challenge to NWP models forecasting accuracy. Though many studies have evidenced continuous reinforcement of PWV before the heavy rainfall, there is still a great difficulty to determine a rigid relationship between rainfall and PWV that could be incorporated to a nowcasting model. In this context, the present study aims to investigate the possible correlation between PWV and heavy rainfall, during 81 selected heavy and extreme precipitation events occurring during 2022-2024 over Cyprus Island. To achieve this, we exploited both GNSS and ERA5 (the fifth generation ECMWF atmospheric Reanalysis) PWV data and rainfall observations over 12 meteorological stations of Cyprus. An increase in PWV before most heavy rain events was found with the time-lag of PWV peaks from the heavy rain onset having a range from one to six hours in most events. The Correlation Coefficient R, between maximum PWV peaks and the related maximum precipitation peaks shows a very high correlation (R = 0.85) over the mountainous region of the island and a satisfactory correlation both in coastal and all Cyprus regions (R = 0.5).
1 Introduction
Water Vapor is the largest greenhouse gas, playing an important role in the hydrological cycle and the radiative balance of the earth (Patel and Kuttippurath, 2023). It is one of the main components determining the conditions for adverse weather, such as abrupt and heavy precipitation. Precipitable Water Vapor (PWV) is the amount of water Vapor integrated in a vertical column of the atmosphere over an area. Accurate estimation of PWV is crucial for weather forecasting and climate investigation. The spatial and temporal rapid variations of water Vapor in the low atmosphere constitute a big challenge to the forecasting accuracy of NWP models and to the near real-time forecasting information on sudden heavy rain episodes (Mazzarella et al., 2022; Moore et al., 2015) and reveals the need for techniques to measure PWV at a high temporal and spatial resolution (Barindelli et al., 2018; Stępniak and Paziewski, 2022; Sarkar et al., 2023). GNSS has been widely used to retrieve PWV due to its high spatial and temporal resolution, all weather convenience, high accuracy providing nearly real time data, and lower cost compared to other methods using radiosonde and microwave radiometer data (Li et al., 2021). The technique to estimate PWV is by exploiting the propagation delay of the GNSS satellites signals. Accurate estimation of zenith tropospheric delay (ZTD) is important for high-precision GNSS positioning and timing (Xia et al., 2023; Jin et al., 2011; 2022). Zenith tropospheric delay is the sum of zenith hydrostatic delay (ZHD) due to dry air components which is related to the pressure, and zenith wet delay (ZWD) induced from the wet component of the troposphere, i.e., water Vapor (Xia et al., 2023). The ZWD can be converted to PWV using a relatively simple mathematical formula described by Bevis et al., 1994. GNSS derived ZWD has demonstrated to be a reliable technique for applications in Meteorology. Many recent studies acknowledge the robustness and reliability of GNSS derived PWV after more than 2 decades of experimentation and crosschecking with other techniques (Li et al., 2021; Negusini et al., 2016; Ildikó and Szabolcs, 2018), such as radiosonde and both space- and ground-based radiometers (Vaquero-Martinez and Anton, 2021).
In PWV retrievals from GNSS data, the surface pressure (Ps) and the weighted mean temperature (Tm), are highly contributing to the accuracy of PWV estimations. In situ measurements of Ps and Tm can significantly improve the accuracy of PWV estimations, but they are often not available due to the absence of collocated meteorological sensors to the GNSS receiver (Li et al., 2020). Hence, alternative Ps and Tm data are used from reanalysis data, most commonly the European Centre for Medium-Range Weather Forecasts (ECMWF ERA-5), National Centers for Environmental Prediction Final Analysis (NCEP FNL), NCEP Global Forecast System (GFS), Modern-Era Retrospective Analysis for Research and Applications version 2 (MERRA-2), and from regional models and empirical blind models like GPT-3 (Chen et al., 2021; Huang et al., 2021; Li et al., 2021). Moreover, in recent studies by Abdelazeem and El-Rabbany (2020) and Xia et al. (2023), the accuracy of ZTD using the single, dual, triple, or multi-GNSS Precise Point Positioning (PPP) technique has been evaluated. Through an extensive validation procedure, they demonstrate that the accuracy of ZTD has been greatly improved from single to multi-system technique.
The relationship between heavy rainfall and PWV has also been examined by numerous studies, showing that high spatial and temporal resolution GNSS-PWV can improve rainfall forecasting (Ziarani et al., 2021; Li et al., 2022; Baldysz et al., 2024). In their work, Zhang et al. (2022) and Barbarosa et al. (2023) found a significant correlation between PWV values and precipitation measurements in the studied regions. Another study by Sapucci et al. (2018) refers that Global Positioning System PWV (GPS-PWV) sharply increases before intense rain events. This jump was observed for any precipitation event in their study, but it was more acute before more intense and extensive precipitation events. Barindelli et al. (2018) also found that variations in GNSS-PWV have a direct relationship with the evolution of the rain events in their case studies. They found a peak in the PWV value during heavy precipitation over a station. This peak was followed by a steep decrease of 5–10 mm in about 1 h as the rain past the station. Zhang et al. (2015) stated that a large increase in PWV was observed 8–10 h before the start of a quite intense rain event. Zhao et al. (2020) also noticed that PWV increases before the arrival of heavy rainfall, reaches a quite large value during rainfall event, and decreases to its average value at the end of the rain event. Similar, Li et al. (2020) found that in most of the analyzed PWV time series heavy precipitation occurred mainly 7.31 h after the PWV reached its highest value, while the sharp PWV decrease phase initiated from about 4.38 h prior to the next coming heavy precipitation event. Ziarani et al. (2021) observed an increase in PWV before the rainfall event and at the time of maximum rainfall—both for GNSS-PWV and Convective Available Potential Energy (CAPE). Baldysz et al. (2024) who investigated the daily GNSS-PWV variability, precipitation and cloud top temperature across the global tropics, found that for most of the studied cases, GNSS-PWV had one daily maximum, which was related to the afternoon precipitation and to the minimum cloud top temperature. Factors like the geographic position (i.e., coastal, inland, and mountainous) and local dynamics of the studied areas can affect the link between PWV peaks and rainfall (Serrano-Vincenti et al., 2022; Pan et al., 2024).
Despite the strong relation of PWV variations and the onset of precipitation, the physical mechanism that determines this relationship is complex, associated with the impact of convergence of moist air to deep convection, thus precipitation cannot be determined merely by the PWV variations (Zhang et al., 2022). Precise precipitation predictions are still a big challenge for weather modelling, especially for abrupt and sudden phenomena at a local scale. To overcome this challenge further densification of GNSS networks is required. This can be achievable with compact low-cost GNSS receivers, as the deployment of new GNSS geodetic stations is limited due to high cost. Recent studies by Oikonomou et al. (2023), Marut et al. (2022), Barindelli et al. (2018), and Stępniak and Paziewski (2022) demonstrated that the use of low-cost GNSS receivers for ZTD and PWV estimations could outperform in accuracy those derived from geodetic receivers and radiometers.
In Cyprus, PWV data are sparse and inhomogeneous. The benefits of the development of a dense network of low-cost GNSS receivers for the weather forecasting and nowcasting services are of paramount importance in this Eastern Mediterranean region–a climate change hot spot region–where extreme weather phenomena such as abrupt and heavy precipitation events are expected to become more frequent and intense (Lelieveld et al., 2012; Zittis et al., 2022). Therefore, this investigation is an initial attempt to investigate the potential relationship between PWV and heavy rainfall by using both GNSS-derived and ERA5 Reanalysis PWV data as well as ground meteorological observations obtained from a network of 12 meteorological stations in Cyprus during certain extreme precipitation events that took place during the years 2022–2024. Next, Section 2 presents the data analysis, the methodology for obtaining PWV from GNSS ground receivers, the intercomparison of ERA5 and GNSS-derived PWV and the methodology for the investigation of the potential relationship between PWV and the onset of heavy precipitation events in Cyprus. Section 3 presents the results of temporal and spatial characteristics of PWV–heavy precipitation relationship and their explanation followed by conclusions and future perspectives (Section 4).
2 Data analysis and methodology
2.1 GNSS, ERA5 and meteorological datasets
In the present study, GNSS data from 12 permanent stations from Cyprus were used. These stations are managed by Cloudwater Ltd, and their locations are shown in Figure 1. The characteristics of GNSS receivers are shown in Table 1. All GNSS stations are collocated (up to 2 km distance between them) with 12 respective meteorological stations operated by the Cyprus Department of Meteorology (DoM, 2024). In order to estimate PWV from raw GNSS data we utilized a custom PWV estimation in-house software developed by Cloudwater Ltd, which takes fully advantage of all available operational GNSSs (GPS, GALILEO, GLONASS and BeiDou). The GNSS-PWV values were computed using an in-house processing pipeline, which is based on the publicly available G-Nut/Tefnut software developed by the Geodetic Observatory Pecný (GOP), Czech Republic (Vaclavovic et al., 2013). The original G-Nut/Tefnut code was modified to support customized data ingestion and automated processing workflows tailored to our GNSS station setup and data formats. In particular, we developed routines for GNSS processing and ZTD (Zenith Tropospheric Delay) estimation in near real-time (every 15 min), following the Precise Point Positioning (PPP) approach. Validation of the outputs was conducted internally against known patterns of daily and seasonal PWV and extreme rainfall events in Cyprus. The method of PWV estimation is described in detail at the following Section 2.2. PWV datasets (15 min resolution) were compared with 10 min rainfall measurements over 12 meteorological stations during selected extreme precipitation events, obtained from the Cyprus DoM. Furthermore, hourly ERA5 Reanalysis PWV data were employed for the 12 stations for the same extreme events in order to detect potential correlation between PWV and rainfall.
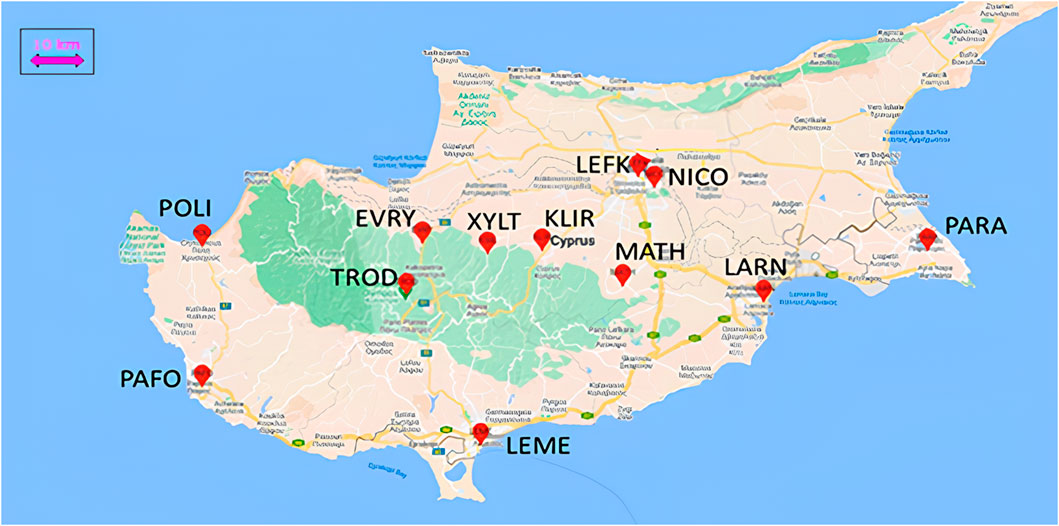
Figure 1. Cyprus GNSS permanent stations network operated by Cloudwater Ltd.
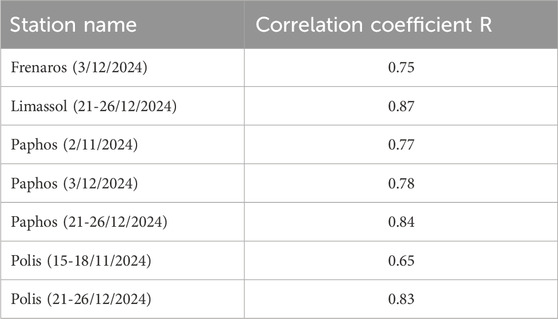
Table 1. Correlation Coefficient R between GNSS and ERA5 derived PWV time series for 7 selected extreme precipitation events.
ERA5 datasets comprise the fifth-generation of the European Centre for Medium-Range Weather Forecasts (ECMWF) global climate reanalysis dataset. It is produced by using the 4D-Var data assimilation scheme in the CY41R2 model of the ECMWF’s Integrated Forecast System (IFS), replacing the ERA-Interim dataset. ERA5 provides hourly atmospheric reanalysis data at 37 pressure levels from 1000 to 1 hectopascals i.e., from the surface up to 80 km height, with a horizontal spatial resolution of 0.25° × 0.25° corresponding to approximately 27.75 km by 27.75 km . It has been shown that ERA5 performs very well in estimation of PWV (Wang et al., 2020). In this study, PWV time series derived from ERA5 surface products are compared with the spatiotemporal variation of GNSS PWV.
2.2 PWV estimation from GNSS ground receivers
The GNSS signal delay induced by the wet component of the troposphere allow us to sense Precipitable Water Vapor (PWV) with ground-based GNSS stations (Bevis et al., 1994). PWV is defined as the depth of water that would result if all atmospheric water vapor in a vertical column of air is being condensed to liquid. For this reason, GNSS-derived Zenith Wet Delays (ZWD) can be transformed to PWV using the formula described by Equations 1-3 (Bevis et al., 1992, Bevis et al., 1994; Mendes et al., 200):
where, the ZWD is derived from the relation ZWD = ZTD–ZHD, with Zenith Hydrostatic Delay–ZHD depending on the dry air gases accounting for the greatest part of the tropospheric delay and
where,
where, Ts is the surface temperature in Kelvin.
In this analysis, we retrieved the related parameters from GPT2w model in order to compute the tropospheric component ZHD. Based on the approximation by Saastamoinen (1972), the ZHD can also be expressed as in Equation 4:
where, P is the atmospheric pressure in pascals, Φ is the station latitude in degrees and h the station’s orthometric height in meters. Subsequently, we calculate the ZWD and finally PWV.
2.3 GPT2w (global pressure and temperature 2 wet) model data
The blind empirical model GPT2w (Böhm et al., 2014) estimates the mean, annual and semianual pressure amplitudes. It was initially developed by Böhm et al. (2007) as a blind model, named GPT, based on 3-year monthly mean profiles of pressure and temperature from the ECMWF 40-year reanalysis data (ERA40) to provide pressure and temperature for the measurement time interval of a GNSS receiver (epoch). Later on, Lagler et al. (2013) improved the model (GPT2) by combining GPT and Global Mapping Function (GMF) employing 10 years (2001–2010) of 37 monthly mean pressure isobaric level data from the ECMWF reanalysis (ERA-Interim). The latest GPT2w is an upgrade of GPT2 with an improved capability in ZWDs computation, available at http://ggosatm.hg.tuwien.ac.at/DELAY/SOURCE/. GPT2w is based on global 1° × 1° gridded values of tropospheric variables including surface pressure for modelling the ZHD or water vapor pressure, and weighted mean temperature and water vapor decrease factor for modelling the ZWD. In order to define the pressure and temperature values at a GNSS site, the model first estimates the pressure and temperature values at four nearest grid points surrounding the GNSS site. Then, temperature is corrected for the altitude difference between the station and grid. For this purpose, at each of the four grid points, the altitude gradient and the temperature lapse rate are added to the temperature value. Concerning the pressure, values at these four grids at the height of the station are estimated by using a vertical exponential trend coefficient related to the inverse of the virtual temperature. Finally, the pressure and temperature at the GNSS station are interpolated from the above four respective grid values. In general, it can be stated that GPT2w blind model gives high quality products (Liu et al., 2017).
2.4 Intercomparison of ERA5 and GNSS-derived PWV
ERA5-PWV are reanalysis data based on atmospheric modeling to simulate humidity and temperature profiles, and on availability of observations and assimilated methods. They have coarse spatial resolution (∼27.75 by 27.75 km2) and coarser temporal resolution (hourly data) compared to the 15-min GNSS-PWV and can have biases and limitations in spatial representation–for example, may lack small-scale detail needed to capture rapid atmospheric changes. Despite these limitations and biases, the evaluation of accuracy of ERA5-PWV compared to the GNSS-PWV have demonstrated that ERA5 has a very good performance (Schiettekatte et al., 2023; Wang et al., 2020; Zhang et al., 2019).
Prior to the investigation of the PWV-rainfall relationship, we attempt an intercomparison of GNSS-derived PWV values with the respective ERA5 values during seven extreme precipitation events, by applying the Regression Analysis. The minimum sample size is 24 values for the 1-day events and increases for longer duration events while the p values for all cases are negligible, which indicate that the analysis is statistically significant. The results are presented in Table 1. The correlation coefficient R shows a high correlation of GNSS and ERA5 PWV values in most of the events. This allows us to employ both ERA5 and GNSS PWV values to investigate the relationship of Precipitable Water Vapor with heavy precipitation. In total, we analyzed 81 heavy precipitation events from January 2022 to December 2024, using data from the 12 GNSS stations to produce the PWV/Rain time series, based on the selection criteria described in Section 2.5.
2.5 Methodology
In the present study, GNSS and ERA5 PWV data were utilized to analyze the potential relationship between PWV and the onset of heavy precipitation events in Cyprus. It should be noted at this point that GNSS-derived PWV datasets were employed only in certain cases of extreme precipitation events due to limited data availability.
In order to identify any possible relationship of PWV and heavy precipitation, we first examined temporal variation of both variables by producing the concurrent time series during all selected heavy precipitation events. Then, we investigated the spatial behavior of PWV-Rain relationship over the island by correlating the observed PWV peaks with the peaks of precipitation related to them, during all selected extreme precipitation events. The results are shown and analyzed in the next Section 3.
Table 2 presents the location of the 12 GNSS receivers’ stations. In order to investigate the PWV–rainfall relationship we selected certain days and periods with heavy precipitation for the years 2022–2024 using the following four main criteria:
1. Days with rain ≥20 mm
2. Consecutive Wet Days (CWD) periods with accumulated 4–6 days rain ≥40 mm
3. Short 2–3 CWD events with abrupt precipitation
4. Long event >6 CWD with high-accumulated precipitation with at least 2 days with heavy precipitation (≥15 mm) expand from days with little to days with heavy rain.
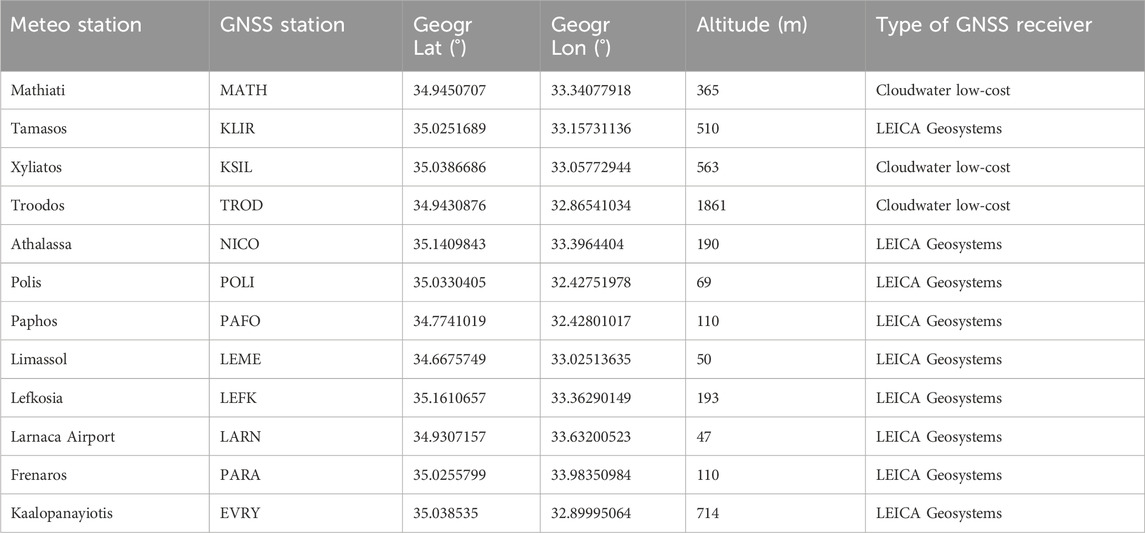
Table 2. Cyprus GNSS permanent stations network characteristics.
As heavy precipitation days are considered the days with precipitation ≥20 mm (Lazoglou et al., 2024; Zittis et al., 2020; Tymvios et al., 2010), which is the criterion we have chosen to categorize a precipitation event in the 12 stations as day with heavy rain and is an indicator of extreme rainfall. The European Severe Weather Database (ESWD) collects and provides detailed and high-quality information on extreme storm events over Europe. For the scope of this study, we used ESWD reports for heavy rain and large hail events with an extreme impact over Cyprus for the period 2022-2024 (Dotzek et al., 2009a). ESWD heavy rain is defined as large amounts of precipitation that can cause either significant damage or no damage is known, but extraordinary high precipitation amounts have been observed within a period of 24 h. Therefore, the criterion for inclusion of a report in the ESWD database is that the heavy rain event must have caused an extreme impact, or a measurement of extreme rainfall must be provided. Large hail reports include events with hailstones that have a diameter (in the longest direction) of at least 2 cm, or hailstones that form a layer of 2 cm thickness or more on flat parts of the earth’s surface. We assigned these reported data to any of the 12 selected meteorological stations, if the reported location of the event is within 5 km with no elevation differences from the closest GNSS station.
Apart from days with extreme precipitation and short-term sudden events, we were interested in long events of consecutive days with small and high amounts of rain, so that we could examine the fluctuations and changes in PWV, from very rainy days to slightly rainy days. Based on these criteria, we selected 81 heavy precipitation events for this study, which are presented in Table 3.
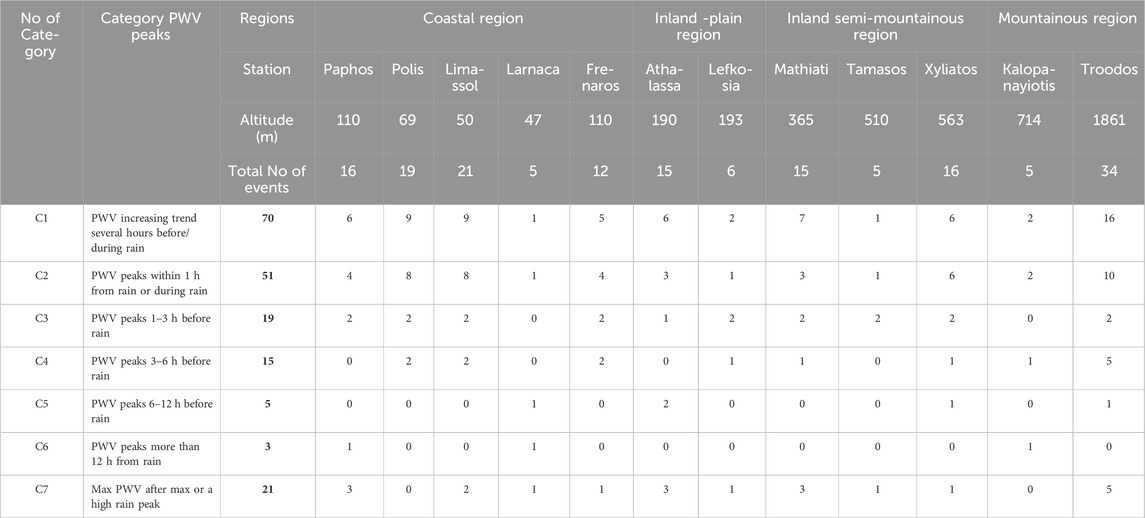
Table 3. Spatial variation of PWV peaks occurrence during extreme precipitation events in 2022–2024 in Cyprus.
3 Results
3.1 Temporal PWV variation in relation to the precipitation onset
This section presents the analysis and main findings of the relationship between the temporal variation in PWV and the precipitation onset for the selected heavy rain events. In most of the analyzed events, the ERA5-PWV time series shows a clear ascending trend before heavy rainfall starts, with clear PWV peaks related to rain peaks occurring from several hours before the onset of heavy rain to right before the heavy rain peaks. This is in agreement with a significant number of studies in different regions who investigate the PWV-Rain relationship (Sapucci et al., 2018; Li et al., 2020; Kunkel et al., 2020; Zhang et al., 2022; Barbarosa et al., 2023; Zhao et al., 2020). From a time-lag correlation histogram Sapucci et al. (2018) found that a peak in the PWV occurred from 15 min to 1 h before the maximum rainfall in 85% of the studied events during the CHUVA Vale field campaign in Brazil. Yao et al. (2017) also found a correlation relationship between PWV and rainfall in a studied region in the subtropical monsoon climate zone in China and reported that a maximum rainfall usually occur near PWV peak. Li et al. (2012) and Zhao et al. (2018) found that PWV significantly increases about 2–6 h before precipitation starts, while Li et al. (2020) found that heavy precipitation started about 7 h after PWV reached a peak value. Serrano-Vincenti et al. (2022) found a lag of 11 h in most of the studied regions (Northwest Equatorial Coast, Andes), and a lag of 6 h in the Amazon regions between the preceding PWV increase and an intense rain event.
To examine the PWV variation before and during a heavy precipitation event we assigned the PWV/Precipitation time series events in the following categories:
C1. PWV ascending trend before/during rain.
C2. PWV peaks within 1 h from rain or during rain.
C3. PWV peaks 1–3 h before rain.
C4. PWV peaks 3–6 h before rain.
C5. PWV peaks 6–12 h before rain.
C6. PWV peaks occurring more than 12 h from the rain onset.
C7. Maximum PWV after maximum or a high rain peak.
Next, we present some of the most characteristic events of the main categories. We need to emphasize here that precipitation data are in 10-min interval and GNSS-PWV data are in 15-min interval while ERA-5 PWV data are hourly. Therefore, despite the high correlation of GNSS and ERA5 PWV values (see Section 2.4), by utilizing the GNSS-PWV data we can see a finer PWV time evolution and association with the precipitation time series.
3.1.1 C1. PWV ascending trend before/during rain
As reported in several studies, PWV time series shows an increase before the onset of precipitation (Li et al., 2020; Sapucci et al., 2018; Zhang et al., 2015; Zhao et al., 2020; Yao et al., 2017) and reaches a peak before rain starts. We also found in this study this ascending trend in 70 of the 81 heavy rain events accounting for 86.4%, where PWV shows an increasing trend before rain starts, even if in some events we do not see a clear PWV peak before or during rain. This can be explained by the physical mechanism of rain formation. Surface water temperature increases due to the solar radiation, causing water to evaporate and elevate to the upper atmosphere where it cools down. Prior to heavy precipitation, a significant water transport takes place (expressed as large PWV increase), followed by a warm air convergence, during which water vapor condensates into droplets, which precipitate from the cloud as rainfall when air is adequately saturated (Van Baelen et al., 2011; Wang, 2013; Li et al., 2020). Figure 2 presents three cases where ERA5-PWV (red markers) has a clear ascending trend before rain starts (blue markers), but in the Kalopanayiotis event, we do not see a PWV peak and drop, and in Tamasos event, PWV is almost flat for several hours after reaching its maximum value. In Troodos event PWV shows a significant increase from 10 mm to a peak of 27 mm 2h40 min before the maximum rain peak, then slightly drops and goes up again reaching a second peak at 28.6 mm during the heavy rain time.
1. Station Kalopanayiotis – 25 January 2022, sum precipitation 38.5 mm
2. Station Tamasos – 8–9 April 2024, sum precipitation 41.1 mm
3. Station Troodos – 18 November 2023, sum precipitation 48.1 mm
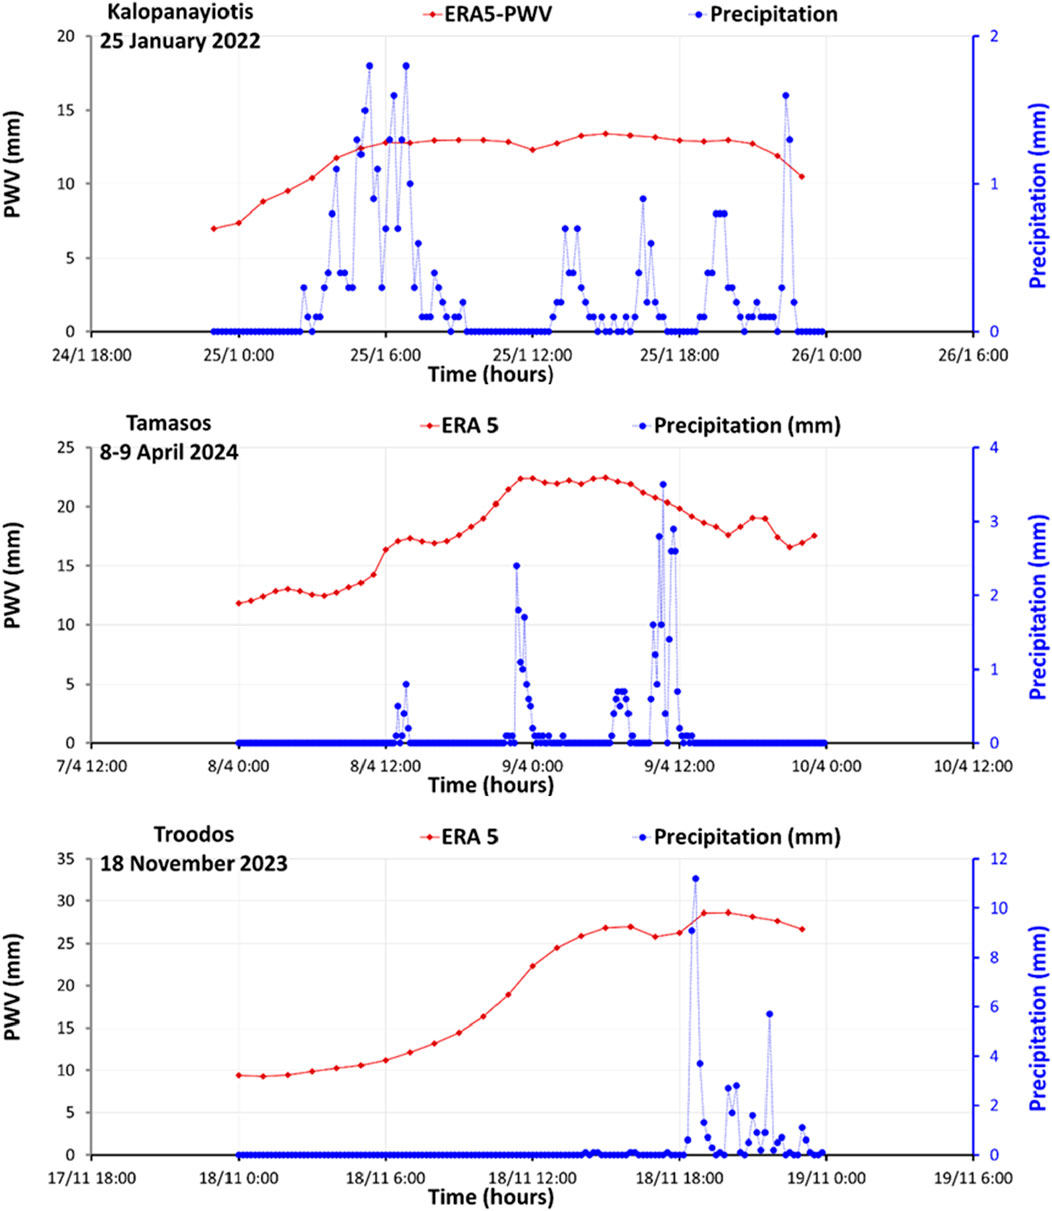
Figure 2. C1 – Events where PWV shows ascending trend several hours before/during rain.
3.1.2 C2. PWV peaks within 1 h from rain or during rain
From the analysis of the PWV/Rain time series, we observed in 51 events (63%) at least one PWV peak within 1 h from a rain peak. Figure 3 shows four characteristic examples of events in this category. In these events, smaller PWV peaks can be identified as well before the rain events.
1. Station Frenaros – 3 December 2024, Sum precipitation 70.5 mm
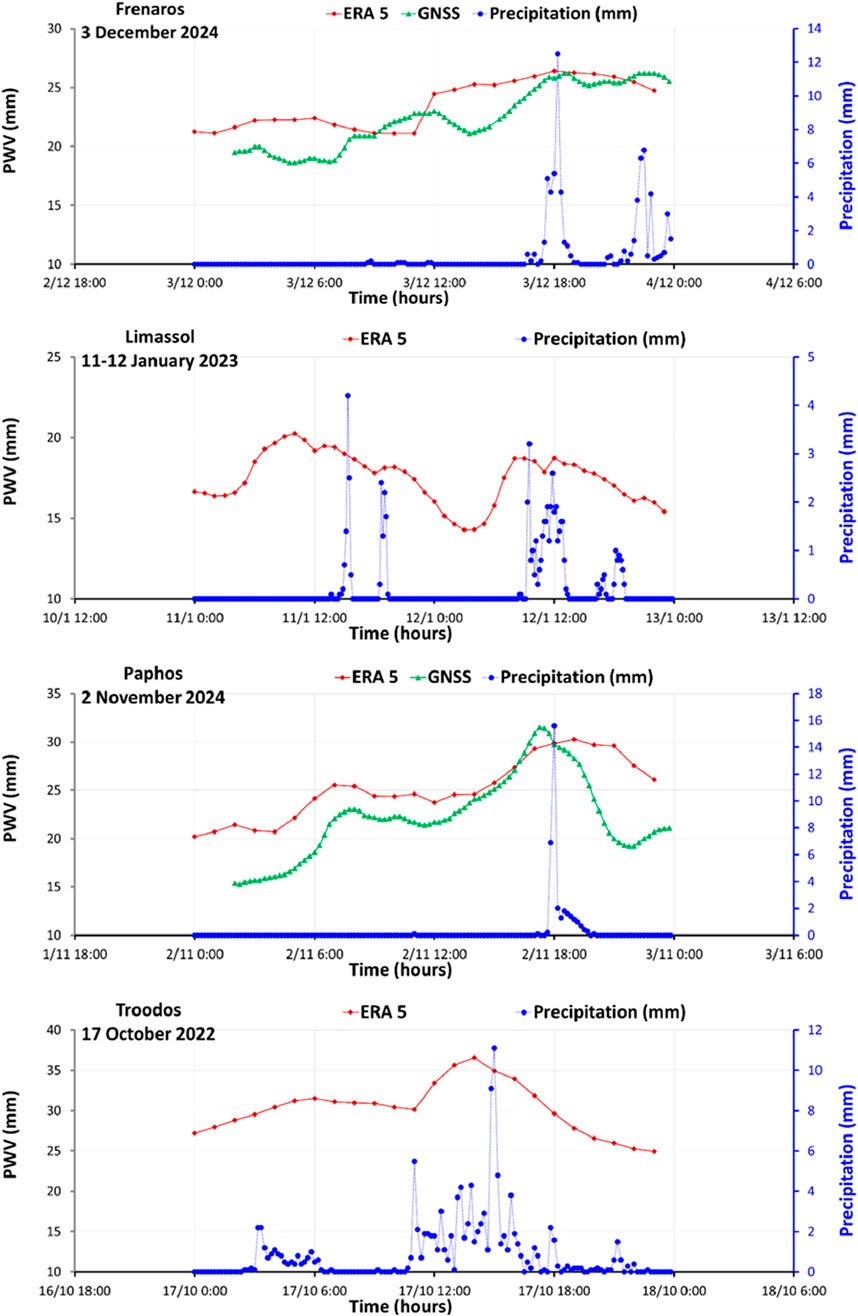
Figure 3. C2 – Events where PWV is peaking within 1 h from rain or during rain.
The rainfall starts at 16.40 with an abrupt peak at 18.10, reaching 12.5 mm. Then the rain stops at 19.15 and starts again with a second smaller peak at 22.30. Before the heavy precipitation begins, GNSS-PWV (green markers) starts increasing rapidly from 21 mm about 4 h prior rain starts and reach a maximum value of 26 mm almost during the time of the maximum rainfall. Then drops and starts increasing again 2h45min before a second lower rain peak. The ERA5-PWV (red line) shows an abrupt increase from 21 mm to 24.4 mm 5 h before the rain starts. Then PWV follows an ascending trend and reaches a peak value of 26.4 mm 10 min before the maximum rain peak. According to Sapucci et al. (2018) this abrupt increase in PWV value can be related to water vapor convergence and the continued cloud water condensation and precipitation formation. After the PWV peak, a decreasing phase is observed after the maximum rain peak during the rest period of the event. GNSS-PWV and ERA5-PWV both reach the same maximum value close to the time of the maximum rain peak and have an ascending trend before the onset of heavy rain and decline right after the maximum rain peak, although they follow a different trend after the peak. A physical mechanism that can possibly explain this PWV decline is the conversion process from water vapor to liquid (Solheim et al., 1999). Other physical mechanisms that can induce the PWV decrease after rain starts are the storm downdraft, that creates a drier and cooler atmosphere, as well as and the advection forced by the speed and direction impacts of the wind shear to the storm movement (Sapucci et al., 2018). PWV gets relatively high values from 21 to 26.4 mm due to high rain peaks.
2. Station Limassol – 11–12 January 2023, Sum precipitation 58 mm
This is a 2-day rainy event with two very short periods during the first day and a longer period with rain during the second day of the event. PWV steadily increases from 12 h before rain starts and reach a max value 5 h before max rain peak during the first day of the event. Then it goes down and up again with a second small peak on the time of the second rain peak. On the second day, we notice again the increasing PWV before the beginning of rain, starting from 14 mm and reaching a peak of 18.7 mm about 1 h before the rain peak. Then it shows a small commotion during the rain period with a second peak during the second rain peak. A PWV decreasing phase is observed after the heavy rainfall. PWV values are below 21, and peak rainfall values are below 4.5 mm.
3. Station Paphos – 2 November 2024, Sum precipitation 34.7 mm
Similar to the first event, GNSS-PWV increases from 21.4 mm about 6 h before rain starts and reaches a peak of 31.5 mm 45min before the maximum rain peak. Then sharply declines until the end of the rain event. ERA5-PWV follows a similar trend and time evolution starting though ascending from 23.7 mm 6 h before heavy rain starts and reaches a peak value of 30 mm during the time of rainfall. After the PWV crest, a smoother decreasing phase is detected 1 h after the maximum rain peak. Moreover, we observe relatively high PWV values due to high maximum rain during a short duration rain event.
4. Troodos – 17 October 2022, sum precipitation 117.1 mm
During this extreme event, we see high PWV values and high rain peaks last for about 7 h. PWV jumps from 30.1 mm to a maximum 36.6 mm peak 1 h beofre the time of maximum rain peak. Then PWV decreases during the rest phase of the rain event.
3.1.3 C3. PWV peaks 1–3 h before rain
In 19 of the analyzed events (23.5%), PWV peaks from 1 to 3 h before the heavy rain starts. In all the events shown in Figure 4 we see an increasing PWV trend before the maximum rainfall. After the PWV peak, a decreasing trend is observed.
1. Station Paphos – 11–12 January 2023, sum precipitation 50.6 mm
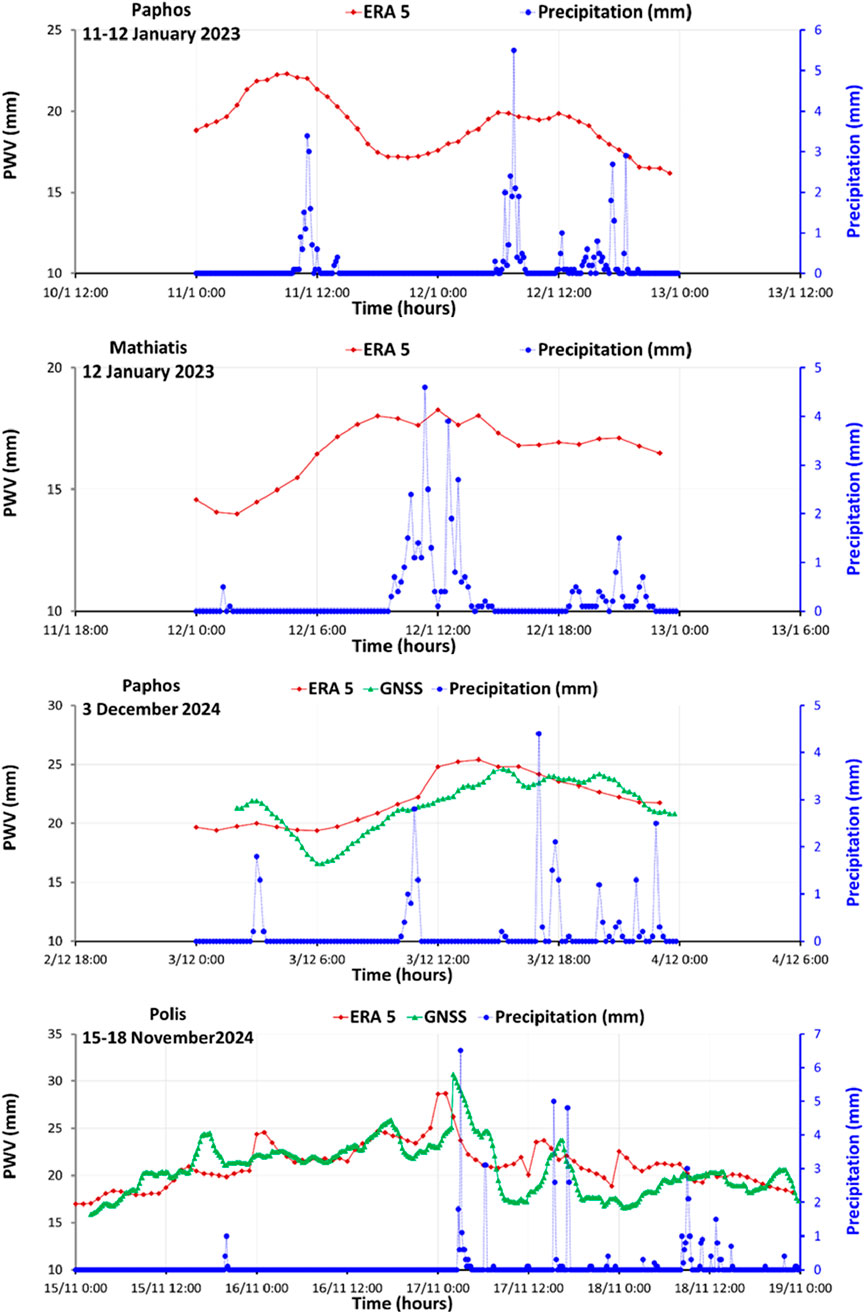
Figure 4. C3 – Events where PWV is peaking 1–3 h before rain.
PWV increases before rain starts and reach a maximum value of 22.3 mm 2 h before the first rain peak. A second smaller peak was observed 1.5 h before the second rain peak. PWV values fluctuate between 16 and 22.3 mm and rain peaks are below 6 mm during the event.
2. Station Mathiatis – 12 January 2023, sum precipitation 40.3 mm
PWV increases before rain starts and reach a first peak 2h20min before maximum rain peak. PWV takes its maximum value during the rain event 30min before a second rain peak. PWV values are below 19 mm and rain peaks are below 5 mm.
3. Station Paphos – 3 December 2024, sum precipitation 27 mm
In this event, GNSS-PWV shows a peak on the time of the first rain peak in the begin of the event, then declines and increases again steadily from 16.6 mm about 3.5 h before the second rain peak and reaches a maximum value of 24.6 mm 1h45 min before the maximum rain peak. Then declines until 30 min before maximum rain peak and continues a decline trend with some fluctuations until the end of the event. ERA5-PWV shows a small peak on the first rain peak, increases steadily 5 h before the second rain peak and jumps and gets its maximum value 3 h before the maximum rain. After the peak, we observe a decreasing trend until the end of the event.
4. Station Polis – 15–18 November 2024, sum precipitation 52.6 mm
Before the heavy precipitation, the GNSS and ERA5 PWV values fluctuate with clear ascending trend and forming a jump to its maximum value 1 h and 3 h respectively before heavy rain starts. ERA5-PWV shows a second smaller peak 1.5 h before rain starts again. After a steep decline, GNSS-PWV increases and reach a second peak during the second phase of the rain event. PWV is reacheing high values, while several rain peaks are above 3 mm during the event.
3.1.4 C4. PWV peaks 3-6h before rain
Figure 5 shows two cases where PWV is reaching a peak value between 3-6 h before heavy rain starts.
1. Station Polis – 5 February 2023, sum precipitation 43.6 mm
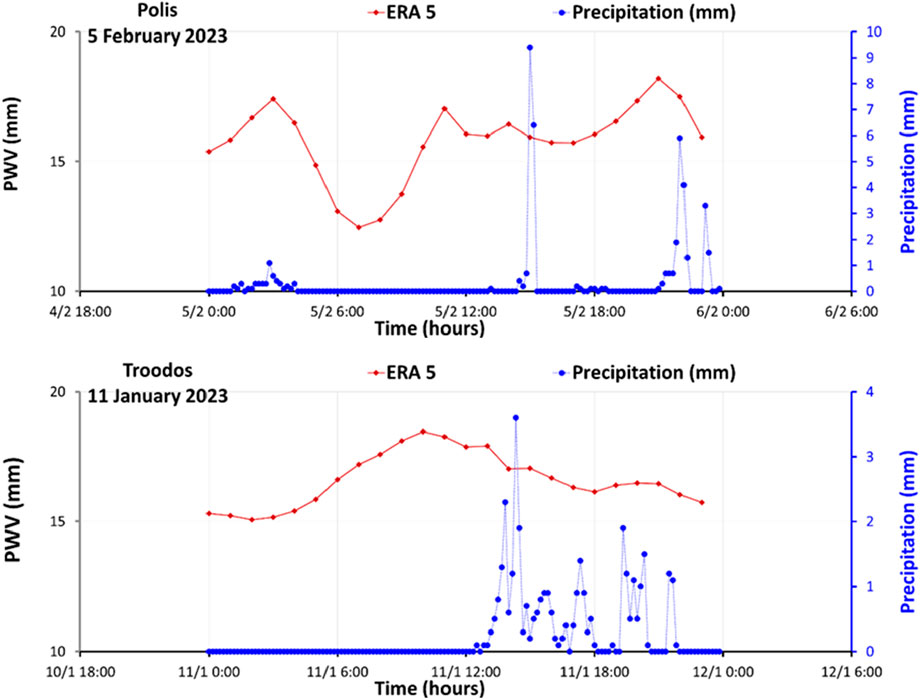
Figure 5. C4 – Events where PWV is peaking 3–6 h before rain.
PWV starts ascending 8 h before heavy rain starts reaching a peak 4 h before the maximum rain peak. Towards the end of the event, PWV jumps to its maximum value 1 h before the last phase of rain. PWV takes values below 19 mm despite some high rain peaks, most likely due to the short duration of the two phases of the event.
2. Station Troodos – 11 January 2023, sum precipitation 34 mm
PWV increases to its maximum value 3.5 h before rain starts and 4h20min before the maximum rain peak. After PWV reaches peak, a decreasing phase can be identified. PWV gets values below 19 mm, and most rain peaks are below 2.5 mm in a long duration (about 8 h) rain event.
3.1.5 C7. Maximum PWV after maximum or a high rain peak
Figure 6 shows 3 cases where the maximum PWV is after the maximum rain peak. This PWV behaviour was noticed in 21 events (25.9%), though in many cases it occurred during the rain event and close to the maximum rain peak.
1. Station Athalassa – 14 June 2022, sum precipitation 43.1 mm. Maximum PWV 40 min after maximum rainfall.
2. Station Larnaca Airport – 17 October 2022, sum precipitation 54.4 mm. Maximum PWV 2h20 min after maximum rainfall.
3. Station Limassol – 15-17 October 2022, sum precipitation 56.8 mm. Maximum PWV 2h10 min after maximum rainfall.
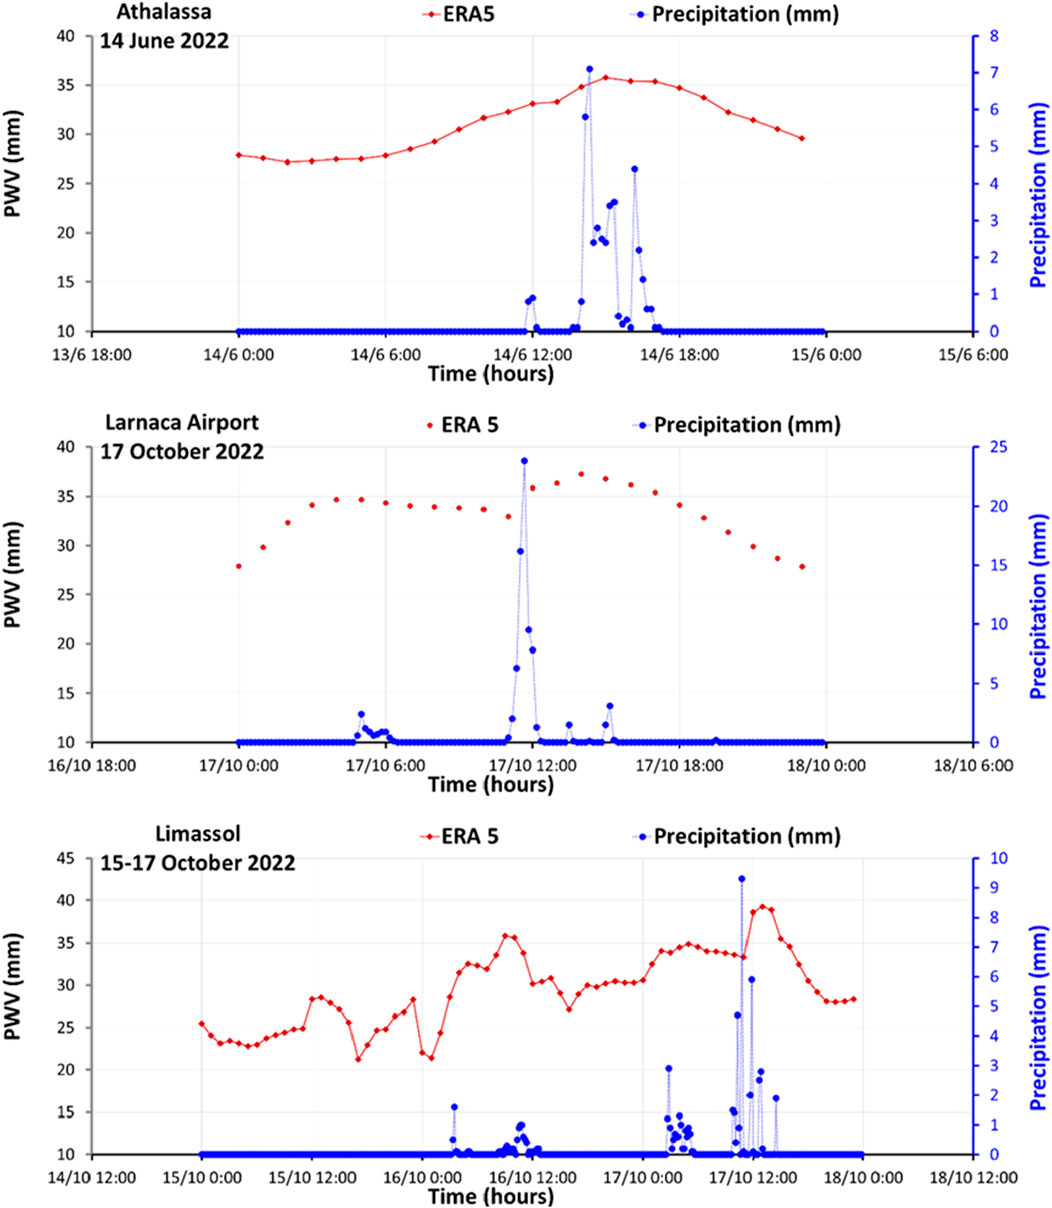
Figure 6. C7 – Events where maximum PWV occurs after maximum or a high rain peak.
Table 3 and Figure 7 summarizes the most important outcomes from the temporal PWV variation analysis in relation to the onset of precipitation for 81 heavy rain events in Cyprus from 2022 to 2024. In agreement with other studies (Kim et al., 2023; Li et al., 2020; Sapucci et al., 2018) the PWV-Rain time series analysis reveals that PWV jumps are more clear before more intense and abrupt rain events, and the intensity of the precipitation event is related to the intensity of PWV time variations and its maximum values. In most of the events high rain peaks (above 7 mm) or rain peaks above 4 mm with long duration of several hours of the phenomenon are observed together with higher PWV values (>24 mm). Lower rain peaks (below 4 mm) and short duration of the event (1–3 h) are mostly associated with PWV values below 20 mm. When the rain peaks are high, but the event lasts very short time (1–2 h) PWV does not get very high values.
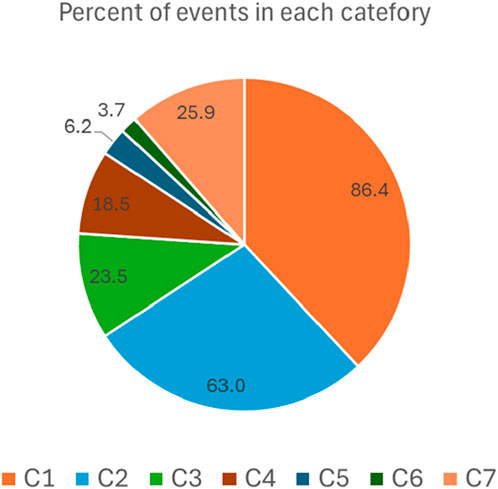
Figure 7. Percentage distribution of the heavy rain events in the 7 categories of PWV peaks.
Another important finding from the temporal PWV variation analysis was that PWV increase occurred before or during rainfall, but not all high PWV values indicate the occurrence of heavy rainfall, as shown in the Limassol event in Figure 6 where we observe a high PWV peak in the middle of the event not followed by significant rainfall. Water vapor increase is one of the needed conditions for the occurrence of rainfall. Certain external dynamic factors are also important for the onset of rainfall. Wind might also be important for the evolution of the phenomenon. If the needed conditions of external dynamic factors are not satisfied, rain might not start even in the case of high increase in PWV values (Shoj, 2013; Zhang et al., 2022). Serrano-Vincenti et al. (2022) also mentions the role of the wind and the topography as important drivers for intense rainfall. Though not all high PWV values indicate the occurrence of rainfall, the increase of water vapor is one of the necessary pre-conditions for the occurrence of rain.
3.2 Spatial characteristics of PWV–precipitation relationship
In Table 3, we attempt a comprehensive presentation of the spatial variation of PWV peaks occurrence during the heavy rain events in Cyprus for the period 2022-2024, based on the observations of the PWV/Rain time series analysis. Our analysis reveals that most of the extreme precipitation events occurring in West - Southwest coastal and mountainous regions of the island. In the majority of these events, the PWV presents an increasing trend several hours before the precipitation onset, while the PWV peaks within 1 h or 1–3 h hours before the precipitation onset.
The scatter diagrams in Figure 8 present the relationships between PWV peaks and heavy precipitation for coastal, mountainous and all Cyprus. A very high correlation is found between PWV peaks and related precipitation peaks over the mountainous region of the island (R = 0.85), where heavier and longer rain events occur Table 4. In the same figure, a satisfactory correlation between PWV and precipitation peaks (R = 0.5) both in coastal and all Cyprus regions can be detected. In addition, the scatter diagrams’ equations (Figure 8) show a trend where the increase in rainfall peaks is produced by approximately double increase in PWV peak values mainly over the mountainous region. For instance, a 15 mm increase in rain is produced by a ∼30 mm increase in PWV in a heavy rain event over the mountainous region. There are, however, significant differences across coastal and inland mountainous regions of Cyprus, which can be attributed to the different characteristics of the weather systems that affect coastal and mountainous regions (vertical velocity of the upward air movement, intensity of weather system, etc.). The number of cases for the mountainous region is 39 and the p value derived from the regression analysis is negligible (p < 10−5). Therefore, despite the relatively small size the correlation coefficient is statistically sound. Our results are in accordance with Kunkel et al. (2020) who investigated about 3100 stations in the United States and found that on average extreme daily precipitation is reinforced by twice the amount of PWVV, however there is significant seasonal and spatial variability induced by vertical velocity. They also proved that precipitable water, rather than the upward airflow generated by weather systems, is the limiting factor on the maximum amount of rain that falls during the most extreme precipitation events.
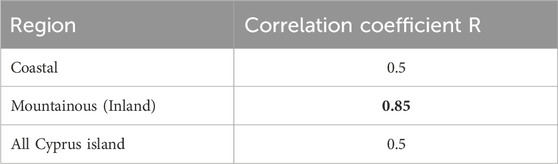
Table 4. Correlation Coefficient R, between maximum PWV and related maximum Precipitation values during extreme precipitation events in the period 2022-2024.
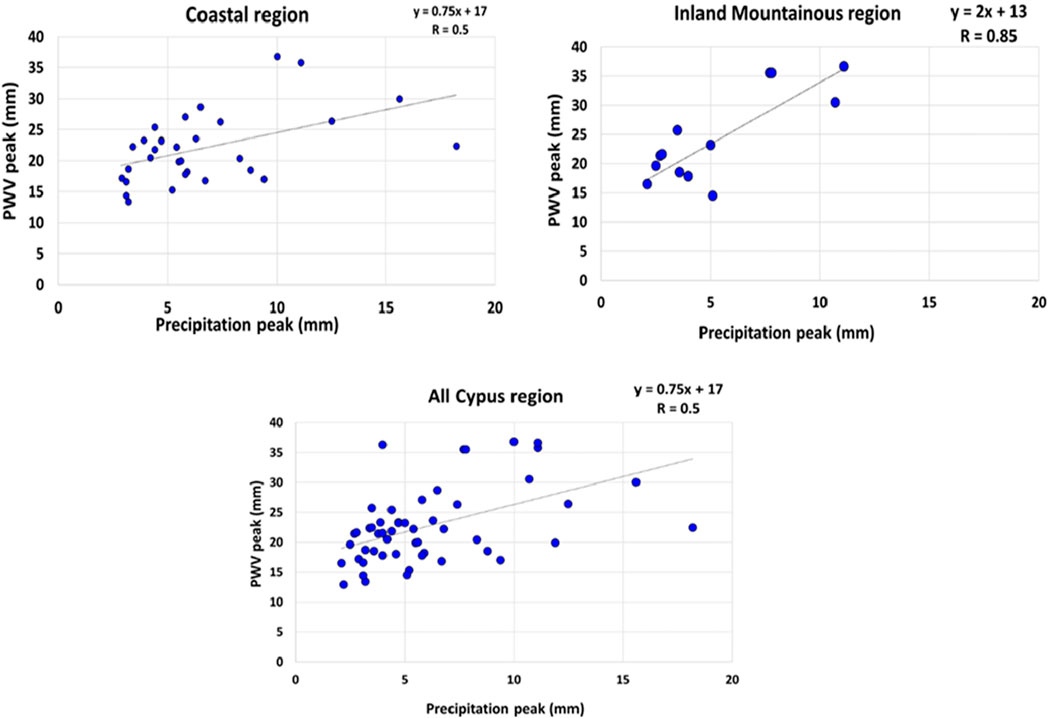
Figure 8. Scatter diagrams present the relationships between PWV peaks and precipitation peaks for coastal, mountainous and all Cyprus for the analyzed heavy rain events.
4 Conclusion and future perspectives
A detailed analysis of ERA5 and GNSS PWV time series and the investigation of the relationship between PWV and heavy rain over 3 years 2022–2024 in Cyprus was carried out in this work. GNSS-derived PWV were intercompared with the respective ERA5-PWV data, showing a high correlation ranging from 0.65 to 0.87, and the temporal GNSS-PWV evolution follows well the evolution of rain events with sharp increases before the onset of heavy rain followed by sharp or smoother drops. In total, 81 heavy or extreme rain events were analyzed over 12 stations. In most of the analyzed events, both GNSS and ERA5 PWV increase before heavy rainfall starts, with clear PWV peaks related to rain peaks occurring from several hours before the onset of heavy rain to right before or during the heavy rain peaks. PWV jumps are more intense in abrupt rain events. The analysis of the time lag of PWV peaks from the rain peaks reveals that in 63% of the studied events at least one PWV peak occurs within 1 h from the rain peaks. In 23.5% and 18.5% of the studied events PWV peaks occur 1–3 h and 3–6 h respectively before the heavy rain starts. A time lag above 6 h occurs in only 9.9% of the studied events, while in 21 events the maximum PWV value occurs after the maximum rain peak, but mostly within the rain event.
The spatial variation of PWV-Rain relationship reveals that most of the extreme precipitation events occurred in West - Southwest coastal and mountainous regions of the island. In the majority of these events, PWV is peaking within 1 h or 1–3 h before the precipitation onset. A very high correlation is found between PWV peaks and related precipitation peaks over the mountainous region of the island (R = 0.85), and a satisfactory correlation (R = 0.5) both in coastal and all Cyprus regions. – Finally, we observed a trend of increased rainfall to be produced by approximately double increase in PWV peak values mainly over the mountainous region.
In the future, we aim to extend this study for a longer period and by using additional GNSS data which have the advantage of high temporal resolution (15 min) and do not include errors from spatial gridding interpolation methods. This will allow us to have a thorough picture (spatial and temporal coverage) and thus a better understanding of the extreme phenomenon and the underlying convective or other precipitation mechanisms. We will also examine the potential role of wind and pressure in the relationship between PWV and rain. Wind (especially wind speed and direction) and pressure systems influence the transport of moisture and air mass stability, significantly affecting the potential of heavy precipitation. This multidimensional approach is necessary in order to mathematically model the relationship between PWV and rainfall, moving beyond simple correlation analysis towards a more sophisticated functional representation. We are currently developing a hyper-dense network of Cloudwater low-cost receivers at the Nicosia district, in the frames of the national-funded Strategic Infrastructure project CYGMEN (Cyprus GNSS Meteorology Enhancement). We are also performing GNSS-PWV assimilation into the WRF numerical weather forecasting model, so as to improve precipitation forecasts over Cyprus. As has been proved by many studies, the robustness of GNSS-PWV as an essential parameter for near real time rainfall predictions demonstrates the benefits of a dense low-cost GNSS receivers network development for better weather forecasting and nowcasting services, especially in hot-spot climate change regions like the Eastern Mediterranean.
Data availability statement
The raw data supporting the conclusions of this article will be made available by the authors, without undue reservation.
Author contributions
DG: Methodology, Data curation, Investigation, Validation, Writing – original draft, Formal Analysis, Writing – review and editing. CO: Project administration, Visualization, Conceptualization, Funding acquisition, Writing – original draft, Supervision, Writing – review and editing. HH: Writing – original draft, Conceptualization, Supervision, Funding acquisition, Project administration, Writing – review and editing.
Funding
The author(s) declare that financial support was received for the research and/or publication of this article. This paper is conducted within “Multi-purpose GNSS Receiver” (MGR) project (Project Protocol Number: ENTERPRISES/0223/Sub-Call1/0255) in the framework of the «RESTART 2016-2020» Programmes for Research, Technological Development and Innovation (RTDI) which is co-financed by the European Union and Republic of Cyprus.
Conflict of interest
Authors DG and CO were employed by Cloudwater Ltd.
The remaining author declares that the research was conducted in the absence of any commercial or financial relationships that could be construed as a potential conflict of interest.
Generative AI statement
The author(s) declare that no Generative AI was used in the creation of this manuscript.
Any alternative text (alt text) provided alongside figures in this article has been generated by Frontiers with the support of artificial intelligence and reasonable efforts have been made to ensure accuracy, including review by the authors wherever possible. If you identify any issues, please contact us.
Publisher’s note
All claims expressed in this article are solely those of the authors and do not necessarily represent those of their affiliated organizations, or those of the publisher, the editors and the reviewers. Any product that may be evaluated in this article, or claim that may be made by its manufacturer, is not guaranteed or endorsed by the publisher.
Supplementary material
The Supplementary Material for this article can be found online at: https://www.frontiersin.org/articles/10.3389/frsip.2025.1622256/full#supplementary-material
References
Abdelazeem, M., and El-Rabbany, A. (2020). Assessment of GNSS PPP-based zenith tropospheric delay. Artif. Satell. 55 (4), 171–184. doi:10.2478/arsa-2020-0012
Baldysz, S., Nykiel, G., Baranowski, D., Latos, B., and Figurski, M. (2024). Diurnal variability of atmospheric water vapour, precipitation and cloud top temperature across the global tropics derived from satellite observations and GNSS technique. Clim. Dyn. 62, 1965–1982. doi:10.1007/s00382-023-07005-0
Barbarosa, A., Wijaya, D., Tanuwijaya, Z., Putri, N., and Kuntjoro, W. (2023). “Correlation analysis of GNSS-Derived Precipitable Water Vapor (PWV) with rainfall data in Indonesia,” in The second international seminar on Earth sciences and technology (ISEST-2023). doi:10.1088/1755-1315/1245/1/012035
Barindelli, S., Realini, E., Venuti, G., Fermi, A., and Gatti, A. (2018). Detection of water vapor time variations associated with heavy rain in northern Italy by geodetic and low-cost GNSS receivers. Earth, Planets Space 70, 28. doi:10.1186/s40623-018-0795-7
Bevis, M., Businger, S., Herring, T. A., Rocken, C., Anthes, R. A., and Ware, R. H. (1992). GPS meteorology: remote sensing of atmospheric water vapor using the Global Positioning System. J. Geophys. Res. 97, 15787–15801. doi:10.1029/92jd01517
Bevis, M., Businger, S., Chiswell, S., Herring, T. A., Anthes, R., Rocken, C., et al. (1994). GPS meteorology: mapping zenith wet delays onto precipitable water. J. Appl. Meteorology 33 (3), 379–386. doi:10.1175/1520-0450(1994)033<0379:gmmzwd>2.0.co;2
Böhm, J., Heinkelmann, R., and Schuh, H. (2007). Short note: a global model of pressure and temperature for geodetic applications. J. Geodesy 81, 679–683. doi:10.1007/s00190-007-0135-3
Böhm, J., Möller, G., Schindelegger, M., Pain, G., and Weber, R. (2014). Development of an improved empirical model for slant delays in the troposphere (GPT2w). GPS Solutions 19 (3), 433–441. doi:10.1007/s10291-014-0403-7
Businger, S., Chiswell, S. R., Bevis, M., Duan, J., Anthes, R. A., Rocken, C., et al. (1996). The promise of GPS in Atmospheric Monitoring. Bull. Am. Meteorological Soc. 77 (1), 5–18. doi:10.1175/1520-0477(1996)077<0005:tpogia>2.0.co;2
Chen, B., Yu, W., Wang, W., Zhang, Z., and Dai, W. (2021). A global assessment of precipitable water vapor derived from GNSS zenith tropospheric delays with ERA5 NCEP FNL and NCEP GFS products. Earth Space Sci. 8 (8), e2021EA001796–22. doi:10.1029/2021ea001796
Davis, J. L., Herring, T. A., Shapiro, I. I., Rogers, A. E. E., and Elgered, G. (1985). Geodesy by radio interferometry: effects of atmospheric modeling errors on estimates of baseline length. Sci. 20, 1593–1607. doi:10.1029/RS020i006p01593
DoM, C. Y. (2024). Cyprus Department of Meteorology precipitation data. Available online at: https://www.dom.org.cy/CLIMATOLOGY/English/.
Dotzek, N., Groenemeijer, P., Feuerstein, B., and Holzer, A. M. (2009a). Overview of ESSL’s severe convective storms research using the European Severe Weather Database ESWD. Atmos. Res. 93, 575–586. doi:10.1016/j.atmosres.2008.10.020
Huang, L., Mo, Z., Xie, S., Liu, L., Chen, J., Kang, C., et al. (2021). Spatiotemporal characteristics of GNSS-derived precipitable water vapor during heavy rainfall events in Guilin, China. Satell. Navig. 2, 13. doi:10.1186/s43020-021-00046-y
Ildikó, J., and Szabolcs, R. (2018). Developing a global model for the conversion of zenith wet tropospheric delays to integrated water vapour. Acta Geod. Geophys. 2018 (53), 259–274. doi:10.1007/s40328-018-0215-2
Jin, S., Feng, G. P., and Gleason, S. (2011). Remote sensing using GNSS signals: current status and future directions. Adv. Space Res. 47, 1645–1653. doi:10.1016/j.asr.2011.01.036
Jin, S., Wang, Q., and Dardanelli, G. (2022). A review on Multi-GNSS for Earth observation and emerging applications. Remote Sens. 14, 3930. doi:10.3390/rs14163930
Kim, Y. J., Jee, J. B., and Lim, B. (2023). Investigating the influence of water vapor on heavy rainfall events in the Southern Korean peninsula. Remote Sens. 15, 340. doi:10.3390/rs15020340
Kunkel, K. E., Karl, T. R., Squires, M. F., Yin, X., Stegall, S. T., and Easterling, D. R. (2020). Precipitation extremes: trends and relationships with average precipitation and precipitable water in the contiguous United States. J. Appl. Meteorology Climatol. 59, 125–142. doi:10.1175/JAMC-D-19-0185.1
Lagler, K., Schindelegger, M., Bohm, J., and Krasna, H. (2013). GPT2: empirical slant delay model for radio space geodetic techniques. Geophys. Res. Lett. 40, 1069–1073. doi:10.1002/grl.50288
Lazoglou, G., Hadjinicolaou, P., Sofokleous, I., Bruggeman, A., and Zittis, G. (2024). Climate change and extremes in the Mediterranean island of Cyprus: from historical trends to future projections. Environ. Res. Commun. 6, 095020. doi:10.1088/2515-7620/ad7927
Lelieveld, J., Hadjinicolaou, P., Kostopoulou, E., Chenoweth, J., El Maayar, M., Giannakopoulos, C., et al. (2012). Climate change and impacts in the eastern Mediterranean and the Middle East. Clim. Change 114 (3–4), 667–687. doi:10.1007/s10584-012-0418-4
Li, L., Kuang, C. L., Zhu, J. J., Chen, W., Chen, Y. Q., Long, S. C., et al. (2012). Rainstorm nowcasting based on GPS real-time precise point positioning technology. Diqiu Wuli Xuebao 55, 1129–1136. doi:10.6038/j.issn.0001-5733.2012.04.008
Li, H., Wang, X., Wu, S., Zhang, K., Chen, X., Qiu, C., et al. (2020). Development of an improved model for prediction of short-term heavy precipitation based on GNSS-Derived PWV. Remote Sens. 12, 4101. doi:10.3390/rs12244101
Li, L., Wu, S., Zhang, K., Wang, X., Li, W., Shen, Z., et al. (2021). A new zenith hydrostatic delay model for real-time retrievals of GNSS-PWV. Atmos. Meas. Tech. 14, 6379–6394. doi:10.5194/amt-14-6379-2021
Li, L., Zhang, K., Wu, S., Li, H., Wang, X., Hu, A., et al. (2022). An improved method for rainfall forecast based on GNSS-PWV. Remote Sens. 14, 4280. doi:10.3390/rs14174280
Liu, J., Chen, X., Sun, J., and Liu, Q. (2017). An analysis of GPT2/GPT2w+Saastamoinen models for estimating zenith tropospheric delay over Asian area. Adv. Space Res. 59 (3), 824–832. doi:10.1016/j.asr.2016.09.019
Marut, G., Hadas, T., Kaplon, J., Trzcina, E., and Rohm, W. (2022). Monitoring the water vapor content at high spatio-temporal resolution using a network of low-cost Multi-GNSS receivers. IEEE Trans. geoscience remote Sens. 60, 1–14. doi:10.1109/tgrs.2022.3226631
Mazzarella, V., Milelli, M., Lagasio, M., Federico, S., Torcasio, R. C., Biondi, R., et al. (2022). Is an NWP-Based nowcasting System suitable for aviation operations? Remote Sens. 14, 4440. doi:10.3390/rs14184440
Mendes, V. B., Prates, G., Santos, L., and Langley, R. B. (2000). “An Evaluation of the Accuracy of Models for the Determination of the Weighted Mean Temperature of the Atmosphere,” in Proceedings of the 2000 National Technical Meeting of The Institute of Navigation, Anaheim, CA. (Manassas, VA: The Institute of Navigation), 433–438.
Moore, A. W., Small, I. J., Gutman, S. I., Bock, Y., Dumas, J. L., Fang, P., et al. (2015). National weather service forecasters use GPS PWV for enhanced situational awareness during the Southern California summer monsoon. BAMS, 1867–1877. doi:10.1175/BAMS-D-14-00095.1
Negusini, M., Petkov, B. H., Sarti, P., and Tomasi, C. (2016). Ground-Based water vapor retrieval in Antarctica: an assessment. IEEE Trans. Geosci. Remote Sens. 54, 2935–2948. doi:10.1109/tgrs.2015.2509059
Oikonomou, C., Karolos, I. A., Bitharis, S., Pikridas, C., and Haralambous, H. (2023). “Performance of a low-cost dual-frequency GNSS receiver for near real-time water vapor estimation,” in IEEE international conference on acoustics, speech, and signal processing workshops (ICASSPW), 979–8. doi:10.1109/ICASSPW59220.2023.10193342
Pan, W., Wang, S., Su, C., Yu, Y., Li, L., and Weng, S. (2024). Spatio-temporal characteristics and variability of GNSS derived atmospheric precipitable water vapor from 2010 to 2023 in Fujian province, China. Earth Space Sci. 11, e2024EA003627. doi:10.1029/2024EA003627
Patel, V. K., and Kuttippurath, J. (2023). Increase in tropospheric water vapor amplifies global warming and climate change. Ocean-Land-Atmos. Res. 2, Article 0015. doi:10.34133/olar.0015
Rόzsa, S. (2014). “Uncertainty considerations for the comparison of water vapour derived from radiosondes and GNSS,” Earth on the edge: science for a sustainable planet. Editors C. Rizos, and P. Willis (Berlin, Heidelberg: International Association of Geodesy Symposia), 139, 65–78. doi:10.1007/978-3-642-37222-3_9
Saastamoinen, J. J. (1972). Contributions to the theory of atmospheric refraction. Bull. Géodésique 105, 279–298. doi:10.1007/BF02521844
Sapucci, L. F., Machado, L., Menezes de Souza, E., and Campos, T. (2018). Global Positioning System precipitable water vapour (GPS-PWV) jumps before intense rain events: a potential application to nowcasting. Meteorol. Appl. 26, 49–63. doi:10.1002/met.1735
Sarkar, S., Kuttippurath, J., and Patel, V. K. (2023). Long-term changes in precipitable water vapour over India derived from satellite and reanalysis data for the past four decades (1980–2020). Environ. Sci. Atmos. 2023, 749–759. doi:10.1039/D2EA00139J
Schiettekatte, L. R., Garrido, M. S., and De Lacy, M. C. (2023). Use of GNSS and ERA5 precipitable water vapor based standardized precipitation conversion index for drought monitoring in the Mediterranean coast: a first case study in Southern Spain. Adv. Space Res. 72, 3946–3959. doi:10.1016/j.asr.2023.08.030
Serrano-Vincenti, S., Condom, T., Campozano, L., Escobar, L. A., Walpersdorf, A., Carchipulla-Morales, D., et al. (2022). Harmonic analysis of the relationship between GNSS precipitable water vapor and heavy rainfall over the Northwest equatorial Coast, andes, and amazon regions. Atmosphere 13, 1809. doi:10.3390/atmos13111809
Shoj, Y. (2013). Retrieval of water vapor inhomogeneity using the Japanese nationwide GPS array and its potential for prediction of convective precipitation. J. Meteorological Soc. Jpn. 91, 43–62. doi:10.2151/jmsj.2013-103
Solheim, F. S., Vivekanandan, J., Ware, R. H., and Rocken, C. (1999). Propagation delays induced in GPS signals by dry air, water vapor, hydrometeors, and other particulates. J. Geophys. Res. 104, 9663–9670. doi:10.1029/1999jd900095
Stępniak, K., and Paziewski, J. (2022). On the quality of tropospheric estimates from low-cost GNSS receiver data processing. Measurement 198, 111350. doi:10.1016/j.measurement.2022.111350
Tymvios, F., Savvidou, K., and Michaelides, S. C. (2010). Association of geopotential height patterns with heavy rainfall events in Cyprus. Adv. Geosci. 23, 73–78. doi:10.5194/adgeo-23-73-2010
Vaclavovic, P., Dousa, J., and Gyori, G. (2013). G-Nut software library - state of development and first results. Acta Geodyn. A. T. Geomater. 10 (172), 431–436. doi:10.13168/AGG.2013.0042
Van Baelen, J., Reverdy, M., Tridon, F., Labbouz, L., Dick, G., Bender, M., et al. (2011). On the relationship between water vapour field evolution and the life cycle of precipitation systems. Q. J. R. Meteorol. Soc. 137, 204–223. doi:10.1002/qj.785
Vaquero-Martinez, J., and Anton, M. (2021). Review on the role of GNSS meteorology in monitoring water vapor for atmospheric physics. Remote Sens. 13, 2287. doi:10.3390/rs13122287
Wang, P. K. (2013). Physics and dynamics of clouds and precipitation. Cambridge, UK: Cambridge University Press.
Wang, S., Xu, T., Nie, W., Jiang, C., Yang, Y., Fang, Z., et al. (2020). Evaluation of precipitable water vapor from five reanalysis products with ground-based GNSS observations. Remote Sens. 12, 1817. doi:10.3390/rs12111817
Xia, S., Jin, S., and Jin, X. (2023). Estimation and evaluation of zenith tropospheric delay from single and multiple GNSS observations. Remote Sens. 15, 5457. doi:10.3390/rs15235457
Yao, Y., Shan, L., and Zhao, Q. (2017). Establishing a method of short-term rainfall forecasting based on GNSS-derived PWV and its application. Sci. Rep. 7, 12465–11. doi:10.1038/s41598-017-12593-z
Zhang, K., Manning, T., Wu, S., Rohm, W., Silcock, D., and Choy, S. (2015). Capturing the signature of severe weather events in Australia using GPS measurements. IEEE J. Sel. Top. Appl. Earth Obs. Remote Sen. 8 (8), 1839–1847. doi:10.1109/jstars.2015.2406313
Zhang, Y., Cai, C., Chen, B., and Dai, W. (2019). Consistency evaluation ofprecipitable water vapor derived fromERA5, ERA-Interim, GNSS, andradiosondes over China. Radio Sci. 54, 561–571. doi:10.1029/2018RS006789
Zhang, Z., Lou, Y., Zhang, W., Song, W., Hong, L., and Bai, J. (2022). Correlation analysis between precipitation and precipitable water vapor over China based on 1999–2015 ground-based GPS observations. J. Appl. Meteorology Climatol. 61 (11), 1669–1683. doi:10.1175/JAMC-D-21-0200.1
Zhao, Q., Yao, Y., and Yao, W. (2018). GPS-based PWV for precipitation forecasting and its application to a typhoon event. J. Atmos. Sol.-Terr. Phy. 167, 124–133. doi:10.1016/j.jastp.2017.11.013
Zhao, Q., Liu, Y., Ma, X., Yao, W., Yao, Y., and Li, X. (2020). An improved rainfall forecasting model based on GNSS observations. IEEE Trans. Geosci. Remote Sens. 58, 4891–4900. doi:10.1109/tgrs.2020.2968124
Ziarani, R. M., Bookhagen, B., Schmidt, T., Wickert, J., Torre, A., Deng, Z., et al. (2021). A model for the relationship between rainfall, GNSS-Derived integrated water vapour, and CAPE in the Eastern central andes. Remote Sens. 13 (18), 3788. doi:10.3390/rs13183788
Zittis, G., Bruggeman, A., and Camera, C. (2020). 21st century projections of extreme precipitation indicators for Cyprus. Atmosphere 11 (4), 343. doi:10.3390/atmos11040343
Keywords: precipitable water vapor, heavy rainfall, GNSS sensors network, nowcasting, GNSS-PWV, ERA5-PWV
Citation: Giannadaki D, Oikonomou C and Haralambous H (2025) Correlation of precipitable water vapor and heavy rainfall over Cyprus using GNSS sensors network. Front. Signal Process. 5:1622256. doi: 10.3389/frsip.2025.1622256
Received: 02 May 2025; Accepted: 28 August 2025;
Published: 25 September 2025.
Edited by:
Congzheng Han, University of Chinese Academy of Sciences, ChinaReviewed by:
Jayanarayanan Kuttippurath, Indian Institute of Technology Kharagpur, IndiaVenkat Roy, Rutgers, The State University of New Jersey, United States
Fatima Zahra Hdidou, Direction de la Météorologie Nationale, Morocco
Copyright © 2025 Giannadaki, Oikonomou and Haralambous. This is an open-access article distributed under the terms of the Creative Commons Attribution License (CC BY). The use, distribution or reproduction in other forums is permitted, provided the original author(s) and the copyright owner(s) are credited and that the original publication in this journal is cited, in accordance with accepted academic practice. No use, distribution or reproduction is permitted which does not comply with these terms.
*Correspondence: Despina Giannadaki, ZGVzcGluYS5naWFubmFkYWtpQG91dGxvb2suY29t