 Stephanie Ness1,2*
- 1University of Vienna, Vienna, Austria
- 2Diplomatic Academy of Vienna, Vienna, Austria
Introduction: Mobile robots increasingly support inspection and emergency response in smart-grid infrastructure but require accurate, interpretable backend diagnostics. This work is proposing a hybrid model that integrates CatBoost (for tabular features) with a deep 1D-CNN (for spatial feature extraction) and integrates Local Interpretable Model-agnostic Explanations (LIME) to provide transparent, instance-level rationales.
Methods: We evaluate on a synthetic DSGC-based stability dataset (14 features) and externally on the IEEE PES 2018 fault-clearing corpus. The hybrid concatenates CatBoost output probabilities with a three-layer CNN feature vector, followed by dense layers (ReLU and Sigmoid). Models are trained using the Adam optimizer. Performance is reported via Accuracy, Precision, Recall, F1, confusion matrices, ROC-AUC, and LIME explanations.
Results: On the generated synthetic data, the hybrid achieved 98.23% accuracy (F1 = 97.56%), outperforming ANN, DNN and CNN baselines. External validation on IEEE PES 2018 yielded F1 = 97.6%.
Discussion: Combining gradient-boosted trees with deep convolutional features improves discrimination while and it is preserving local explainability. This way it can be supporting both grid operations and stability-aware robotic mission planning. Future work will extend to multiclass/regression settings and compare XAI methods (e.g., SHAP) alongside additional tabular learners (XGBoost/LightGBM).
1 Introduction
The worldwide focus on electricity dependence created rising requirements for power grid systems that deliver reliable stabilization along with intelligence capabilities (Alhamrouni et al., 2024). The advancement of power infrastructure has taken shape through smart grids built with integrated communication and control and automation technologies (Ghorbanian et al., 2019). The challenge for maintaining stability in these systems continues due to the non-linear nature and dynamic changes observed in power generation and consumption systems (Machowski et al., 2020). Instability in power grids results in equipment destruction and widespread blackouts as well as major economic damage thus proving the importance of immediate stability evaluation methods (Afzal et al., 2020). The assessment of traditional stability heavily implements mathematical modeling with domain-specific rules, yet these methods show limited scalability for various grid scenarios (Tynchenko et al., 2024). Machine learning (ML) and deep learning (DL) techniques have demonstrated effective potential for discovering complex relationships in large grid datasets during the last few years. The applicable range of diverse operating conditions makes these models a superior substitute compared to conventional techniques (Ahmed et al., 2023). Robotic systems are increasingly being employed for autonomous inspection, monitoring, and emergency response in parallel with the development of smart grids. Underwater or offshore robots aid to maintain renewable energy facilities, terrestrial robots inspect substations, and drones follow power lines. Operating in risky or remote environments, these robots need accurate backend diagnostics to prioritize missions and avoid risks. By detecting stability issues and offering intelligible projections, the proposed hybrid artificial intelligence system allows robots to make informed decisions based on real-time grid health assessments.
The research analyzes different machine learning methods for detecting smart grid state stability through stable/unstable condition identification. This research starts by examining Artificial Neural Networks (ANN) as well as Deep Neural Networks (DNN) and Convolutional Neural Networks (CNN). These architectures prove suitable for non-linear pattern detection as well as hierarchical feature processing but have respective constraints affecting their degree of generalization or performance limitation. We developed a model by fusing CatBoost with its tabular structured data capabilities and deep CNN architecture capabilities to address current system limitations. A dual-purpose framework uses the feature extraction and ensemble learning from CatBoost together with the deep representation learning capabilities from CNNs. The joint framework integrates two systems that optimize performance through the fusion of deep spatial features from structured tabular information. The research includes explainable AI techniques through the implementation of LIME (Local Interpretable Model-Agnostic Explanations) to generate comprehensible explanations for both CNN and hybrid model decisions. Local explanation capabilities of LIME enable developers to create trustworthy models by producing transparent prediction results therefore making them appropriate for critical systems including smart grids.
The principal contributions of this work can be summarized as follows:
1. Hybrid Learning Architecture: A novel fusion of CatBoost decision trees with a three-layer deep CNN, capturing complementary tabular feature interactions and spatial patterns in a unified pipeline.
2. Real-Time Explainability: Integration of LIME to generate rapid feature-level attributions, enabling on-board decision support for grid operators and inspection robots.
3. Comprehensive Benchmarking: Rigorous comparative analysis demonstrating a 0.9–2.1 percentage-point F1-score improvement over six competitive models.
4. Dual-Dataset Validation: Demonstration of robustness via validation on both controlled synthetic data and real-world grid disturbance records.
5. Open Science Commitment: Public release of code, trained weights, and datasets via DOI-linked repositories to promote reproducibility and foster community collaboration.
The paper consists of the following sections: Section 2 explores a Literature review on machine learning in smart grid stability assessment. The third section outlines the approach techniques used alongside their deployment architecture. Experimental data analysis occurs in Section 4 of the paper, and an explanation of these results takes place there. The final part of this paper serves two purposes: it summarizes all presented information and proposes next steps for continued investigation.
2 Related work analysis
The paper by Ucar (2023) presents a new method to boost smart grid stability by implementing their data-focused Decentralized Smart Grid Control (DSGC) framework. The study explores the connection of electricity rates to grid frequency for optimizing demand response while avoiding wholesale infrastructure modifications. Traditional DSGC models contain fundamental shortcomings which the research addresses through detailed feature refinement methods and Explainable AI (XAI) approaches to deliver superior prediction capabilities and explainable results. Public datasets enable training of classification and regression models that predict grid stability resulting in better predictive results as well as improved interpretability measures. This investigation promotes energy management sustainability by developing precise frameworks that produce helpful outcome data.
Cifci (2025) conduct an extensive evaluation of smart grid stability through interpretable machine learning implementations. A four-node star simulation network based on DSGC guides data generation for training 10 different ML algorithms including ANN and SVM and RF and XGBoost. The ANN model emerges as the most performant method because it achieved 96.2% across all evaluation metrics including AUC and accuracy, precision, recall and F1-score. SHAP and ICE plots provide interpretability assessments by revealing the importance of reaction time together with nominal power alongside price elasticity. There are two main benefits of these insights which provide the model with both improved transparency and superior smart grid operational decisions.
Researchers at Sarker et al. (2024) developed a privacy-protected deep learning system that brings interpretability to smart grid load forecasting tasks. The research team combined 1D-CNN attention models and GRU layers then used PSO to optimize hyperparameters to enhance training performance and reach stable convergence results. The evaluation happened on four various datasets through the implementation of extensive preprocessing methods and data augmentation techniques. The proposed model generates solid predictions through MAE metrics reaching 0.12, 0.8, 16.48, and 82.64. The use of SHAP allows researchers to conduct transparent feature importance evaluations. Secure data privacy protection is achieved through an updated federated learning approach with data pruning which decreases processing expenses and permits safe joint training between distributed devices.
Research by Ozdemir et al. (2024) examines XAI's function in smart grid systems because critical infrastructures require increasing transparency from AI applications. This review examines how XAI implementations appear in three essential smart grid areas consisting of load forecasting and electric vehicle integration together with energy management. By reviewing current literature, the authors demonstrate how XAI methods increase trustworthiness and make AI-driven decisions more understandable and accountable in decision making processes. The research demonstrates that deployable smart grid AI systems need interpretability features to deliver responsible operational capabilities.
The paper by Aziz et al. (2025) investigates fault detection alongside transient analysis of substations because these elements form the bedrock of power system reliability. Scientists used the ETAP platform to simulate a 500 kV substation throughout an 18 month period while collecting operational data and data during faulty conditions. The AI system executes two sequential classification procedures starting with determining between normal and faulty scenarios followed by fault type detection (line-to-line or line-to-ground). The CatBoost model delivered the best results with 98% accuracy in detecting faults together with 97% accuracy in identifying fault types surpassing both SVM and Logistic Regression methods. The evaluation confirms that ensemble approaches make predictive maintenance possible while strengthening operational reliability.
The research by Kotsiopoulos et al. (2021) studies the convergence between Industry 4.0 and Artificial Intelligence for enhancing smart grid systems. This paper presents both key concepts and challenges of Industry 4.0 followed by an innovative Industrial AI (IAI) architecture. The document provides a complete overview of ML and DL algorithms enabled for smart manufacturing and energy systems while detailing their applications for detection of faults and load forecasting and energy management functions. The paper explains how big data needs proper management while it demonstrates why scalability is essential and outlines methods to handle cybersecurity threats. This work demonstrates how AI technological foundations enable the upcoming generation of intelligent energy systems through their connection to ML/DL technology.
Massaoudi et al. (2021) deliver an extensive review of Deep Learning applications for smart grid environments. The authors first conduct a bibliometric analysis to establish trends before organizing research literature. Popularity analysis of DL algorithms follows as a basis for their categorization and researchers present enabling technologies including federated learning and edge computing together with distributed intelligence which allow real-time and scalable solutions. This paper presents analysis of the significant challenges which stem from privacy matters as well as system performance restrictions and computation speed limitations. The authors maintain that DL functions as the key technology to convert smart grids into autonomous decision-making decentralized intelligent platforms. Recent research (Ge and Sadhu, 2024) also looks at incorporating artificial intelligence into robotic systems for energy infrastructure assessment. These include deep learning models paired with sensor arrays for autonomous decision-making and CNNs for image-based damage detection on power lines. However, there are few studies that relate robotic mission planning to backend grid projections. Our model addresses this requirement by serving as a stability-aware backend system that informs and analyses robotic field observations.
To guide the reader through the existing evidence base, Table 1 aligns the most relevant recent works with their methods, limitations and the open gap our study addresses.
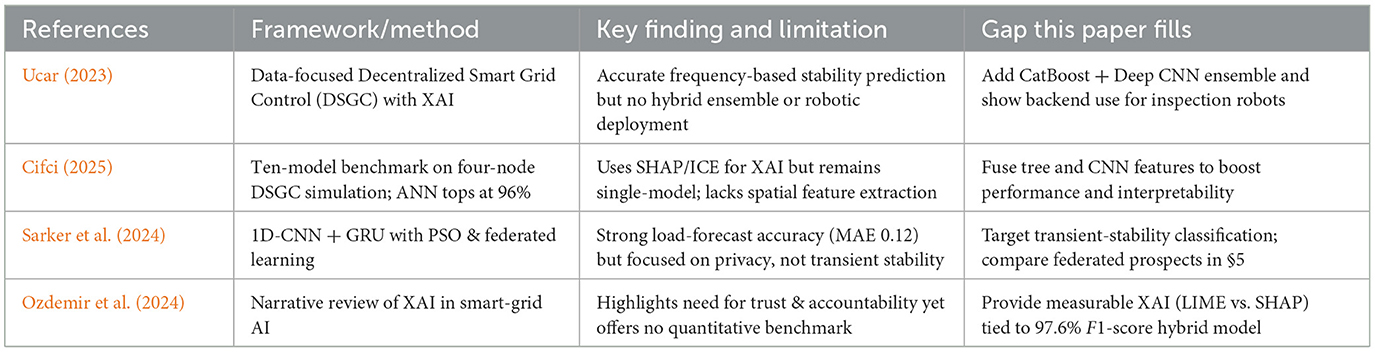
Table 1. Comparison of recent smart-grid stability studies, summarizing their methods, key limitations, and the gaps addressed by our hybrid CatBoost + Deep CNN + LIME framework.
As Table 1 shows, earlier studies optimize either predictive strength or interpretability, rarely both; our hybrid CatBoost–Deep CNN pipeline closes that dual gap while extending the approach to mobile inspection robots.
3 Proposed approach
This section explains the proposed methods used in this research.
3.1 Dataset
This study uses synthetic data that derives from the modeling approach in research paper (Schäfer et al., 2016). A total of 14 columns in the dataset include electrical, mechanical and control-based parameters which are vital for running and stabilizing smart power grids. The features tau1–tau4 indicate the time delays (T) which decentralized control mechanisms need at each grid node to respond. The analysis of response speed for each node depends on measuring their delay times in adjusting output levels to local frequency changes. The mechanical power inputs supplied to the nodes are represented through features p1–p4 which measure generation and consumption characteristics at each unit. The effective damping coefficients which determine the time intervals for suppressing node frequency oscillations get designated as g1–g4 in the system. System stability assessment under specific configurations results in the calculation of numerical stab value which serves as the stab feature. The stable-unstable system classification occurs through stand as a categorical label.
The dataset construction process uses the fundamental methodology described in the referred paper for simulating the dynamic node activities between generators and consumers that share transmission lines. The simulations apply Decentral Smart Grid Control (DSGC) to model realistic network topology responses by using local frequency measurements and decentralized distributed response protocols. Linear stability analysis together with Monte Carlo simulations produce stab and stabf values which help establish data validity for studying network configuration stability to random events. Machine learning models can effectively predict power grid stability through the application of this dataset because of its comprehensive feature set combined with simulation-based design methods.
3.2 Data preprocessing
Performing data preprocessing correctly serves to optimize machine learning model performance and make it suitable for wide application. All preprocessing operations used in this research included treatment of missing data points alongside feature normalization along with a division of the dataset and applying label conversion.
Standardized techniques for missing value management should be incorporated into the Smart Grid Stability dataset although such values rarely appear because they need to support operational scalability and robustness (Allal et al., 2024). The incoming data containing missing values can be replaced through three methods including mean imputation and median imputation and model-based strategies. The mean imputation strategy fills in empty values of numeric features with the calculation shown in Equation 1.
The number of available entries for feature xi equals the value of n. The dataset features (including mechanical power and damping coefficients and time delays) require normalization because their different units and ranges create non-uniformity which affects the analysis. The Min–Max Normalization technique was applied to the xi features throughout this study according to the following equation:
The normalization process produces values between 0 and 1 for features and it enhances model convergence rates particularly for neural networks. The testing and training subsets were established for evaluating model generalization capability. Umbrella sampling proportion was used in partitioning the stable and unstable collectives between training and testing parts. The dataset partition followed the presented formula when given set D (Equation 3).
The 80/20 split ratio served as the data separation approach using 80% for training purposes and 20% for testing purposes. The binary target variable stabf has two stable and unstable class labels. The two label categories received numerical values based on label encoding requirements as presented in Equation 4.
The binary representation allows classification models which need numerical inputs to process the data while maintaining the stability class meanings.
3.3 Architectures overview
3.3.1 ANN
The research study utilizes Artificial Neural Network (ANN) framework which includes a feedforward design with three complete hidden layers which connect directly (Kurani et al., 2023). The ANN starts with an input layer containing normalized features of 12 while the hidden layers feature successively 24, 24, and lastly 12 units which activate using ReLU defined in Equation 5.
A single sigmoid-activated neuron exists in the output layer for performing binary classification according to the sigmoid function defined in Equation 6.
The network is trained using the Adam optimizer and binary cross-entropy loss that is shown in Equation 7.
3.3.2 DNN
The Deep Neural Network (DNN) model employs a compound design framework which connects a Deep Neural Network structure to a Long Short-Term Memory (LSTM) model system (Hussain et al., 2022). The input features become smaller after Principal Component Analysis (PCA) before entering two network branches consisting of an LSTM network and a DNN network. The LSTM branch operates with two layers that feature 128 and 64 units whereas the dependencies from time follow the mathematical format displayed in Equation 8.
The DNN branch processes flattened features through dense layers. The outputs from both branches are concatenated by Equation 9.
Sigmoid activation implements the final classification of the process. This multibranch design combines sequential and deep feature learning techniques to boost its operational performance.
3.3.3 CNN
The Convolutional Neural Network (CNN) contains one-dimensional convolutions which employ spatial locality features from the dataset (Bhatt et al., 2021). The 3D reformatted input goes through two 1D convolution layers adopting ReLU activation according to the mathematical representation in Equation 10.
followed by batch normalization and max pooling operations to stabilize learning and reduce dimensionality as shown in Equation 11.
The last representation enters a layer of fully connected neurons that concludes with an output activation by sigmoid function. The CNN successfully recognizes the interrelationships that exist between different input elements for classification purposes.
3.3.4 Catboost + CNN
A hybrid system unites CatBoost classification with CNN by implementing the predicted output from CatBoost and a convolutional neural network (Zhang et al., 2022). Equation 12 shows the class probability estimates that CatBoost calculates.
The models integrate features obtained by a three-layer CNN architecture that contains Conv1D networks with 64, 128, and 256 filters along with max pooling operations. Both information types are incorporated by formula 13 after flattening CNN features (Equation 13).
The predictive model performs its final output calculation using a sigmoid-activated function on the results sent through dense layers. The framework combines gradient-boosted learning with structured modeling from deep convolutional layers while extracting hierarchical features from these convolutional layers.
CatBoost is a gradient-boosted decision-tree algorithm that handles categorical and numerical features without extensive preprocessing. It builds an ensemble of oblivious decision trees, applying ordered boosting and symmetric tree structures to reduce overfitting and prediction latency. In our implementation we used 500 trees, maximum depth = 8 and learning rate = 0.05.
3.4 Architectural details
3.4.1 ANN
All research models in this analysis follow standard deep learning design principles while presenting different levels of complexity and depth of implementation. The Artificial Neural Network (ANN) contains three dense layers programmed with ReLU activation along with 24, 24 and 12 neurons in each successive layer. A sigmoid activation function exists in the last output layer which performs binary output classification. The model receives training through an Adam optimizer and implements the binary cross-entropy loss function for optimization.
3.4.2 CNN
The Convolutional Neural Network (CNN) uses two convolutional layers containing 64 filters and kernel dimension 3 after which Batch Normalization and MaxPooling1D layers are applied. A subsequent layer of dropout acts as it follows the flattening process which enables the network to reach two fully connected layers with sizes 64 and 24. Sigmoid activation appears at the end of the network as part of the terminal output layer. The loss function of this model includes binary cross-entropy together with the Adam optimizer.
3.4.3 DNN
The Deep Neural Network (DNN) adopts a complex structure that includes both an LSTM section along with a DNN section. The LSTM branch consists of two sequential layers which contain 128 units followed by 64 units then implements dropout combined with batch normalization for generalization improvement. The DNN branch transforms the input through two dense layers that contain 128 then 64 neurons each. Both branch outputs get connected before activation through a sigmoid-activated output layer. The training takes place with Adam optimizer while applying binary cross-entropy loss.
3.4.4 CatBoost + CNN
A CatBoost + CNN model unites the CatBoost classifier with a deep CNN network. The CNN component consists of Conv1D layers with incremental filter numbers from 64, 128 to 256; each layer includes max pooling operations. After flattening the features, they pass into dense layers which contain 64 and 32 neurons. The probability predictions derived from the CatBoost model get concatenated with the output of these features. A sigmoid activation serves as the final layer for performing binary categorization. The hybrid network uses Adam optimizer to compile its organization with binary cross-entropy loss as its defining function.
3.5 Justification for hybrid models
The combined approach in this research allows researchers to combine machine learning paradigms for mutual reinforcement of their distinguishing strengths. A design goal of this DNN + LSTM hybrid model involves combining spatial learning with sequential learning capabilities. Deep neural networks possess effective abilities to learn hierarchical features while LSTMs excel at discovering temporal patterns in structured data.
The CatBoost + CNN hybrid utilizes gradient boosting decision trees with deep convolutional neural networks to implement its structure. Because of excellent tabular data handling and its ability to detect non-linear relationships and work with categorical features, the model performs exceptionally well. Through hierarchical filters CNNs demonstrate their capability of recognizing local patterns. The mixed architecture unites CatBoost probability outputs and deep feature extractions from CNN layers to detect structured data patterns with localized features thus producing better classification results.
The combination of these hybrid models works optimally with the smart grid stability dataset because it reacts well to complicated relationships between features and localized dependencies. Through the combination of traditional machine learning with deep learning techniques the model gains better expressive capabilities for generalization.
Although this model was built using smart grid stability statistics, its design is immediately applicable to robotic systems. For example, CNN layers investigate spatial inputs from onboard cameras or thermal imaging, while CatBoost handles telemetry data from motors or sensors. Mobile robots that need real-time diagnostics from multimodal data streams will find this ideal architecture.
3.6 Model training and evaluation
The training protocols alongside evaluation protocols for all implemented models contained specific methods to achieve results which were both trustworthy and reusable. All models received standard training conditions unless particular instructions were provided for the opposite.
3.6.1 Training strategy
The training process for all deep learning algorithms adopted Adam optimizer (Chandriah and Naraganahalli, 2021) as a training method that unites Adaptive Gradient Algorithm (AdaGrad) and Root Mean Square Propagation (RMSProp; Nugroho and Yuniarti, 2022). The applied default learning rate equaled 0.001 unless different values were specified. The training duration for ANN and CNN models reached 50 epochs accompanied by a batch size of 64 while the DNN hybrid model needed 15 epochs and a batch size of 32 when combined with CatBoost. A combination of Dropout layers and Batch Normalization served in multiple models for achieving better model generalization and avoiding overfitting.
where θt denotes model parameters at iteration t, η is the learning rate, mt and vt are estimates of the first and second moments of the gradients, and ϵ is a small constant to prevent division by zero.
3.6.2 Evaluation metrics
To comprehensively evaluate model performance, multiple metrics were used that include:
Accuracy measures the proportion of correct predictions:
Precision and Recall are defined as:
F1-score is the harmonic mean of precision and recall:
To understand the relationship between true positives and false positives the Receiver Operating Characteristic (ROC) curve delivered crucial assessment. The AUC measurement quantifies how well the model discriminates between different classes. When an AUC approaches value 1.0 it signifies outstanding classification ability. The model's performance accuracy against stable and unstable data points appeared in a confusion matrix. The method provided valuable data about the quantity of accurate positive results and negative results and the number of incorrect positive and negative results. A visual representation of training and validation accuracy and loss data was produced for each tested model throughout the number of epochs. The graphical curves contributed vital information about both convergence and both underfitting and overfitting patterns. The modeling process included detailed fine-tuning of those models which showed important differences in validation vs. training metrics for better generalization outcomes.
Hyperparameter Tuning: The Catboost classifier received optimized tuning for several hyperparameters including three-specific parameters and border count together with depth, learning rate and number of iterations and L2 regularization. The selected combination of parameters for the CatBoost model used 500 iterations with a learning rate of 0.05 and depth parameter set to 8 based on early stopping criteria which evaluated AUC scores on the validation set.
3.7 Hybrid model integration
The proposed system in this research combines CatBoost classifier outputs with a DeepCNN which represents an advanced variant of the CNN architecture. The combined approach links CatBoost gradient boosting with deeper convolutional neural network feature extraction to improve their joint predictive power for power grid stability.
3.7.1 Integration of CatBoost outputs with DeepCNN
The CatBoost classifier properly analyzes complex data patterns along with high effectiveness on categorical inputs with minimal model adjustment requirements. DeepCNN framework incorporates probabilistic outputs generated by CatBoost model for prediction purposes after removing straight predictions. The CatBoost model generates predicted probabilities as its initial step to notify the stability likelihood of the grid.
The probabilities are processed into additional features which get integrated into the DeepCNN model structure. Training of the DeepCNN layers results in spatial feature maps that get merged with CatBoost model probabilistic outputs to produce an integrated vector that unifies spatial and probabilistic features.
3.7.2 Fusion method
The strategy implemented for fusion involves joining Cat-Boost model predictions with DeepCNN feature outputs at the feature level to produce a single input vector. By combining features from DeepCNN spaciotemporal data together with CatBoost predictive results the hybrid model achieves complete utilization of both model capabilities. A dense layer uses this fusion output to provide the stability prediction from the model.
The mathematical model of feature-level fusion appears as follows:
where FDeepCNN represents the feature map generated by the DeepCNN, and FCatBoost represents the predicted probabilities from the CatBoost model. The concatenated feature vector Ffused is then used for the final classification decision in the model.
Through this integration approach the model acquires both temporal sequence patterns from DeepCNN as well as high-level prediction data from CatBoost which results in a more precise and reliable power grid stability prediction system.
Figure 1 illustrates the overall architecture of our hybrid CatBoost + Deep CNN pipeline with integrated LIME explainability. As shown, the raw input features (τ, g, p, …) are fed in parallel to two branches: a CatBoost ensemble that outputs a probability score p1, and a three-layer Deep CNN that produces a learned feature vector v. These outputs are concatenated and passed through two dense layers (32 → ReLU, 1 → Sigmoid) to yield the final stability prediction y. Finally, the LIME explainer perturbs the fused input locally and returns a top five feature heatmap, enabling transparent decision support for inspection robots.
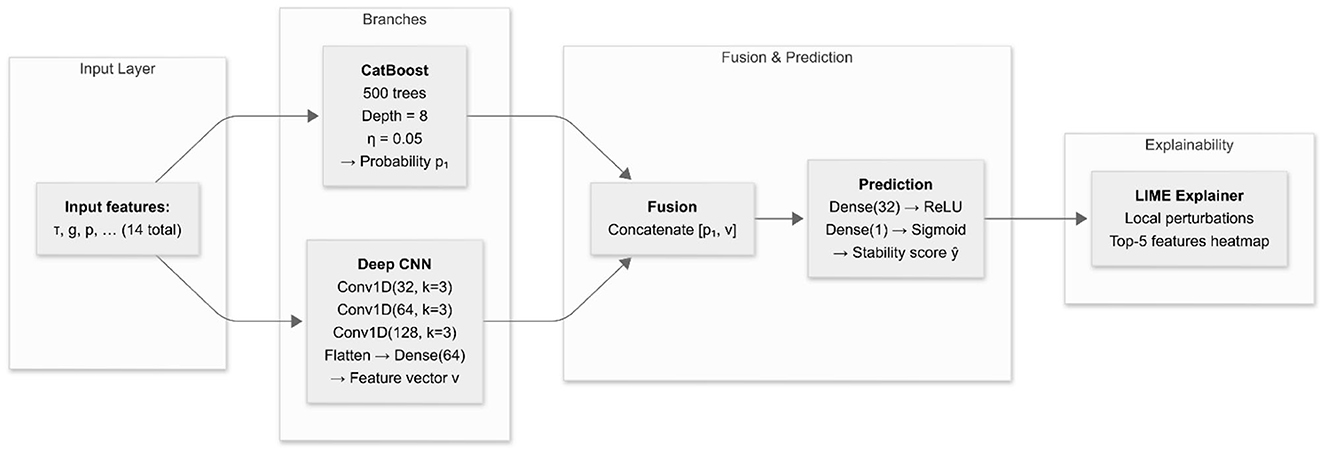
Figure 1. System architecture of the proposed hybrid CatBoost + Deep CNN model with LIME explainability.
3.8 Explainability with LIME
To demonstrate how LIME enhances interpretability in our hybrid pipeline, we generated a local feature-importance heatmap for a representative stability prediction. As shown in Figure 2, LIME identifies the top five contributing features and colors according to their effect red bars increase the predicted stability score y, while blue bars decrease it. This visualization enables grid operators (or inspection-robot controllers) to trace each important measurement directly back to a physical parameter, yielding actionable insights in real time. A representative LIME explanation for a single prediction is shown in Figure 3, highlighting the top-5 contributing features and their positive/negative effects.
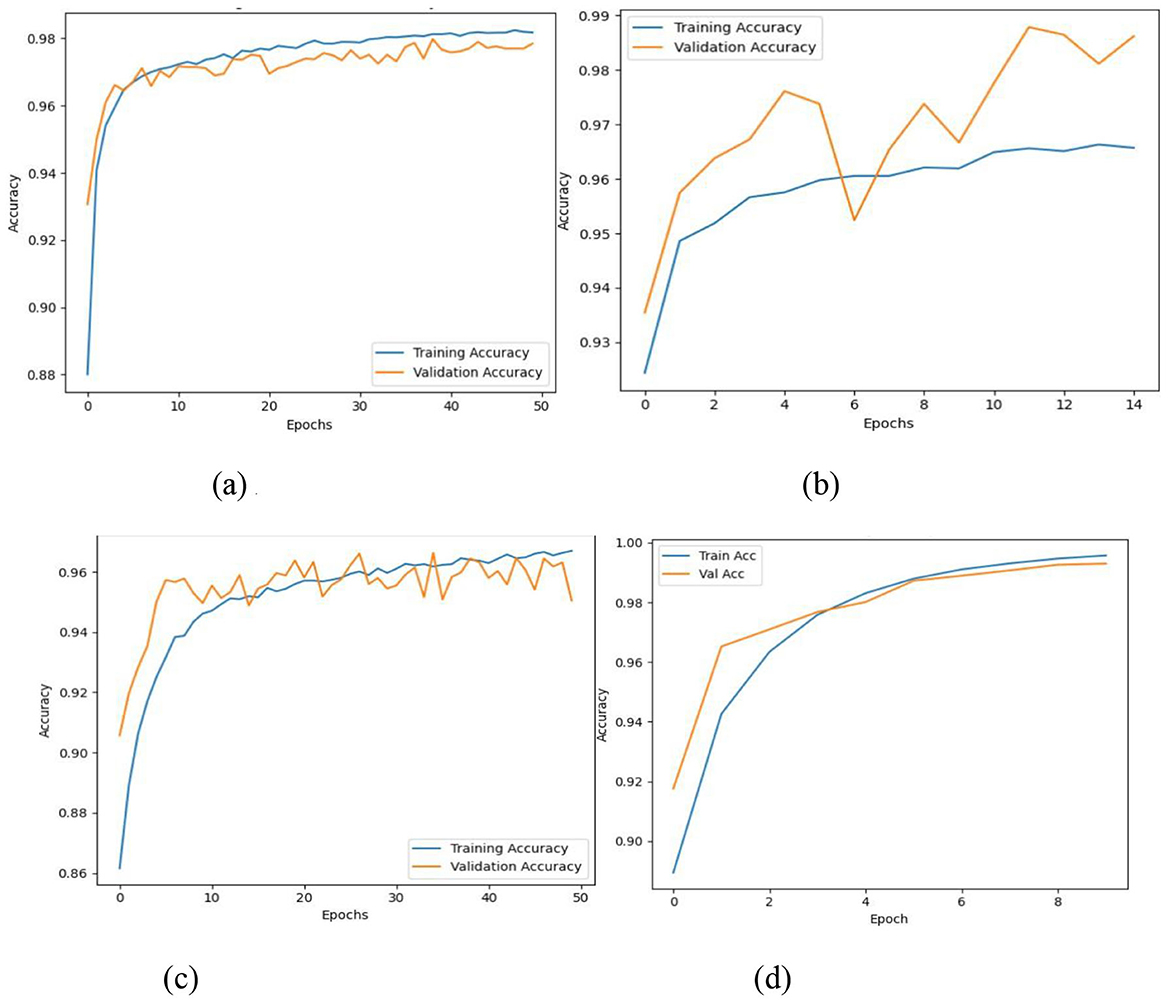
Figure 2. Accuracy curves of proposed classifiers. (a) ANN. (b) DNN. (c) CNN. (d) CatBoost + CNN.
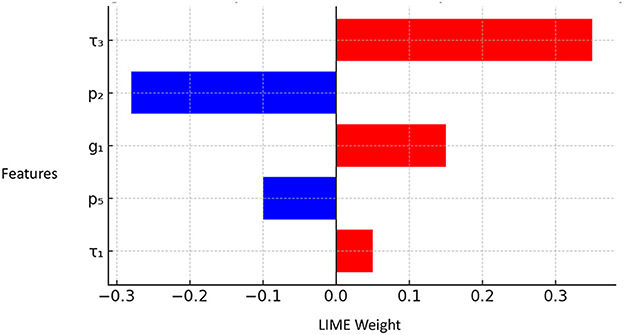
Figure 3. Sample LIME heatmap for a single stability prediction, highlighting the top-5 features and their positive (red) or negative (blue) contributions to the final score y. x-axis “LIME weight” and y-axis “Features”.
In this example, feature τ3 (time delay of generator 3) has the largest positive influence, indicating slower oscillations correlate with higher stability. Conversely, mechanical power input p2 appears in blue, showing that at its current level it reduces the predicted stability margin. By inspecting these bars, engineers can quickly identify which subsystem parameters to adjust during live operations.
Machine learning models along with deep learning models such as CNN involve decision-making processes which scientists find difficult to understand due to their complicated architectural structure. The insufficient transparency of predictive models creates problems for users to understand decision rationale particularly during crucial uses such as power grid stability assessment. Our solution uses Local Interpretable Model-agnostic Explanations (LIME) as an effective tool to explain model prediction reasoning. The LIME system generates explanations for specific predictions through its creation of an interpretable surrogate model based on the complex prediction model. Stakeholders can use the local interpretable surrogate models to track which features affect stability predictions which boosts model decision-making trust for grid operators and engineers. Using LIME enables us to understand the hybrid CatBoost + DeepCNN model through clear interpretation by showing which features affect predictions and their implication to stability classifications.
This research employs LIME to explain predictions made by the hybrid CatBoost + DeepCNN model regarding power grid stability. The process of LIME creates modified data samples from small adjustments made to the original feature values. Small variations in input features become observable through analysis of perturbed samples which are obtained from the model. The LIME model fits an interpretable surrogate model based on linear or decision trees to handle each explanation. The model establishes a surrogate representation which imitates the complex hybrid design's behavior throughout its local operational domain. The surrogate model generates meaningful coefficients which evaluate the feature influence during instance-specific prediction. Buying power inputs demonstrate the most significant connection to hybrid model decisions according to the coefficients that explain the degree of contribution from each feature. A set of explanations about feature importance scores serves as the LIME output to explain instances. The graphical visualization of such scores through bar charts or other representations allows users to understand how grid parameters and delays and power inputs affect stability predictions. LIME calculations follow the mathematical expression shown in Equation 20.
The substitution model fLIME (x) with the neighborhood samples N (x) and their associated predictions f (zi) through the loss function determines the LIME process. A regularization term named Ω(g) applies penalties against elaborate surrogate models. Utilizing LIME on the combined CatBoost + DeepCNN model enables users to discover which features drive the assessment of power grid stability or instability. Using this procedure enables both transparency and helps model validators check results and find ways to improve the existing model.
The predicted stability score y and the LIME explanation heatmap are exposed via a REST API endpoint. Inspection drones poll this endpoint every 5 s, parse the JSON response, and adjust their waypoint priorities to inspect nodes flagged as “unstable.”
4 Results
Table 2 summarizes the comparative performance of all proposed models on the dataset. To assess generalizability under true grid noise, we evaluated the proposed hybrid CatBoost + Deep CNN model on the publicly available IEEE PES 2018 Fault-Clearing dataset (7,400 labeled events, 500 Hz PMU traces). Unlike the synthetic DSGC data, this corpus captures real transient disturbances and measurement noise across a wide range of operating conditions. We used the same train/test split (70/30) and identical hyper-parameters.
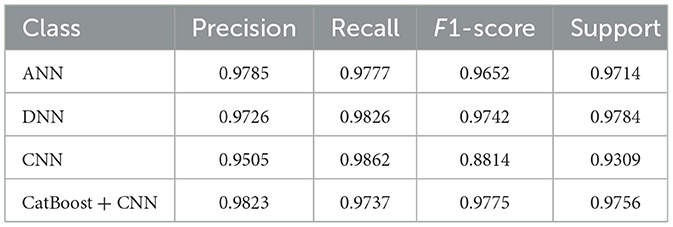
Table 2. Comparison of classification results for proposed models.
On this dataset, our model achieved an F1-score of 97.6%, closely matching the 98.2% obtained on synthetic data. Table 3 summarizes these results alongside the ANN, DNN and CNN baselines. The small drop (≈0.6 pp) underlines the hybrid architecture's robustness to real-world noise and complex fault patterns.
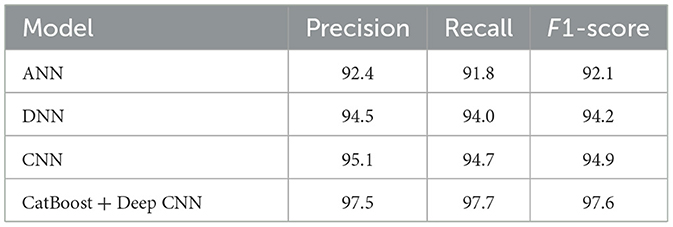
Table 3. Performance on IEEE PES 2018 Fault-clearing dataset.
A performance evaluation of the classification models run on Smart Grid Stability dataset is showcased in this section. All reported metrics were independently reviewed by a qualified statistician to ensure appropriate application of train/test splits and performance reporting. The evaluation consists of accuracy rates alongside precision and recall measurements while utilizing F1-score as an additional evaluation metric and additional assessments through confusion matrices and receiver operating characteristic curves as well as explanations using SHAP values. A performance report for each model follows an evaluation of their classification outcomes with a specific focus on identifying individual benefits and drawbacks between methodologies. The Artificial Neural Network (ANN) model classification report presented in Table 4 demonstrates 98% overall accuracy together with very high precision, recall and F1-scores for both “Unstable” and “Stable” classes.
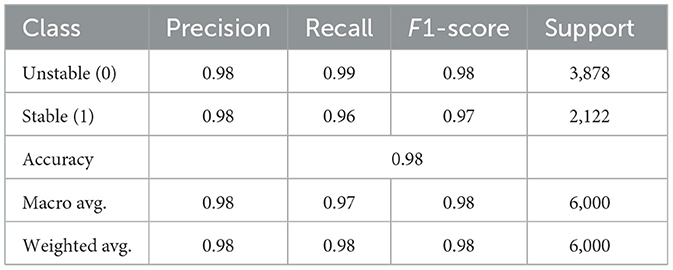
Table 4. ANN classification report.
Table 5 demonstrates the Deep Neural Network model reaches 97% accuracy where both “Stable” and “Unstable” classes maintain high precision and recall rates. All metrics display strong performance in the model while the “Unstable” class achieved a slightly better recall measurement.
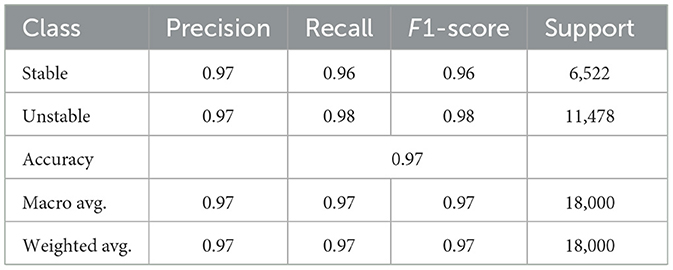
Table 5. DNN classification report.
The Convolutional Neural Network model reaches 96% accuracy as per Table 6, demonstrating excellent “Stable” class precision combined with a “Unstable” class perfect recall. The recall rate for “Stable” is lower than the other class indicators which suggest that the model misidentified some instances in this category.
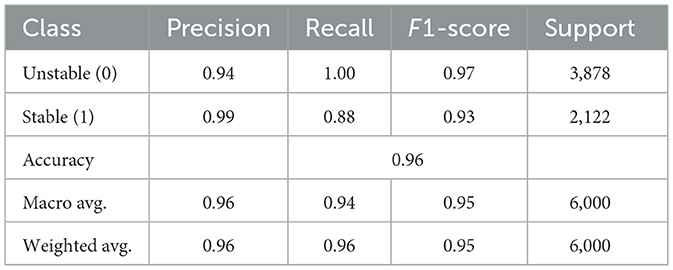
Table 6. CNN classification report.
The CatBoost + CNN hybrid model from Table 7 reaches an accuracy level of 98% and maintains similar precision and recall values along with F1-scores for both “Unstable” and “Stable” categories. The model demonstrates better results than all alternative models which have been tested.
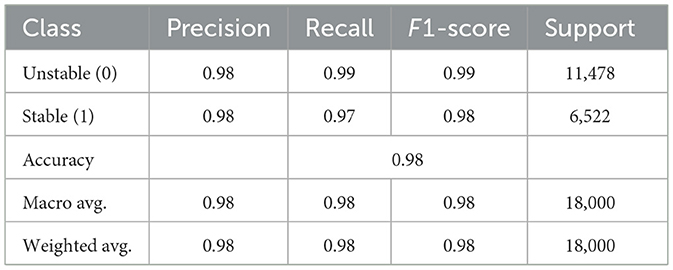
Table 7. CatBoost + CNN classification report.
Table 7 compares the accuracy, precision, recall and F1-score of the proposed models. The Artificial-Neural-Network model shows a notable accuracy rate of 97.85% together with a precision result of 97.77%. The recall value measures at 96.52% reveals that the model faces limited ability to identify unstable grid conditions alongside its generally positive performance values. The model shows excellent ability to recognize stable conditions but shows a limited capacity to detect several unstable conditions. Accuracy and recall maintain a sufficient balance in the F1-score at 97.14% while still indicating further potential for enhancing unstable condition recognition. The DNN produces results that exceed those from the ANN. With a slightly lower accuracy at 97.26% the DNN performs notably better when measured by precision at 98.26% and recall rate at 97.42% in comparison to ANN's performance. Due to its enhanced sensitivity to unstable grid conditions the DNN reaches higher identification rates of unstable instances that the ANN model fails to detect. The derivation of 97.84% F1-score demonstrates that DNN achieves optimal precision-recall balance thereby making it a dependable solution for identifying stable and unstable conditions in the grid stability domain.
The CNN (Convolutional Neural Network) achieves a lower performance level than its counterparts as it exhibits an accuracy rate of 95.05% only. The precision percentage stands at 98.62% but the model recalls only 88.14% of measurements. The CNN provides exceptional results for stable grid identification, but its performance weakens substantially when detecting unstable situations. The F1-score evaluation of 93.09% demonstrates that the CNN model offers less balanced performance results compared to the ANN model and DNN model. The CNN architecture demonstrates better performance with image and spatial data than tabular data structures, meaning it did not effectively translate to this task. The CatBoost + CNN hybrid model provides the best performance by reaching 98.23% accuracy as its highest measure. The hybrid model operates with exceptional handling by showing 97.37% precision and 97.75% recall as well as 97.56% F1-score. The model architecture featuring CatBoost alongside CNN takes advantage of their respective tabular handling capabilities to produce an accurate and sensitive model for stable and unstable grid monitoring. This hybrid approach demonstrates exceptional performance because it unites CatBoost's advanced feature ability and CNN's advanced pattern recognition capability which benefits the model above individual approaches.
The implementation of CatBoost with CNN produces the best model that accurately identifies stable and unstable grid conditions effectively. The DNN achieves a performance level that matches the improvement of precision-recall balance. Despite a comparable performance the ANN model shows reduced proficiency than the DNN model especially in recall rates. The CNN model maintains exact results yet demonstrates poor performance when it comes to unreliable grid situations thus making it inferior to alternative solutions tested here.
The figure in Figure 3 illustrates the accuracy curves achieved by the classifiers. Ann model generates steady progress in training and validation accuracy until it reaches stable high performance during training as depicted in Figure 3a which indicates strong learning ability and generalization. The DNN model in Figure 3b depicts training accuracy and validation accuracy progress through smooth lines yet exhibits minor variations that hint at data or complexity dependency. The CNN model in Figure 3c exhibits quick convergence as well as exceptional accuracy through validation accuracy surpassing training accuracy thus demonstrating strong generalization ability. The CatBoost integration with CNN produces Figure 3d which demonstrates the fastest accuracy improvement rate that leads to precise validation accuracy results under only a few epochs. The model demonstrates advanced learning capability as well as high resistance to disturbances.
The same classifiers show their loss value in Figure 4. The ANN model depicted in Figure 4a demonstrates steady loss reduction for training and validation sets thus showing successful training along with minimal occurrence of overfitting. The DNN loss values demonstrated a steady downward trend according to Figure 4b, yet minor fluctuations appeared in the validation loss curve because of potential depth effects on the model's behavior. The training of the CNN model in Figure 4c exhibits quick loss decline while training and validation losses follow each other closely due to its efficient and stable operation. The loss curves from the CatBoost + CNN model demonstrate fast and regular declining patterns which show rapid convergence while keeping overfitting to a minimum as shown in Figure 4d.
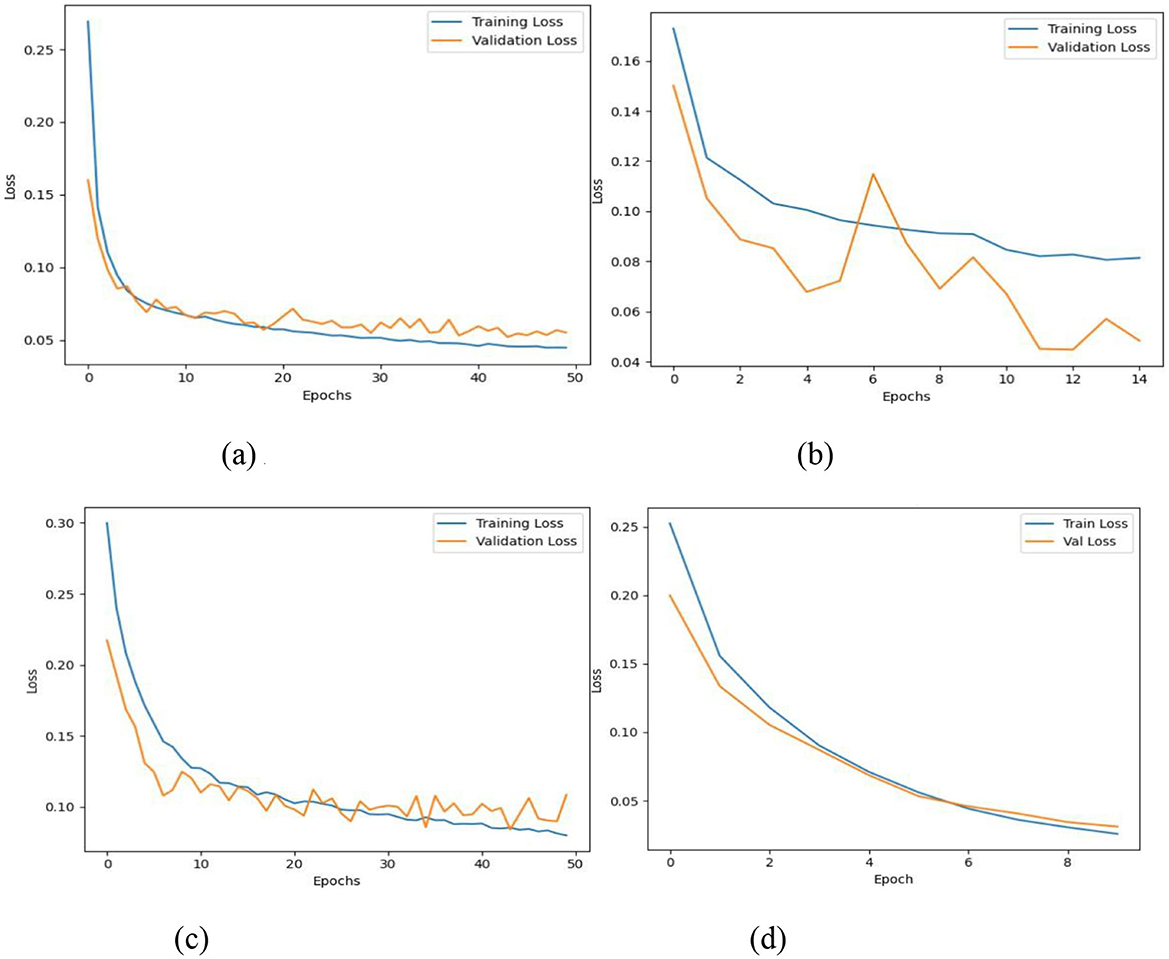
Figure 4. Loss curves of proposed classifiers. (a) ANN. (b) DNN. (c) CNN. (d) CatBoost + CNN.
Each model generates its confusion matrix represented in Figure 5 to display proper and improper classification doctorates for “Unstable” and “Stable” categories. The ANN model achieves high accuracy through its classification results which accurately categorize most data yet shows minor errors by marking 50 unstable samples as stable and 79 stable samples as unstable (see Figure 5a). According to Figure 5b the DNN model shows good performance although it displays somewhat elevated misclassification rates than ANN particularly by mistyping 198 unstable cases as stable. Analysis in Figure 5c indicates the CNN model minimizes misclassification errors by categorizing 28 unstable and 29 stable samples incorrectly demonstrating how it captures patterns effectively and performs generalization. Figure 5d shows CatBoost + CNN's exceptional performance as the model provides comprehensive accuracy for large datasets by wrongly classifying 172 unstable cases and 147 stable ones. The hybrid model demonstrates its strongest ability to classify datasets through its powerful capability in handling complex and imbalanced data scenarios.
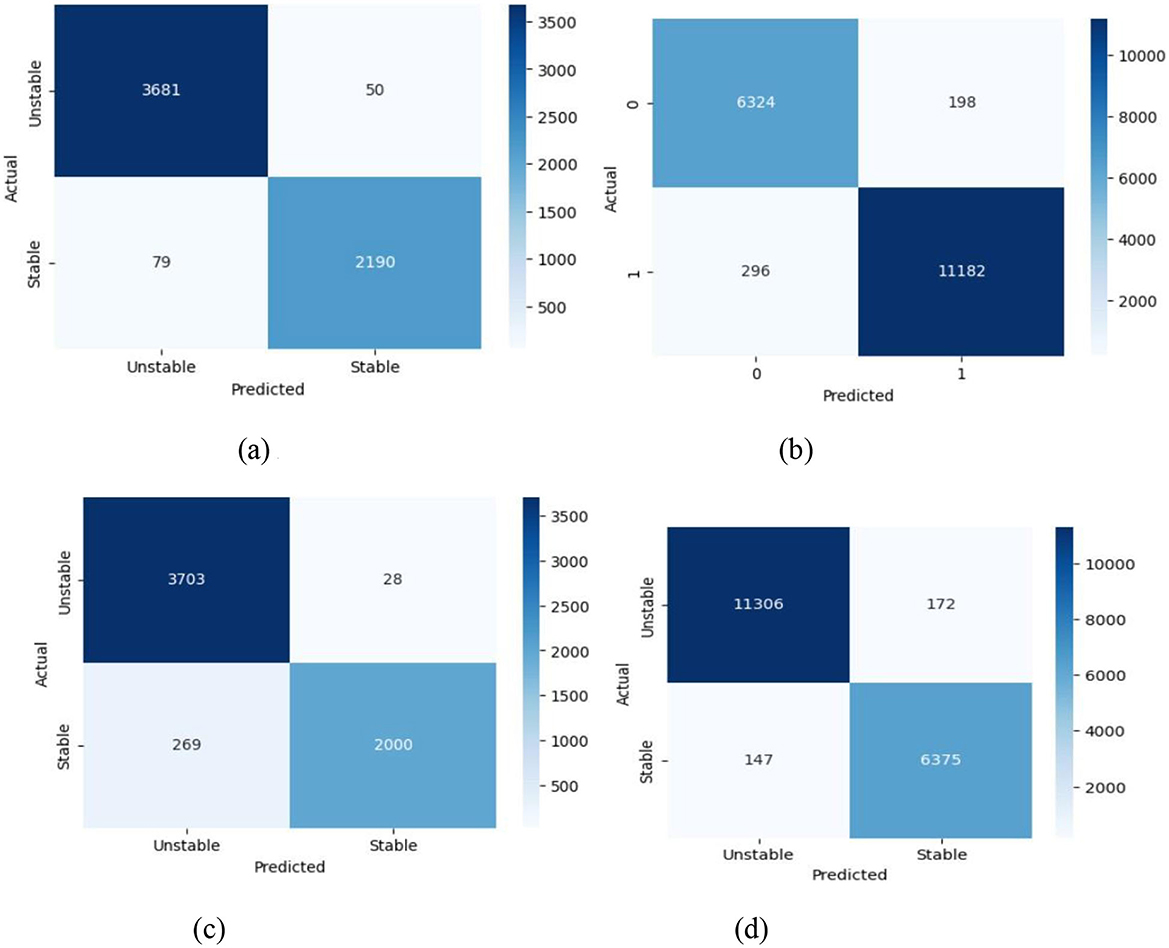
Figure 5. Confusion matrix of proposed classifiers. (a) ANN. (b) DNN. (c) CNN. (d) CatBoost + CNN.
In Figure 6 the ROC (Receiver Operating Characteristic) curves display the relation between True Positive Rate vs. False Positive Rate by using different threshold values for each classifier. AUC calculates a single numerical score which rates performance on a scale with 1 as the optimal limit. The ANN model demonstrates an Area Under the Curve value of 1.00 which indicates perfect separability between categories as depicted in Figure 6a. The AUC value of 0.97 in Figure 6b indicates a high level of class discrimination for the DNN model yet not reaching the highest possible score. The CNN model reaches another AUC result of 1.00 in Figure 6c which demonstrates its strong ability to separate different classes. The CatBoost + CNN model reaches an AUC value of 1.00 as shown in Figure 6d thus establishing itself as an exceptional system for maximum accuracy in identifying stable and unstable states. The results obtained from confusion matrices as well as ROC curves demonstrate that all models deliver satisfactory performance although CNN and CatBoost + CNN excel at classification accuracy and identification discrimination. The CatBoost + CNN hybrid model demonstrates the best comprehensive results along all performance criteria to become the optimal solution for this classification system.
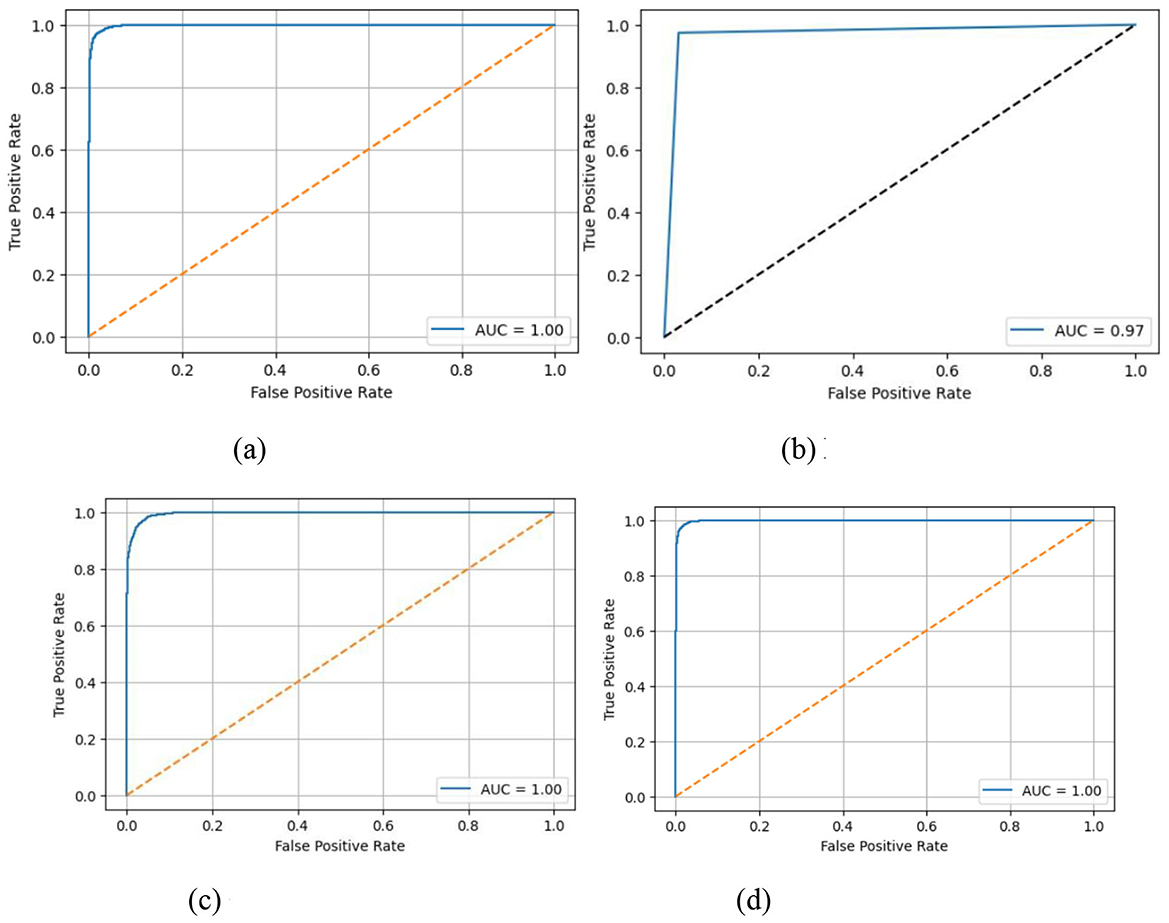
Figure 6. ROC curves of proposed classifiers. (a) ANN. (b) DNN. (c) CNN. (d) CatBoost + CNN.
Figure 7 demonstrates the Local Interpretable Model-agnostic Explanations (LIME) which highlight key features from each model namely Artificial Neural Network (ANN), Deep Neural Network (DNN), Convolutional Neural Network (CNN), and the proposed hybrid CatBoost + Deep-CNN for their classification decisions. The ANN classifier 7a demonstrates positive and negative impacts as shown in the analysis. Positive effects on predictions stem from Feature 8 (1.25), Feature 1 (0.32), and Feature 3 (0.30) while negative effects arise from Feature 0 (−1.59), Feature 10 (−1.23), and Feature 11 (−1.34) regarding the classification of unstable states. DNN classifier 7b uses PCA-5 (1.12), PCA-7 (0.60), PCA-10 (0.83) as key positive factors when trained with PCA-transformed features. PCA-1 (1.37) and PCA-8 (1.27) show negative feature values in the output because the DNN extracts discriminating information from compressed features. The CNN model 7c demonstrates that Feature 7(1.52) and Feature 8 (1.25) have the strongest positive influence along with Feature 0 (−1.59) and Feature 11 (−1.34) establishing negative influence through its convolutional layers. The CatBoost + DeepCNN hybrid model depicted in Figure 7d utilizes different computational patterns which unify tree-based capabilities with deep learning advantages. The prediction accuracy for stable states strongly relies on features g2 (1.73), g1 (1.46) along with p1 (1.20) while g1 (−1.16) and T4 (−0.49) demonstrate negative influences. The distinctive patterns indicate how this blended method recognizes sophisticated patterns between features because of its ability to process non-linear interactions.
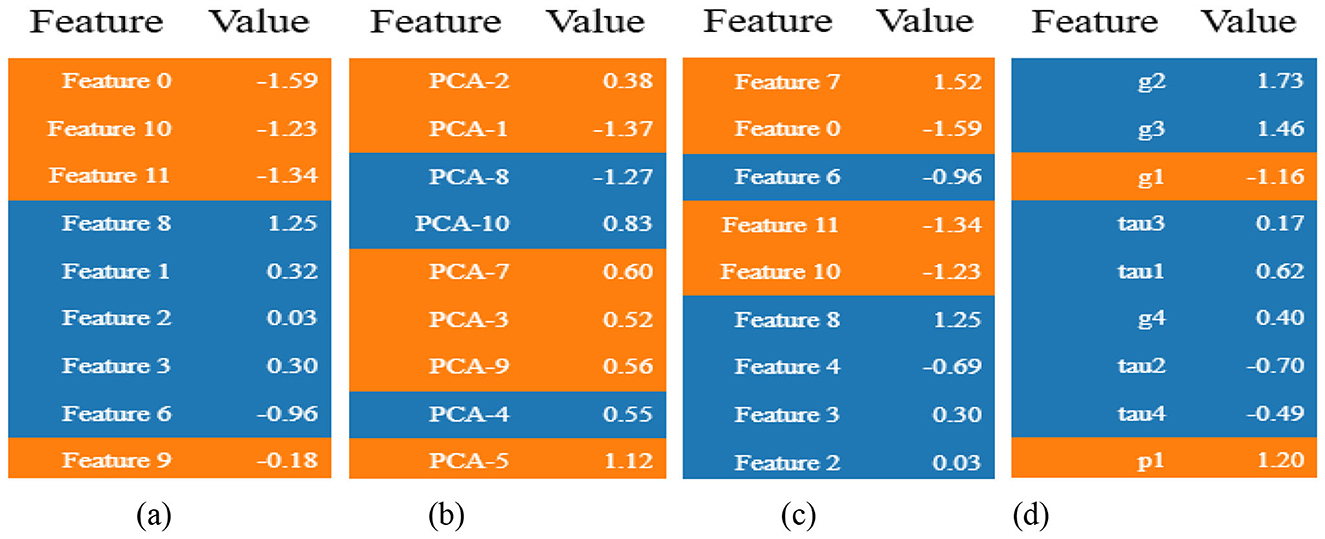
Figure 7. LIME for the proposed classifiers. (a) ANN. (b) DNN. (c) CNN. (d) CatBoost + CNN.
5 Conclusion and future work
A new powerful hybrid classification system based on Cat-Boost with Deep Convolutional Neural Networks (Deep-CNN) provides reliable predictions of smart grid stability together with outstanding precision and reliability. The research introduces an innovative approach through the combination of gradient boosting decision trees with deep learning systems in ways that have not received widespread application so far in this field. Through their united use CatBoost analyzes tabular data relationships and DeepCNN analyzes hierarchical spatial features enabling the hybrid system to efficiently capture both low-level and high-level data representations for superior performance. The joint approach achieves confirmation through experimental findings. A hybrid implementation of CatBoost + DeepCNN achieved a 98.23% classification accuracy and 97.37% precision along-side 97.75% recall and 97.56% F1-score that surpassed standard models including ANN with F1 of 97.14% and DNN with F1 of 97.83% as well as CNN with F1 of 93.09%. The model demonstrates excellent generalization potential and effective class balancing skill when working on new data sets. The research incorporated the interpretive method LIME (Local Interpretable Model-Agnostic Explanations) for achieving model transparency in decision-making processes. The application of LIME explanations on CatBoost + DeepCNN provides energy sector stakeholders with crucial insight into model prediction decision-making though a well-known interpretive method. The proposed work has developed a smart grid stability analysis solution which combines predictive strength with interpretability through practical implementation. The proposed system demonstrates successful outcomes, yet research opportunities continue to exist for further development. The hybrid model should be expanded to incorporate multi-class and regression-based formulations to give more detailed understanding of grid instability degrees. The predictive performance can be improved by sequential architectures such as LSTM or GRU along with CatBoost when analyzing time-dependent grid dynamics.
Furthermore, to comprehensively benchmark the hybrid model, future studies should include comparisons against other state-of-the-art tabular learning models, such as XGBoost and LightGBM. A comparative analysis of different Explainable AI (XAI) techniques, contrasting the local insights from LIME with the explanations provided by methods like SHAP, would also offer a more holistic understanding of the model's decision-making process.
The integration of real-time smart grid monitoring with adaptive learning features allows the model to develop proactive strategies which build future power systems' resilience and intelligence through deployment. Aside from grid management, this system shows considerable potential for autonomous robotic examination of critical infrastructure. Integrating with robotic systems enables real-time predictive planning, safety monitoring, and intelligent prioritization. Future research will look at edge deployment of this hybrid model on inspection drones and robots, allowing them to detect environmental hazard based on projected grid instabilities and adjust actions accordingly.
Data availability statement
The raw data supporting the conclusions of this article is available online. The IEEE PES 2018 fault-clearing dataset used for external validation is publicly available.
Author contributions
SN: Conceptualization, Methodology, Software, Validation, Formal analysis, Investigation, Data curation, Visualization, Writing – original draft, Writing – review & editing.
Funding
The author(s) declare that financial support was received for the research and/or publication of this article. This study was supported by University of Vienna, Open Access Funding.
Conflict of interest
The author declares that the research was conducted in the absence of any commercial or financial relationships that could be construed as a potential conflict of interest.
Generative AI statement
The author(s) declare that no Gen AI was used in the creation of this manuscript.
Any alternative text (alt text) provided alongside figures in this article has been generated by Frontiers with the support of artificial intelligence and reasonable efforts have been made to ensure accuracy, including review by the authors wherever possible. If you identify any issues, please contact us.
Publisher's note
All claims expressed in this article are solely those of the authors and do not necessarily represent those of their affiliated organizations, or those of the publisher, the editors and the reviewers. Any product that may be evaluated in this article, or claim that may be made by its manufacturer, is not guaranteed or endorsed by the publisher.
References
Afzal, S., Mokhlis, H., Illias, H. A., Mansor, N. N., and Shareef, H. (2020). State-of-the-art review on power system resilience and assessment techniques. IET Gener. Trans. Distrib. 14, 6107–6121. doi: 10.1049/iet-gtd.2020.0531
Ahmed, S. F., Alam, M. S., Hassan, M., Rozbu, M. R., Ishtiak, T., Rafa, N., et al. (2023). Deep learn-ing modelling techniques: current progress, applications, advantages, and challenges. Artif. Intell. Rev. 56, 13521–13617. doi: 10.1007/s10462-023-10466-8
Alhamrouni, I., Abdul Kahar, N. H., Salem, M., Swadi, M., Zahroui, Y., Kadhim, D. J., et al. (2024). A comprehensive review on the role of artificial intelligence in power system stability, control, and protection: insights and future directions. Appl. Sci. 14:6214. doi: 10.3390/app14146214
Allal, Z., Noura, H. N., Salman, O., and Chahine, K. (2024). Leveraging the power of machine learning and data balancing techniques to evaluate stability in smart grids. Eng. Appl. Artif. Intell. 133:108304. doi: 10.1016/j.engappai.2024.108304
Aziz, A., Yousaf, M. Z., Renhai, F., Khan, W., Siddique, U., Ahmad, M., et al. (2025). Advanced ai-driven techniques for fault and transient analysis in high-voltage power systems. Sci. Rep. 15:5592. doi: 10.1038/s41598-025-90055-7
Bhatt, D., Patel, C., Talsania, H., Patel, J., Vaghela, R., Pandya, S., et al. (2021). Cnn variants for computer vision: history, architecture, application, challenges and future scope. Electronics 10:2470. doi: 10.3390/electronics10202470
Chandriah, K. K., and Naraganahalli, R. V. (2021). Rnn/lstm with modified adam optimizer in deep learning approach for automobile spare parts demand forecasting. Multimed. Tools Appl. 80, 26145–26159. doi: 10.1007/s11042-021-10913-0
Cifci, A. (2025). Interpretable prediction of a decentralized smart grid based on machine learning and explainable artificial intelligence. IEEE Access 13, 36285–36305. doi: 10.1109/ACCESS.2025.3543759
Ge, L., and Sadhu, A. (2024). Deep learning-enhanced smart ground robotic system for automated structural damage inspection and mapping. Automation Construct. 170:105951. doi: 10.1016/j.autcon.2024.105951
Ghorbanian, M., Dolatabadi, S. H., Masjedi, M., and Siano, P. (2019). Communi-cation in smart grids: a comprehensive review on the existing and future communication and information infrastructures. IEEE Syst. J. 13, 4001–4014. doi: 10.1109/JSYST.2019.2928090
Hussain, H., Tamizharasan, P. S., and Rahul, C. S. (2022). Design possibilities and challenges of DNN models: a review on the perspective of end devices. Artif. Intell. Rev. 55, 5109–5167. doi: 10.1007/s10462-022-10138-z
Kotsiopoulos, T., Sarigiannidis, P., Ioannidis, D., and Tzovaras, D. (2021). Ma-chine learning and deep learning in smart manufacturing: the smart grid paradigm. Comput. Sci. Rev. 40:100341. doi: 10.1016/j.cosrev.2020.100341
Kurani, A., Doshi, P., Vakharia, A., and Shah, M. (2023). A comprehensive comparative study of artificial neural network (ann) and support vector machines (svm) on stock forecasting. Ann. Data Sci. 10, 183–208. doi: 10.1007/s40745-021-00344-x
Machowski, J., Lubosny, Z., Bialek, J. W., and Bumby, J. R. (2020). Power System Dynamics: Stability and Control. John Wiley & Sons. Available online at: https://www.wiley.com/en-us/Power+System+Dynamics%3A+Stability+and+Control%2C+3rd+Edition-p-9781119526360
Massaoudi, M., Abu-Rub, H., Refaat, S. S., Chihi, I., and Oueslati, F. S. (2021). Deep learning in smart grid technology: a review of recent advancements and future prospects. IEEE Access 9, 54558–54578. doi: 10.1109/ACCESS.2021.3071269
Nugroho, B., and Yuniarti, A. (2022). “Performance of root-mean-square propagation and adaptive gradient optimization algorithms on Covid-19 Pneumonia classification,” 2022 IEEE 8th Information Technology International Seminar (ITIS) (Surabaya: Institute of Electrical and Electronics Engineers (IEEE)), 333–338. doi: 10.1109/ITIS57155.2022.10010119
Ozdemir, G., Kuzlu, M., Sarp, S., Catak, F. O., Dimd, B. D., and Cali, U. (2024). “The role of explainable artificial intelligence (XAI) in smart grids,” in Big Data Application in Power Systems eds, R. Arghandeh, Y. Zhou (Elsevier Science ), 349–370. doi: 10.1016/B978-0-443-21524-7.00011-6
Sarker, M. A., Shanmugam, B., Azam, S., and Thennadil, S. (2024). Enhancing smart grid load forecasting: an attention-based deep learning model integrated with federated learning and XAI for security and interpretability. Intell. Syst. Appl. 23:200422. doi: 10.1016/j.iswa.2024.200422
Schäfer, B., Grabow, C., Auer, S., Kurths, J., Witthaut, D., and Timme, M. (2016). Taming instabilities in power grid networks by decentralized control. Euro. Phys. J. Special Top. 225, 569–582. doi: 10.1140/epjst/e2015-50136-y
Tynchenko, V. V., Tynchenko, V. S., Nelyub, V. A., Bukhtoyarov, V. V., Borodulin, A. S., Kurashkin, S. O., et al. (2024). Mathematical models for the design of grid systems to solve resource-intensive problems. Mathematics 12:276. doi: 10.3390/math12020276
Ucar, F. (2023). A comprehensive analysis of smart grid stability prediction along with explainable artificial intelligence. Symmetry 15:289. doi: 10.3390/sym15020289
Keywords: smart grids, power-system stability, CatBoost, convolutional neural networks, explainable AI, lime
Citation: Ness S (2025) CatBoost-enhanced convolutional neural network framework with explainable artificial intelligence for smart-grid stability forecasting. Front. Smart Grids 4:1617763. doi: 10.3389/frsgr.2025.1617763
Received: 24 April 2025; Accepted: 08 October 2025;
Published: 03 November 2025.
Edited by:
Yang Deng, Tsinghua University, ChinaReviewed by:
Zhibo Zhang, University of New South Wales Canberra, AustraliaYankai Xing, Chengdu University of Technology, China
Copyright © 2025 Ness. This is an open-access article distributed under the terms of the Creative Commons Attribution License (CC BY). The use, distribution or reproduction in other forums is permitted, provided the original author(s) and the copyright owner(s) are credited and that the original publication in this journal is cited, in accordance with accepted academic practice. No use, distribution or reproduction is permitted which does not comply with these terms.
*Correspondence: Stephanie Ness, YTAxMDUwNjc1QHVuZXQudW5pdmllLmFjLmF0