


- 1 Bernstein Center Freiburg, University of Freiburg, Germany
- 2 Department of Neurobiology and Biophysics, University of Freiburg, Germany
- 3 Computational Neuroscience, University of Freiburg, Germany
Movement disorders in Parkinson’s disease (PD) are commonly associated with slow oscillations and increased synchrony of neuronal activity in the basal ganglia. The neural mechanisms underlying this dynamic network dysfunction, however, are only poorly understood. Here, we show that the strength of inhibitory inputs from striatum to globus pallidus external (GPe) is a key parameter controlling oscillations in the basal ganglia. Specifically, the increase in striatal activity observed in PD is sufficient to unleash the oscillations in the basal ganglia. This finding allows us to propose a unified explanation for different phenomena: absence of oscillation in the healthy state of the basal ganglia, oscillations in dopamine-depleted state and quenching of oscillations under deep-brain-stimulation (DBS). These novel insights help us to better understand and optimize the function of DBS protocols. Furthermore, studying the model behavior under transient increase of activity of the striatal neurons projecting to the indirect pathway, we are able to account for both motor impairment in PD patients and for reduced response inhibition in DBS implanted patients.
Introduction
Parkinson’s disease (PD) is a prominent brain disorder, characterized by a host of motor and cognitive dysfunctions, caused by dopamine depletion in the basal ganglia (BG). A distinctive feature of PD is the presence of aberrant oscillations (12–30 Hz, β-band) of the local field potential in the subthalamo-pallidal (STN-GPe) network (Brown and Williams, 2005; Hammond et al., 2007; Eusebio et al., 2008). These oscillations are causally linked to deficits in movement initiation and execution, resting state tremor, and other related symptoms (Tass et al., 2010). While consensus has emerged on the existence of STN-GPe oscillations and their relevance for behavioral pathologies, the mechanisms underlying these oscillations, however, are still debated. Nevertheless, it is an empirical fact that high-frequency deep-brain-stimulation (DBS) of the STN effectively alleviates the hypokinetic disorders associated with PD (Benabid, 2003; Coffey, 2009). However, despite the success of DBS as a therapeutic protocol, also in other brain disorders (Krack et al., 2010), the mechanisms by which it quenches the β-band oscillations in PD are still only poorly understood (Benabid, 2003; McIntyre et al., 2004; Kringelbach et al., 2007; Nambu, 2008).
Here, we propose a unified explanation for the absence of oscillations in the normal state, for the emergence of oscillations in the dopamine-depleted state, and for the efficacy of DBS in quenching these oscillations in PD. Using a biologically realistic, large-scale spiking neural network model of the STN-GPe loop, we show how the strength of inhibitory input to the GPe neurons controls its oscillatory activity. Similar suggestions have been previously made using abstract firing rate based models of the basal ganglia (Gillies et al., 2002; van Albada and Robinson, 2009; van Albada et al., 2009). We would like to stress that our explanation does not rely on the prevailing assumption of potentiated synaptic coupling between the two populations (Magill et al., 2001). However, increased functional coupling between STN and GPe could be both a cause and consequence of altered activity in these networks. Here, we explore the possibility of obtaining oscillatory activity in the STN-GPe network without explicitly scaling up the synaptic coupling between the two neuron populations. Specifically, we show that increased inhibition to GPe neurons from upstream brain areas, as observed in the dopamine-depleted striatum in PD, unleashes oscillations. By contrast, increased inhibition to STN neurons restrains them. This novel insight into basal ganglia function and dysfunction also provides new understanding of DBS functioning, and it is used here to suggest innovative and more effective DBS protocols.
Materials and Methods
Large-Scale Spiking Network Model of GPe and STN
We simulated a network of 3,000 neurons, of which 1,000 excitatory neurons were assigned to the STN population and the remaining 2,000 inhibitory neurons to the GPe population. Neurons were implemented as leaky-integrate-and-fire (LIF) neurons. Passive properties of the neurons were drawn from a distribution to introduce heterogeneity into the network (cf. Tables 1 and 2). Neurons in the GPe population received excitatory synaptic input from the STN (connection probability 5%; Kita and Kitai, 1991) and inhibitory synaptic inputs from other GPe neurons (connection probability 2%; Kita and Kitai, 1994; Sadek et al., 2007). STN neurons received inhibitory connections from the GPe (connection probability 5%; Bevan et al., 1997; Baufreton et al., 2009; cf. Tables 1 and 2). Published literature suggest that there is only very little recurrent excitatory connections within the STN (Hammond and Yelnik, 1983; Sato et al., 2000), thus, in our model STN received excitatory synaptic inputs from other STN neurons with a connection probability of 2%. Synaptic input was modeled as transient conductance changes, using exponential functions. The synaptic weights are provided in the Table 2. Note that the results of the model are not critically dependent on the exact values of synaptic strengths and other network parameters.
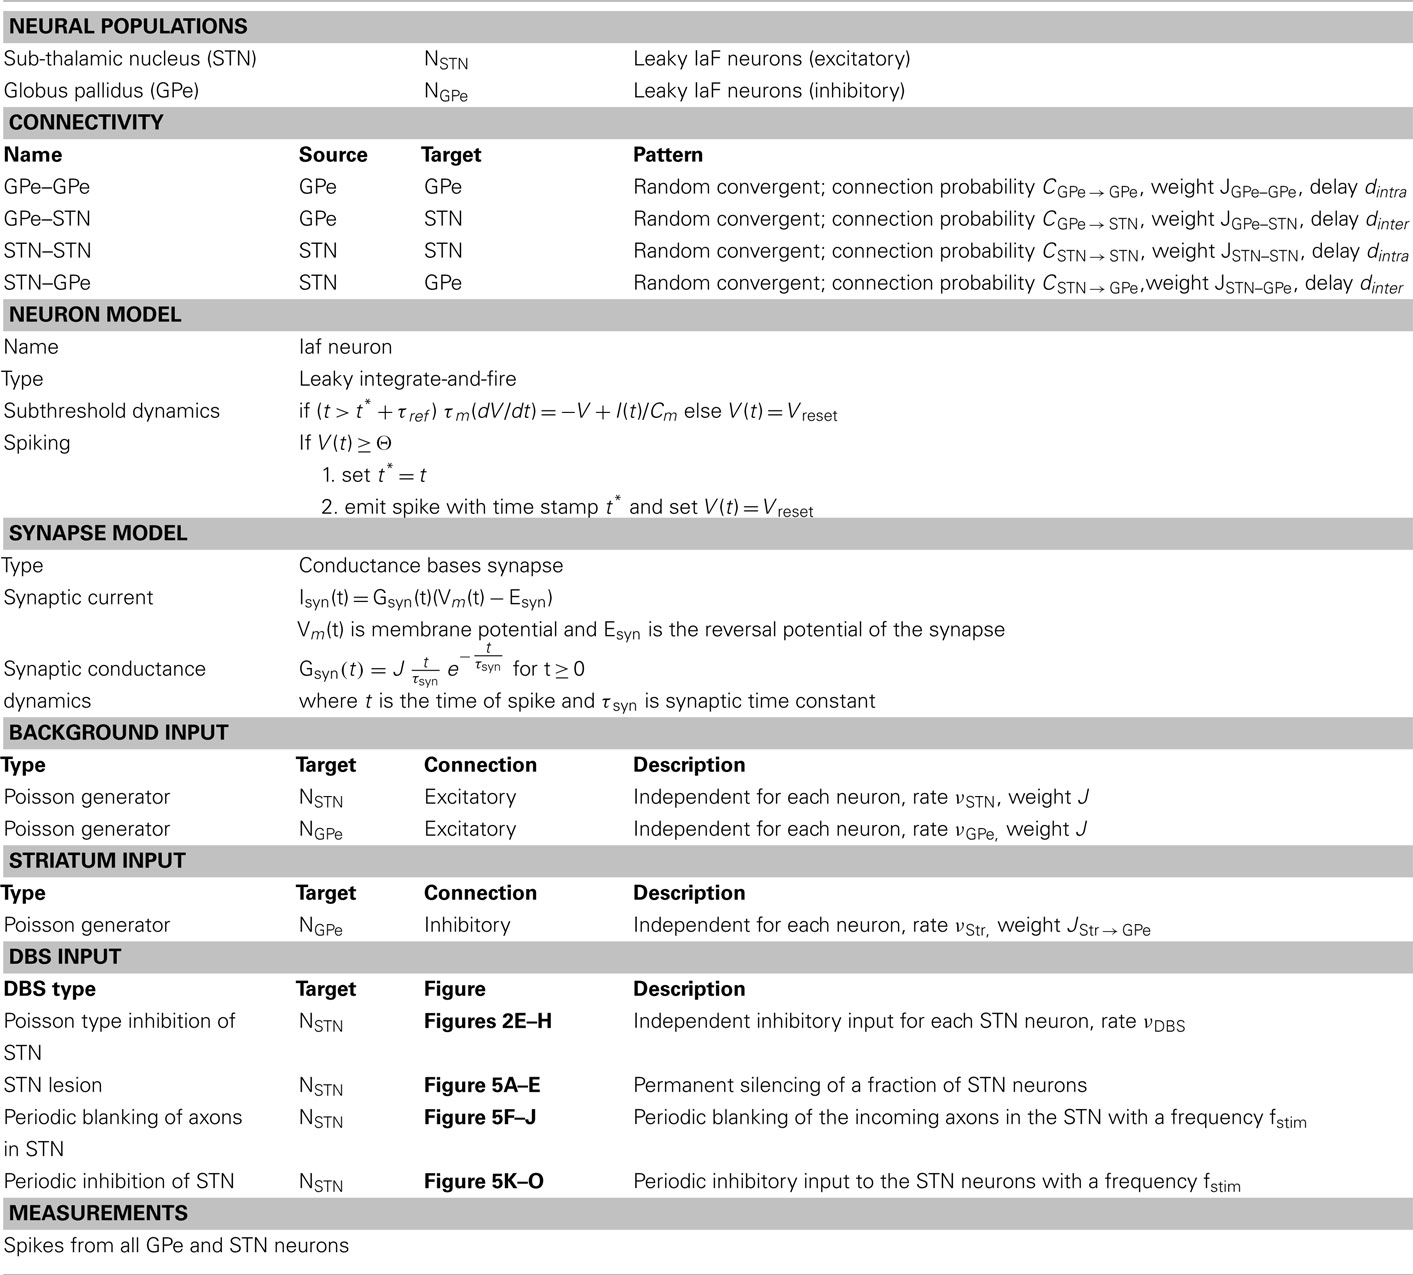
Table 1. Tabular description of network model.
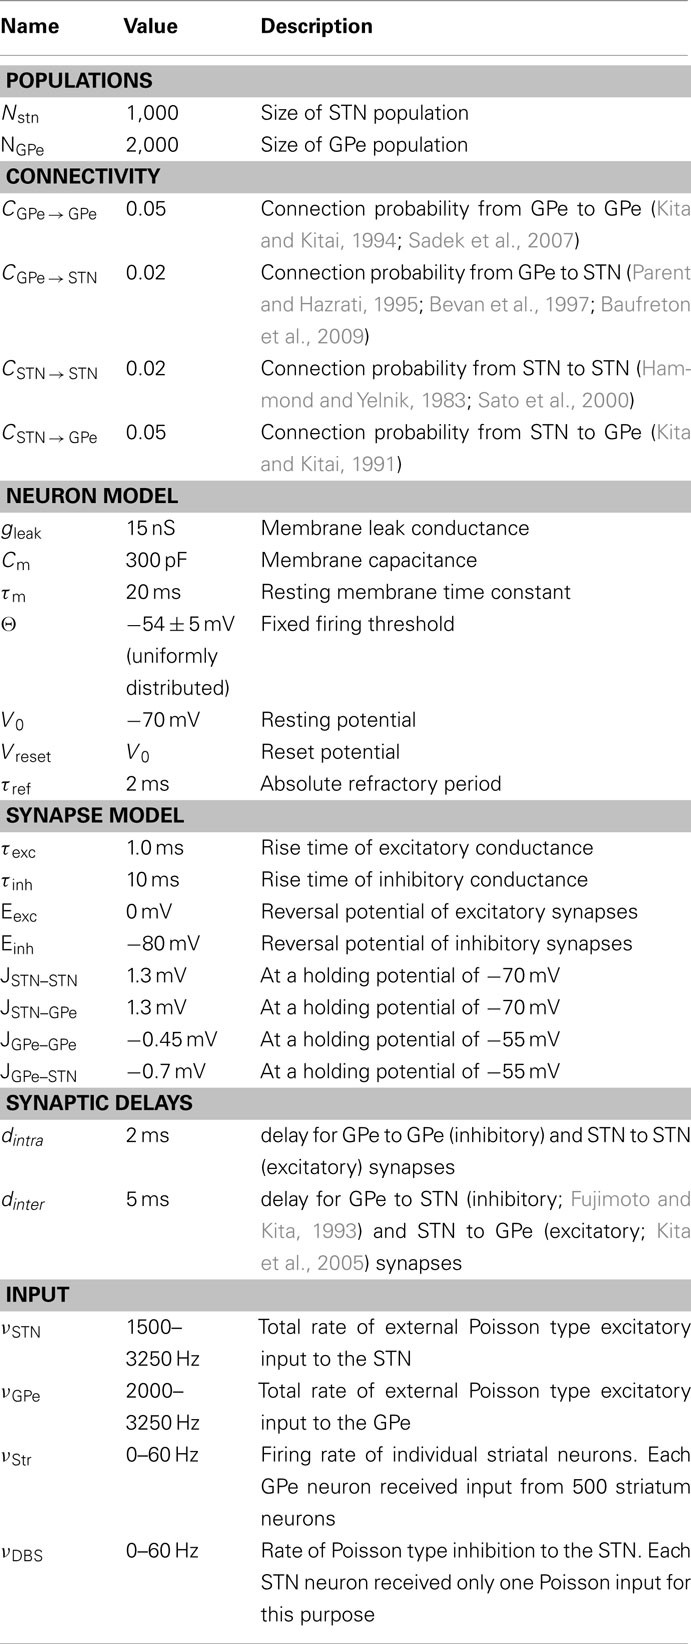
Table 2. Simulation parameters.
All neurons in the STN received external excitatory input from the cortex, modeled as uncorrelated Poisson spike trains. Similarly, all the GPe neurons received uncorrelated Poisson spike trains as input so as to achieve observed baseline firing rates in the GPe. Thalamus could be the source of some of these excitatory connections. This input and synaptic strengths were tuned to obtain realistic baseline firing rates in STN (∼15 Hz) and GPe (∼45 Hz; Bergman et al., 1994; Raz et al., 2000), observed in healthy animals. STN and GPe neurons are reported to act as pacemakers in vitro, i.e. these neurons spike in a near-periodic manner without any external input (Surmeier et al., 2005). However, in the healthy state, in vivo, the spiking of STN and GPe neurons is not periodic (Raz et al., 2000), indicating that the pacemaker behavior is overridden by cortical inputs. This aperiodic spiking behavior of STN and GPe neurons in vivo was well captured by modeling these neurons as integrate-and-fire neurons stimulated with Poisson type external input.
To obtain networks with slightly different ongoing activity states (corresponding to the healthy state), shown in Figure 2, we simulated the STN-GPe network with different combinations of external input (νSTN and νGPe; cf. Table 2). Similarly, to obtain network activities with different degree of synchrony corresponding to the PD state, shown in Figure 5, we simulated the STN-GPe network with different combinations of νSTN, νGPe, and νStr (cf. Table 2).
Details of the spiking network model are provided in tabular form (cf. Tables 1 and 2) to facilitate reproduction of the simulation results.
Aperiodic Stimulation Protocol
For the aperiodic stimulation we first chose a minimal interval Δt between the delivery of pulses. After each pulse, we chose a uniformly distributed random integer γ from the possible values {1, 2, …, n} and set the next pulse to be delivered after γΔt. Both Δt and n should be chosen small enough, to have sufficiently many short intervals occur to quench the oscillations (HFS), while avoiding large intervals that might lead to entrainment (LFS). Here we chose n = 3 and systematically varied Δt between 5 and 15 ms.
Transient Stimulation of the GPe
D2 type dopamine receptor expressing neurons in the striatum project to the GPe and are thought to represent the inhibition of the task (NoGO behavior; Frank and O’Reilly, 2006; Kravitz et al., 2010). To understand the effect of a transient NoGo task related inhibitory input to the GPe from the striatum we injected Poisson types inhibitory input to some of the GPe neurons for 20 ms. The fraction of GPe neuron stimulated and the strength of inhibition were systematically varied.
Analysis of Network Activity
We used the following descriptors to quantify the network activity states:
Mean firing rate
The firing rate of individual neurons was estimated as the average spike count over the full simulation period, excluding the first 500 ms of initial network transients. The mean network firing rate was then obtained by averaging the firing rates of all neurons in the network. Here, we distinguish between the units of the rate of the periodic processes and the point processes. For periodic processes we use the standard unit “Hertz” (abbreviated as Hz), while for the point processes we use the unit “Becquerel” (abbreviated as Bq).
Synchrony index
The population synchrony in the network was estimated by the Fano Factor (FF) of the population spike count (Kumar et al., 2008)

where E[pop] and Var[pop] denote the mean and variance of the spike counts of the neural population, respectively. To obtain a reliable estimate of the population activity, we recorded the spike trains of all neurons in the network and binned their cumulative activity (bin width = 5 ms). A population of independent Poisson processes yields FF[pop] = 1, whereas positive correlations in the population activity result in an increase of Var[pop] and, hence, of FF[pop].
Oscillation index
To estimate the strength of oscillations we used the fact that oscillations introduce peaks in the power spectral density of the population activity. Therefore, we estimated the spectrum (S(f)pop) of the population activity. Oscillations in the STN-GPe network were typically restricted to a narrow frequency band (15–25 Hz; Figure 1C). Thus, we defined the oscillation index as the relative power in this frequency band
where Fs refers to the sampling frequency. To estimate the spectrum Spop, we used Fs = 1 kHz. When the network was oscillating strongly, most of the power was contained in the 15–25 Hz band (Figure 2C) and, hence, OI was close to unity.
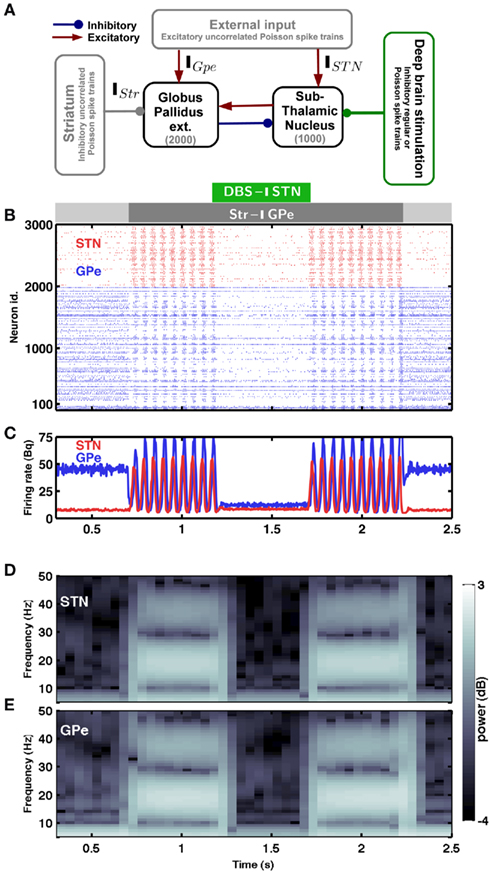
Figure 1. Spiking activity in the sub-thalamic nucleus – globus pallidus network. (A) Scheme of the STN-GPe spiking neural network model. (B) Raster plot of the spiking activity of STN (red) and GPe (blue) neurons. The strength of striatal inhibition to the GPe is indicated by the light gray (weak) and dark gray (strong) horizontal bars. The green horizontal bar indicates Poisson type inhibitory stimulation of the STN. (C) Time-resolved population firing rates of the STN (red) and GPe (blue) networks. (D,E) Spectrogram of the STN (D) and GPe (E) population activity. In the presence of weak striatal inhibition to the GPe, the network exhibited asynchronous and aperiodic activity (Hauptmann et al., 2009). An increase of the striatal inhibition to GPe (dark gray horizontal bar) induced synchrony and β-band oscillations in the STN-GPe network. Such oscillations could be quenched by inhibiting the STN network with Poisson type input (green horizontal bar). The oscillations reappeared again as soon as the inhibitory stimulation of the STN was turned off.
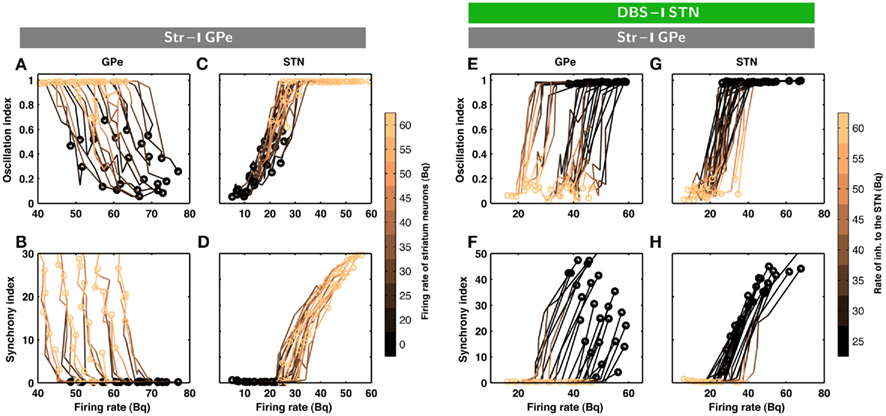
Figure 2. Evolution of inhibition-induced unleashing of oscillations. Each trace corresponds to a different set of network parameters (see Table 2); a change from dark to bright colors represents an increase in striatal inhibition of the GPe neurons. (A) Oscillation index (cf. Materials and Methods) and firing rate in the GPe network for different levels of inhibitory input to the GPe. Note that even a small increase in striatal firing rate was sufficient to unleash oscillations. The dark circles refer to the state of STN-GPe network in absence of striatal inhibition. (B) Synchrony index (cf. Materials and Methods) and firing rate in the GPe network for different levels of inhibitory input to the GPe. (C) Same as in A for STN network. (D) Same as in B for STN network. Observe that both synchrony and oscillations increased in the STN-GPe network with increasing inhibitory input, whereas firing rate decreased in the GPe and increased in the STN. (E–H) Evolution of inhibition-induced quenching of oscillations. Every trace corresponds to a different set of network parameters (cf. Table 2); a change from dark to bright colors represents an increase in the rate of Poisson type inhibition to the STN neurons. (E) Oscillation index and firing rate in the GPe network for different levels of inhibitory input to the STN. The yellow circles refer to the state of STN-GPe network in absence of striatal inhibition. The dark circles refer to the state of STN-GPe network with strong striatal inhibition. (F) Synchrony index and firing rate in the GPe network for different levels of inhibitory input to the STN. (G) Same as in (E) for STN network. (H) Same as in (F) for STN network. Observe that firing rate, synchrony and oscillations decreased with increasing inhibitory input in both sub-networks of the STN-GPe network.
Simulation and Data Analysis Tools
All network simulations were written in python1 using PyNN2 as an interface to the simulation environment NEST3.
Results
The first clue to understand the emergence of oscillations in the basal ganglia system comes from the architecture of the STN-GPe network (Figure 1A). The STN-GPe network is a sparsely connected, recurrent network, with the STN being composed of excitatory neurons and the GPe, by contrast, of inhibitory neurons. Furthermore, both neural populations are mutually coupled via inhibitory and excitatory synapses, respectively. Previous theoretical work on mutually coupled excitatory-inhibitory networks has shown that strong recurrent inhibition can induce “fast” oscillations, caused by delayed feedback from the inhibitory population (Brunel and Wang, 2003) or, alternatively, “slow” oscillations, which additionally require inhibitory input to the inhibitory neurons (Terman et al., 2002; Holgado et al., 2010). In the latter case, the oscillation frequency is determined by an interplay of effective membrane time constants and synaptic delay, and the resulting frequency is usually in the β-range.
Theoretical and computational work thus far has focused on the role of increased efficacy of the mutual coupling between STN and GPe to explain PD related oscillations in the basal ganglia. In PD, however, there is only indirect and weak evidence for potentiated projections emanating from GPe neurons (Magill et al., 2001; Shen and Johnson, 2005). Moreover, oscillations in a recurrent network could be both cause and effect of altered coupling. By contrast, recent experimental data suggest that, in fact, striatal inhibitory input to the GPe is increased (Mallet et al., 2006; Liang et al., 2008), possibly due to potentiated glutamatergic synapses in the striatum (Smith et al., 2009), emerging in the dopamine-depleted state in PD, or due to increased cortical input to the striatum (Tseng et al., 2001). In addition, in the dopamine-depleted state, the medium-spiny neurons in the striatum are more excitable (Tseng et al., 2001) and recurrent inhibition is weakened, due to an increased firing rate of cholinergic neurons (Raz et al., 1996); both findings provide additional indirect evidence for increased activity in the striatum in PD. Therefore, we studied the dynamics of the STN-GPe network under the influence of increased inhibitory input from the striatum. Specifically, we explore the possibility whether the STN-GPe network can exhibit oscillations without scaling up the synaptic coupling between the two neuron populations.
Striatum Activity Unleashes Oscillations in the Basal Ganglia Network
The minimal anatomy of the neural circuitry of the basal ganglia already hints toward a crucial role for synaptic inputs in shaping the oscillatory activity in the network. Specifically, the strength of oscillatory modes should increase if inhibitory input to an inhibitory population (Str to GPe) exceeds a certain level. Because increased inhibition of the inhibitory population (GPe) would increase activity in the excitatory population (STN) which can reverberate in the coupled excitatory-inhibitory network. Similarly, an increase of excitatory input to an excitatory population (e.g. Ctx to STN) can also induce oscillations. Results from large-scale numerical simulations of a STN-GPe spiking network model confirm our predictions from these qualitative considerations (Figures 1B–E). Immediately after an increase in the νStr oscillations appeared in the STN-GPe network (Figures 1B–E; region marked by gray horizontal bar). We tested the effect of the inhibition of GPe neurons by increased striatal activity (νStr) on STN-GPe networks with different average firing rates and oscillations. Indeed a progressive increase in νStr strengthened the amplitude of oscillations in both STN and GPe neurons for all the network studied here (Figures 2A–D). Consistent with experimental data, in all the networks, increase on the oscillations was associated with an increase in firing rate of STN neurons and a decrease in firing rate of GPe neurons, respectively (Bergman et al., 1994; Raz et al., 2000). Finally, our suggestion that increased striatal firing rates of are sufficient to unleash oscillations and, hence, Parkinsonian symptoms (oscillations in the case of our model), in the basal ganglia network is in full accordance with recent experimental findings (Kravitz et al., 2010), which showed that selective increase in the firing rate of D2 type striatum neurons, which specifically project to the GPe, can induce PD symptoms in mice.
Mechanism of Oscillations
When increased striatal activity inhibits GPe neurons the STN neurons are released from inhibition, resulting in a slow increase in the activity in the STN network. Increased excitation originating from STN causes an increase of activity in GPe after a certain delay, the duration of which is determined by the combination of axonal transmission, synaptic transduction and dendritic integration. Increase GPe activity is eventually able to stop STN firing, thereby resetting the system to the initial state. Thus, in this mechanism STN activity leads the GPe activity.
This mechanism implies that oscillations onset is accompanied with a decrease in the activity of the GPe neurons. Alternatively, it is possible that strong cortical excitatory input to the STN could increase firing rates of the STN neurons, initiating the process of oscillations as described above.
In both the scenarios of increased striatal to the GPe or cortical input to the basal ganglia network, oscillations appear because activity in the excitatory population (STN) builds up on a slow time-scale governed by the membrane time constants of the STN neurons. In summary, oscillations in the STN-GPe network are, in fact, alternating reverberations of increased excitation and inhibition, maintained by an effective increase in excitatory input to STN neurons. In this sense, they are analogous to the “slow” oscillations observed in networks of integrate-and-fire neurons (Brunel and Wang, 2003).
Because STN firing rates are increased due to high striatal output, one could speculate that this may lead to an increase in the effective coupling from GPe to STN, and thus cause of oscillations. However, according to Brunel’s theory (Brunel, 2000), this increase could result in fast as well as slow oscillations, and also in asynchronous firing. Moreover, the strength of GPe to STN coupling in the absence of STN to GPe feedback is not increased as STN firing rate increases in the high striatal output regime (Figure 3). In fact, the coupling strength decreases for high STN rate, thus it cannot be the mechanism underlying the oscillations.
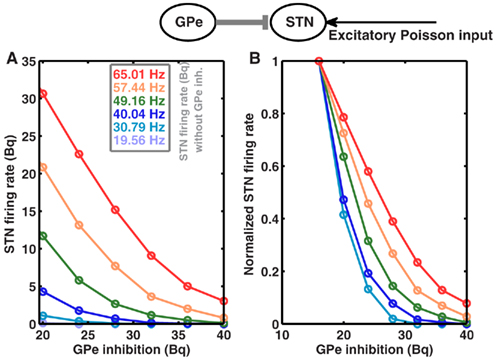
Figure 3. GPe to STN coupling is not increased in high striatal output regime. Top Schematic of a single GPe and STN neuron coupled by a single inhibitory synapse. (A) Firing rate of an STN neuron as a function GPe inhibition, for different baseline firing rates in the STN. STN baseline firing rates were tuned to different by values by increasing the rate of input Poisson spike trains. Similarly, GPe spike trains were modeled as homogeneous Poisson process. (B) Same as in (A), but normalized to the maximum firing rate for each STN baseline firing rates, to show the relative decrease in the STN activity as a function of increasing GPe inhibition.
Spectrum of Correlations within STN and GPe Networks
To further characterize the activity of the STN-GPe network in non-oscillatory and oscillatory states we calculated the oscillation index (OIcc) of cross-correlograms of the STN and GPe neuron pairs in non-oscillatory (OI = 0.15) and oscillatory (OI = 0.97) states. In both states, GPe neurons showed a wide distribution of pairwise correlations (PwCGPe = 0.27 ± 0.17 and 0.39 ± 0.19, respectively; Figure 4A). By comparison, STN neurons exhibited a narrow distribution of pairwise correlation coefficients, with small correlation in the non-oscillatory state (PwCSTN = 0.12 ± 0.08) and high pairwise correlation in the oscillatory state (PwCSTN = 0.51 ± 0.08; Figure 4B). In the non-oscillatory state, the cross-correlograms were largely non-oscillatory in both STN and GPe populations (Figures 4C,D blue traces). In the oscillatory state, the cross-correlograms were also oscillatory (Figures 4C,D orange traces). Interestingly, in the GPe population ∼15% cross-correlograms showed OIcc ≤ 0.5.
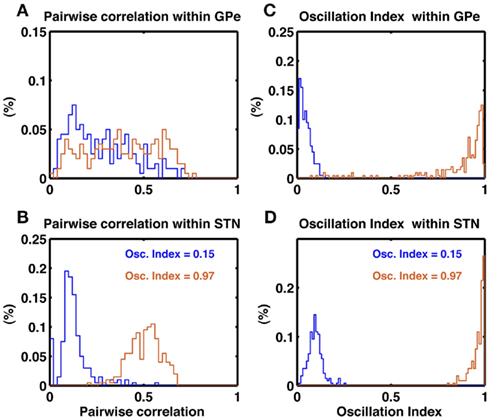
Figure 4. Pairwise correlations in the STN and GPe populations. (A) Histogram of pairwise correlations estimated from 100 unique pairs of GPe neuron in a non-oscillating (blue trace) and a oscillating state (brown trace). (B) Same as in (A), but for 1000 unique pairs of STN neurons. Oscillation induce stronger synchrony (correlations) in the STN than GPe. (C) Oscillation index of the cross-correlogram of GPe neuron pairs. In a non-oscillatory state the OIcorr is small (blue trace). In an oscillatory state despite of global oscillations some neuron pairs do not show oscillations in their cross-correlogram (brown trace). (D) Same as in (C). Unlike GPe network, STN more neuron pairs show oscillations in their cross-correlogram (brown trace).
In animal models of PD, a large fraction of STN neuron pairs showed oscillatory cross-correlograms (Levy et al., 2002), whereas only a relatively small number of GPe neuron pairs (16.7%) exhibited oscillatory cross-correlograms (Heimer et al., 2002). At first sight, our model is inconsistent with these experimental data, as we predict a larger number of oscillatory cross-correlograms in the GPe network. However, a direct comparison of our model with the experimental data is not possible because the oscillation index of the GPe activity was not made available. Evidently, the number of oscillatory cross-correlograms depends on the strength of oscillations in network activity. Furthermore, the pertinent publications do not provide quantitative numbers on the strength of the cross-correlation and its oscillation index, making a direct comparison difficult.
Quenching of Oscillations in the Basal Ganglia Network
According to the network model proposed here, there are different ways to effectively interfere with the oscillatory modes. In particular, it would be sufficient to reduce the excitatory input to STN neurons to efficiently quench the oscillations, because increased activity of the STN neurons is the main cause of oscillations. To test this general mechanism, we provided additional inhibitory synaptic inputs to all STN neurons in the model. Indeed, even weak uncorrelated inhibitory input to STN neurons was sufficient to quench the oscillations (Figures 1B–E; region covered by green horizontal bar). Increasing the rate of additional inhibitory input to STN neurons progressively attenuated the oscillations in both STN and GPe neurons (Figures 2E–H). This mechanism quenched in the oscillation in all the different networks studied here, irrespective of the strength of oscillations. Note, however, that, although this type of interference was effective in reducing the network oscillations, it failed to restore the healthy state of firing in GPe neurons (Figures 1B–C and E–H2). We also tested if it is necessary to provide external inhibitory inputs to all the STN neurons. For a different STN-GPe network we systematically increased the faction of STN neurons that received extra inhibition. For some networks it was sufficient to inhibit ∼50% of STN neurons (Figure 6A) to obtain OI ≤ 0.4. On average, at a stimulation frequency of 50 Bq, ∼75% neurons were needed to be inhibited to quench the oscillations (OI ≤ 0.3; Figure 6A, black trace). The fraction of STN neurons to be stimulated can be decreased for higher rate of Poisson type stimulation (Figures 2D,E). Previously, gamma distributed stimulation pulses with a mean rate of 130 Hz have been used to stimulate the STN. Such stimulation, however, failed to alleviate the symptoms of bradykinesia (Dorval et al., 2010). It is not clear from the published literature whether aperiodic DBS reduced or quenched the oscillations or not (Dorval et al., 2010). Our model is not detailed enough to reproduce the specific firing patterns observed during bradykinesia. Here, we focus on the β oscillations which according to our model can be quenched by Poisson type stimulation at a stimulation frequency as low as 50 Bq.
Effect of STN Lesions on Oscillations
One of the earliest surgical treatments of PD motor symptoms was to lesion the STN (Dorval et al., 2010). Surprisingly, it was recently reported that selective silencing of a fraction of STN neurons by optogenetic methods was not sufficient in suppressing oscillatory activity and motor dysfunction in a mouse model of PD (Gradinaru et al., 2009). Interestingly, Gradinaru et al. (2009) found that eNpHR virus was effective in about 95% STN neurons and optical stimulation reduced the firing rate of the STN neurons by ∼80%. If we assumes the same decrease for all of the 95% eNpHR infected neurons, the overall firing rate in the STN will be ∼25% of the initial one. This would suggest that silencing of ∼75% of STN neural activity is not sufficient to quench the oscillations. To find out how many of STN neurons need to be stimulated to quench oscillations (OI ≤ 0.3) we investigated how silencing a fraction of randomly chosen neurons in the STN affects oscillations in our model.
By systematically increasing the fraction of silenced neurons we found that > 40% STN neurons must be completely silenced before the amplitude of oscillations is reduced to a sufficiently small value (OI ≤ 0.5; Figures 5A–D). Silencing a large enough fraction of STN neurons reduced the excitatory input to the GPe to the extent that the GPe firing pattern remains largely dominated by the striatal (non-oscillatory) input and, hence, remained non-oscillatory. By contrast, when only a small fraction of STN neurons was silenced, GPe neurons still received enough excitatory input to maintain the oscillations. It is not clear what level of oscillation index is compatible with the absence of Parkinsonian symptoms. If a very low oscillation index is needed, then silencing of 75% of the neurons would be not enough to suppress Parkinsonian symptoms, thus explaining the experimental findings (Gradinaru et al., 2009).
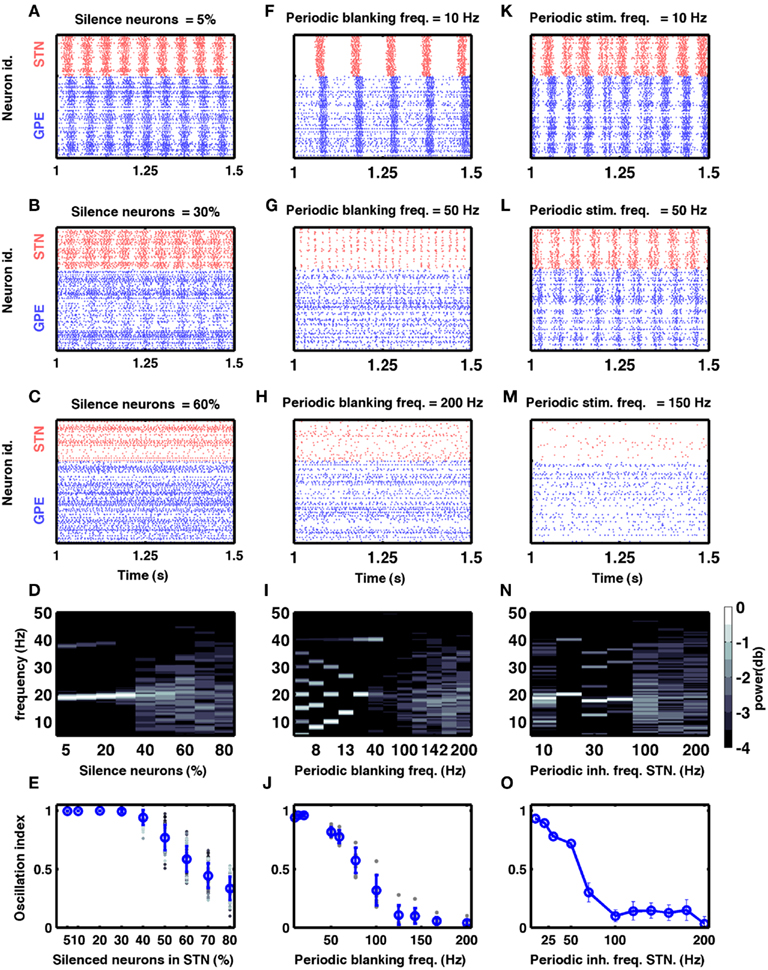
Figure 5. Models of DBS. (A–E) Effect of silencing a fraction of STN neurons on oscillations in the STN-GPe network. (A–C) Three examples of spiking activity when a fraction of STN neurons was silenced, as indicated above the respective plots. (D) Spectrum of the STN population activity as a function of the fraction of silenced STN neurons. (E) Oscillation index measured in the STN as a function of the silenced fraction of STN neurons. Here and in (J), blue dots and vertical bars represent mean and SD, respectively, whereas different gray dots refer to individual simulations with different network parameters (see Table 2). Note that only with more than 60% of all neurons silenced, the oscillation index was reduced. However, even with 70% silenced neurons, some networks still exhibited oscillations. (F–J) Effect of periodic blanking of excitatory afferents to the STN neurons on the oscillations in the STN-GPe network. (F–H) Three examples of spiking activity when afferents of the STN neurons were blanked at frequencies indicated above the respective plots. (I) Spectrum of the STN population activity as a function of the frequency at which the excitatory inputs to STN neurons were blanked. (J) Oscillation index in the STN, as a function of the frequency of periodic blanking of the excitatory inputs to STN neurons. Observe that only blanking frequencies above 100 Hz were effective in reducing the network oscillations. (K–O) Effect of periodic inhibition of excitatory afferents to the STN neurons on the oscillations in the STN-GPe network. (K–M) Three examples of spiking activity of STN neurons when periodic inhibitory spiking activity was injected into the STN neurons at frequencies indicated above the respective plots. (N) Spectrum of the STN population activity as a function of the frequency of periodic inhibitory input to the STN neurons. (O) Oscillation index in the STN, as a function of the frequency of periodic inhibitory stimulation of STN neurons.
Minimal Neuronal Mechanisms of DBS Functioning
In the last two decades, DBS has developed into an effective clinical approach to alleviate PD symptoms in certain patients. Yet, in spite of the phenomenal success of DBS in PD and several other neurological disorders (Benabid, 2003; Kringelbach et al., 2007), the biophysical and neuronal mechanisms underlying DBS functioning are still only poorly understood (Benabid, 2003; McIntyre et al., 2004; Kringelbach et al., 2007; Nambu, 2008). Also, it is well established that, while periodic high-frequency stimulation (HFS) of the STN is efficient for the treatment of PD symptoms, periodic low-frequency stimulation (LFS) may even aggravate motor impairment (Eusebio et al., 2008).
Periodic DBS
To understand the neural mechanism underlying the efficacy or inefficacy of periodic stimulation it is worth to consider it as a abstract dynamical system (Bender and Orszag, 1999) with negative feedback, exhibiting periodic activity. In such systems, a periodic input with frequency approximately matched to the resonant frequency of the system can entrain it in a new oscillatory mode, possibly increasing oscillations amplitude. If, in contrast, the input frequency is much higher than the resonant frequency, the system will not be entrained and will behave as subject to the temporal average of the periodic input.
To test this idea, we implemented two different methods of periodic stimulation in our large-scale spiking network simulations of the STN-GPe network.
Periodic blanking of the excitatory inputs to STN
Here we periodically switched the excitatory afferents to STN neurons on and off. This is equivalent to a scenario of repeated electrical stimulation of axons into the STN, resulting in a cessation of spiking in these axons due to adaptation effects. The frequency of such periodic blanking was systematically varied to study its efficacy in quenching the oscillations (Figures 5F–J). We found that this stimulation protocol was only effective in measurably quenching the oscillations at stimulus frequencies larger than 100 Hz (Figure 5J), as is evident both in the raster diagram (Figure 5I) and in the broadband spectrum of the STN-GPe network activity (Figure 5I). Interestingly, low-frequency blanking of the STN input generated harmonics of the stimulation frequency in the STN-GPe network activity, analogous to recent observations by Deger et al. (2010). This emergence of harmonics at low-frequency stimulation could explain why low-frequency DBS in many cases impairs movements in PD patients (Eusebio et al., 2008). Finally, it was possible to quench oscillations even when input to up to 60% of the STN neurons was silenced periodically at high-frequency (Figure 6B).
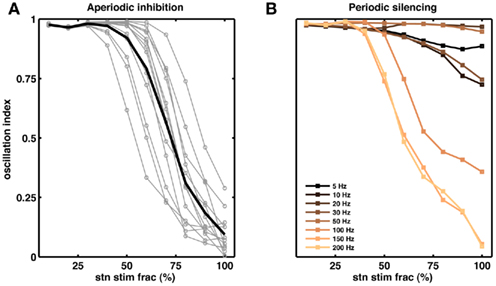
Figure 6. Partial stimulation of STN neurons can quench oscillations. (A) Effect of extra inhibitory input to a fraction of STN neurons. Each gray line corresponds to a network with unique set of parameters. The black trace is the average of the gray traces. For all networks we injected extra Poisson type inhibitory inputs (50 Hz). Out simulations suggests that for some networks inhibition of even 50% of the STN neurons is sufficient to reduce the oscillations (OI ≤ 0.3), on average however, ≥70% STN neurons should be inhibited to quench the oscillations (OI ≤ 0.3). (B) Effect of periodic silencing (Figures 5F–J) of excitatory input to a fraction of STN neurons. At high frequencies (≥100 Hz) even partial stimulation of STN neurons (≥50%) is enough to reduce the oscillations in the STN-GPe loop.
Periodic inhibitory synaptic input to STN neurons
In this hypothetical realization of DBS we provided additional inhibitory synaptic input to STN neurons in a periodic fashion. We systematically varied the frequency of these inputs to study its efficacy in quenching the oscillations (Figures 5K–O). We found that also with this protocol the efficacy of stimulation in quenching the oscillations increased with stimulus frequency (Figure 5O). Unlike the previous protocol, however, it did not generate any harmonics during stimulation at low frequencies (Figure 5N).
Our large-scale network simulations further revealed that the two protocols differed in their fine-scale spectral composition: while periodic blanking induced harmonics for low-frequency stimulation, periodic inhibitory inputs increased the power in a broader frequency range (compare Figures 5I,N). Thus, measurement of LFPs during stimulation can be used to reveal how the current periodic stimulation protocols work.
Quenching Oscillations with Aperiodic Stimulation
Prolonged high-frequency periodic stimulation can induce synaptic plasticity (Malenka and Bear, 2004), which could possibly impair the efficacy of DBS in PD patients. However, as described above, under sustained, periodic low-frequency stimulation the system becomes entrained to the stimulation frequency. Therefore, we tested whether aperiodic stimulation can also quench oscillations.
As an example, we delivered aperiodic stimulation in the form of 10 ms wide blanking pulses at random inter-pulse intervals, with an upper bound on the maximum interval. We chose this particular implementation because it amounts to only a minor modification of existing periodic protocols and could be easily incorporated into currently available DBS systems (cf. Materials and Methods).
Interestingly, this type of aperiodic stimulation was very effective in quenching the oscillations (Figure 7A). In fact, such aperiodic stimulation was more effective than periodic stimulation at the same mean pulse rate. For instance, periodic blanking at 100 Hz resulted in an average oscillation index of ≈0.3, whereas aperiodic blanking at the same mean rate reduced the oscillation index to ≈0.1 (compare Figures 5J and 7C).
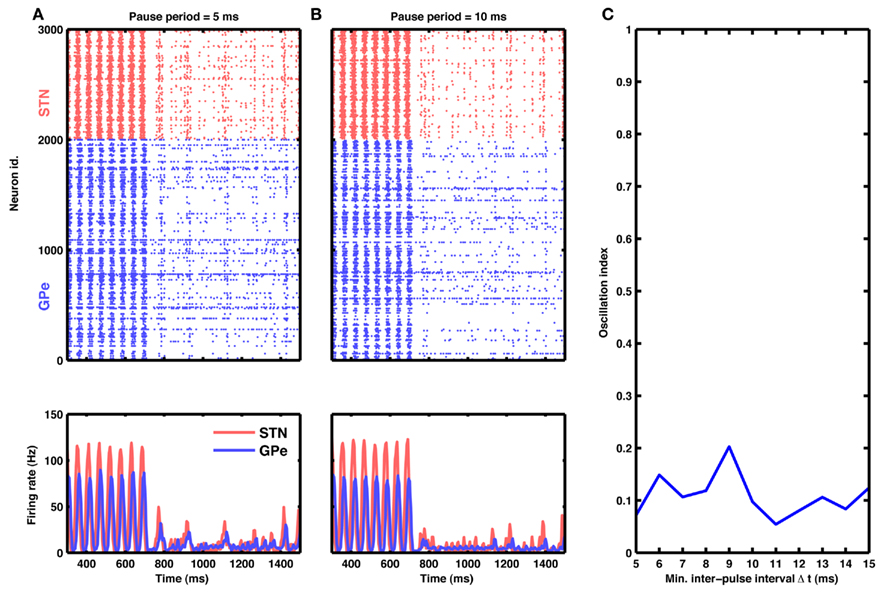
Figure 7. Aperiodic stimulation protocol. (A) Raster of spiking activity (top) and population activity (bottom) in the STN-GPe network for STN (red) and GPe (blue) neurons. At time 750 ms, input to STN neurons was blanked aperiodically for 10 ms. Successive inter-pulse intervals were chosen randomly from a finite set of possible values: 5, 10, and 15 ms (cf. Materials and Methods). (B) Same as in (A), but with inter-pulse intervals double the size (possible values: 10, 20, and 30 ms). (C) Oscillation index as a function of minimal inter-pulse interval. Observe that this aperiodic stimulation is at least as effective in quenching oscillations as a comparable periodic HFS.
Such aperiodic protocol would, in fact, have another advantage beyond avoiding both entrainment (LFS) and undesired plasticity (HFS). Periodic stimulation at 100 Hz or higher is quite energy consuming. As a result, the battery life of state-of-the-art DBS systems is limited to a few years only (Kringelbach et al., 2007). Thus, in addition to being more effective, our proposed aperiodic stimulation could prolong the battery life time and, hence, increase recharging and maintenance intervals – clearly an advantage for the patient carrying the battery.
Effect of Excitability of STN Neurons on Oscillations
Our model suggests that oscillations are unleashed because increased inhibitory input to GPe neurons releases STN neurons from inhibition and, in turn, increased activity in the STN initiates oscillations. Consequently, oscillations could, in principle, also be quenched by decreasing the excitability of STN neurons. For the simple neuron model used here, neural excitability could conveniently be manipulated by altering the spike threshold, but biologically more realistic neuron models provide other options to modify the excitability. Indeed, we found that it is possible to effectively quench the oscillations by reducing neuronal excitability in STN (Figure 8).
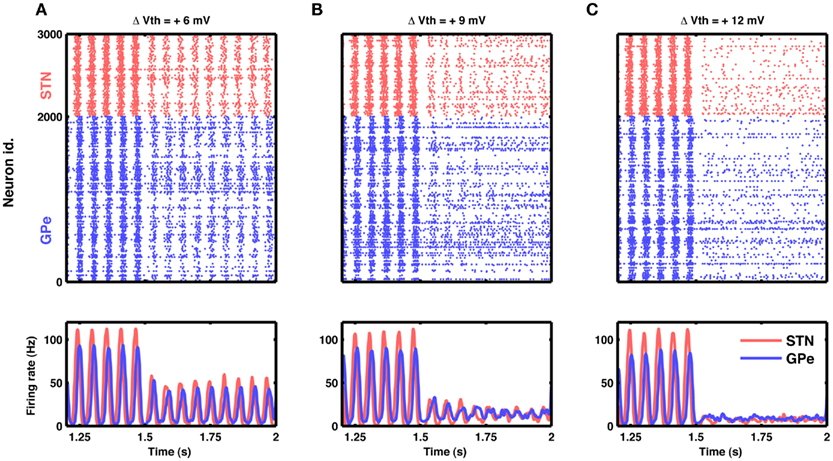
Figure 8. Reduction in excitability of STN neurons can quench oscillations. (A) Raster of spiking activity (top) and population activity (bottom) in STN (red) and GPe (blue). At time 1.5 s, the excitability of STN neurons was reduced by increasing their spike threshold by 6 mV. Such small reduction in excitability attenuated STN-GPe oscillations only by some 50%. (B) Same as in (A), but with a spike threshold increase of 9 mV. Here the attenuation of oscillations was considerable, down to some 20%. (C) Same as in (A), but with a spike threshold increase of 12 mV. Now the oscillations were nearly abolished, while both STN and GPe remained active at a low firing rate.
Role of Transient Inhibition of GPe Network
Our model suggests that increased striatal output can induce oscillation in the STN-GPe network. In normal state, striatum neurons that project to the GPe are thought to be active during inhibition tasks in the classical Go-NoGo task (Frank and O’Reilly, 2006). This means that GPe may be receiving increased inhibitory input from the striatum even in a healthy state and such transient increase in the GPe inhibition could initiate transient oscillations in the STN-GPe network. To test for this possibility, we recorded the output of the GPe network when it was stimulated with a short (20 ms) Poisson type inhibitory input. We varied the number of GPe neuron stimulated and the stimulation firing rate. When baseline firing rates were high (∼40 Bq), as is observed in healthy animals, stimulation of 10% GPe neurons was sufficient to induce transient oscillations (Figures 9A–C). In general, oscillation strength of the GPe response increased with the strength of input and fraction of neuron stimulated. Furthermore, when baseline firing rate were low (∼17 Bq), as is observed in dopamine-depleted animals, inhibition-induced transient oscillations in GPe required stimulation of a large number of neurons (Figure 9D). In summary, we suggest:
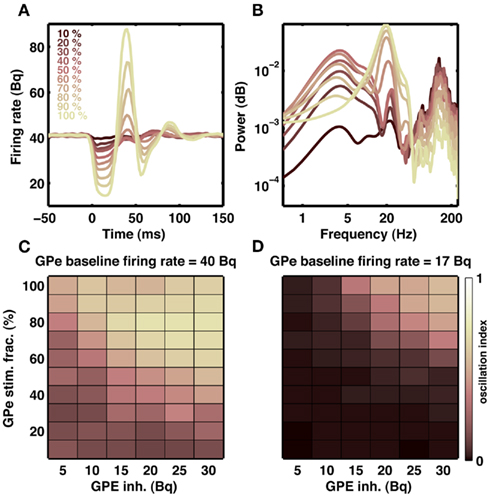
Figure 9. Transient oscillation in STN-GPe loop. (A) Example of a transient (20 ms) inhibitory input to a fraction of GPe neurons indicated by different colors. Each trace is an average of 20 stimulations. Transient inhibitory input induces a damped oscillation in the population activity of the GPe network. (B) Spectra of GPe activity shown in (A). Transient inhibition of even 10% neurons generates a weak but visible oscillation at 20 Hz. (C) Effect of strength of inhibitory input to the GPe (x-axis) and fraction of GPe neurons inhibited (y-axis) on the oscillation strength. (D) Same as in (C), but with high baseline firing rate in the GPe network. Only when the baseline activity in the GPe is high transient inhibitory inputs to the GPe can initiate short lasting oscillations.
1. In healthy patients, NoGo behavior is mediated by transient oscillations in basal ganglia output.
2. As PD advances, spontaneous oscillations emerge in the basal ganglia network. This persistent inhibition signal from GPe impairs movement initiation.
3. DBS treatment eliminates oscillations. The persistent oscillatory signal from GPe is quenched and movement initiation could be restored.
4. However, DBS treatment is not able to restore proper firing rates in GPe. Therefore, inhibition-induced transient oscillations are more difficult to initiate and NoGo behavior is impaired.
Taken together, the above arguments can provide a putative explanation for the motor initiation impairment in Parkinson and reduced response inhibition in DBS implanted patients, reflected as enhanced stop-signal reaction time in NoGo tasks (van den Wildenberg et al., 2006).
Discussion
Neural Mechanisms Underlying Emergence and Quenching of Oscillations in PD
We demonstrated theoretically that inhibitory inputs from upstream brain areas (e.g. striatum) to the STN-GPe network are sufficient to both unleash and quench oscillations in the basal ganglia.
Our model predicts that in the STN-GPe network both, an increase in inhibitory input to the GPe and an increase in excitatory input to the STN can generate oscillations in the basal ganglia network. An increase in inhibitory input to GPe can occur due to increased firing rates in the D2-expressing medium-spiny neurons in the striatum. Indeed, several experimental studies have reported either direct (Liang et al., 2008; Mallet et al., 2008) or indirect (Raz et al., 1996; Tseng et al., 2001) evidence for increase in striatal firing rates in animal models of PD. This increase in striatal firing rates can be caused by a potentiation of glutamatergic synapses in the striatum (Smith et al., 2009). Tseng et al. (2001) hypothesized that an altered functional state of striatal projection neurons could facilitate the transmission of cortical rhythms to the basal ganglia, resulting in the motor symptoms of PD. Here we have shown that increased activity in the striatum can induce oscillations in the basal ganglia. However, it is not necessary that striatal activity is increased because of local changes in the striatal network. An increased input to striatum from cortex could also increase firing rates in the striatum and thereby initiate oscillations in the STN-GPe network according to the “volleyball effect.” Thus, our model is consistent with this hypothesis and, in fact, provides a computational explanation of it. Alternatively, increased activity in the cortex can also increase striatal firing rates. Moreover, increased cortical activity would imply that STN neurons also receive strong input, which, according to our model, could be another reason for the emergence of oscillations in the basal ganglia.
Taken together, our theory provides a unified explanation for the absence of oscillations in the normal state, for the origin of oscillations in the dopamine-depleted state, and for the efficacy of DBS in PD.
Most previous models of oscillations in the basal ganglia have explicitly focused on the mutual interactions between the STN and GPe networks (Terman et al., 2002; Humphries et al., 2006; Holgado et al., 2010). In these models, either a change in strength (Terman et al., 2002; Holgado et al., 2010) or time constant and delay (Holgado et al., 2010) of synaptic coupling between the STN and GPe caused the oscillations. Striatum input to the GPe was assumed to have increased several times compared to the non-oscillatory states, however, the authors did not elaborate on this issue (Terman et al., 2002; Humphries et al., 2006; Holgado et al., 2010). Another model (Leblois et al., 2006) ignored the role of the GPe and suggested that the change in the overall strengths of the direct pathway (involving striatum and globus pallidus internal, GPi) and the hyper-direct pathway (involving the STN and GPi) is the key factor in inducing oscillations in the basal ganglia. In that model of oscillations, the indirect pathway (involving striatum, GPe, and GPi) played no role in the emergence of oscillations.
Although all these models were able to produce oscillations in the basal ganglia, the evidence in favor of potentiated synapses with unaltered effective connectivity is rather weak. In fact, in a coupled system with plastic synapses, an increase in effective connectivity between the STN and GPe networks could be both cause and effect of oscillatory dynamics. Moreover, these models imply that the synaptic couplings between the STN and the GPe are carefully tuned to avoid oscillations. Very importantly, none of these models predicted or explained the significance of increased firing rates of striatal neurons projecting to the GPe, as have been experimentally observed in dopamine-depleted striatum. Finally, according to previous models (Terman et al., 2002; Humphries et al., 2006), the putative function of DBS is to reduce the synaptic coupling between STN and GPe, for which, again, there is currently no experimental evidence.
Alternatively, the inhibition-induced increase in oscillations in the basal ganglia has been studied using abstract firing rate based models by Gillies et al. (2002) and, more recently, van Albada et al. (van Albada and Robinson, 2009; van Albada et al., 2009). These authors have made specific suggestions about the role inhibition may play in PD related oscillation in the STN-GPe network. Here, using a more realistic model of the STN-GPe network we not only confirm previous suggestions from abstract models (Gillies et al., 2002; van Albada and Robinson, 2009; van Albada et al., 2009) but also extend these insights to understand mechanisms underlying the functioning of DBS.
Here, given the mechanism of oscillations, STN inhibition emerges as a most natural mechanism to quench the oscillations. Indeed, experimental data suggests that DBS may inhibit STN neurons (Benabid, 2003; Kringelbach et al., 2007) and, thus, also reduce firing rates in the GPe. However, at the same time some experiments indicate that during DBS, firing rate in GPe neurons remains unaffected (Moran et al., 2011) or increases (Hashimoto et al., 2003). According to our model, oscillations in the STN-GPe network are unleashed when firing rates in the GPe neurons are reduced (by increased activity of D2 neurons in the striatum). Therefore, quenching of oscillations and alleviation of PD symptoms by an increase in the firing rates of GPe neurons by DBS is consistent without model.
Putative Functional Significance of Transient Oscillations
Previous experiments and computational models have suggested that the STN-GPe network can impose a global modulatory signal in the basal ganglia to influence action facilitation and action suppression (Frank and O’Reilly, 2006; Frank et al., 2007). Our model suggests that strong activation of the indirect pathway of the basal ganglia is the primary cause for the oscillations reported in PD. It is possible, though, that transient oscillations are, in fact, instrumental for functional computations in the basal ganglia. In the STN-GPe network, transient oscillations can be induced both by phasic inhibition of GPe neurons and/or phasic excitation of STN neurons (Figure 9). Such phasic inputs may recruit the indirect and/or hyper-direct pathway, causing transient synchronous activity and phase-locking in the STN-GPe network. Further theoretical work is needed to determine whether and how such transient oscillatory modes can play a role as a global modulatory signal in action selection or action suppression, as suggested by Frank et al. (Frank and O’Reilly, 2006; Frank et al., 2007).
Suggestions for Novel, More Effective DBS Protocols
Beyond its general relevance for understanding basal ganglia function and dysfunction, our model also offers a computational framework for developing and testing innovative DBS protocols (Hauptmann et al., 2009). In this framework, we made specific suggestions for new strategies of therapeutic intervention in PD and other diseases exhibiting abnormal oscillatory activity in the STN-GPe network: (1) STN-GPe oscillations can be quenched more effectively by reducing the activity of D2-expressing striatal neurons projecting to the GPe (Figures 2A–D). (2) Aperiodic stimulation of the STN is more effective in quenching the oscillations than periodic stimulation at the same mean rate (Figures 2E–H and 7). (3) Because the oscillations are likely caused by disinhibition of STN neurons, reducing the excitability of STN neurons may also be effective in quenching the oscillations (Figure 8). Among the above mentioned novel DBS protocols, the aperiodic stimulation protocol, in addition, promises to reduce the energy consumption of the DBS device. With little effort, it can be implemented using the existing, clinically approved DBS systems.
Model Predictions and Limitations
Our model suggest that excitatory inputs to the STN from the cortex would lead to an increase in the β band oscillations. This seems at odds with the experiments which show that during behavior when strong excitatory input arrives in the STN, β band oscillations are reduced, for example in a high-conflict decision making task (Frank et al., 2007). However, task related activity will arrive in the basal ganglia through both striatum and the STN. We have not investigate how such input will interact and whether they will enhance or weaken the β band oscillations. This will also require the knowledge of spatio-temporal structure of the task related input to the basal ganglia.
The spectrum of correlations in our model during oscillatory and non-oscillatory states is not in complete match with the experimentally measured correlation in monkey with Parkinson’s disease (Brunel, 2000; Heimer et al., 2002; Levy et al., 2002). The available experimental data does not provide quantitative estimates of cross-correlation and strength of the oscillations in the cross-correlogram, which makes a direct comparison between our model and the data difficult.
The observation of transient oscillations in the healthy state upon short stimulation of the GPe motivated us to suggest that task inhibition may involve transient oscillations. With DBS such transients oscillations are hard to generate, therefore we suggest that patients with DBS will have difficulty in controlling their actions. This however, does not explain why and how patients with DBS may speed up their decisions under high-conflict condition (Frank et al., 2007). The model is too simple and therefore not suitable to address the behavioral performance of the basal ganglia in complex task such as high-conflict decision making.
Finally, our simple model needs to be extended to include more realistic neuron models to explain the observed increased bursting in the GPe neurons during dopamine-depleted state (Raz et al., 2000).
Nevertheless, despite its simplicity the model is powerful enough to suggest
• Striatum inhibition is sufficient to generate oscillations associated with PD.
• DBS should be effectively inhibitory in nature.
• Transient oscillations in the STN-GPe network which can play a crucial role in decision making depend on the baseline firing rate in the GPe.
Together these three main results provide novel insights about the origin of the oscillations in the basal ganglia, their quenching due to deep-brain-stimulation (DBS), and provides a putative explanation of certain cognitive deficits in the PD patients with or without DBS.
Conflict of Interest Statement
The authors declare that the research was conducted in the absence of any commercial or financial relationships that could be construed as a potential conflict of interest.
Acknowledgments
We thank Hagai Bergman and Izhar Bar-Gad for helpful discussions. All simulations were carried out using the NEST simulation software (www.nest-initiative.org). Partial funding by the German Federal Ministry of Education and Research (BMBF grant 01GQ0420 to the BCCN Freiburg, BMBF GW0542 Cognition, and BMBF 01GW0730 Impulse Control) is gratefully acknowledged.
Footnotes
References
Baufreton, J., Kirkham, E., Atherton, J. F., Menard, A., Magill, P. J., Bolam, J. P., and Bevan, M. D. (2009). Sparse but selective and potent synaptic transmission from the globus pallidus to the subthalamic nucleus. J. Neurophysiol. 102, 532–545.
Benabid, A. L. (2003). Deep brain stimulation for Parkinson’s disease. Curr. Opin. Neurobiol. 13, 696–706.
Bender, C. M., and Orszag, S. M. (1999). Advanced Mathematical Methods for Scientists and Engineers: Asymptotic Methods and Perturbation Theory. New York: Springer.
Bergman, H., Wichmann, T., and DeLong, M. R. (1990). Reversal of experimental parkinsonism by lesions of the subthalamic nucleus. Science 249, 1436–1438.
Bergman, H., Wichmann, T., Karmon, B., and DeLong, M. R. (1994). The primate subthalamic nucleus. II. Neuronal activity in the MPTP model of parkinsonism. J. Neurophysiol. 72, 507–520.
Bevan, M. D., Clarke, N. P., and Bolam, J. P. (1997). Synaptic integration of functionally diverse pallidal information in the entopeduncular nucleus and subthalamic nucleus in the rat. J. Neurosci. 17, 308–324.
Brown, P., and Williams, D. (2005). Basal ganglia local field potential activity: character and functional significance in the human. Clin. Neurophysiol. 116, 2510–2519.
Brunel, N. (2000). Dynamics of sparsely connected networks of excitatory and inhibitory spiking neurons. J. Comput. Neurosci. 8, 183–208.
Brunel, N., and Wang, X. J. (2003). What determines the frequency of fast network oscillations with irregular neural discharges? I. Synaptic dynamics and excitation-inhibition balance. J. Neurophysiol. 90, 415–430.
Coffey, R. J. (2009). Deep brain stimulation devices: a brief technical history and review. Artif. Organs 33, 208–220.
Deger, M., Moritz, H., Stefano, C., Fatichan, A., and Stefan, R. (2010). Nonequilibrium Non-equilibrium dynamics of stochastic point processes with refractoriness. Phys. Rev. E 82, 021129.
Dorval, A. D., Kuncel, A. M., Birdno, M. J., Turner, D. A., and Grill, W. M. (2010). Deep brain stimulation alleviates parkinsonian bradykinesia by regularizing pallidal activity. J. Neurophysiol. 104, 911–921.
Eusebio, A., Chen, C. C., Lu, C. S., Lee, S. T., Tsai, C. H., Limousin, P., Hariz, M., and Brown, P. (2008). Effects of low-frequency stimulation of the subthalamic nucleus on movement in Parkinson’s disease. Exp. Neurol. 209, 125–130.
Frank, M. J., and O’Reilly, R. C. (2006). A mechanistic account of striatal dopamine function in human cognition: psychopharmacological studies with cabergoline and haloperidol. Behav. Neurosci. 120, 497–517.
Frank, M. J., Samanta, J., Moustafa, A., and Moustafa, S. (2007). Hold your horses: impulsivity, deep brain stimulation and medication in Parkinsonism. Science 318, 1309–1312.
Fujimoto, K., and Kita, H. (1993). Response characteristics of subthalamic neurons to the stimulation of the sensorimotor cortex in the rat. Brain Res. 609, 185–192.
Gillies, A., Willshaw, D., and Li, Z. (2002). Subthalamic-pallidal interactions are critical in determining normal and abnormal functioning of the basal ganglia. Proc. Biol. Sci. 269, 545–551.
Gradinaru, V., Mogri, M., Thompson, K. R., Henderson, J. M., and Deisseroth, K. (2009). Optical deconstruction of parkinsonian neural circuitry. Science 324, 354–359.
Hammond, C., Bergman, H., and Brown, P. (2007). Pathological synchronization in Parkinson’s disease: networks, models and treatments. Trends Neurosci. 30, 357–364.
Hammond, C., and Yelnik, J. (1983). Intracellular labelling of rat subthalamic neurones with horseradish peroxidase: computer analysis of dendrites and characterization of axon arborization. Neuroscience 8, 781–790.
Hashimoto, T., Elder, C. M., Okun, M. S., Patrick, S. K., and Vitek, J. L. (2003). Stimulation of the subthalamic nucleus changes the firing pattern of pallidal neurons. J. Neurosci. 23, 1916–1923.
Hauptmann, C., Roulet, J. C., Niederhauser, J. J., Döll, W., Kirlangic, M. E., Lysyansky, B., Krachkovskyi, V., Bhatti, M. A., Barnikol, U. B., Sasse, L., Bührle, C. P., Speckmann, E. J., Götz, M., Sturm, V., Freund, H. J., Schnell, U., and Tass, P. A. (2009). External trial deep brain stimulation device for the application of desynchronizing stimulation techniques. J. Neural Eng. 6, 066003.
Heimer, G., Bar-Gad, I., Goldberg, J. A., and Bergman, H. (2002). Dopamine replacement therapy reverses abnormal synchronization of pallidal neurons in the 1-methyl-4-phenyl-1,2,3,6-tetrahydropyridine primate model of parkinsonism. J. Neurosci. 22, 7850–7855.
Holgado, A. J. N., Terry, J. R., and Bogacz, R. (2010). Conditions for the generation of beta oscillations in the subthalamic nucleus-globus pallidus network. J. Neurosci. 30, 12340–12352.
Humphries, M. D., Stewart, R. D., and Gurney, K. N. (2006). A physiologically plausible model of action selection and oscillatory activity in the basal ganglia. J. Neurosci. 26, 12921–12942.
Kita, H., and Kitai, S. T. (1991). Intracellular study of rat globus pallidus neurons: membrane properties and responses to neostriatal, subthalamic and nigral stimulation. Brain Res. 564, 296–305.
Kita, H., and Kitai, S. T. (1994). The morphology of globus pallidus projection neurons in the rat: an intracellular staining study. Brain Res. 636, 308–319.
Kita, H., Tachibana, Y., Nambu, A., and Chiken, S. (2005). Balance of monosynaptic excitatory and disynaptic inhibitory responses of the globus pallidus induced after stimulation of the subthalamic nucleus in the monkey. J. Neurosci. 25, 8611–8619.
Krack, P., Hariz, M. I., Baunez, C., Guridi, J., and Obeso, J. A. (2010). Deep brain stimulation: from neurology to psychiatry? Trends Neurosci. 33, 474–484.
Kravitz, A. V., Freeze, B. S., Parker, P. R. L., Kay, K., Thwin, M. T., Deisseroth, K., and Kreitzer, A. C. (2010). Regulation of parkinsonian motor behaviours by optogenetic control of basal ganglia circuitry. Nature 466, 622–626.
Kringelbach, M. L., Jenkinson, N., Owen, S. L. F., and Aziz, T. Z. (2007). Translational principles of deep brain stimulation. Nat. Rev. Neurosci. 8, 623–635.
Kumar, A., Schrader, S., Aertsen, A., and Rotter, S. (2008). The high-conductance state of cortical networks. Neural Comput. 20, 1–43.
Leblois, A., Boraud, T., Meissner, W., Bergman, H., and Hansel, D. (2006). Competition between feedback loops underlies normal and pathological dynamics in the basal ganglia. J. Neurosci. 26, 3567–3583.
Levy, R., Ashby, P., Hutchison, W. D., Lang, A. E., Lozano, A. M., and Dostrovsky, J. O. (2002). Dependence of subthalamic nucleus oscillations on movement and dopamine in Parkinson’s disease. Brain 125, 1196–1209.
Liang, L., DeLong, M. R., and Papa, S. M. (2008). Inversion of dopamine responses in striatal medium spiny neurons and involuntary movements. J. Neurosci. 28, 7537–7547.
Magill, P. J., Bolam, J. P., and Bevan, M. D. (2001). Dopamine regulates the impact of the cerebral cortex on the subthalamic nucleus-globus pallidus network. Neuroscience 106, 313–330.
Mallet, N., Ballion, B., Le Moine, C., and Gonon, F. (2006). Cortical inputs and GABA interneurons imbalance projection neurons in the striatum of Parkinsonian rats. J. Neurosci. 26, 3875–3884.
Mallet, N., Pogosyan, A., Márton, L. F., Bolam, J. P., Brown, P., and Magill, P. J. (2008). Parkinsonian beta oscillations in the external globus pallidus and their relationship with subthalamic nucleus activity. J. Neurosci. 28, 14245–14258.
McIntyre, C. C., Savasta, M., Walter, B. L., and Vitek, J. L. (2004). How does deep brain stimulation work? Present understanding and future questions. J. Clin. Neurophysiol. 21, 40–50.
Moran, A., Stein, E., Tischler, H., Belelovsky, K., and Bar-Gad, I. (2011). Dynamic stereotypic responses of basal ganglia neurons to subthalamic nucleus high-frequency stimulation in the Parkinsonian primate. Front. Syst. Neurosci. 5:21. doi:10.3389/fnsys.2011.00021
Parent, A., and Hazrati, L. N. (1995). Functional anatomy of the basal ganglia. II. The place of subthalamic nucleus and external pallidum in basal ganglia circuitry. Brain Res. Rev. 20, 128–154.
Raz, A., Feingold, A., Zelanskaya, V., Vaadia, E., and Bergman, H. (1996). Neuronal synchronization of tonically active neurons in the striatum of normal and Parkinsonian primates. J. Neurophysiol. 76, 2083–2088.
Raz, A., Vaadia, E., and Bergman, H. (2000). Firing patterns and correlations of spontaneous discharge of pallidal neurons in the normal and the tremulous 1-methyl-4-phenyl-1,2,3,6-tetrahydropyridine vervet model of parkinsonism. J. Neurosci. 20, 8559–8571.
Sadek, A. R., Magill, P. J., and Bolam, J. P. (2007). A single-cell analysis of intrinsic connectivity in the rat globus pallidus. J. Neurosci. 27, 6352–6362.
Sato, F., Parent, M., Levesque, M., and Parent, A. (2000). Axonal branching pattern of neurons of the subthalamic nucleus in primates. J. Comp. Neurol. 424, 142–152.
Shen, K. Z., and Johnson, S. W. (2005). Dopamine depletion alters responses to glutamate and GABA in the rat subthalamic nucleus. Neuroreport 16, 171–174.
Smith, Y., Villalba, R., and Raju, D. (2009). Striatal spine plasticity in Parkinson’s disease: pathological or not? Parkinsonism Relat. Disord. 15, S156–S161.
Surmeier, D. J., Mercer, J. N., and Chan, C. S. (2005). Autonomous pacemakers in the basal ganglia: who needs excitatory synapses anyway? Curr. Opin. Neurobiol. 15, 312–318.
Tass, P., Smirnov, D., Karavaev, A., Barnikol, U., Barnikol, T., Adamchic, I., Hauptmann, C., Pawelcyzk, N., Maarouf, M., Sturm, V., Freund, H. J., and Bezruchko, B. (2010). The causal relationship between subcortical local field potential oscillations and Parkinsonian resting tremor. J. Neural Eng. 7, 16009.
Terman, D., Rubin, J. E., Yew, A. C., and Wilson, C. J. (2002). Activity patterns in a model for the subthalamopallidal network of the basal ganglia. J. Neurosci. 22, 2963–2976.
Tseng, K. Y., Kasanetz, F., Kargieman, L., Riquelme, L. A., and Murer, M. G. (2001). Cortical slow oscillatory activity is reflected in the membrane potential and spike trains of striatal neurons in rats with chronic nigrostriatal lesions. J. Neurosci. 21, 6430–6439.
van Albada, S. J., Gray, R. T., Drysdale, P. M., and Robinson, P. A. (2009). Mean-field modeling of the basal ganglia-thalamocortical system. II Dynamics of parkinsonian oscillations. J. Theor. Biol. 257, 664–688.
van Albada, S. J., and Robinson, P. A. (2009). Mean-field modeling of the basal ganglia-thalamocortical system. I Firing rates in healthy and Parkinsonian states. J. Theor. Biol. 257, 642–663.
Keywords: basal ganglia, Parkinson’s disease, oscillations, deep-brain-stimulation, spiking neural networks
Citation: Kumar A, Cardanobile S, Rotter S and Aertsen A (2011) The role of inhibition in generating and controlling Parkinson’s disease oscillations in the basal ganglia. Front. Syst. Neurosci. 5:86. doi: 10.3389/fnsys.2011.00086
Received: 26 May 2011; Accepted: 03 October 2011;
Published online: 24 October 2011.
Edited by:
Raphael Pinaud, University of Oklahoma Health Sciences Center, USAReviewed by:
Mark D. Humphries, Ecole Normale Superieure, FranceRafal Bogacz, University of Bristol, UK
Alan Dorval, University of Utah, USA
Copyright: © 2011 Kumar, Cardanobile, Rotter and Aertsen. This is an open-access article subject to a non-exclusive license between the authors and Frontiers Media SA, which permits use, distribution and reproduction in other forums, provided the original authors and source are credited and other Frontiers conditions are complied with.
*Correspondence: Ad Aertsen, Department of Neurobiology and Biophysics, University of Freiburg, D-79104 Freiburg, Germany. e-mail:YWVydHNlbkBiaW9sb2dpZS51bmktZnJlaWJ1cmcuZGU=