 Krishna M. Roskin1,2
 Heidi L. Meeds3
 Janani Madhuravasal Krishnan3Matthew Juhascik4John M. Cafardi5Jennifer L. Brown6
 Caroline Freiermuth7,8Michael S. Lyons9Kenneth E. Sherman3,7
 Jason T. Blackard3,7*
- 1Divisions of Biomedical Informatics and Immunobiology, Cincinnati Children’s Hospital Medical Center, Cincinnati, OH, United States
- 2Department of Pediatrics, University of Cincinnati College of Medicine, Cincinnati, OH, United States
- 3Division of Gastroenterology and Hepatology, Department of Internal Medicine, University of Cincinnati College of Medicine, Cincinnati, OH, United States
- 4Miami Valley Regional Crime Laboratory, Montgomery County Coroner’s Office, Dayton, OH, United States
- 5Division of Infectious Diseases, Department of Internal Medicine, The Christ Hospital and the Lindner Research Institute, Cincinnati OH, United States
- 6Department of Psychological Sciences, Purdue University, West Lafayette, IN, United States
- 7Center for Addiction Research, University of Cincinnati College of Medicine, Cincinnati, OH, United States
- 8Department of Emergency Medicine, University of Cincinnati College of Medicine, Cincinnati, OH, United States
- 9Department of Emergency Medicine, Ohio State University, Columbus, OH, United States
Introduction: The US has experienced a major drug epidemic in recent years, attributed in large part to synthetic opioids such as fentanyl. Here, we evaluated how recreational / non-prescribed fentanyl use in persons living with HCV infection impacted gene expression profiles in the peripheral blood.
Methods: Whole blood was collected from 11 individuals, including 4 HCV-negative healthy controls, 4 HCV-positive individuals with current fentanyl use, and 3 HCV-positive individuals with no current fentanyl / no opioid use.
Results: The median HCV RNA level was 5.6 log10 copies/mL. Cell frequencies were not different by fentanyl status except for non-CD4+, non-CD8+ T cells (higher for fentanyl use; p = 0.052). When comparing HCV-positive persons with / without fentanyl detected in their blood, 106 differentially expressed genes (DEGs) were identified, including 11 in CD4+ T lymphocytes, 46 in CD8+ T lymphocytes, 5 in monocytes, 13 in B lymphocytes (excluding plasmablasts), 24 in plasmablasts, 2 in dendritic cells, and 13 in NK cells. Seven DEGs – DHRS4L2, GZMA, H1-3, HLA-C, ISG15, PARP8, PRKX – were shared across multiple cell types, with the majority being involved in host defenses against viruses. Enrichment analysis of differentially expressed genes identified genes involved in multiple cellular processes and phenotypes. Expression of the HCV entry factor CD81 was high in PBMCs; however, other HCV entry factors were expressed at low levels, and none were differentially expressed in HCV-positive persons with / without fentanyl detected in their blood.
Discussion: These results highlight multiple pathways by which commonly abused opioids may affect HCV pathogenesis and may reveal additional pathways for novel target-specific therapeutic interventions and enhance the clinical management of this difficult-to-treat population.
Introduction
There are an estimated 50 million individuals infected with chronic hepatitis C virus (HCV) worldwide (1). Highly effective direct-acting agents can cure ~95% of persons with HCV infection. However, diagnosis and subsequent access to these treatments are low for certain at-risk populations. New HCV infections increased steadily from 2013 to 2021 and have remained relatively stable since then; however, infections are well above the annual target (2). Blood exposure is a major route of HCV transmission, and persons who use/inject drugs (PWID) are at significant risk for HCV infection, as well as re-infection.
There were an estimated 3.69 million PWIDs in the US – representing 1.46% of the adult population – in 2018, and the number of drug overdose deaths has increased significantly in recent years (3–5). More than 106,000 persons in the U.S. died from drug-involved overdoses in 2021, including illicit drugs and prescription opioids (6). Opioid-involved overdose deaths rose from 21,089 in 2010 to 47,600 in 2017 (6). Deaths involving synthetic opioids other than methadone (primarily fentanyl) continued to rise in 2021. While fentanyl is used clinically for pain management, it has increased dramatically in availability and gained widespread recreational use (7–12). In 2017, a study conducted in southwest Ohio found that ~90% of unintentional overdoses involved fentanyl and that high-burden counties accounted for 73% of these deaths (13, 14). Recreational/non-prescribed use has led to significant increases in incident HCV and HIV infections, as exemplified by the HIV/HCV outbreak in Indiana in 2015, as well as across Appalachia and parts of New England (8, 15–23). Globally, the incidence of HCV among PWIDs ranged from 0.2 to 72.5 per 100 person-years, with a pooled incidence of 12.1 per 100 person-years (24).
Opioid receptors are abundantly expressed on various immune cells, including CD4+ T lymphocytes and monocyte-derived macrophages (25). Opioid receptors are also expressed in the liver – including in hepatocytes and hepatic stellate cells – and are important mediators of disease progression (26–32). Commonly abused opioids and their receptors promote viral replication and virus-mediated pathology (33). For instance, multiple opioids are known to increase HIV replication in immune cells through increased chemokine receptor expression, inhibition of β chemokines, inhibition of the endogenous interferon response, and/or modulation of microRNA expression (34). In contrast, less is known about the impact of opioids on HCV and liver disease. In vitro studies demonstrate that morphine, heroin, and methamphetamine enhance HCV replication (35–39). We recently reported that the synthetic opioid fentanyl increased HCV replication in vitro in a dose-dependent manner (40). The addition of fentanyl also resulted in significant apoptosis. RNA sequencing of fentanyl-exposed hepatocytes identified multiple differentially expressed genes, including those involved in the antiviral interferon response, NFκB signaling, chemokine signaling, and apoptosis. A recent study of PWIDs in the United States and Mexico found that fentanyl was associated with increased HCV seroconversion; however, more research is needed to understand the mechanisms underpinning this association (41). As higher virus levels are associated with pathogenesis and increased risk of transmission to others, additional research is essential to our understanding of opioid-virus pathogenesis and for the development of new and optimized treatment strategies to treat HCV infection in high-risk populations. To this end, we evaluated the peripheral blood response to recent fentanyl use in persons with HCV infection.
Methods
Patient population
From March 2019 to December 2024, we conducted a short-term, observational, non-interventional study of persons with fentanyl use/exposure in the greater Cincinnati area. The inclusion criteria were adults >18 years of age who presented to the UC Emergency Department (ED) for unintentional overdose. Exclusion criteria include intentional overdose (suicide attempt) with non-opioids and inability or not willing to provide informed consent. While the parent study focused on persons living with HIV, a sub-study also included individuals with HCV mono-infection. HCV status was determined by patient self-report and review of electronic medical records. Opioid use disorder (OUD) was defined as scoring positive for opioids on the NIDA-Modified ASSIST tool and/or OUD listed in the electronic medical record.
Whole blood was collected from HCV-positive adults at the University of Cincinnati Medical Center, as well as HCV-negative/non-opioid using controls. Participants provided written informed consent prior to any study procedures and were compensated $20 for their participation. The University of Cincinnati Institutional Review Board approved this study as 2019_0584. All research involving human research participants was performed in accordance with the Declaration of Helsinki.
Sample processing
PBMCs were isolated from ~40 mLs of whole blood collected in BD Vacutainer Cell Prep Tubes per the manufacturer’s protocol and stored in fetal bovine serum (FBS) with 10% dimethyl sulfoxide in liquid nitrogen. To minimize RNA degradation, all samples were processed from collection to freezing within 4 hours (mean of 2.75 hours; range: 1.95 – 3.92 hours). To prepare PBMCs for 10x single cell labeling, cells were thawed and counted. Viability was confirmed by trypan blue staining as greater than 90%, and the concentration was adjusted to 1 x 10⁶ cells/mL in Dulbecco’s phosphate-buffered saline.
Drug use screening
Plasma samples from all study participants were screened by a targeted Liquid Chromatography Mass Spectrometry (LC-MS/MS) approach for 95 commonly used drugs and volatile compounds (e.g., ethanol) by Gas Chromatography Mass Spectrometry (GC/MS). For LC-MS/MS analysis, 0.5 mL of the sample was diluted with buffer and subjected to solid-phase extraction using United Chemical Technologies Clean Screen extraction columns. For GC/MS analysis, 0.1 mL of sample was placed into a headspace vial for analysis. The LC-MS/MS analysis used targeted transitions, while the GC/MS was operated in full-scan. This screening process can detect drugs from the following classes: opioids, medications for the treatment of OUD, stimulants, benzodiazepines, barbiturates, antidepressants, hallucinogens, over-the-counter drugs, marijuana, and anti-epileptics. Confirmation and quantitation were performed by LC-MS/MS when the sample volume was sufficient. For samples with multiple positive results, stimulants and opioids (including fentanyl and fentanyl analogs) were prioritized for confirmation testing.
Single cell RNAseq analysis
Single cell barcoding and complementary DNA (cDNA) and V(D)J library preparation were performed at the Single Cell Genomics Facility (Cincinnati Children’s Hospital Medical Center, RRID: SCR_022653) using Chromium Next GEM Single Cell 5’ Reagent Kits v2 (Dual index) according to the manufacturer’s protocol. Briefly, cell suspensions, beads, master mix, and partitioning oil were loaded onto a “K” chip for a targeted output of 10,000 cells per library and run on the Chromium X. Reverse transcription was performed at 53 °C for 45 min and cDNA was amplified for 14 cycles using a Bio-Rad C1000 Touch thermocycler followed by cDNA size selection using SpriSelect beads (Beckman Coulter, USA). cDNA quality was confirmed with an Agilent Bioanalyzer High Sensitivity chip. DNA fragmentation, end-repair, A-tailing, and ligation of sequencing adapters were performed per the manufacturer’s protocol (10x Genomics, USA). Libraries were run on a NovaSeq 6000 S1 or S4 flow cell (depending on the number of samples) at the Genomics Sequencing Facility (Cincinnati Children’s Hospital Medical Center, RRID: SCR_022630).
Raw base call files were de-multiplexed with Cell Ranger (42) v9.0.0 mkfastq. Reads were aligned to the human reference genome GRCh38, and gene expression was quantified using Cell Ranger count with default parameters. SoupX v1.6.2 (43) was used to remove cell free mRNA contamination from each library using the estimation of the contamination rate implemented in the autoEstCont and adjustCounts function. Doublets and multiplets were removed using Scrublet v0.2.2 (44). Cells displaying more than 20% mitochondrial gene expression – or fewer than 200 total expressed genes – were excluded from analysis. Gene expression counts were integrated in R v4.4.0 using Seurat v5.2.1 and Harmony v1.2.3 integration with default parameters (45). Cell types were annotated via label transfer from a high-quality, multi-model PBMC reference dataset using the Azimuth v0.5.0 pipeline in Seurat (46), and the reference Uniform Manifold Approximation and Projection (UMAP) coordinates were used. Analysis was conducted with compute and storage resources provided by Information Services for Research (IS4R, Cincinnati Children’s Hospital Medical Center, RRID: SCR_022622).
Doublet rates were 3.5% to 9.4% (median 4.6%). Ambient RNA contamination rates were 1.0% to 3.5% (median 1.7%). Transcripts were pooled within each cell type and study participant for pseudobulk analysis using DESeq2 v1.46 (47). This approach outperforms generic and specialized single cell differential gene analysis (DGA) methods (48) by limiting type I error and allows the use of bulk RNAseq tools while preserving cell type resolution. This approach has been employed by other single cell transcriptomic studies (49–54).
Differentially expressed genes (DEGs) were identified with the following inclusion criteria: fold change +/- 20% and adjusted p-value < 0.05. For DEG analysis, protein-coding genes as annotated by Ensembl release 112 (55) were used, and genes were required to have 10 or more reads expressed in 3 or more samples to be included in the analysis. To reduce the rate of false positives, shrinkage was applied to the effect sizes using the “apeglm” method implemented by lfcShrink (56).
HCV entry factors included 5-HT2AR, AP2, APOE, CD81, CLDN1, DC-SIGN/CD209, EGRF, HIP1R, L-SIGN/CLEC4M, LDLR, NPC1L1, OCLN, SR-BI, SRFBP1, and VLDLR (57, 58). Interferon (IFN)/interferon-stimulated genes (ISG) included 80 type I, II, or III IFNs and ISGs associated with these pathways as described in the Interferome database (59).
Plots were generated using R ggplot2 v3.5.1, ggpubr v0.6.0, and Seurat 5.2.1 (46, 60, 61). Enrichment analysis was performed using ToppCluster and Enrichr-KG to identify specialized biological functions and regulatory networks (62–65).
Results
Patient characteristics
Eleven blood samples were collected from 4 HCV-positive individuals with current fentanyl use, 3 HCV-positive individuals without current fentanyl use, and 4 HCV-negative, non-opioid-using healthy controls (Table 1).
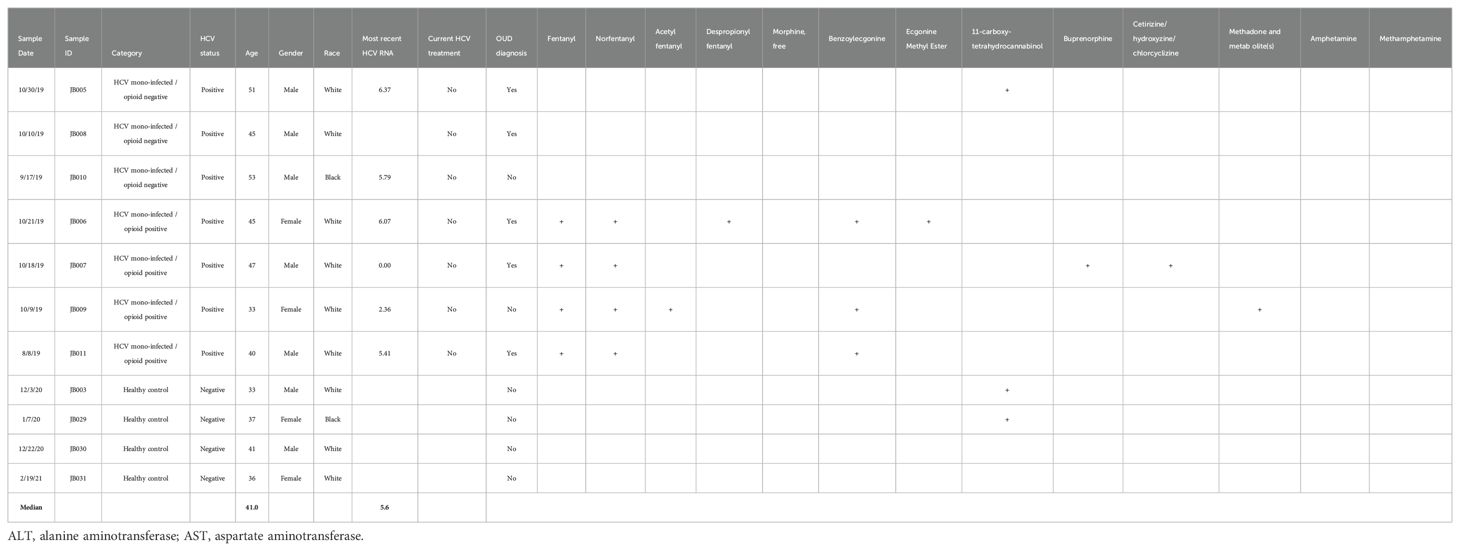
Table 1. Baseline sociodemographic, clinic characteristics, and drug screen results.
Among HCV-positive participants, the median age was 45 years (range: 33 – 53), 5 individuals were male, and 6 were white/non-Hispanic. The median HCV viral load was 5.6 log10 copies/mL (range: 0.00 – 6.37), while median alanine aminotransferase (ALT) and aspartate aminotransferase (AST) levels were 35 IU/L (range: 21 – 197) and 69 IU/L (range: 20 – 373), respectively. No study participants were currently receiving treatment for HCV infection. Five individuals had an OUD diagnosis, including 3 in the fentanyl-positive group and 2 in the fentanyl-negative group.
Fentanyl was detected in all 4 individuals in the opioid-using group. Fentanyl analogs and metabolites were also detected, including norfentanyl (n = 4), acetyl fentanyl (n = 1), and despropionyl fentanyl (n = 1). Buprenorphine and methadone were each detected in 1 individual in the opioid-using group. Cocaine metabolites were detected in 3 individuals in the opioid-using group. 11-carboxy-tetrahydrocannabinol was detected in one individual in the non-opioid use group and two healthy controls.
A total of 144,026 cells were evaluated by single-cell RNA-seq analysis with a mean of 13,093 cells per individual. Cells with ambient RNA contamination, doublets, or multiplets were removed. The mitochondrial content for all PBMC samples was low (Supplementary Figure 1). Cells with >20% mitochondrial content were removed, leaving 134,768 cells (94%; mean of 13,002 cells per individual) passing these quality control measures (Supplementary Table 1). Cell clusters within PBMCs were identified by label transfer from a high-quality reference dataset, as shown by fentanyl status in Figure 1 and individually in Supplementary Figure 2. There were no statistically significant differences in cell frequency based on fentanyl status for CD4+ T lymphocytes, CD8+ T lymphocytes, monocytes, B lymphocytes (excluding plasmablasts), plasmablasts, dendritic cells, natural killer (NK) cells, other T lymphocytes, or other cells (Figure 2). For other T cells, there was a trend towards a higher cell frequency in fentanyl-positive versus fentanyl-negative individuals (p = 0.052).
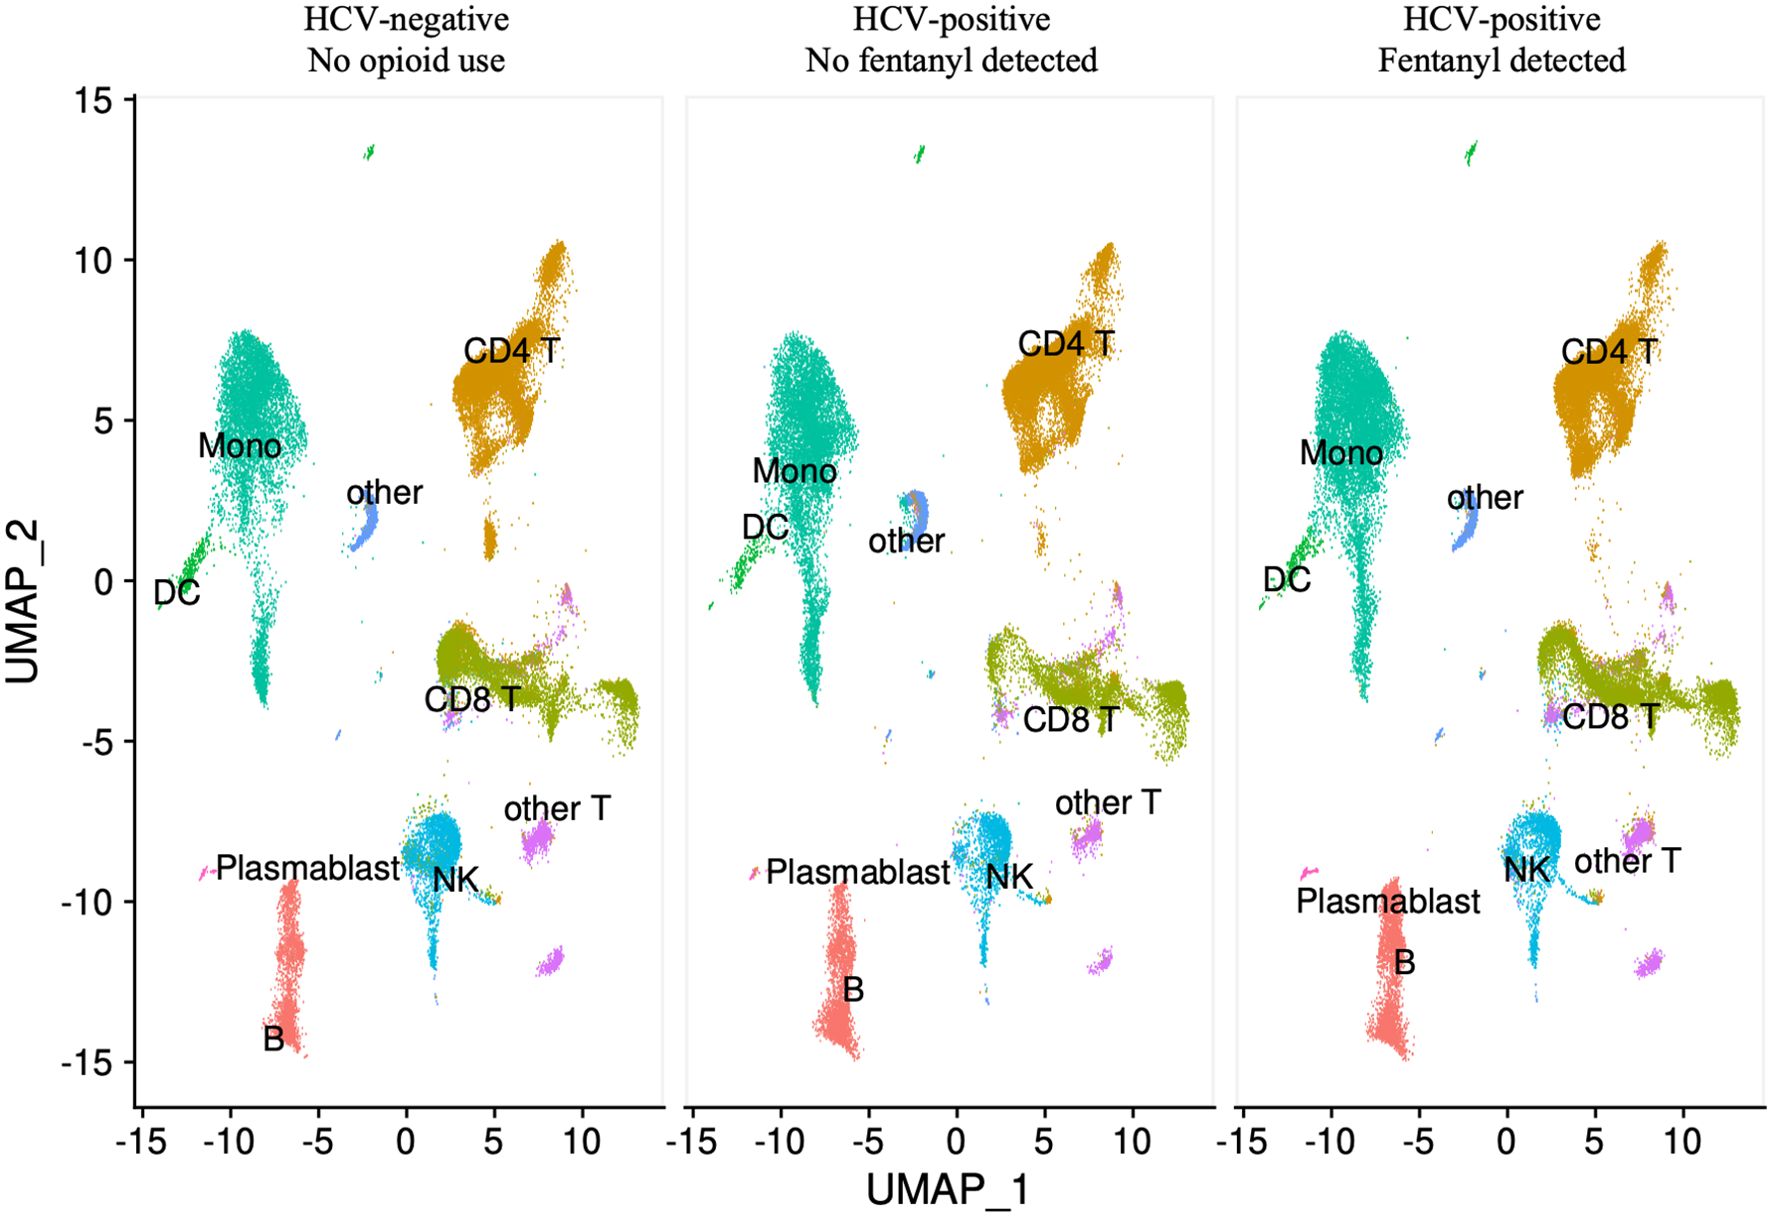
Figure 1. UMAP visualization of PBMCs by fentanyl detection status. Each circle represents an individual cell colored by cell type.
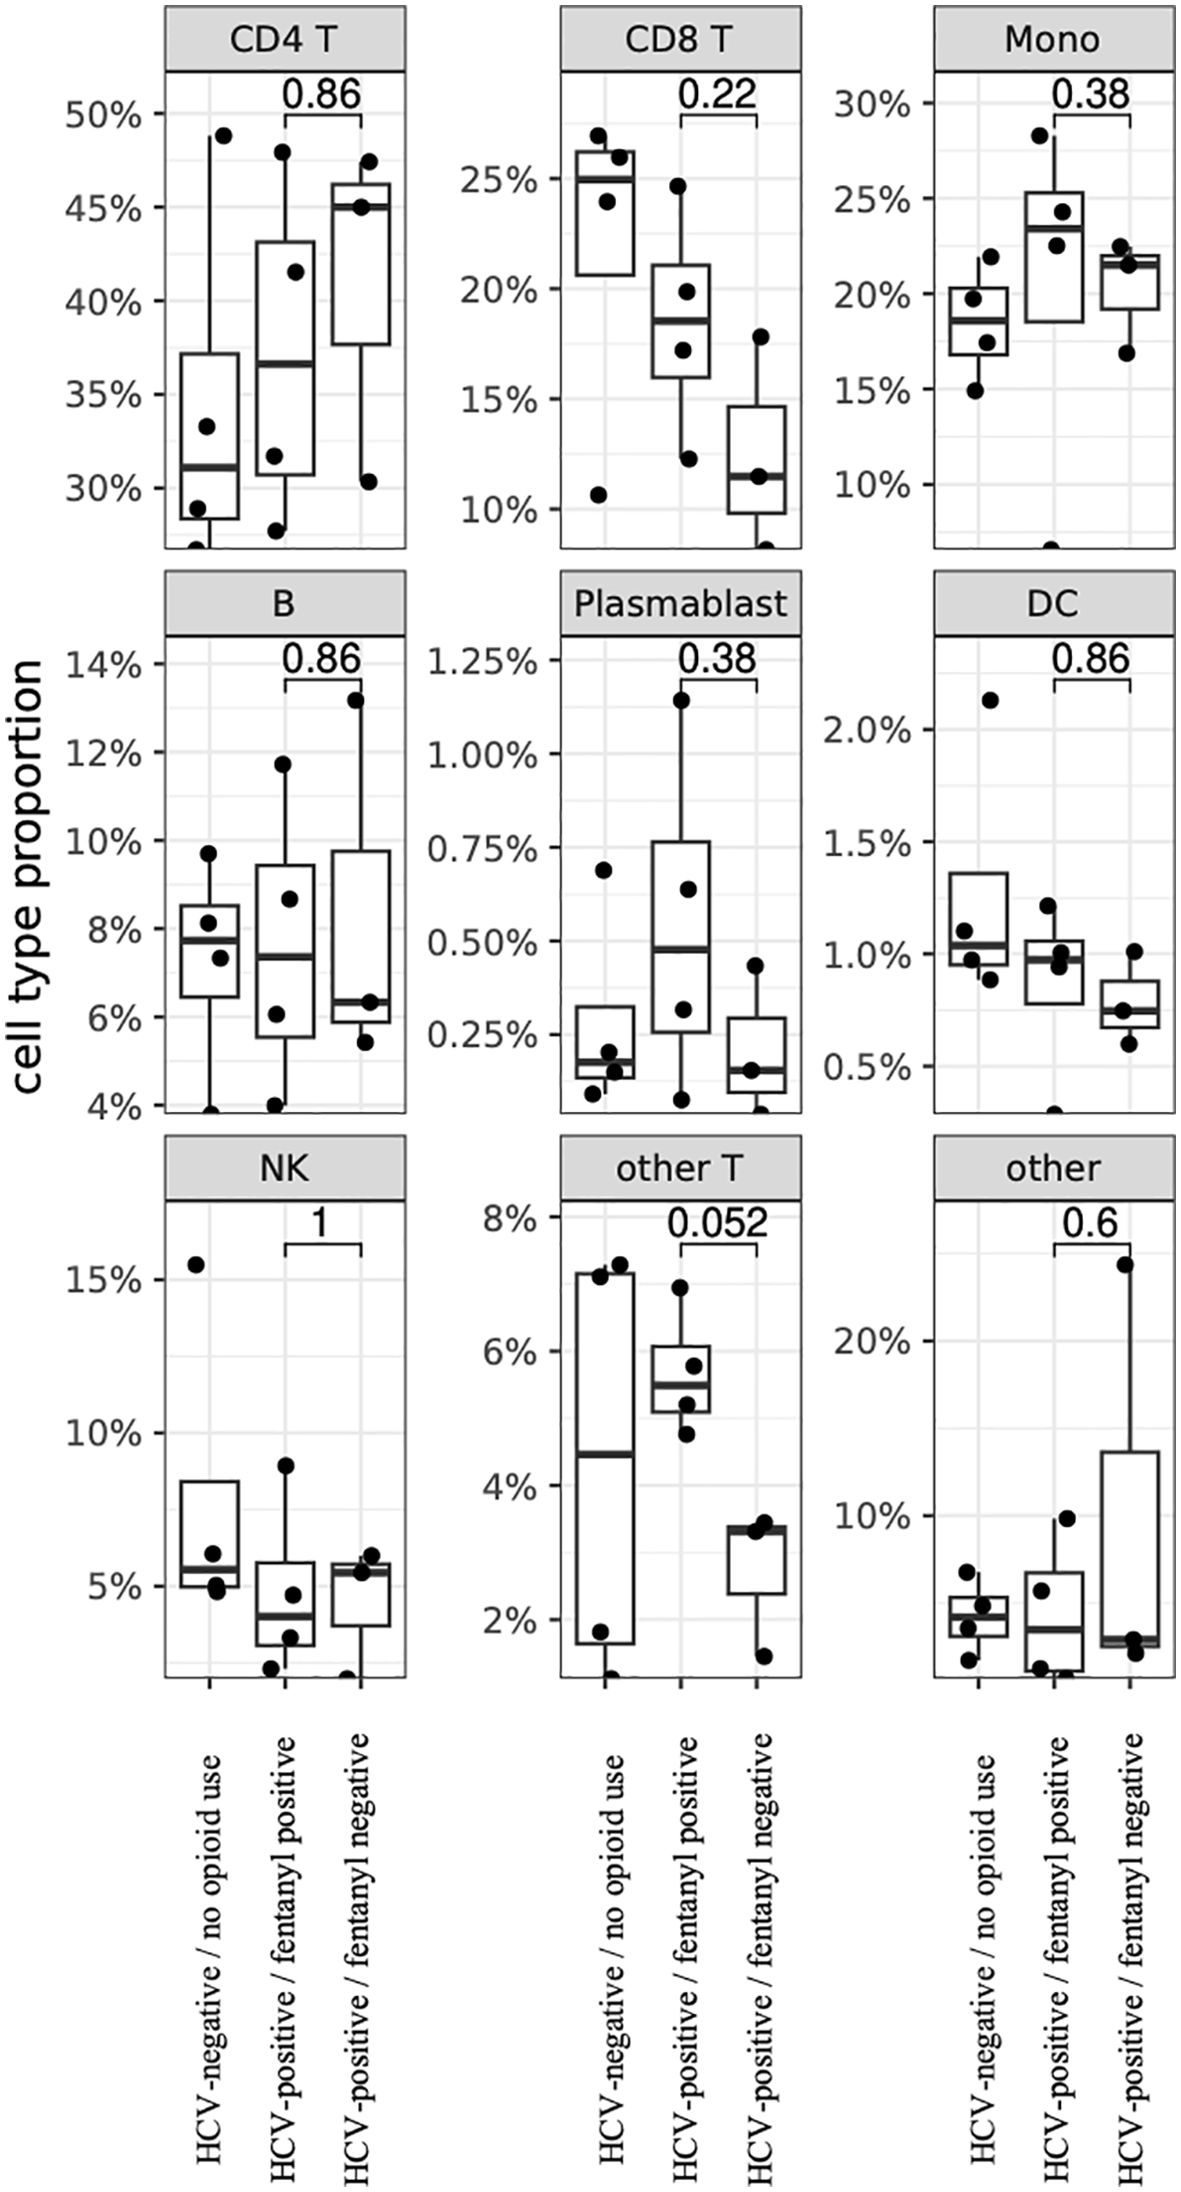
Figure 2. PBMC cell proportions by fentanyl detection status. Each circle represents the cell proportion for a particular cell type from one individual. P-values for differences in proportions were calculated using a two-sided Wilcoxon rank-sum test.
DGA was performed for multiple peripheral blood cell types, including CD4+ T lymphocytes, CD8+ T lymphocytes, monocytes, dendritic cells, and NK cells. Two B cell subpopulations – plasmablasts and B lymphocytes (excluding plasmablasts) – showed distinct gene expression patterns (data not shown) and were analyzed separately. When comparing HCV-positive individuals who were fentanyl-positive versus fentanyl-negative at the time of sample collection, we included OUD diagnosis as a covariate, there were 106 differentially expressed genes. There were 11 DEGs – 4 downregulated and 7 upregulated – in CD4+ T lymphocytes (Figure 3, Supplementary Table 2). In CD8+ T lymphocytes, there were 46 DEGs, including 6 downregulated and 40 upregulated genes (Figure 4, Supplementary Table 3). There were 5 DEGs, including 1 downregulated and 4 upregulated genes, in monocytes (Figure 5, Supplementary Table 4). For B lymphocytes (excluding plasmablasts), there were 13 DEGs – 6 downregulated and 7 upregulated (Figure 6, Supplementary Table 5). In plasmablasts, there were 24 DEGs, 4 downregulated and 20 upregulated (Figure 7, Supplementary Table 6). There were 2 DEGs identified in dendritic cells (Figure 8, Supplementary Table 7) – both downregulated. In NK cells, there were 13 DEGs, including 6 downregulated and 7 upregulated genes (Figure 9, Supplementary Table 8).
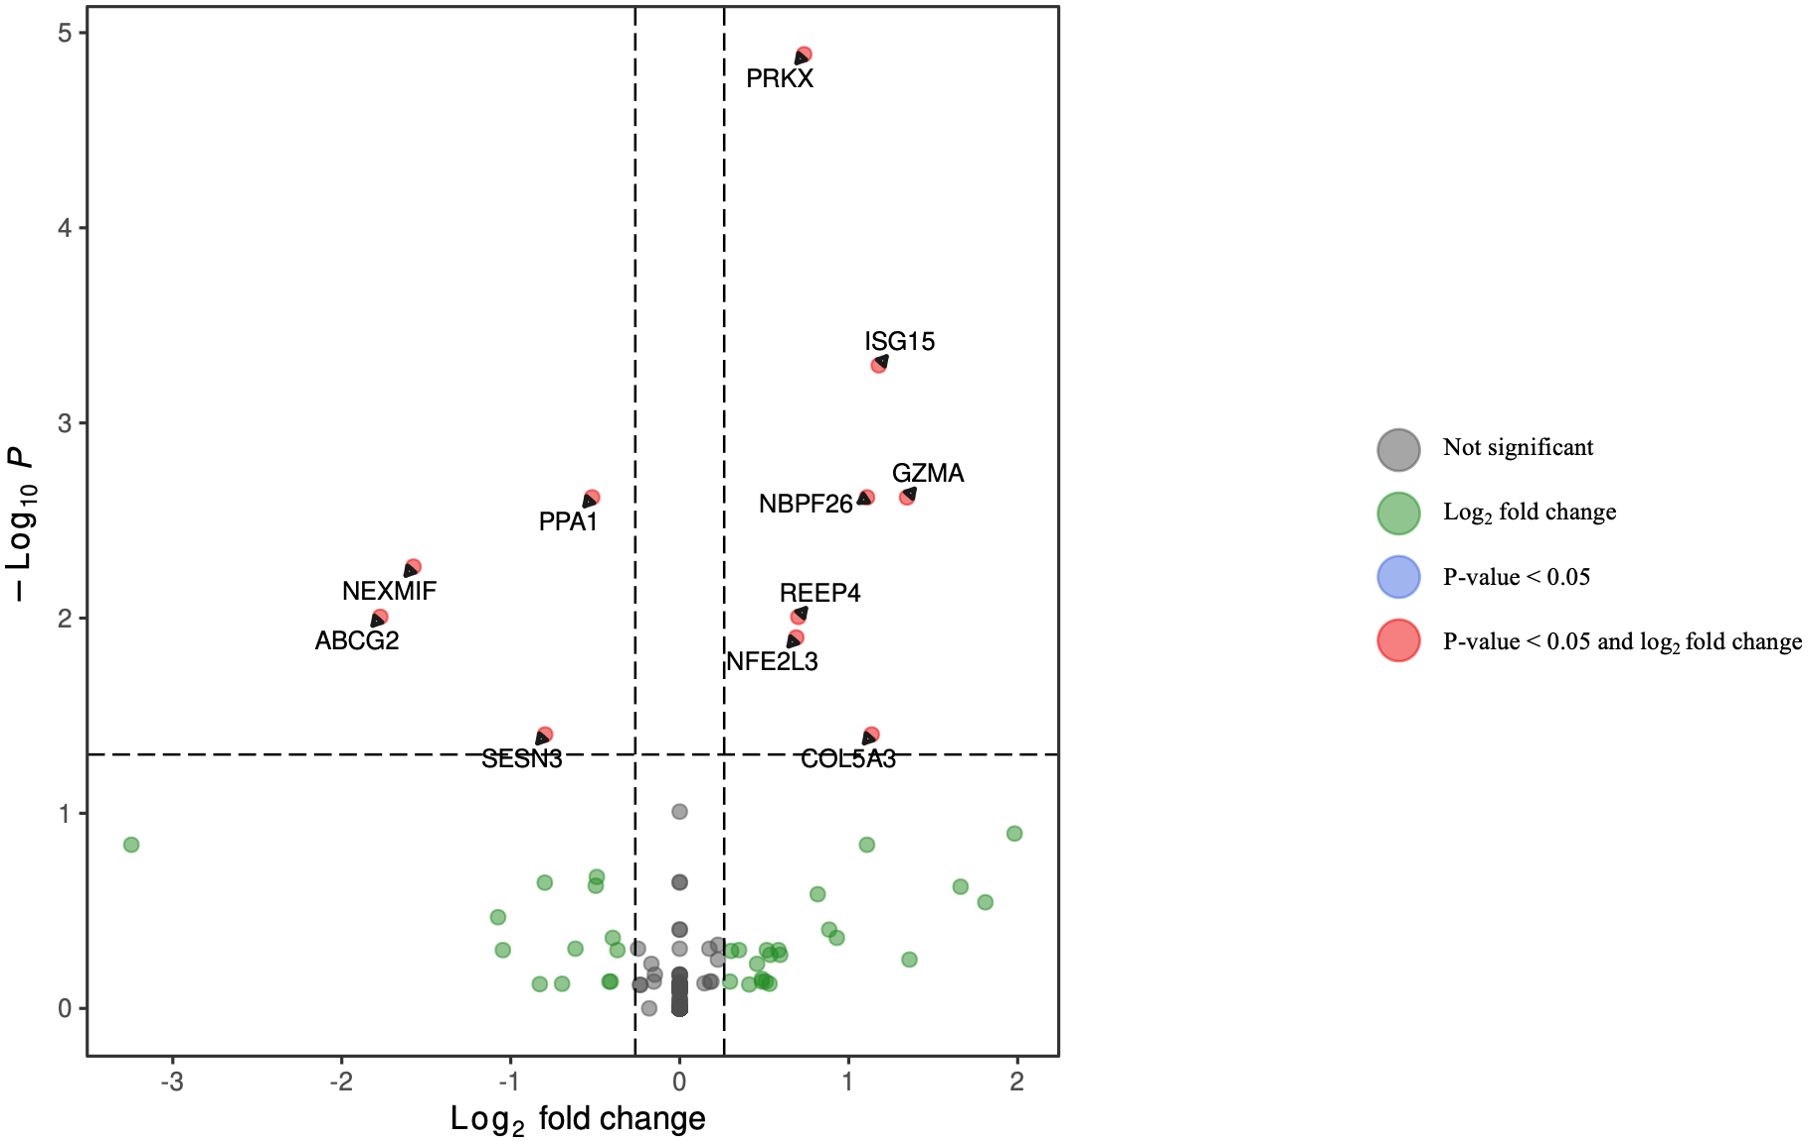
Figure 3. Volcano plot of differentially expressed genes in CD4+ T lymphocytes for HCV-positive study participants with/without fentanyl detection.
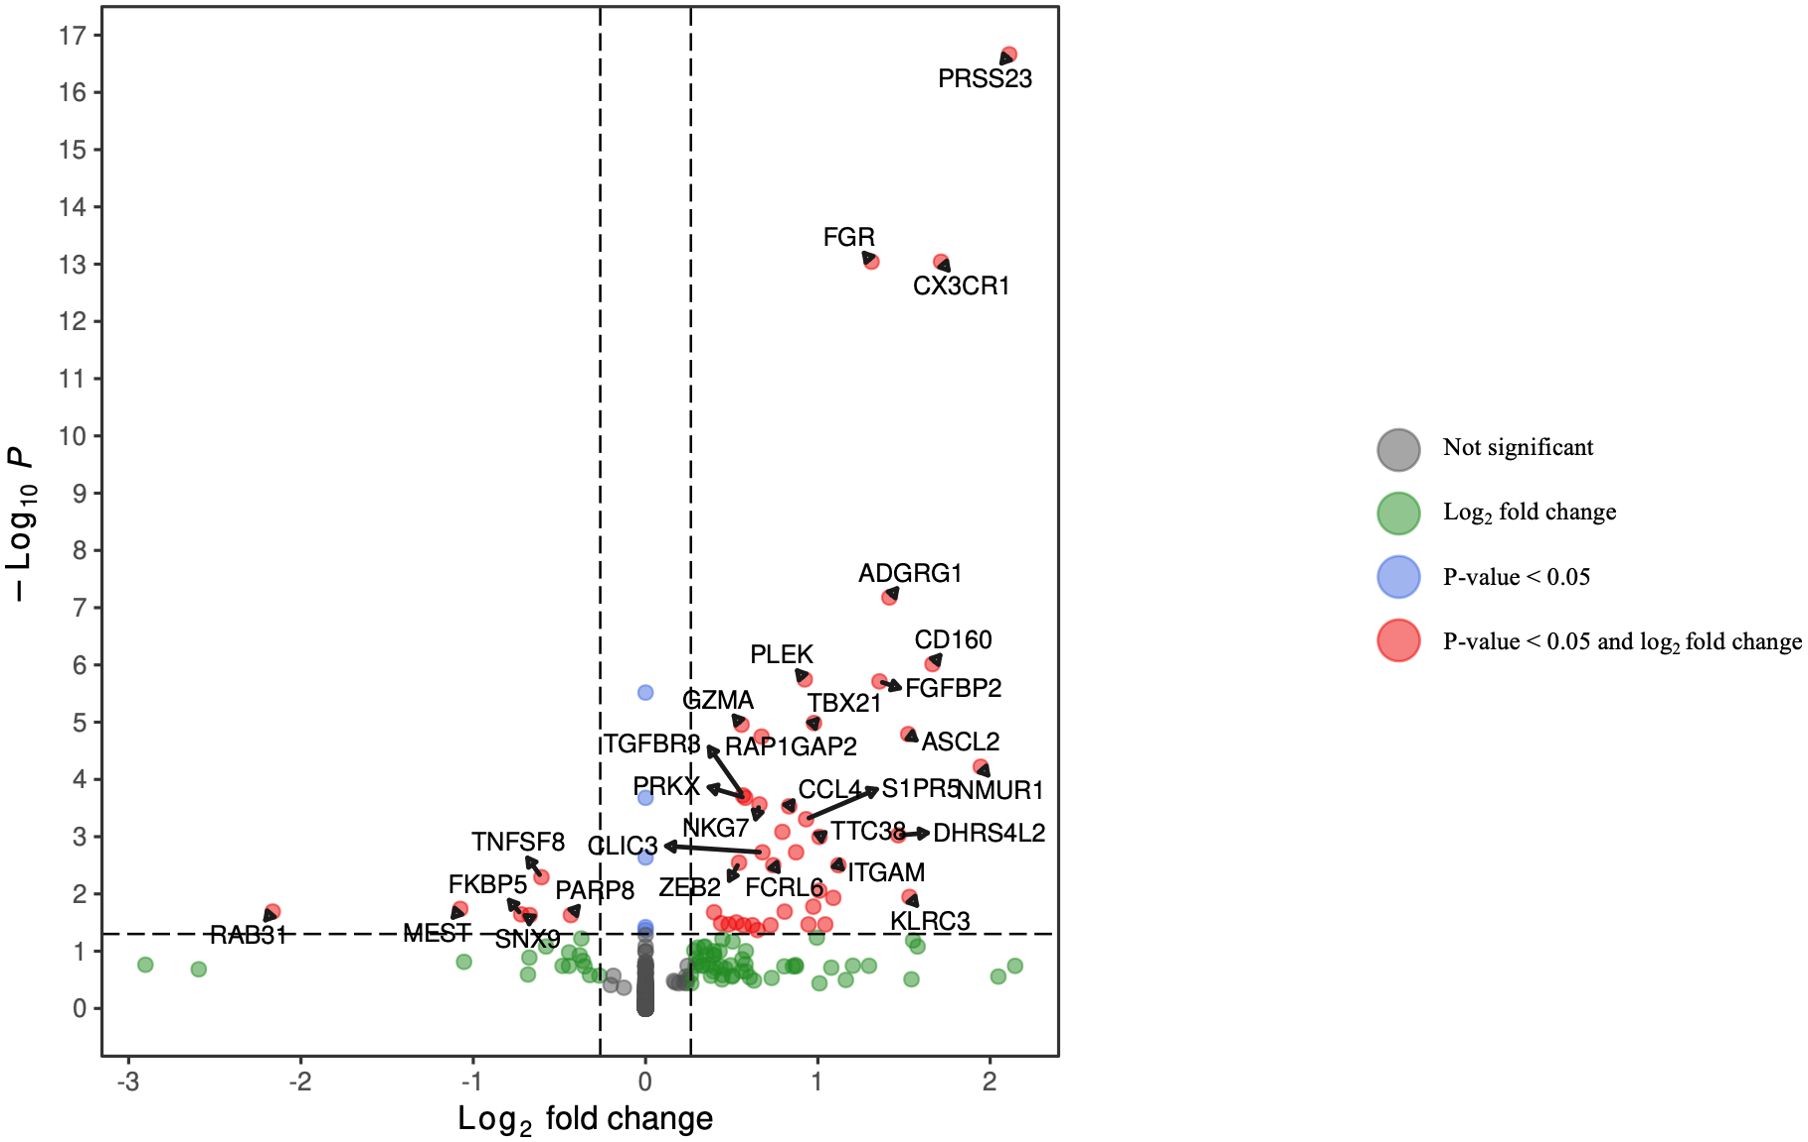
Figure 4. Volcano plot of differentially expressed genes in CD8+ T lymphocytes for HCV-positive study participants with/without fentanyl detection.
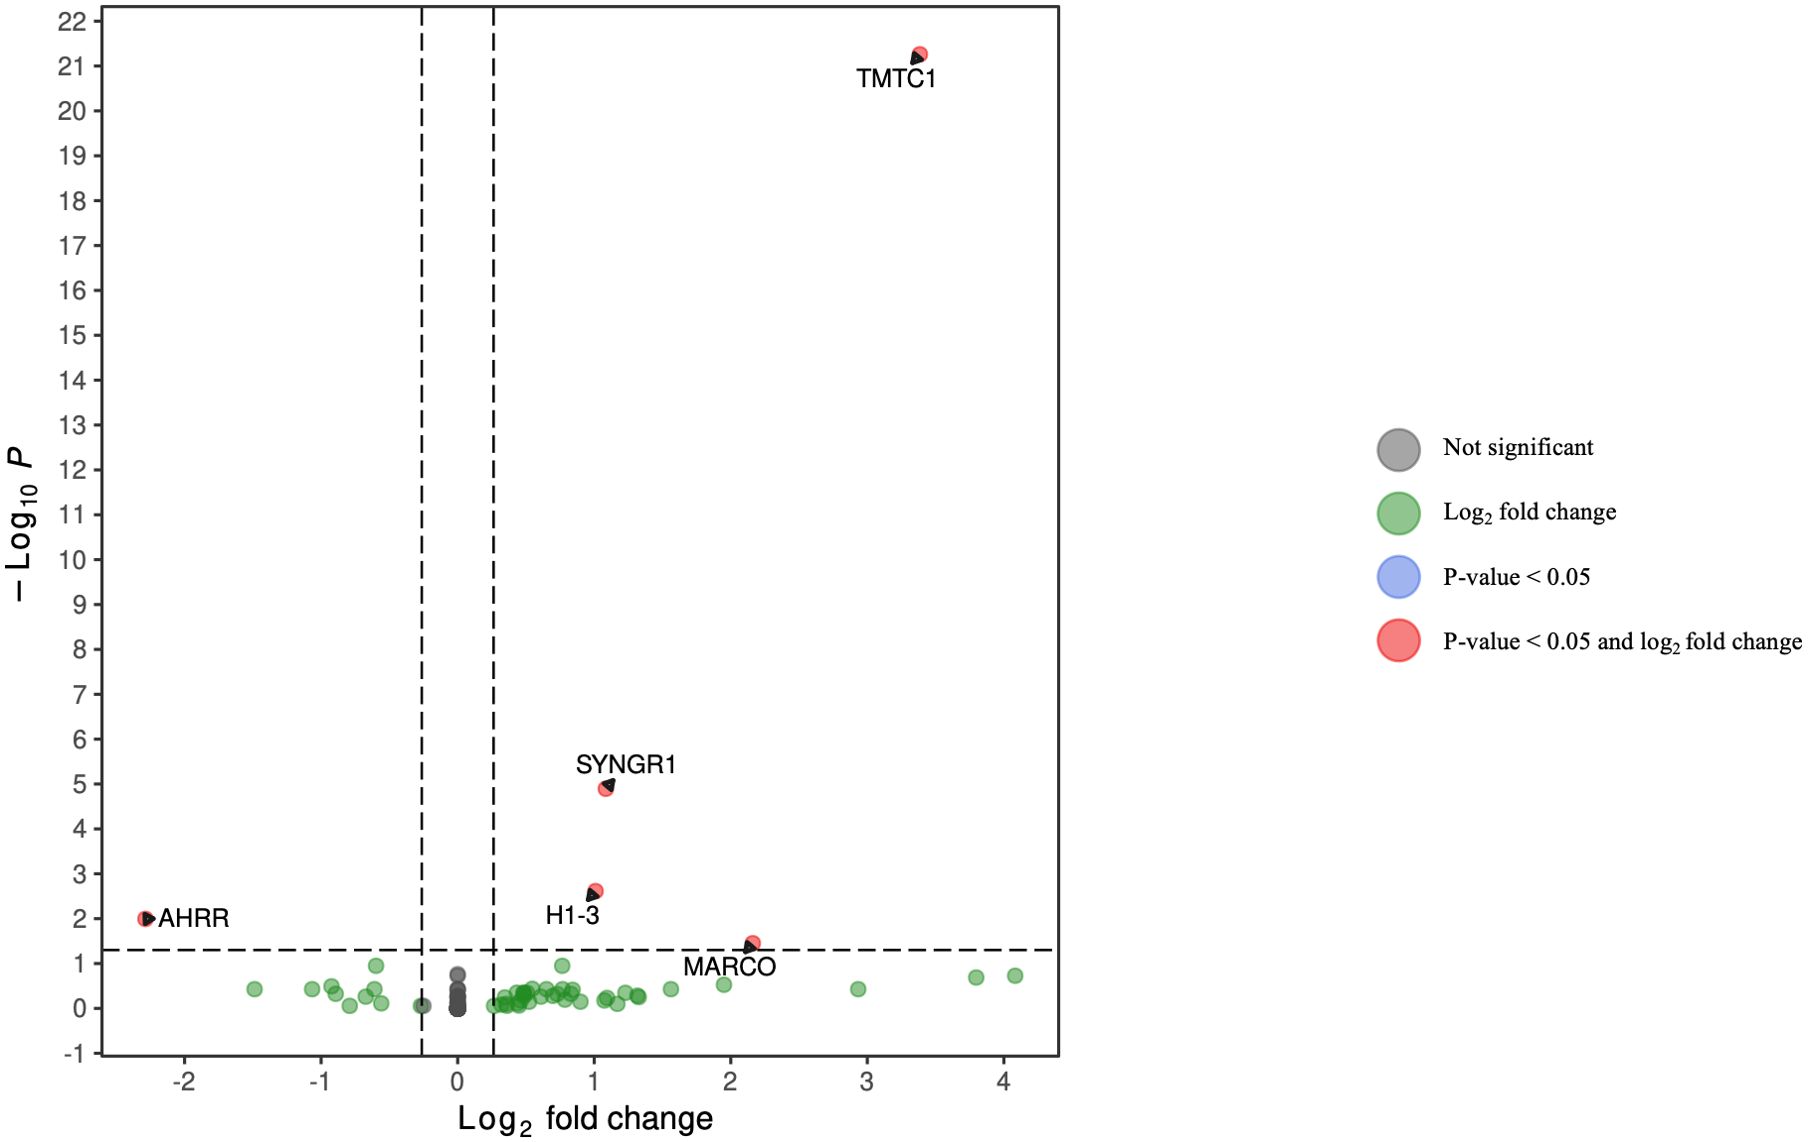
Figure 5. Volcano plot of differentially expressed genes in monocytes for HCV-positive study participants with/without fentanyl detection.
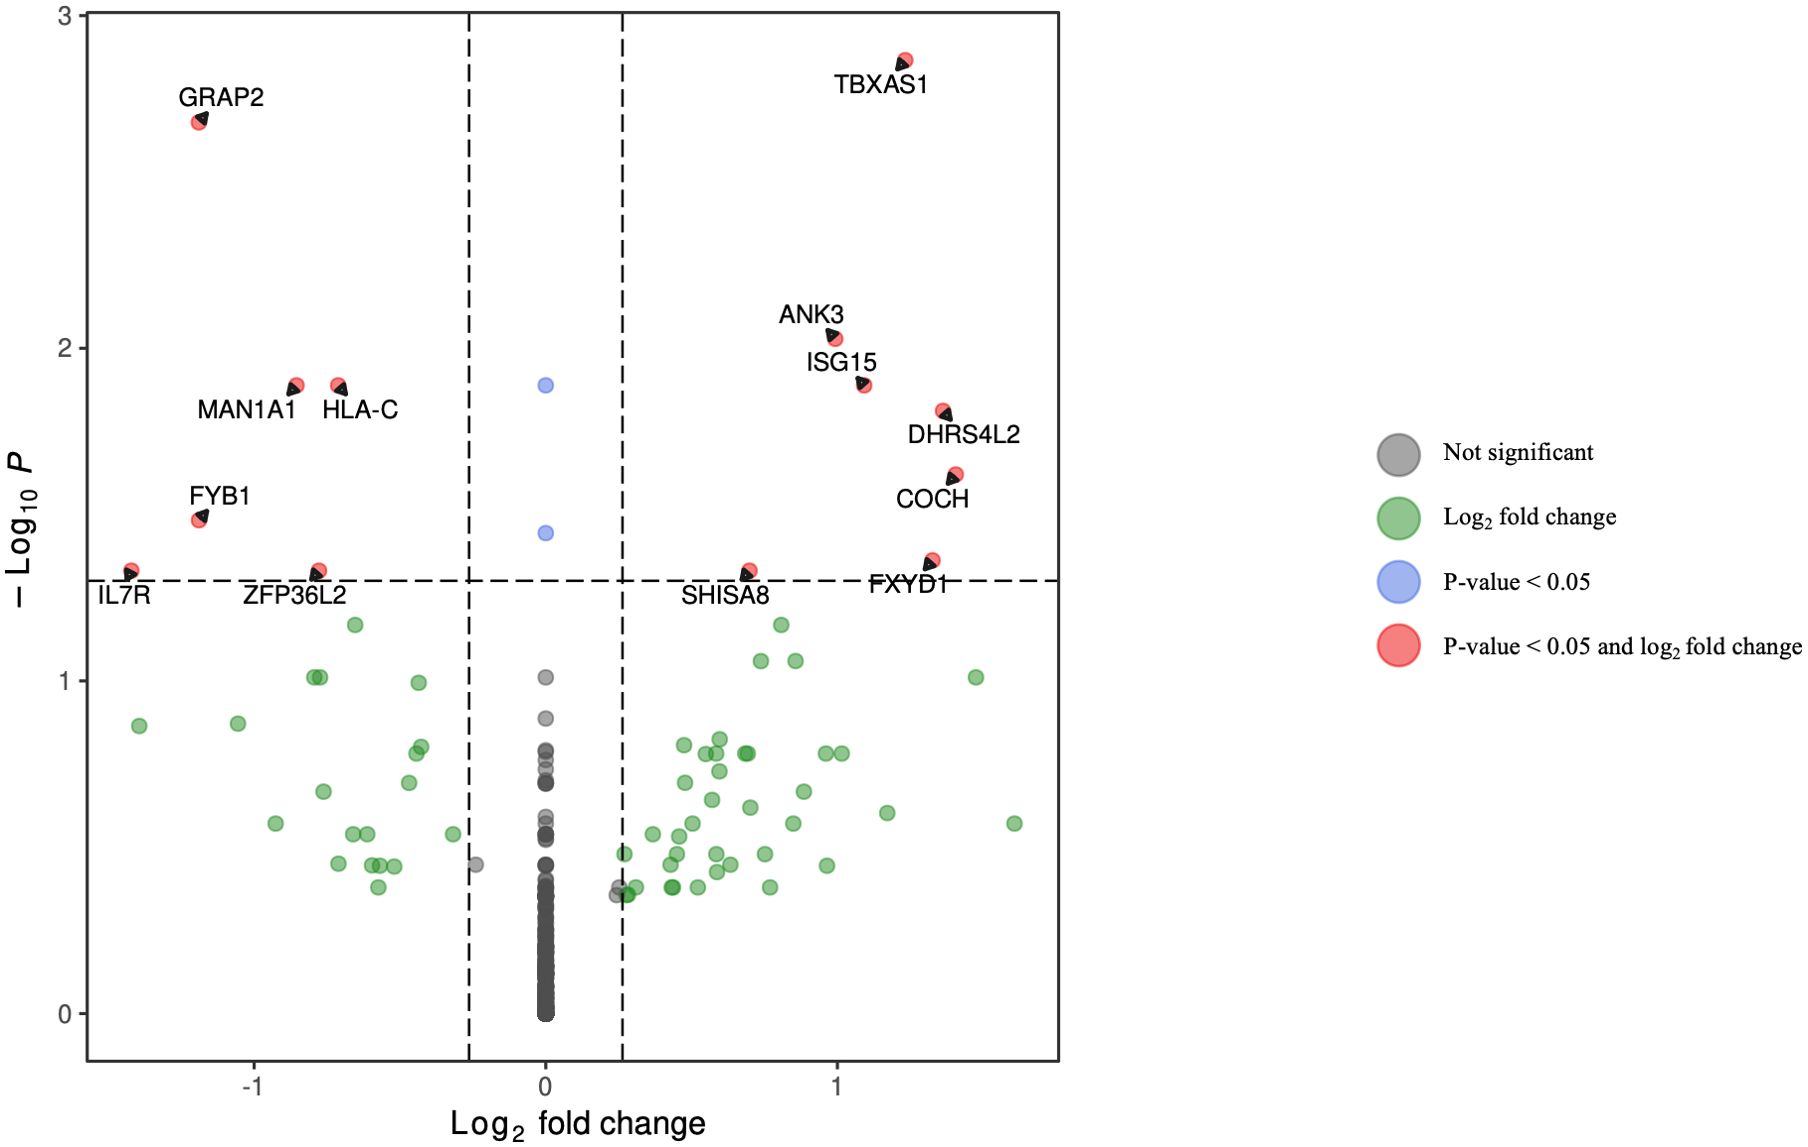
Figure 6. Volcano plot of differentially expressed genes in B lymphocytes (excluding plasmablasts) for HCV-positive study participants with/without fentanyl detection.
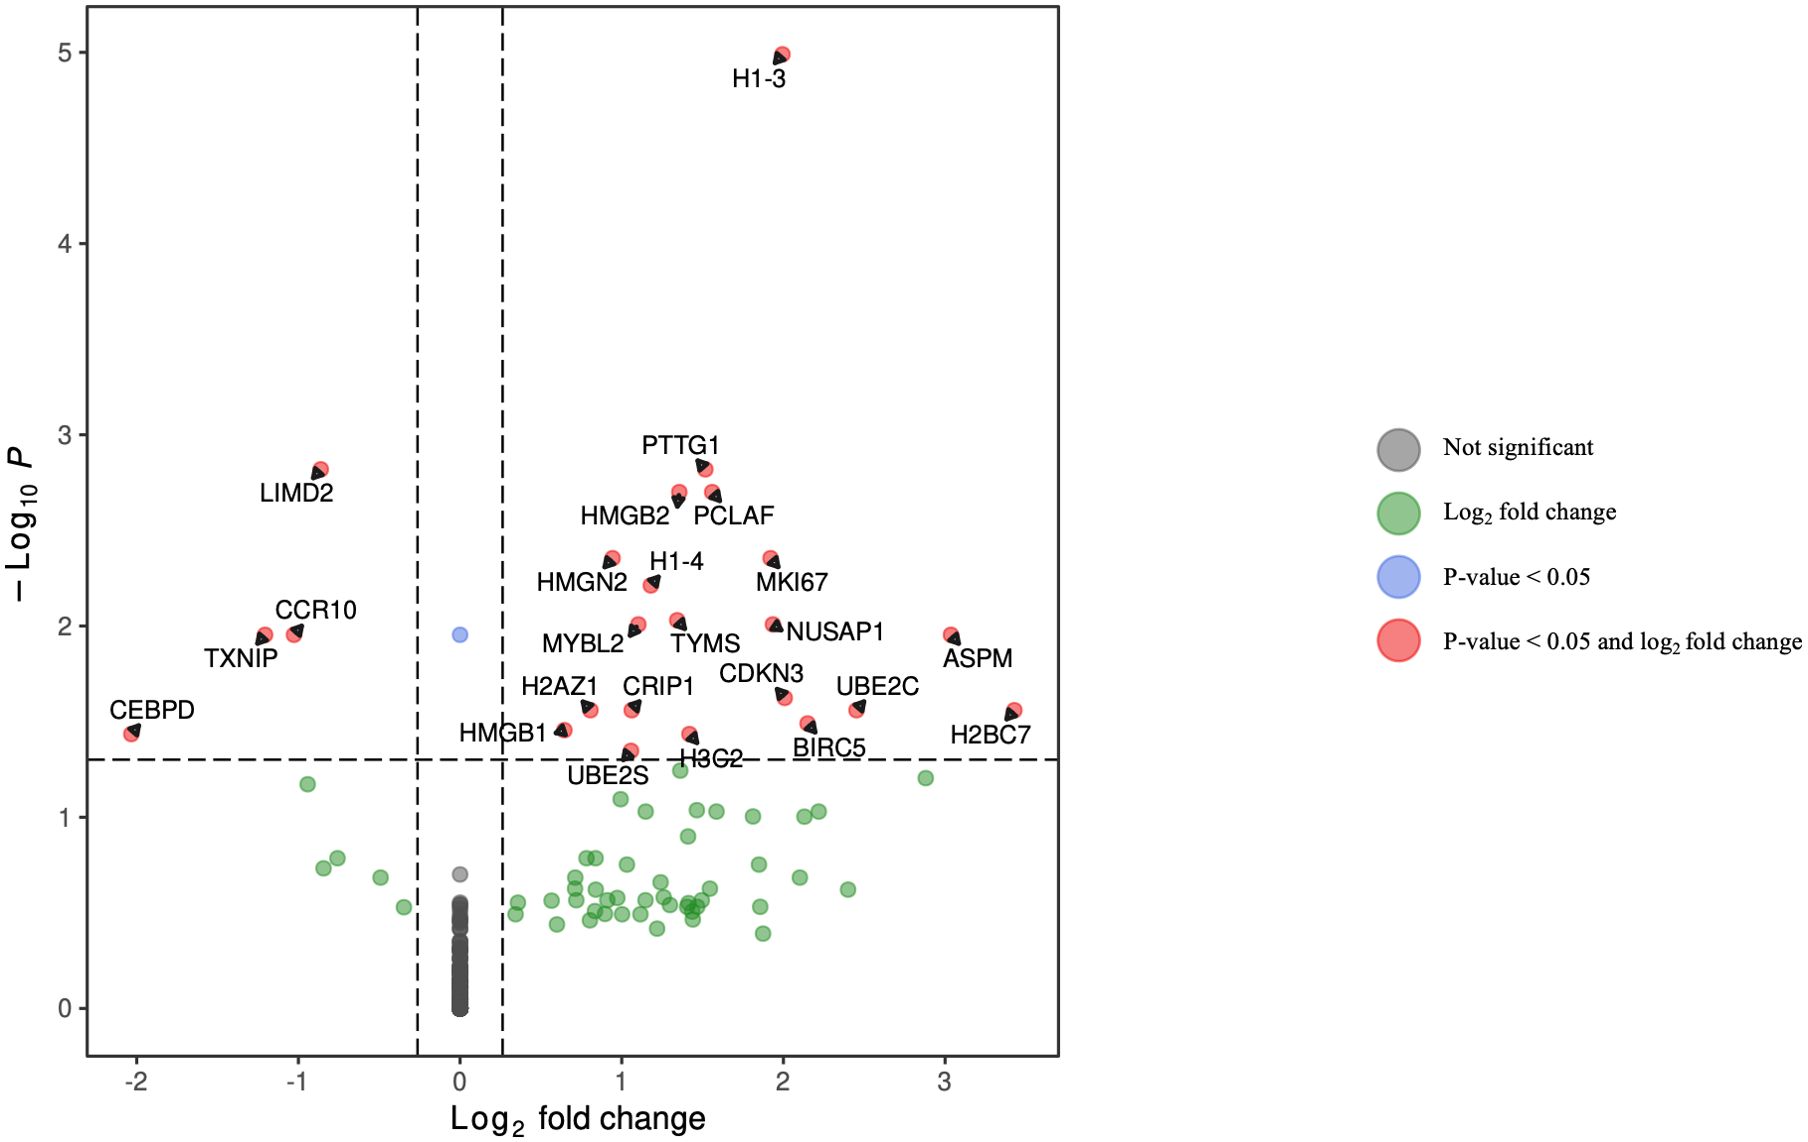
Figure 7. Volcano plot of differentially expressed genes in plasmablasts for HCV-positive study participants with/without fentanyl detection.
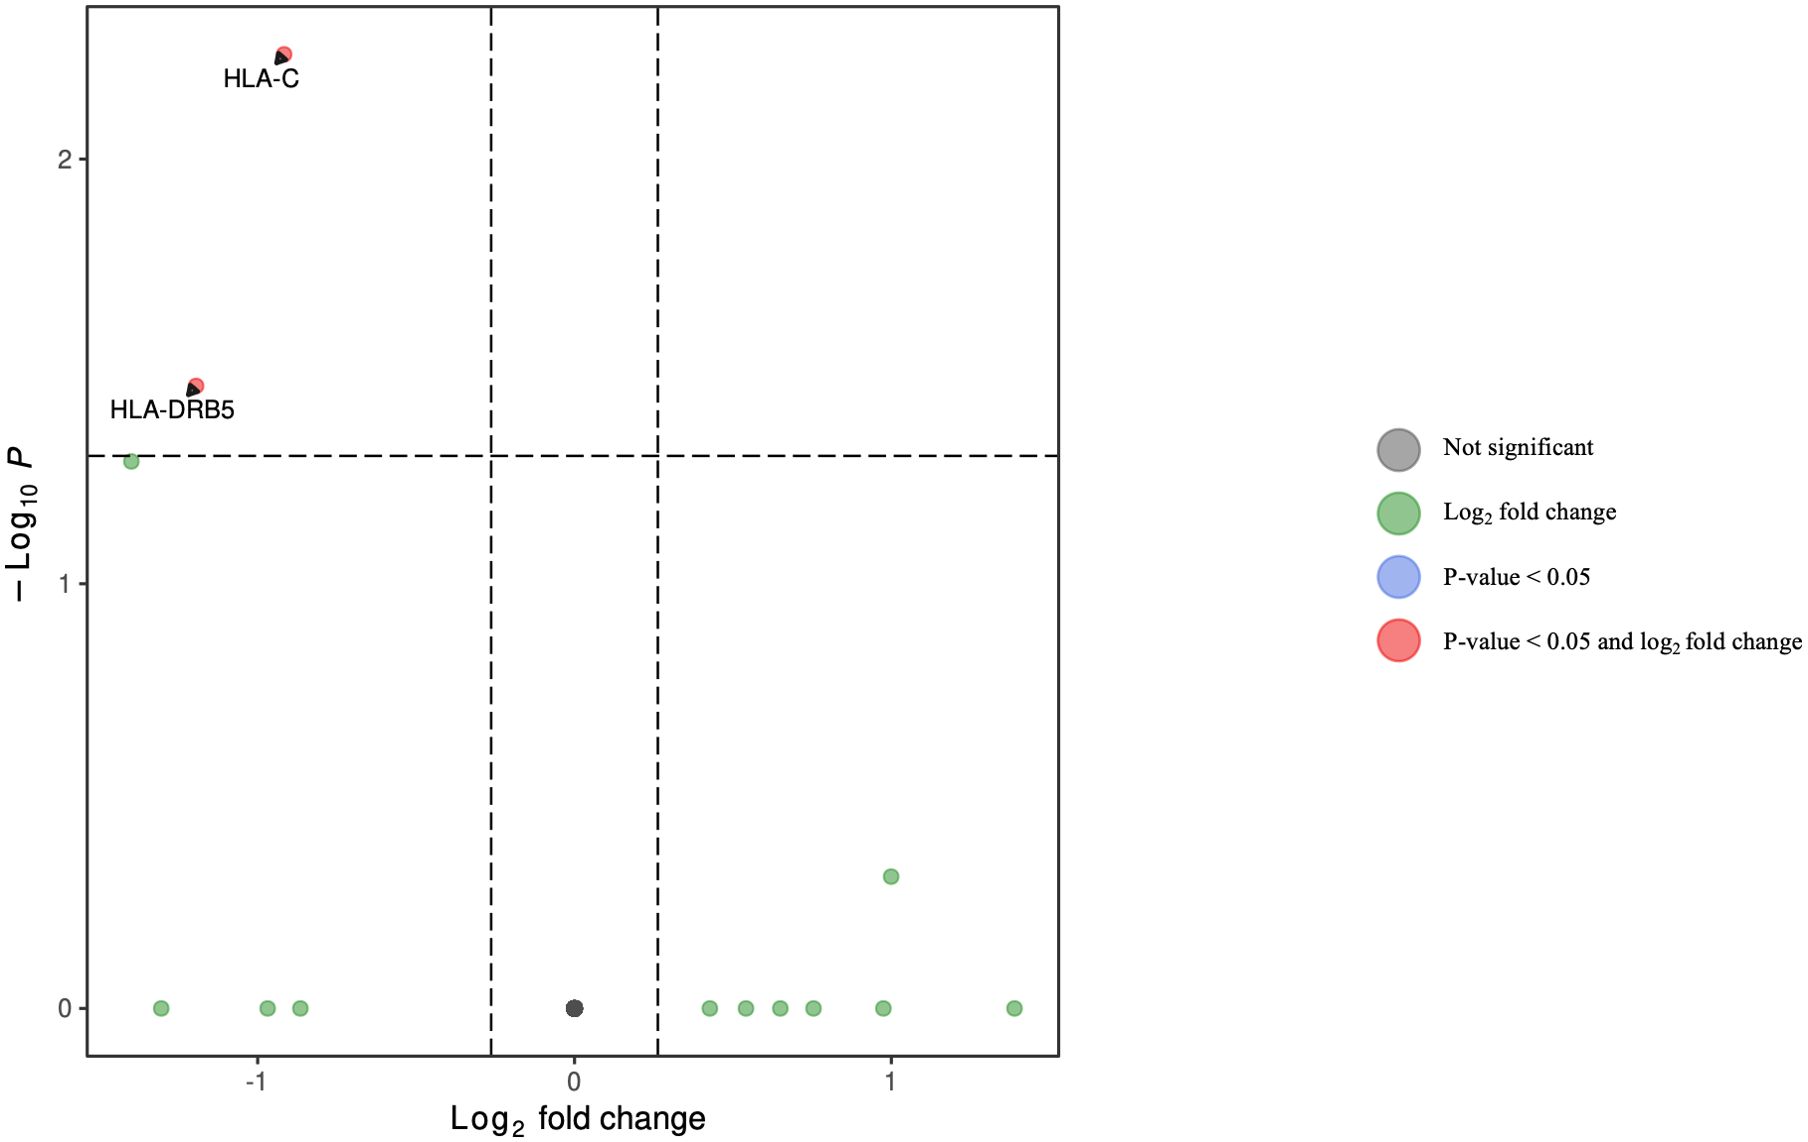
Figure 8. Volcano plot of differentially expressed genes in dendritic cells for HCV-positive study participants with/without fentanyl detection.
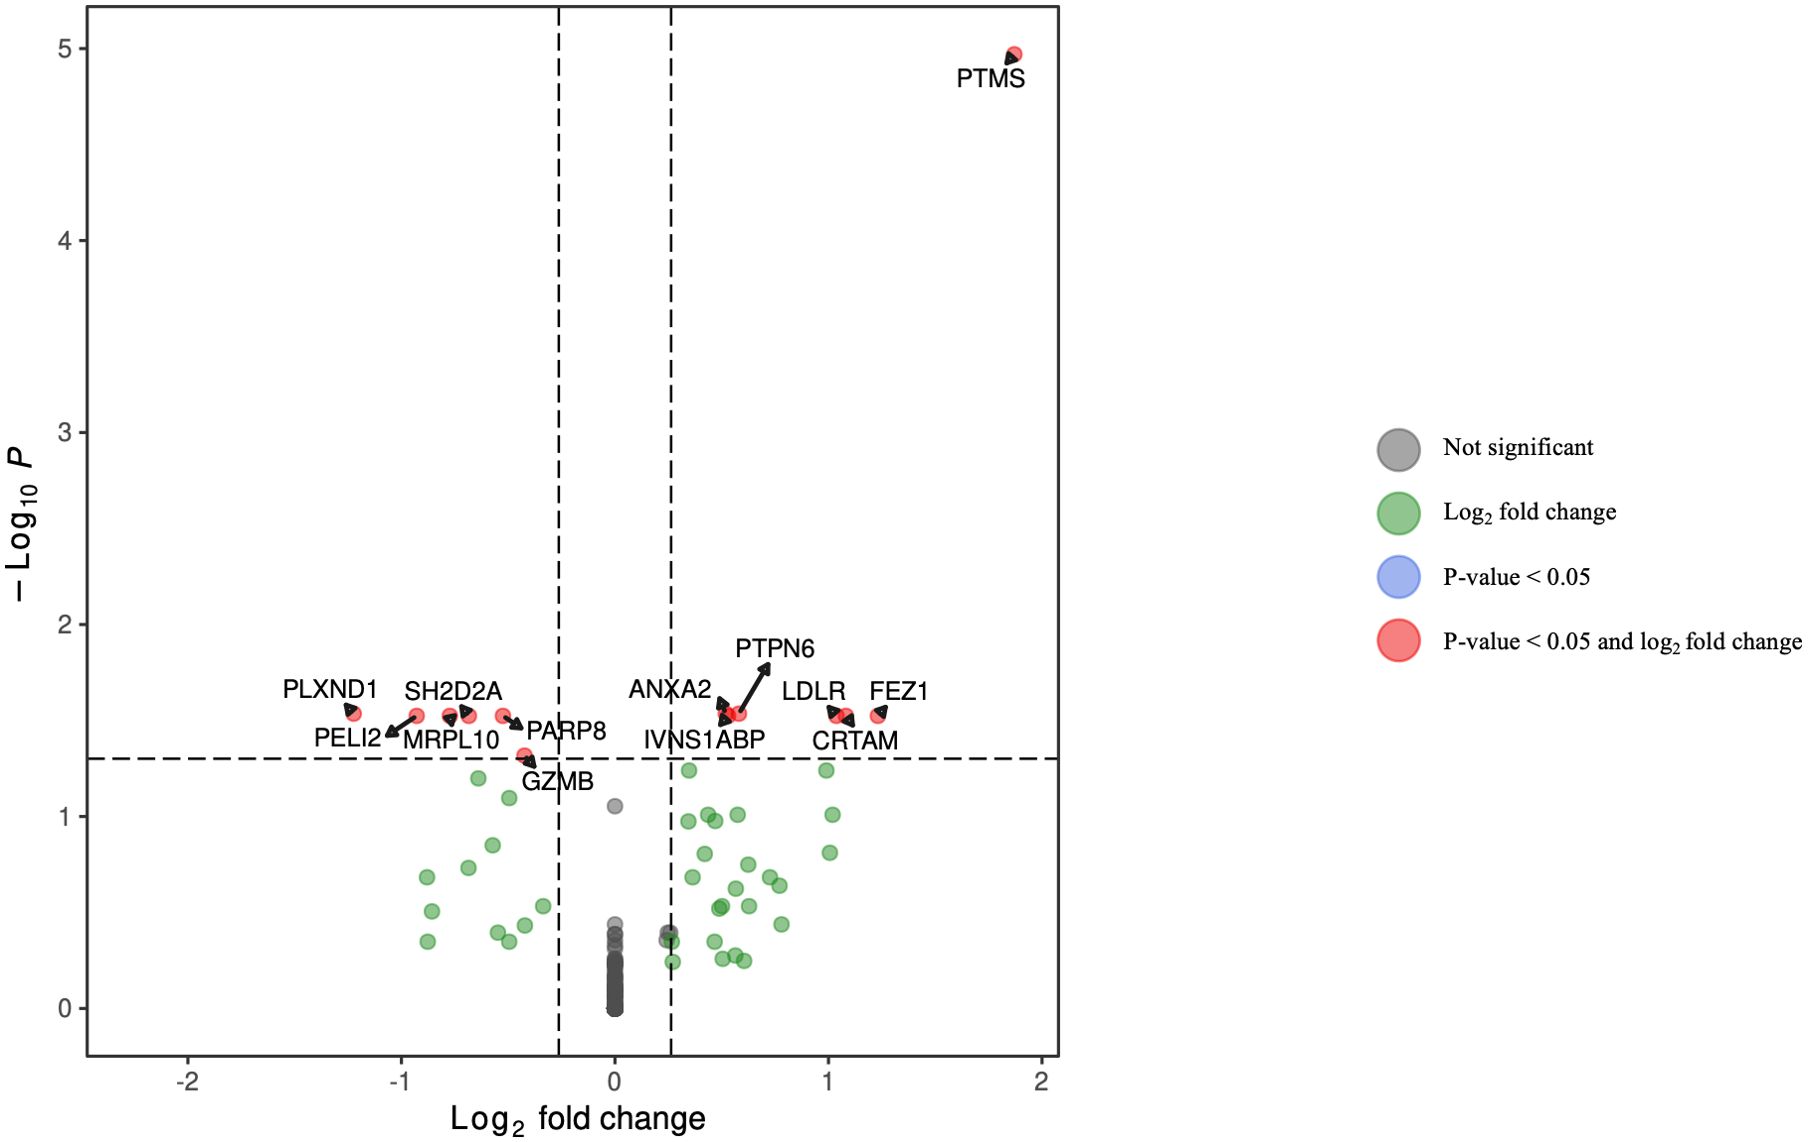
Figure 9. Volcano plot of differentially expressed genes in NK cells for HCV-positive study participants with/without fentanyl detection.
Seven DEGs – DHRS4L2, GZMA, H1-3, HLA-C, ISG15, PARP8, PRKX – were shared across multiple cell types. Interferon-stimulated gene 15 (ISG15) was upregulated in CD4 T cells, CD8 T cells, and B lymphocytes (excluding plasmablasts). Dehydrogenase/Reductase 4 Like 2 (DHRS4L2) was upregulated in CD8 T cells and B lymphocytes (excluding plasmablasts). Granzyme A (GZMA) and Protein kinase, X-linked (PRKX) were upregulated in CD4 T cells and CD8 T cells. H1.3 Linker Histone, Cluster Member (H1-3) was upregulated in Plasmablasts and monocytes. Human Leukocyte Antigen-C (HLA-C) was downregulated in B lymphocytes (excluding plasmablasts) and dendritic cells. Poly(ADP-ribose) polymerase family member 8 (PARP8) was downregulated in CD8 T cells and NK cells. The upset plot in Figure 10 displays the 106 DEGs identified in at least one cell type, including those shared across distinct peripheral blood cell types.
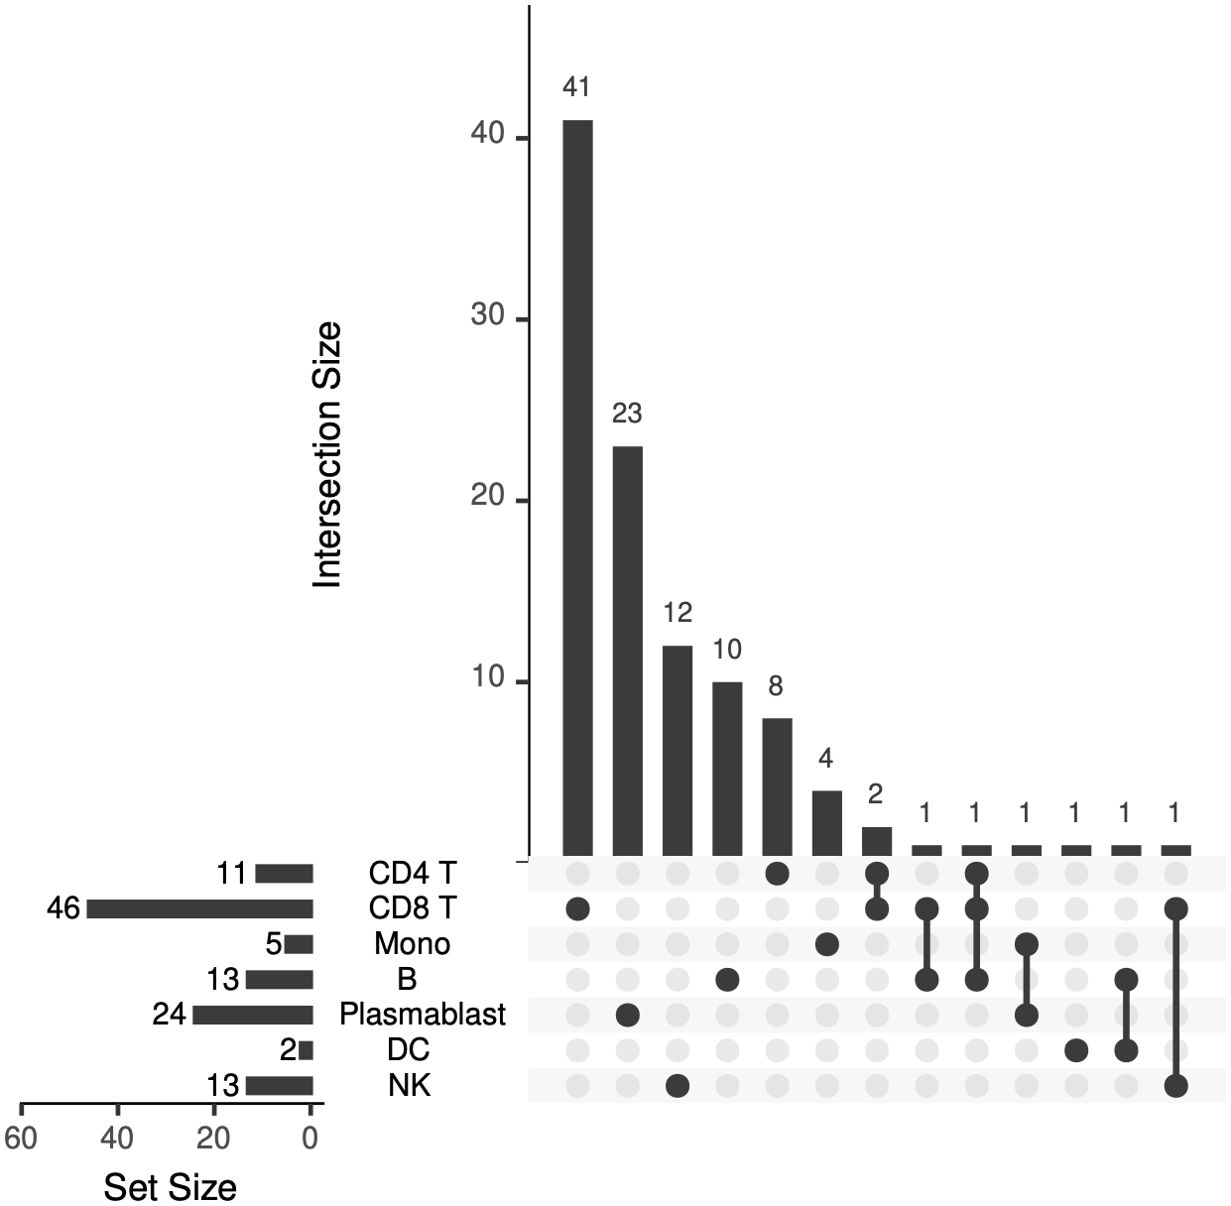
Figure 10. Upset plot showing the number of differentially expressed genes that are shared across peripheral blood cell types.
Enrichment analysis was performed in each peripheral blood cell type. In CD4+ T lymphocytes (Supplementary Figure 3), the subnetwork showed the following associations:
• ISG15 belongs to the biological processes “ISG15-protein conjugation” and “proteolysis involved in cellular protein catabolic process,” while ABCG2 belongs to the biological process “xenobiotic transport across blood-brain barrier.”
• The gene product ABCG2 is a member of the “ABC transporters” and “bile secretion” pathways, while the gene product ISG15 is a member of the “RIG-I-like receptor signaling” pathway.
In CD8+ T lymphocytes (Supplementary Figure 4),
• CX3CR1 and ITGAM belong to the biological processes “regulation of hippocampal neuron apoptotic process” and “regulation of microglial cell mediated cytotoxicity”. IFNG, CX3CR1, and ITGAM belong to the biological process “microglial cell activation.” IFNG and CD300A belong to the biological process “positive regulation of phosphatase activity.” CX3CR1 and CD300A belong to the biological process “negative regulation of myeloid leukocyte mediated immunity.”
• The gene products IFNG, FASLG, and PRF1 are members of the “allograft rejection” pathway, while the gene products IFNG, CX3CR1, and FASLG are members of the “cytokine-cytokine receptor interaction” pathway. The gene products IFNG, FASLG, and PRF1 are members of the “natural killer cell mediated cytotoxicity” pathway.
In monocytes (Supplementary Figure 5), enrichment analysis show that:
• SYNGR1 belongs to the biological processes regulation of short-term neuronal synaptic plasticity and “regulation of long-term neuronal synaptic plasticity,” while H1–3 belongs to the biological processes “negative regulation of gene silencing,” “negative regulation of chromatin silencing,” and “negative regulation of chromatin organization.”
• The gene product MARCO is a member of the “phagosome” pathway.
In B lymphocytes excluding plasmablasts (Supplementary Figure 6), the subnetwork showed the following associations:
• ANK3 belongs to the biological “processes positive regulation of sodium ion transmembrane transport” and “regulation of sodium ion transmembrane transporter activity.” HLA-C and ISG15 belong to the biological processes “type I interferon signaling” and “cellular response to type I interferon.” IL7R, HLA-C, ISG15, and GRAP2 belong to the biological process “cytokine-mediated signaling.”
• The gene products HLA-C and ISG15 are members of the “Epstein-Barr virus infection” and the “human papillomavirus infection” pathways. The gene product HLA-C is a member of the “allograft rejection” and “cellular senescence” pathways, while the gene product IL7R is a member of the “primary immunodeficiency” pathway.
In plasmablasts (Supplementary Figure 7):
• HMGB2 and HMGB1 belong to the biological processes “V(D)J recombination” and “DNA topological change.” HMGB2 belongs to the biological process “chromatin assembly,” and NUSAP1 belongs to the biological process “chromosome condensation.”
The gene products H2BC7, HMGB1, and H2AZ1 are members of the “neutrophil extracellular trap formation” pathway. HMGB1 and H2AZ1 are members of the “necroptosis” pathway. H2BC7 and H2AZ1 are members of the “alcoholism” and “systemic lupus erythematosus” pathways.In dendritic cells (Supplementary Figure 8), the subnetwork identified the following associations:
• HLA-C belongs to the biological processes “antigen processing and presentation of exogenous peptide antigen via MHC class I” and “antigen processing and presentation of endogenous peptide antigen via MHC class I via ER”. HLA-DRB5 and HLA-C belong to the biological processes “interferon-gamma-mediated signaling” and “cellular response to interferon-gamma.”
• The gene products HLA-DRB5 and HLA-C are members of the “viral myocarditis,” “allograft rejection,” “autoimmune thyroid disease”, “type I diabetes mellitus,” and “graft-versus-host disease” pathways.
In NK cells (Supplementary Figure 9):
• LDLR belongs to the biological processes “regulation of astrocyte activation” and “positive regulation of protein catabolic process in the vacuole.”
The gene product GZMB is a member of the “allograft rejection,” “type I diabetes mellitus,” and “graft-versus-host disease” pathways. The gene products PTPN6 and GZMB are members of the “natural killer cell mediated cytotoxicity” pathway. The gene product LDLR is a member of the “cholesterol metabolism” pathway.IFNs and ISGs are pivotal to the antiviral response to HCV infection (66, 67); thus, we evaluated their expression in multiple PBMC cell types in persons with and without fentanyl detection. As shown in Figure 11, ISG15 and IFNG were differentially expressed between fentanyl-positive and fentanyl-negative study participants. ISG15 was differentially expressed in CD4+ T lymphocytes, CD8+ T lymphocytes, and B lymphocytes (excluding plasmablasts), while IFNG was differentially expressed in CD8+ T lymphocytes.
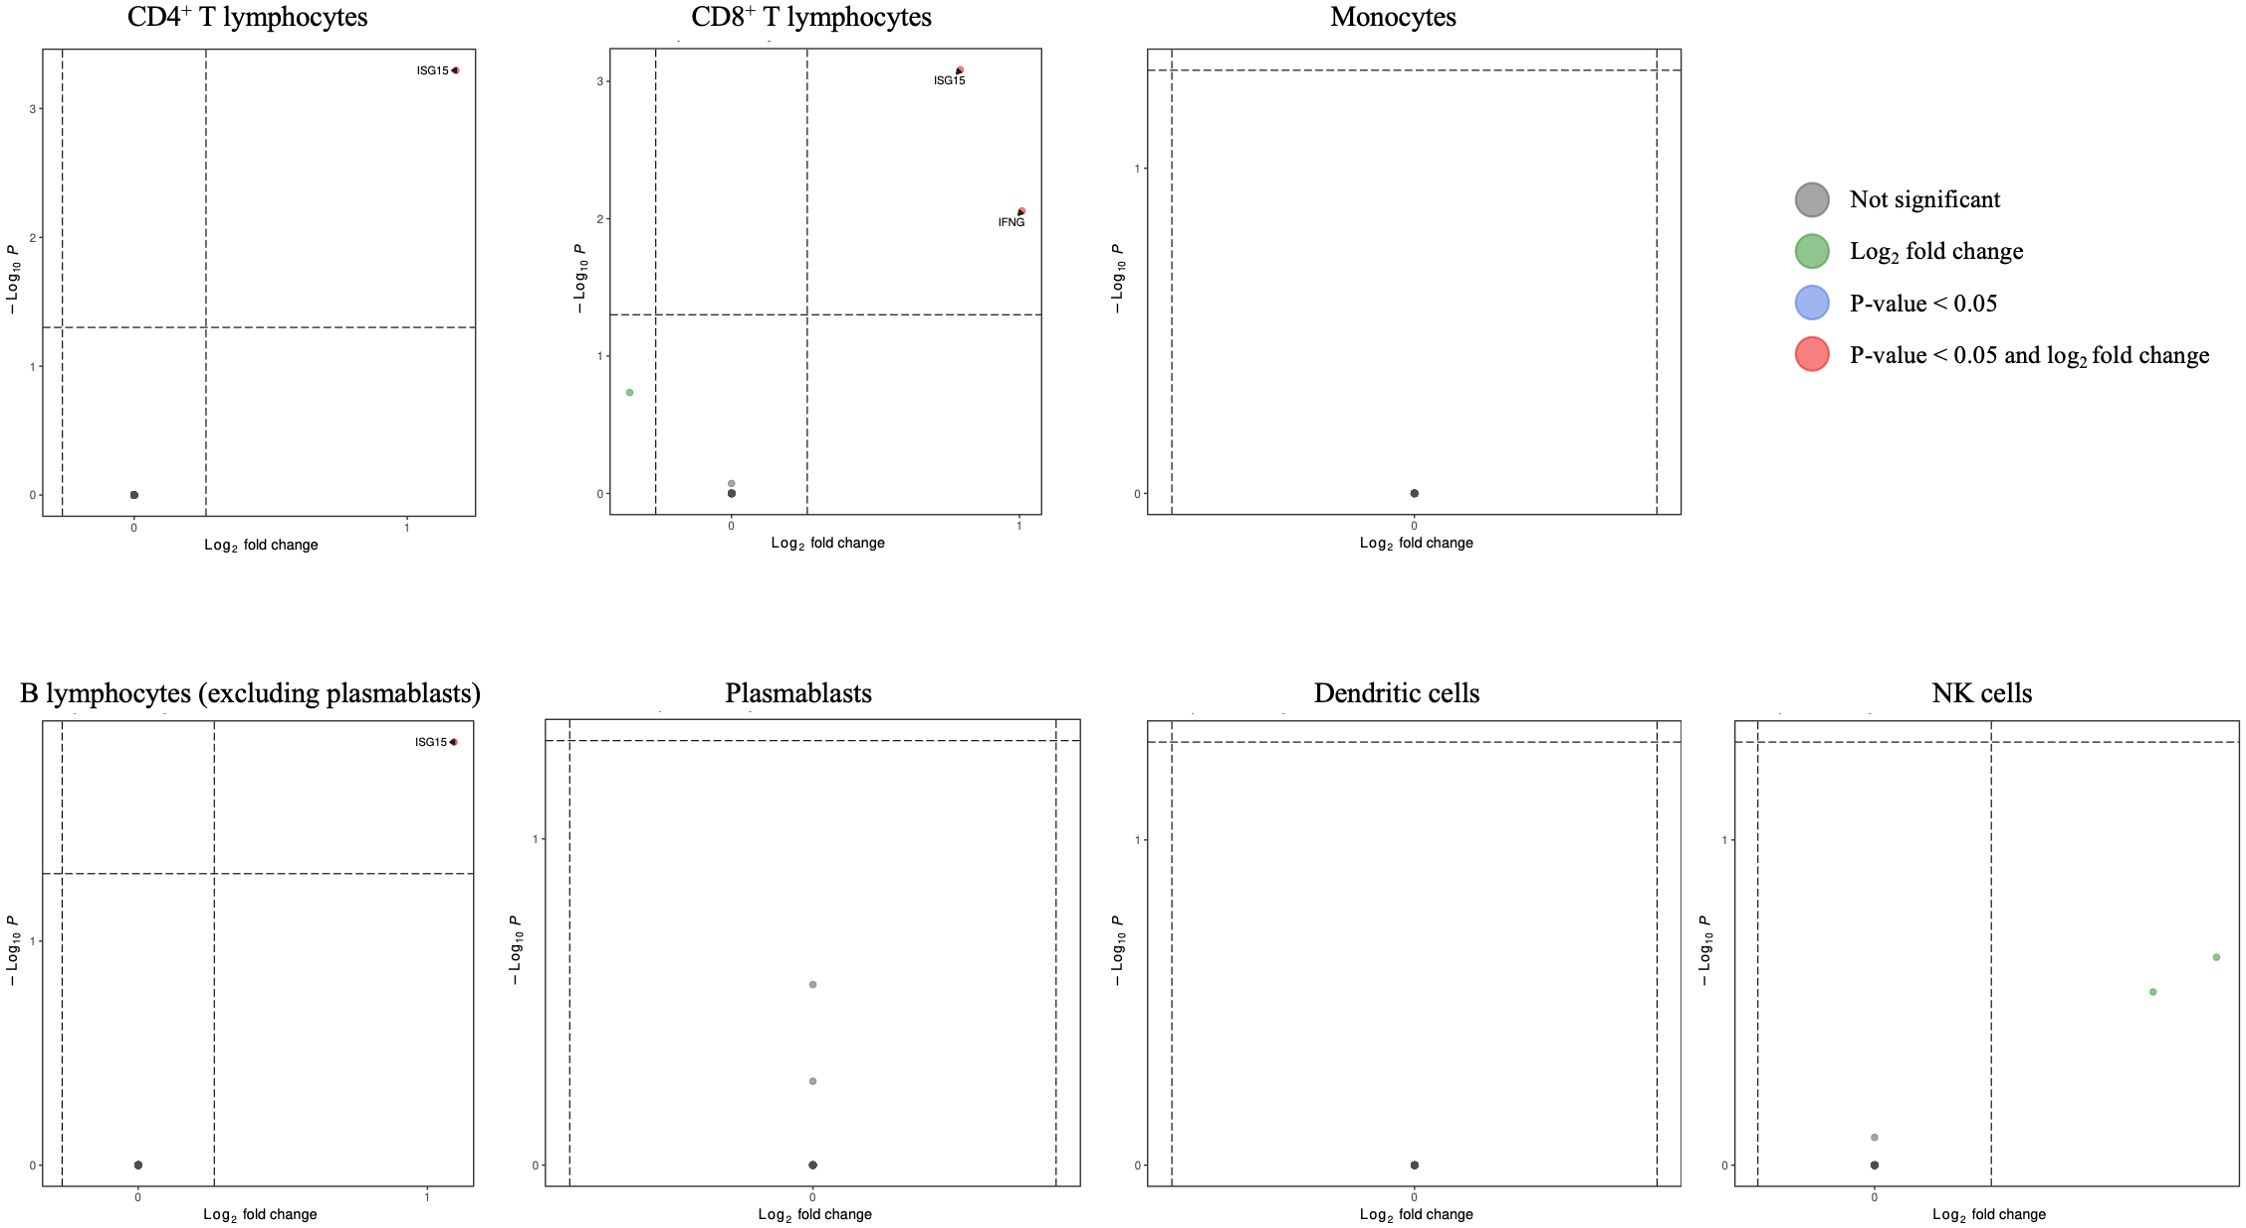
Figure 11. Volcano plots for interferon/interferon-stimulated genes in CD4+ T lymphocytes, CD8+ T lymphocytes, monocytes, B lymphocytes (excluding plasmablasts), plasmablasts, dendritic cells, and NK cells for HCV-positive study participants with/without fentanyl detection.
Multiple host factors promote the cell binding, uptake, and membrane fusion of hepatitis C virions into susceptible cells [reviewed in (57, 58)]. While these entry factors have been explored thoroughly in hepatocytes, they may be expressed in extrahepatic sites as well. Genes related to HCV entry were evaluated in unsorted PBMCs for study participants with and without fentanyl detection. As shown in Figure 12, CD81 expression was high in PBMCs; however, other HCV entry factors were expressed at low levels, and none were significantly different in individuals with versus without fentanyl detection. L-SIGN/CLEC4M and NPC1L1 were not detected.
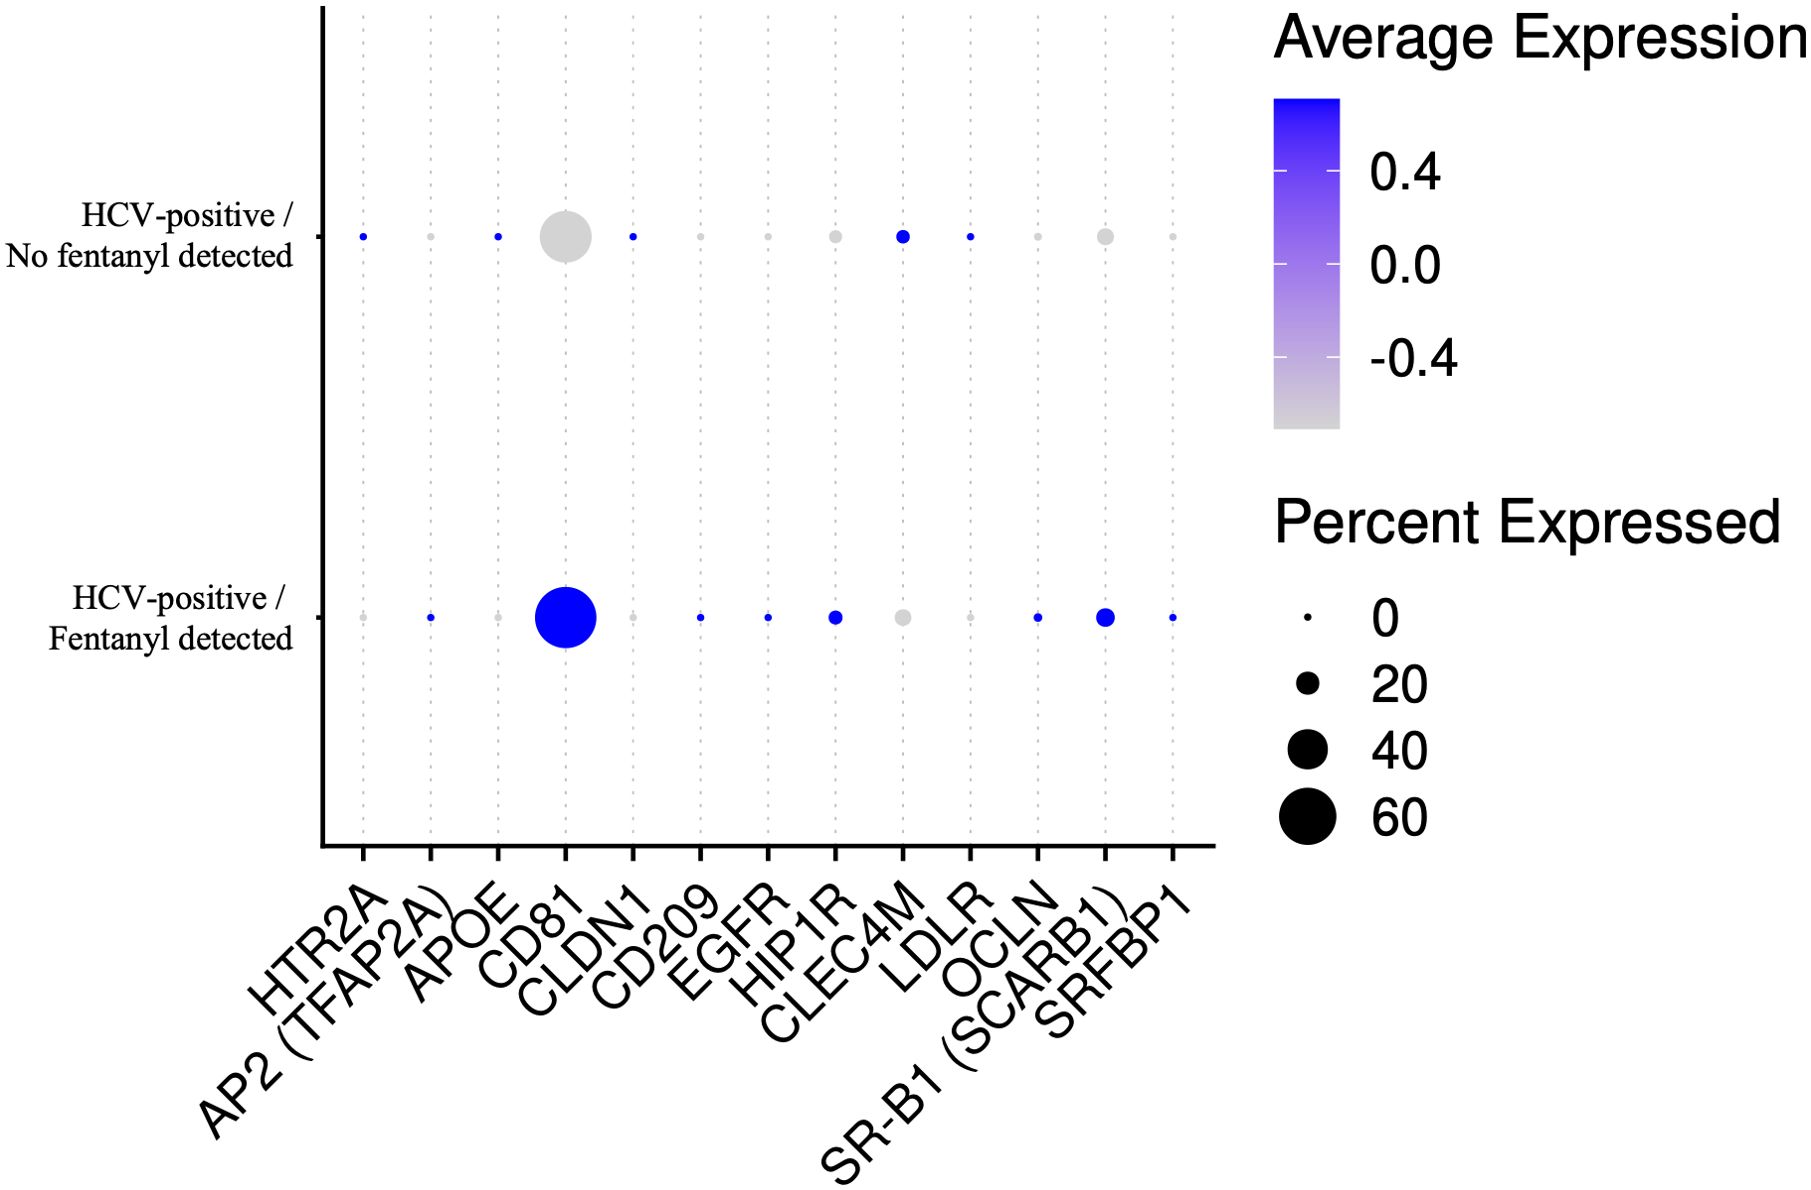
Figure 12. Dot plot of HCV entry factor genes in unsorted PBMCs for HCV-positive study participants with/without fentanyl detection regardless of fold change or statistical significance. L-SIGN/CLEC4M and NPC1L1 were not detected in the samples.
Discussion
Immunologic responses are a critical component of liver disease pathogenesis (66, 68), and gene expression patterns frequently overlap between the peripheral blood and liver (69–72). Transcriptomic analysis of PBMCs has been utilized in several disease states, including chronic HCV infection, HIV/HCV co-infection, chronic HBV infection, renal transplant recipients, alcoholic liver disease, fatty liver disease, and liver failure (71–80). Using liver and PBMC RNAseq data, Listopad et al. reported that both were enriched for several common immune system pathways, including inhibition of matrix metalloproteases (MMPs), macrophage migration inhibitory factor regulation of innate immunity, and interferon signaling pathways (72).
Data on how synthetic opioids impact HCV replication and disease progression are quite limited. We previously reported that fentanyl increased in vitro replication of HCV in hepatocytes and utilized bulk RNAseq to identify genes that were differentially regulated by fentanyl, including those involved in the antiviral/interferon response, apoptosis, NFκB signaling, and chemokine signaling (40). These findings align with previous reports from virus-naïve non-human animal models and cell types that demonstrated that fentanyl regulates apoptosis, alters NFκB expression, and/or upregulates inflammatory genes (81–87). A single cell RNAseq analysis of heroin-dependent individuals (HCV status was not reported) conducted by Karagiannis et al. observed a downregulation of interferon-stimulated genes and antiviral genes in opioid-dependent individuals compared to controls (88). The suppression of antiviral genes was observed only in monocytes in a naive state and most immune cell subpopulations during exposure to lipopolysaccharide. Fox et al. investigated the interaction of morphine and simian immunodeficiency virus (SIV) infection (89). Morphine treatment resulted in lower numbers of CD4+ T lymphocytes, CD8+ T lymphocytes, NK cells, and B cells and suppressed inflammatory markers. Avey et al. performed single cell RNA sequencing of the nucleus accumbens of mice following acute morphine treatment (90). Morphine-dependent changes in gene expression were observed in nearly every cell type examined, and pathway analysis revealed significant downregulation of genes encoding heat shock proteins, ER chaperones, and other factors involved in the unfolded protein response and ER quality control. Phan et al. utilized single nuclei RNAseq to evaluate the dorsal striatum of individuals with opioid use disorder (53). Pathways related to neurodegeneration, interferon response, and DNA damage were significantly enriched in post-mortem brain tissues of individuals with OUD. Also using single nuclei RNAseq, Brenner et al. investigated the transcriptome from the prefrontal cortex of individuals with alcohol dependence (49). Each cell type displayed enrichment of different genes linked to neuroinflammation. To date, single cell RNAseq studies in HCV-positive drug-using populations have not been conducted to our knowledge.
In the current analysis of persons with HCV mono-infection, 106 differentially expressed genes were identified, including 7 DEGs that were shared by multiple cell types. Type I IFNs directly activate the transcription of interferon-stimulated genes (ISGs) to exert antiviral, anti-proliferative, and immunomodulatory activities (91, 92), although only a limited number of ISGs have been functionally characterized as antiviral effector molecules (67). Our transcriptomics analysis identified several ISGs that were differentially regulated in multiple peripheral cell types during opioid use. For instance, ISG15 was differentially expressed in CD4+ T lymphocytes, CD8+ T lymphocytes and B lymphocytes (excluding plasmablasts). ISG15 is induced in response to type I interferons and has antiviral activity; however, ISG15 may promote HCV replication (93–95). IFNγ was differentially regulated in CD8+ T lymphocytes in this study and is known to inhibit HCV replication and promote immune cell-mediated clearance of infected hepatocytes (96).
While the primary site of HCV replication is hepatocytes, there is ample evidence of extrahepatic replication of HCV (97). Moreover, engaging extrahepatic cells with glycoproteins may alter cell function without active viral replication. Data are quite limited on the expression of HCV entry factors during substance use. Carriere et al. evaluated LDLR and CD81 expression by flow cytometry in PBMCs (98). CD81 was upregulated on monocytes in individuals with moderate alcohol use. Sandau et al. found that methamphetamine use increased the abundance of plasma extracellular vesicles containing CD81 (99). Cocaine also induces CD81 expression in the rat brain (100). Similar studies with opioids – particularly synthetic opioids such as fentanyl and/or fentanyl analogs – have not been conducted to date. In the current study, CD81 expression was high compared to other HCV entry factors in the peripheral blood; however, these factors were not significantly differentially expressed in individuals with versus those without fentanyl detection.
Several potential limitations of our study should be considered. First, the cross-sectional nature of sample collection prevents studies of the evolution of transcriptional changes and/or the development of liver disease caused by drug use over time. The modest sample size could also diminish the statistical power to detect minor differences across study groups and/or cell types or to control for certain confounders. However, the number of patients needed for single cell transcriptomic analysis depends on the specific research question, the level of heterogeneity within the patient population, and the complexity of the analysis. Moreover, non-traditional power analyses may be needed to determine the appropriate sample sizes for single-cell RNA seq as traditional power evaluation and sample size calculation methods are frequently inadequate (101). Second, given the sample size, including more covariates significantly reduced the number of DEGs remaining for analysis. The impact of these covariates should be considered in larger studies in the future. Third, acute versus chronic opioid exposure may differentially impact HCV replication and pathogenesis; however, data on drug use before sample collection are not available in this study population. Fourth, we focused on fentanyl use as the most commonly detected opioid in our setting. However, other drugs of abuse are likely to have distinct effects on the peripheral blood transcriptome. Additionally, polysubstance use is common in persons with OUD but is not commonly considered in clinical cohorts with viral infections, and we were unable to evaluate the potential synergistic effects between multiple illicit drugs or drug-drug interactions. Fifth, the lack of liver biopsies prevents a detailed analysis of liver fibrosis; however, liver biopsies are performed less frequently now, given the availability of other non-invasive approaches. Finally, functional studies are needed to characterize fully and validate the significance of the various gene alterations that have been identified in this in vivo study.
Collectively, these findings highlight multiple distinct pathways by which opioid use contributes to HCV pathogenesis. Defining the changes in the peripheral blood transcriptome is essential to a more robust understanding of virus-cell-opioid interactions and may facilitate the improved clinical management of difficult-to-treat populations and identify new pathways for novel therapeutic strategies.
Data availability statement
Single cell RNAseq data are available through BioProject ID PRJNA1183971.
Ethics statement
The University of Cincinnati Institutional Review Board approved this study as 2019_0584. The studies were conducted in accordance with the local legislation and institutional requirements. The participants provided their written informed consent to participate in this study.
Author contributions
KR: Conceptualization, Investigation, Methodology, Writing – review & editing, Formal Analysis, Visualization. HM: Investigation, Writing – review & editing. JM: Investigation, Writing – review & editing. MJ: Investigation, Writing – review & editing. JC: Investigation, Writing – review & editing. JB: Investigation, Writing – review & editing. CF: Investigation, Writing – review & editing. ML: Investigation, Writing – review & editing. KS: Investigation, Writing – review & editing. JB: Investigation, Writing – review & editing, Conceptualization, Funding acquisition, Methodology, Project administration, Supervision, Writing – original draft.
Funding
The author(s) declare financial support was received for the research and/or publication of this article. This work was supported by the National Institute on Drug Abuse grants DA048439 and DA063296 and the National Institute on Alcohol Abuse and Alcoholism grant AA030486.
Conflict of interest
The authors declare that the research was conducted in the absence of any commercial or financial relationships that could be construed as a potential conflict of interest.
Generative AI statement
The author(s) declare that no Generative AI was used in the creation of this manuscript.
Any alternative text (alt text) provided alongside figures in this article has been generated by Frontiers with the support of artificial intelligence and reasonable efforts have been made to ensure accuracy, including review by the authors wherever possible. If you identify any issues, please contact us.
Publisher’s note
All claims expressed in this article are solely those of the authors and do not necessarily represent those of their affiliated organizations, or those of the publisher, the editors and the reviewers. Any product that may be evaluated in this article, or claim that may be made by its manufacturer, is not guaranteed or endorsed by the publisher.
Supplementary material
The Supplementary Material for this article can be found online at: https://www.frontiersin.org/articles/10.3389/fviro.2025.1585217/full#supplementary-material
Supplementary Table 1 | Pre-quality control cell count, contamination rate, doublet percent, and post-mitochondrial filter cell count for each study participant.
Supplementary Figure 1 | Percent mitochondrial content for all study participants. Red – HCV-negative/no opioid use; blue – HCV-positive/no fentanyl detected; yellow – HCV-positive/fentanyl detected
Supplementary Figure 2 | UMAP visualization of PBMCs for each study participant. Each circle represents an individual cell colored by cell type.
Supplementary Table 2 | Differentially expressed genes in CD4+ T lymphocytes for HCV-positive study participants with/without fentanyl detection.
Supplementary Table 3 | Differentially expressed genes in CD8+ T lymphocytes for HCV-positive study participants with/without fentanyl detection.
Supplementary Table 4 | Differentially expressed genes in monocytes for HCV-positive study participants with/without fentanyl detection.
Supplementary Table 5 | Differentially expressed genes in B lymphocytes (excluding plasmablasts) for HCV-positive study participants with/without fentanyl detection.
Supplementary Table 6 | Differentially expressed genes in excluding plasmablasts for HCV-positive study participants with/without fentanyl detection.
Supplementary Table 7 | Differentially expressed genes in dendritic cells for HCV-positive study participants with/without fentanyl detection.
Supplementary Table 8 | Differentially expressed genes in NK cells for HCV-positive study participants with/without fentanyl detection.
Supplementary Figure 3 | Enrichment analysis of differentially expressed genes in CD4+ T lymphocytes. Genes are shown in green, while libraries selected (5 each) are shown as GO_Biological_Process_2021 (pink), MGI_Mammalian_Phenotype_Level_4_2021 (orange), and KEGG_2021_Human (grey). The size of the bars is proportional to the -log(p-value) of the enrichment score computed by the Fisher exact test.
Supplementary Figure 4 | Enrichment analysis of differentially expressed genes in CD8+ T lymphocytes. Genes are shown in green, while libraries selected (5 each) are shown as GO_Biological_Process_2021 (pink), MGI_Mammalian_Phenotype_Level_4_2021 (orange), and KEGG_2021_Human (grey). The size of the bars is proportional to the -log(p-value) of the enrichment score computed by the Fisher exact test.
Supplementary Figure 5 | Enrichment analysis of differentially expressed genes in monocytes. Genes are shown in green, while libraries selected (5 each) are shown as GO_Biological_Process_2021 (pink), MGI_Mammalian_Phenotype_Level_4_2021 (orange), and KEGG_2021_Human (grey). The size of the bars is proportional to the -log(p-value) of the enrichment score computed by the Fisher exact test.
Supplementary Figure 6 | Enrichment analysis of differentially expressed genes in B lymphocytes (excluding plasmablasts). Genes are shown in green, while libraries selected (5 each) are shown as GO_Biological_Process_2021 (pink), MGI_Mammalian_Phenotype_Level_4_2021 (orange), and KEGG_2021_Human (grey). The size of the bars is proportional to the -log(p-value) of the enrichment score computed by the Fisher exact test.
Supplementary Figure 7 | Enrichment analysis of differentially expressed genes in plasmablasts. Genes are shown in green, while libraries selected (5 each) are shown as GO_Biological_Process_2021 (pink), MGI_Mammalian_Phenotype_Level_4_2021 (orange), and KEGG_2021_Human (grey). The size of the bars is proportional to the -log(p-value) of the enrichment score computed by the Fisher exact test.
Supplementary Figure 8 | Enrichment analysis of differentially expressed genes in dendritic cells. Genes are shown in green, while libraries selected (5 each) are shown as GO_Biological_Process_2021 (pink), MGI_Mammalian_Phenotype_Level_4_2021 (orange), and KEGG_2021_Human (grey). The size of the bars is proportional to the -log(p-value) of the enrichment score computed by the Fisher exact test.
Supplementary Figure 9 | Enrichment analysis of differentially expressed genes in NK cells. Genes are shown in green, while libraries selected (5 each) are shown as GO_Biological_Process_2021 (pink), MGI_Mammalian_Phenotype_Level_4_2021 (orange), and KEGG_2021_Human (grey). The size of the bars is proportional to the -log(p-value) of the enrichment score computed by the Fisher exact test.
References
1. World Health Organization. Hepatitis C (2024). Available online at: https://www.who.int/news-room/fact-sheets/detail/hepatitis-c:~:text=Globally%2C%20an%20estimated%2050%20million,carcinoma%20(primary%20liver%20cancer) (Accessed May 8, 2024).
2. Centers for Disease Control and Prevention. Hepatitis C virus - reduce infections (2025). Available online at: https://www.cdc.gov/hepatitis/php/npr-2025/hep-c-reduce-infections.html (Accessed May 5, 2025).
3. Bradley H, Hall EW, Asher A, Furukawa NW, Jones CM, Shealey J, et al. Estimated number of people who inject drugs in the United States. Clin Infect Dis. (2023) 76:96–102. doi: 10.1093/cid/ciac543
4. Shiels MS, Freedman ND, Thomas D, and Gonzalez ABd. Trends in US drug overdose deaths in non-hispanic black, hispanic, and non-hispanic white persons, 2000-2015. Ann Internal Med. (2018) 168:453–5. doi: 10.7326/M17-1812
5. Jalal H, Buchanich JM, Roberts MS, Balmert LC, Zhang K, and Burke DS. Changing dynamics of the drug overdose epidemic in the United States from 1979 through 2016. Science. (2018) 361. doi: 10.1126/science.aau1184
6. National Institute on Drug Abuse. Drug overdose death rates (2023). Available online at: https://nida.nih.gov/research-topics/trends-statistics/overdose-death-rates (Accessed May 8, 2024).
7. O’Donnell JK, Gladden RM, and Seth P. Trends in deaths involving heroin and synthetic opioids excluding methadone, and law enforcement drug product reports, by census region - United States, 2006-2015. Morbidity Mortality Weekly Rep. (2017) 66:897–903. doi: 10.15585/mmwr.mm6634a2
8. Somerville NJ, O'Donnell J, Gladden RM, Zibbell JE, Green TC, Younkin M, et al. Characteristics of fentanyl overdose - Massachusetts, 2014-2016. Morbidity Mortality Weekly Rep. (2017) 66:382–6. doi: 10.15585/mmwr.mm6614a2
9. Rudd RA, Seth P, David F, and Scholl L. Increases in drug and opioid-involved overdose deaths - United States, 2010-2015. Morbidity Mortality Weekly Rep. (2016) 65:1445–52. doi: 10.15585/mmwr.mm655051e1
10. Jones CM, Logan J, Gladden RM, and Bohm MK. Vital signs: demographic and substance use trends among heroin users - United States, 2002-2013. Morbidity Mortality Weekly Rep. (2015) 64:719–25.
11. Springer YP, Gladden RM, O'Donnell J, and Seth P. Notes from the field: fentanyl drug submissions - United States, 2010-2017. Morbidity Mortality Weekly Rep. (2019) 68:41–3. doi: 10.15585/mmwr.mm6802a4
12. O'Donnell J, Gladden RM, Goldberger BA, Mattson CL, and Kariisa M. Notes from the field: opioid-involved overdose deaths with fentanyl or fentanyl analogs detected - 28 states and the District of Columbia, July 2016-december 2018. Morbidity Mortality Weekly Rep. (2020) 69:271–3. doi: 10.15585/mmwr.mm6910a4
13. Peterson AB, Gladden RM, Delcher C, Spies E, Garcia-Williams A, Wang Y, et al. Increases in fentanyl-related overdose deaths - Florida and Ohio, 2013-2015. Morbidity Mortality Weekly Rep. (2016) 65:844–9. doi: 10.15585/mmwr.mm6533a3
14. Daniulaityte R, Juhascik MP, Strayer KE, Sizemore IE, Harshbarger KE, Antonides HM, et al. Overdose deaths related to fentanyl and its analogs - Ohio, January-February 2017. Morbidity Mortality Weekly Rep. (2017) 66:904–8. doi: 10.15585/mmwr.mm6634a3
15. Gonsalves GS and Crawford FW. Dynamics of the HIV outbreak and response in Scott County, IN, USA, 2011-15: a modelling study. Lancet HIV. (2018) 5:e569–77. doi: 10.1016/S2352-3018(18)30176-0
16. Strathdee SA and Beyrer C. Threading the needle–how to stop the HIV outbreak in rural Indiana. New Engl J Med. (2015) 373:397–9. doi: 10.1056/NEJMp1507252
17. Conrad C, Bradley HM, Broz D, Buddha S, Chapman EL, Galang RR, et al. Community outbreak of HIV infection linked to injection drug use of oxymorphone–Indiana, 2015. Morbidity Mortality Weekly Rep. (2015) 64:443–4.
18. Atkins A, McClung RP, Kilkenny M, Bernstein K, Willenburg K, Edwards A, et al. Notes from the field: outbreak of human immunodeficiency virus infection among persons who inject drugs - Cabell County, West Virginia, 2018-2019. Morbidity Mortality Weekly Rep. (2020) 69:499–500. doi: 10.15585/mmwr.mm6916a2
19. Cranston K, Alpren C, John B, Dawson E, Roosevelt K, Burrage A, et al. HIV diagnoses among persons who inject drugs - Northeastern Massachusetts, 2015-2018. Morbidity Mortality Weekly Rep. (2019) 68:253–4. doi: 10.15585/mmwr.mm6810a6
20. Ramachandran S, Thai H, Forbi JC, Galang RR, Dimitrova Z, Xia GL, et al. A large HCV transmission network enabled a fast-growing HIV outbreak in rural Indiana, 2015. EBioMedicine. (2018) 37:374–81. doi: 10.1016/j.ebiom.2018.10.007
21. Zibbell JE, Iqbal K, Patel RC, Suryaprasad A, Sanders KJ, Moore-Moravian L, et al. Increases in hepatitis C virus infection related to injection drug use among persons aged ≤30 years - Kentucky, Tennessee, Virginia, and West Virginia, 2006-2012. Morbidity Mortality Weekly Rep. (2015) 64:453–8.
22. Evans ME, Labuda SM, Hogan V, Agnew-Brune C, Armstrong J, Periasamy Karuppiah AB, et al. Notes from the field: HIV infection investigation in a rural area - West Virginia, 2017. Morbidity Mortality Weekly Rep. (2018) 67:257–8. doi: 10.15585/mmwr.mm6708a6
23. Powell D, Alpert A, and Pacula RL. A transitioning epidemic: how the opioid crisis is driving the rise in hepatitis C. Health Aff (Millwood). (2019) 38:287–94. doi: 10.1377/hlthaff.2018.05232
24. Artenie A, Stone J, Fraser H, Stewart D, Arum C, Lim AG, et al. Incidence of HIV and hepatitis C virus among people who inject drugs, and associations with age and sex or gender: a global systematic review and meta-analysis. Lancet Gastroenterol Hepatol. (2023) 8:533–52. doi: 10.1016/S2468-1253(23)00018-3
25. Banerjee A, Strazza R, Wigdahl B, Pirrone V, Meucci O, and Nonnemacher M. Role of mu-opioid receptors as cofactors in human immunodeificiency virus type 1 disease progression and neuorpathogenesis. J Neurovirology. (2011) 17:291–302. doi: 10.1007/s13365-011-0037-2
26. Tang B, Li Y, Yuan S, Tomlinson S, and He S. Upregulation of the δ opioid receptor in liver cancer promotes liver cancer progression both in vitro and in vivo. Int J Cancer. (2013) 43:1281–90. doi: 10.3892/ijo.2013.2046
27. Lu J, Liu Z, Zhao L, Tian H, Liu X, and Yuan C. In vivo and in vitro inhibition of human liver cancer progress by downregulation of the μ-opioid receptor and relevant mechanisms. Oncol Rep. (2013) 30:1731–8. doi: 10.3892/or.2013.2640
28. Zhu X, Wang LC, Chen EQ, Chen XB, Chen LY, Liu L, et al. Prospective evaluation of FibroScan for the diagnosis of hepatic fibrosis compared with liver biopsy/AST platelet ratio index and FIB-4 in patients with chronic HBV infection. Digestive Dis Sci. (2011) 56:2742–9. doi: 10.1007/s10620-011-1659-1
29. Jia K, Sun D, Ling S, Tian Y, Yang X, Sui J, et al. Activated δ−opioid receptors inhibit hydrogen peroxide−induced apoptosis in liver cancer cells through the PKC/ERK signaling pathwa. Mol Med Rep. (2014) 10:839–47. doi: 10.3892/mmr.2014.2301
30. De Minicis S, Candelaresi C, Marzioni M, Saccomano S, Roskams T, Casini A, et al. Role of endogenous opioids in modulating HSC activity in vitro and liver fibrosis in vivo. Gut. (2008) 57:352–64. doi: 10.1136/gut.2007.120303
31. Jaume M, Jacquet S, Cavaillès P, Macé G, Stephan L, Blanpied C, et al. Opioid receptor blockade reduces Fas-induced hepatitis in mice. Hepatology. (2004) 40:1136–43. doi: 10.1002/hep.20428
32. Ebrahimkhani MR, Kiani S, Oakley F, Kendall T, Shariftabrizi A, Tavangar SM, et al. Naltrexone, an opioid receptor antagonist, attenuates liver fibrosis in bile duct ligated rats. Gut. (2006) 55:1606–16. doi: 10.1136/gut.2005.076778
33. Tahamtan A, Tavakoli-Yaraki M, Mokhtari-Azad T, Teymoori-Rad M, Bont L, Shokri F, et al. Opioids and viral infections: a double-edged sword. Front Microbiol. (2016) 7:970. doi: 10.3389/fmicb.2016.00970
34. Blackard JT and Sherman KE. Drugs of abuse and their impact on viral pathogenesis. Viruses. (2021) 13(12):Epub 20211129. doi: 10.3390/v13122387
35. Ye L, Peng JS, Wang X, Wang YJ, Luo GX, and Ho W. Methamphetamine enhances Hepatitis C virus replication in human hepatocytes. J Viral Hepatitis. (2008) 15:261–70. doi: 10.1111/j.1365-2893.2007.00940.x
36. Li Y, Zhang T, Douglas SD, Lai JP, Xiao WD, Pleasure DE, et al. Morphine enhances hepatitis C virus (HCV) replicon expression. Am J Pathol. (2003) 163:1167–75. doi: 10.1016/S0002-9440(10)63476-1
37. Zhang XL, Chen ML, and Zhou S. Fentanyl inhibits proliferation and invasion of colorectal cancer via β-catenin. Int J Clin Exp Pathol. (2015) 8:227–35.
38. Chen Z, Benureau Y, Rijnbrand R, Yi J, Wang T, Warter L, et al. GB virus B disrupts RIG-I signaling by NS3/4A-mediated cleavage of the adaptor protein MAVS. J Virol. (2007) 81:964–76. doi: 10.1128/JVI.02076-06
39. Chen S and Wang Y. Multigene tracking of quasispecies in viral persistence and clearance of hepatitis C virus. World J Gastroenterol. (2005) 11:2874–84. doi: 10.3748/wjg.v11.i19.2874
40. Kong L, Karns R, Shata MTM, Brown JL, Lyons MS, Sherman KE, et al. The synthetic opioid fentanyl enhances viral replication in vitro. PloS One. (2021) 16:e0249581. doi: 10.1371/journal.pone.0249581
41. Friedman JR, Abramovitz D, Skaathun B, Rangel G, Harvey-Vera A, Vera CF, et al. Illicit fentanyl use and hepatitis C virus seroconversion among people who inject drugs in Tijuana and San Diego: results from a binational cohort study. Clin Infect Dis. (2024) 79(4):1109–16. doi: 10.1101/2024.03.22.24304609
42. Zheng GX, Terry JM, Belgrader P, Ryvkin P, Bent ZW, Wilson R, et al. Massively parallel digital transcriptional profiling of single cells. Nat Commun. (2017) 8:14049. doi: 10.1038/ncomms14049
43. Young MD and Behjati S. SoupX removes ambient RNA contamination from droplet-based single-cell RNA sequencing data. Gigascience. (2020) 9. doi: 10.1093/gigascience/giaa151
44. Wolock SL, Lopez R, and Klein AM. Scrublet: computational identification of cell doublets in single-cell transcriptomic data. Cell Syst. (2019) 8:281–291.e9. doi: 10.1016/j.cels.2018.11.005
45. Korsunsky I, Millard N, Fan J, Slowikowski K, Zhang F, Wei K, et al. Fast, sensitive and accurate integration of single-cell data with Harmony. Nat Methods. (2019) 16:1289–96. doi: 10.1038/s41592-019-0619-0
46. Hao Y, Hao S, Andersen-Nissen E, Mauck WM, Zheng S, Butler A, et al. Integrated analysis of multimodal single-cell data. Cell. (2021) 184:3573–3587.e29. doi: 10.1016/j.cell.2021.04.048
47. Love MI, Huber W, and Anders S. Moderated estimation of fold change and dispersion for RNA-seq data with DESeq2. Genome Biol. (2014) 15:550. doi: 10.1186/s13059-014-0550-8
48. Squair JW, Gautier M, Kathe C, Anderson MA, James ND, Hutson TH, et al. Confronting false discoveries in single-cell differential expression. Nat Commun. (2021) 12:5692. doi: 10.1038/s41467-021-25960-2
49. Brenner E, Tiwari GR, Kapoor M, Liu Y, Brock A, and Mayfield RD. Single cell transcriptome profiling of the human alcohol-dependent brain. Hum Mol Genet. (2020) 29:1144–53. doi: 10.1093/hmg/ddaa038
50. Hay SB, Ferchen K, Chetal K, Grimes HL, and Salomonis N. The Human Cell Atlas bone marrow single-cell interactive web portal. Exp Hematol. (2018) 68:51–61. doi: 10.1016/j.exphem.2018.09.004
51. Ernst C, Eling N, Martinez-Jimenez CP, Marioni JC, and Odom DT. Staged developmental mapping and X chromosome transcriptional dynamics during mouse. spermatogenesis. Nat Commun. (2019) 10:1251. doi: 10.1038/s41467-019-09182-1
52. Wei J, Lambert TY, Valada A, Patel N, Walker K, Lenders J, et al. Single nucleus transcriptomics reveals pervasive glial activation in opioid overdose cases. bioRxiv. (2023). Epub 20230309. doi: 10.1101/2023.03.07.531400
53. Phan BN, Ray MH, Xue X, Fu C, Fenster RJ, Kohut SJ, et al. Single nuclei transcriptomics in human and non-human primate striatum in opioid use disorder. Nat Commun. (2024) 15:878. doi: 10.1038/s41467-024-45165-7
54. Ho MF, Zhang C, Moon I, Zhu X, Coombes BJ, Biernacka J, et al. Single cell transcriptomics reveals distinct transcriptional responses to oxycodone and buprenorphine by iPSC-derived brain organoids from patients with opioid use disorder. Mol Psychiatry. (2022) 29:1636–46. doi: 10.1038/s41380-022-01837-8
55. Martin FJ, Amode MR, Aneja A, Austine-Orimoloye O, Azov AG, Barnes I, et al. Ensembl 2023. Nucleic Acids Res. (2023) 51:D933–41. doi: 10.1093/nar/gkac958
56. Hu C, Huang Y, Su J, Wang M, Zhou Q, and Zhu B. The prevalence and isolated subtypes of BK polyomavirus reactivation among patients infected with human immunodeficiency virus-1 in southeastern China. Arch Virol. (2018) 163:1463–8. doi: 10.1007/s00705-018-3724-y
57. Gerold G, Moeller R, and Pietschmann T. Hepatitis C virus entry: protein interactions and fusion determinants governing productive hepatocyte invasion. Cold Spring Harb Perspect Med. (2020) 10(2): Epub 20200203. doi: 10.1101/cshperspect.a036830
58. Colpitts CC, Tsai PL, and Zeisel MB. Hepatitis C virus entry: an intriguingly complex and highly regulated process. Int J Mol Sci. (2020) 21(6):Epub 20200318. doi: 10.3390/ijms21062091
59. Samarajiwa SA, Forster S, Auchettl K, and Hertzog PJ. INTERFEROME: the database of interferon regulated genes. Nucleic Acids Res. (2009) 37:D852–7. doi: 10.1093/nar/gkn732
61. Kassambara A. ggpubr: ‘ggplot2’ Based Publication Ready Plots . Available online at: https://cran.r-project.org/package=ggpubr (Accessed February 20, 2023).
62. Kaimal V, Bardes EE, Tabar SC, Jegga AG, and Aronow BJ. ToppCluster: a multiple gene list feature analyzer for comparative enrichment clustering and network-based dissection of biological systems. Nucleic Acids Res. (2010) 38:W96–102. doi: 10.1093/nar/gkq418
63. Chen EY, Tan CM, Kou Y, Duan Q, Wang Z, Meirelles GV, et al. Enrichr: interactive and collaborative HTML5 gene list enrichment analysis tool. BMC Bioinf. (2013) 14:128. doi: 10.1186/1471-2105-14-128
64. Kuleshov MV, Jones MR, Rouillard AD, Fernandez NF, Duan Q, Wang Z, et al. Enrichr: a comprehensive gene set enrichment analysis web server 2016 update. Nucleic Acids Res. (2016) 44:W90–7. doi: 10.1093/nar/gkw377
65. Xie Z, Bailey A, Kuleshov MV, Clarke DJB, Evangelista JE, Jenkins SL, et al. Gene set knowledge discovery with Enrichr. Curr Protoc. (2021) 1:e90. doi: 10.1002/cpz1.90
66. Stuart JD, Salinas E, and Grakoui A. Immune system control of hepatitis C virus infection. Curr Opin Virol. (2021) 46:36–44. doi: 10.1016/j.coviro.2020.10.002
67. Schwerk J, Negash A, Savan R, and Gale M. Innate immunity in hepatitis C virus infection. Cold Spring Harb Perspect Med. (2021) 11(2):Epub 20210201. doi: 10.1101/cshperspect.a036988
68. Shoukry NH. Towards a systems immunology approach to understanding correlates of protective immunity against HCV. Viruses. (2021) 13. doi: 10.3390/v13091871
69. Minutolo A, Conti B, Grelli S, Viscomi C, Labbadia G, and Balsano C. Lymphocytes as liver damage mirror of HCV related adipogenesis deregulation. PloS One. (2014) 9:e92343. doi: 10.1371/journal.pone.0092343
70. Yamaguchi Y, Hino K, Fujiwara D, Ren F, Katoh Y, Satoh Y, et al. Expression of type I interferon receptor in liver and peripheral blood mononuclear cells in chronic hepatitis C patients. Dig Dis Sci. (2002) 47:1611–7. doi: 10.1023/A:1015887723557
71. Rasmussen AL, Wang IM, Shuhart MC, Proll SC, He Y, Cristescu R, et al. Chronic immune activation is a distinguishing feature of liver and PBMC gene signatures from HCV/HIV coinfected patients and may contribute to hepatic fibrogenesis. Virology. (2012) 430:43–52. doi: 10.1016/j.virol.2012.04.011
72. Listopad S, Magnan C, Asghar A, Stolz A, Tayek JA, Liu ZX, et al. Differentiating between liver diseases by applying multiclass machine learning approaches to transcriptomics of liver tissue or blood-based samples. JHEP Rep. (2022) 4:100560. doi: 10.1016/j.jhepr.2022.100560
73. Salgüero S, Brochado-Kith Ó, Verdices AV, Berenguer J, González-García J, Martínez I, et al. PBMCs gene expression signature of advanced cirrhosis with high risk for clinically significant portal hypertension in HIV/HCV coinfected patients: A cross-control study. BioMed Pharmacother. (2023) 159:114220. doi: 10.1016/j.biopha.2023.114220
74. Hatje K, Kam-Thong T, Giroud N, Saviano A, Simo-Noumbissie P, Kumpesa N, et al. Single-cell RNA-sequencing of virus-specific cellular immune responses in chronic hepatitis B patients. Sci Data. (2024) 11:355. doi: 10.1038/s41597-024-03187-2
75. Liu X, Liu ZX, Morgan TR, and Norden-Krichmar TM. Single-cell transcriptomics of peripheral blood mononuclear cells indicates impaired immune and inflammatory responses in alcohol-associated hepatitis. Hum Immunol. (2024) 85:110735. doi: 10.1016/j.humimm.2023.110735
76. Maretti-Mira AC, Salomon MP, Hsu AM, Dara L, and Golden-Mason L. Etiology of end-stage liver cirrhosis impacts hepatic natural killer cell heterogenicity. Front Immunol. (2023) 14:1137034. doi: 10.3389/fimmu.2023.1137034
77. Narmada BC, Khakpoor A, Shirgaonkar N, Narayanan S, Aw PPK, Singh M, et al. Single-cell landscape of functionally cured chronic hepatitis B patients reveals activation of innate and altered CD4-CTL-driven adaptive immunity. J Hepatol. (2024) 81:42–61. doi: 10.1016/j.jhep.2024.02.017
78. Yao J, Ji Y, Liu T, Bai J, Wang H, Yao R, et al. Single-cell RNA sequencing shows T-cell exhaustion landscape in the peripheral blood of patients with hepatitis B virus-associated acute-on-chronic liver failure. Gut Liver. (2024) 18:520–30. doi: 10.5009/gnl220449
79. Zhang Y, Qiu H, Duan F, An H, Qiao H, Zhang X, et al. A comparative study of human pluripotent stem cell-derived macrophages in modeling viral infections. Viruses. (2024) 16. doi: 10.3390/v16040552
80. Lu MY, Huang CI, Hsieh MY, Hsieh TJ, Hsi E, Tsai PC, et al. Dynamics of PBMC gene expression in hepatitis C virus genotype 1-infected patients during combined peginterferon/ribavirin therapy. Oncotarget. (2016) 7:61325–35. doi: 10.18632/oncotarget.11348
81. He G, Li LI, Guan E, Chen J, Qin YI, and Xie Y. Fentanyl inhibits the progression of human gastric carcinoma MGC-803 cells by modulating NF-κB-dependent gene expression. Oncol Lett. (2016) 12:563–71. doi: 10.3892/ol.2016.4619
82. Ma K, Ma P, Lu H, Liu S, and Cao Q. Fentanyl suppresses the survival of CD4+ T cells isolated from human umbilical cord blood through inhibition of IKKs-mediated NF-κB activation. Scandinavian J Immunol. (2017) 85:343–9. doi: 10.1111/sji.12538
83. Qin Y, Li L, Chen J, Tang X, Liao C, Xie Y, et al. Fentanyl inhibits progression of human gastric cancer MGC-803 cells by NF-kB down regulation and PTEN up regulation in vitro. Oncol Res. (2012) 20:61–9. doi: 10.3727/096504012X13473664562501
84. Zhang XL, Chen ML, and Zhou SL. Fentanyl increases colorectal carcinoma cell apoptosis by inhibition of NF-κB in a Sirt1-dependent manner. Asian Pac J Cancer Prev. (2014) 15:10015–20. doi: 10.7314/APJCP.2014.15.22.10015
85. Kocak N, Ozen F, Yildirim IH, and Duran Y. Fentanyl inhibits tumorigenesis from human breast stem cells by inducing apoptosis. Asian Pacific J Cancer Prev. (2017) 18:735–9. doi: 10.22034/APJCP.2017.18.3.735
86. Delogu G, Moretti S, Antonucci A, Marandola M, Tellan G, Sale P, et al. Apoptogenic effect of fentanyl on freshly isolated peripheral blood lymphocytes. J Trauma: Injury Infection Crit Care. (2004) 57:75–81. doi: 10.1097/01.TA.0000075349.66640.3E
87. Lam D, Sebastian A, Bogguri C, Hum NR, Ladd A, Cadena J, et al. Dose-dependent consequences of sub-chronic fentanyl exposure on neuron and glial co-cultures. Front Toxicol. (2022) 4:983415. doi: 10.3389/ftox.2022.983415
88. Karagiannis TT, Cleary JP, Gok B, Henderson AJ, Martin NG, Yajima M, et al. Single cell transcriptomics reveals opioid usage evokes widespread suppression of antiviral gene program. Nat Commun. (2020) 11:2611. doi: 10.1038/s41467-020-16159-y
89. Fox HS, Niu M, Morsey BM, Lamberty BG, Emanuel K, Periyasamy P, et al. Morphine suppresses peripheral responses and transforms brain myeloid gene expression to favor neuropathogenesis in SIV infection. Front Immunol. (2022) 13:1012884. doi: 10.3389/fimmu.2022.1012884
90. Avey D, Sankararaman S, Yim AKY, Barve R, Milbrandt J, and Mitra RD. Single-cell RNA-seq uncovers a robust transcriptional response to morphine by glia. Cell Rep. (2018) 24:3619–3629.e4. doi: 10.1016/j.celrep.2018.08.080
91. Crouse J, Kalinke U, and Oxenius A. Regulation of antiviral T cell responses by type I interferons. Nat Rev Immunol. (2015) 15:231–42. doi: 10.1038/nri3806
92. Ivashkiv LB and Donlin LT. Regulation of type I interferon responses. Nat Rev Immunol. (2014) 14:36–49. doi: 10.1038/nri3581
93. Chen L, Sun J, Meng L, Heathcote J, Edwards AM, McGilvray ID, et al. ISG15, a ubiquitin-like interferon-stimulated gene, promotes hepatitis C virus production in vitro: implications for chronic infection and response to treatment. J Gen Virol. (2010) 91:382–8. doi: 10.1099/vir.0.015388-0
94. Broering R, Zhang X, Kottilil S, Trippler M, Jiang M, Lu M, et al. The interferon stimulated gene 15 functions as a proviral factor for the hepatitis C virus and as a regulator of the IFN response. Gut. (2010) 59:1111–9. doi: 10.1136/gut.2009.195545
95. Chen L, Li S, and McGilvray I. The ISG15/USP18 ubiquitin-like pathway (ISGylation system) in hepatitis C virus infection and resistance to interferon therapy. Int J Biochem Cell Biol. (2011) 43:1427–31. doi: 10.1016/j.biocel.2011.06.006
96. Bader El Din NG and Farouk S. Exploring the impact of different inflammatory cytokines on hepatitis C virus infection. J Interferon Cytokine Res. (2024) 44:233–43. doi: 10.1089/jir.2024.0003
97. Blackard JT, Kemmer N, and Sherman K. Extrahepatic replication of HCV: insights into clinical manifestations and biological consequences. Hepatology. (2006) 44:15–22. doi: 10.1002/hep.21283
98. Carrière M, Rosenberg AR, Conti F, Chouzenoux S, Terris B, Sogni P, et al. Low density lipoprotein receptor transcripts correlates with liver hepatitis C virus RNA in patients with alcohol consumption. J Viral Hepat. (2006) 13:633–42. doi: 10.1111/j.1365-2893.2006.00737.x
99. Sandau US, Duggan E, Shi X, Smith SJ, Huckans M, Schutzer WE, et al. Methamphetamine use alters human plasma extracellular vesicles and their microRNA cargo: An exploratory study. J Extracell Vesicles. (2020) 10:e12028. doi: 10.1002/jev2.12028
100. Brenz Verca MS, Widmer DA, Wagner GC, and Dreyer J. Cocaine-induced expression of the tetraspanin CD81 and its relation to hypothalamic function. Mol Cell Neurosci. (2001) 17:303–16. doi: 10.1006/mcne.2000.0942
Keywords: opioid, fentanyl, drug use, hepatitis C virus, HCV, single cell transcriptome
Citation: Roskin KM, Meeds HL, Madhuravasal Krishnan J, Juhascik M, Cafardi JM, Brown JL, Freiermuth C, Lyons MS, Sherman KE and Blackard JT (2025) Single cell RNA transcriptome response to fentanyl use in persons with hepatitis C virus infection. Front. Virol. 5:1585217. doi: 10.3389/fviro.2025.1585217
Received: 28 February 2025; Accepted: 29 September 2025;
Published: 23 October 2025.
Edited by:
Arpan Acharya, University of Nebraska Medical Center, United StatesReviewed by:
Kiran Avula, National Institute of Allergy and Infectious Diseases (NIH), United StatesAlyssa Wilson, Icahn School of Medicine at Mount Sinai, United States
Copyright © 2025 Roskin, Meeds, Madhuravasal Krishnan, Juhascik, Cafardi, Brown, Freiermuth, Lyons, Sherman and Blackard. This is an open-access article distributed under the terms of the Creative Commons Attribution License (CC BY). The use, distribution or reproduction in other forums is permitted, provided the original author(s) and the copyright owner(s) are credited and that the original publication in this journal is cited, in accordance with accepted academic practice. No use, distribution or reproduction is permitted which does not comply with these terms.
*Correspondence: Jason T. Blackard, amFzb24uYmxhY2thcmRAdWMuZWR1