 Khulan Batsukh
 Vitaly A. Zlotnik1†
 Paolo Nasta
- 1Department of Earth and Atmospheric Sciences, University of Nebraska-Lincoln, Lincoln, NE, United States
- 2Department of Agricultural Sciences, University of Naples Federico II, Naples, Italy
Knowledge of groundwater recharge (GR) is important for the effective management of water resources under semi-arid continental climates. Unfortunately, studies and data in Mongolia are limited due to the constraints in funding and lack of research infrastructures. Currently, the wide accessibility of freely available global-scale digital datasets of physical and chemical soil properties, weather data, vegetation characteristics, and depths to the water table offers new tools and basic information that can support low-cost physically based and process-oriented models. Estimates of GR over 41 study sites in Mongolia were obtained using HYDRUS-1D in a 2-m-thick soil profile with root depths of either 0.30 or 0.97 m by exploiting the daily precipitation and biome-specific potential evapotranspiration values. The GR simulated by HYDRUS-1D arrives at the water table and becomes the actual GR with a lag time that has been calculated using a simplified form of the Richards equation and a traveling wave model. The mean annual precipitation ranges from 57 to 316 mm year−1, and on average about 95% of it is lost by mean annual actual evapotranspiration. In the steppe region, the vegetation cover induces higher-than-normal actual transpiration losses and consequently lower GR. The mean annual GR rates span between 0.3 and 12.0 mm year−1, while travel times range between 4 and 558 years. Model prediction uncertainty was quantified by comparing actual evapotranspiration and GR with available maps and by a sensitivity assessment of lag time to the soil moisture in the deep vadose zone. The partial least squares regression (PLSR) was used to evaluate the impact of available environmental properties in explaining the 47.1 and 59.1% variability of the spatially averaged mean annual GR and travel time, respectively. The most relevant contributors are clay content, aridity index, and leaf area index for GR, and depth to the water table and silt content for the lag time. In data-poor, arid, and semi-arid regions such as Mongolia, where the mean annual GR rates are low and poorly correlated to precipitation, the ever-increasing availability of world databases and remote sensing products offers promise in estimating GR.
Introduction
Groundwater is a vital ecosystem service in arid and semi-arid regions where the surface water resources are generally scarce and highly unreliable, especially under the increasing number of projected drought events induced by climate change (Deng et al., 2015). Therefore, sustainable management of water resources relies on the accurate assessment of low annual groundwater recharge (GR) rates that nevertheless are significant in a vast territory such as Mongolia. Direct measurements of GR like lysimeters are unfeasible because they involve costly, time-consuming, and labor-intensive efforts (Lerner et al., 1990; Jyrkama et al., 2002; Scanlon et al., 2002). More affordable field approaches based on chloride mass balance are commonly used to estimate GR in regions with similar environmental characteristics, e.g., Inner Mongolia, China (Gates et al., 2008; Yin et al., 2011; Deng et al., 2015; Huang et al., 2017). However, these approaches have not been used yet in Mongolia, to our knowledge.
The main available source on renewable groundwater resources in Mongolia was published by Jadambaa et al. (2012, Figures A1–71). The “renewable resources” include both diffuse and focused recharge plus lateral inflow (here, definitions of diffuse and focused recharge follow Lerner et al., 1990 and Healy, 2011). Results are largely based on the hydrograph separation method and provide the only material relevant to groundwater recharge assessment. According to this map, 76% of the country has groundwater renewable resources of <10 mm year−1, and 84% of the country has groundwater renewable resources of <20 mm year−1. These low values indicate the prevalence of areas with diffuse recharge (Healy, 2011; Meixner et al., 2016). Higher GR rates due to focused recharge are reported in river catchments, where runoff generated by snowpack in mountainous areas serves as the water source for GR in topographic depressions with extensive surface water–groundwater exchange. However, there is a clear understanding that “…so far more detailed estimation of groundwater resources of Mongolia has yet to be done” as reported in Gombo and Dambaravjaa (2012, p. 23). According to the mean annual groundwater recharge map of the world (WaterGAP 2.1, University of Frankfurt/Main; modified by WHYMAP, B., 2008), groundwater recharge is <20 mm year−1 in most parts of the country.
Currently, the accessibility of freely available global-scale digital datasets of soil physical and chemical properties, weather data, leaf area indexes, root zone depths, and depths to water table opens new opportunities in providing low-cost basic information that can support physically based and process-oriented models (Zlotnik et al., 2016; Doble and Crosbie, 2017; Pozdniakov et al., 2020). These models simulate the water balance in the groundwater–soil–plant–atmosphere system and probably represent the most promising affordable methods in Mongolia (Bayanzul et al., 2019). Feeding these models with robust input data allows the modeler to establish relationships among groundwater recharge, precipitation, and evapotranspiration, influenced by vegetation, local topography, soil hydraulic properties, and groundwater depth (e.g., Scanlon et al., 2002; Crosbie et al., 2013). These numerical simulations can be supplemented by simplified approaches to estimate soil moisture travel time across the deep vadose zone.
Therefore, the objectives of the study are as follows:
• quantification of drainage (assumed as potential groundwater recharge, GRp) from a 2-m-thick soil profile (shallow vadose zone) by using HYDRUS-1D;
• evaluation of the consistency of our results with available maps of GRp and actual evapotranspiration (ETa) provided by the Regional Hydrogeological Map of Mongolia and Food And Agriculture Organization (FAO), respectively;
• calculation of the lag (travel) time of actual groundwater recharge, GRa, between the shallow vadose zone bottom (2-m depth) and the water table; GRa is assumed to be equal to GRp.
This proposed composite low-cost methodology has practical significance for Mongolia in the absence of ground truth measurements. The renewable groundwater resources map is a primary available data source for water resource planning in Mongolia. However, other studies ignore GR or fail to use recent methodologies. Previously, GR was often neglected in Mongolia or methods failed to consider various factors influencing GR. Our method helps understand GR dynamics in several locations with different vegetation characteristics, precipitation regime, and soil properties. Most importantly, the site-specific groundwater recharge results can be exploited for supporting sustainable management of water resources and can be the basis for future studies.
Materials and Methods
Study Area and Available Data
Mongolia is a landlocked territory of 1,564,116 km2 in the heart of the Asian continent on a high plateau surrounded by mountain ridges, in the transition zone between the Siberian taiga and the dry steppes and semi-deserts of central Asia. The country has a distinctly dry subarctic continental climate, with long cold winters and short hot summers. The mean annual precipitation in Mongolia is about 200 mm year−1, ranging from <50 mm year−1 in the Gobi Desert region to over 500 mm year−1 in the mountainous regions in the north. Maximum seasonal precipitation occurs in the summer (Yu et al., 2016).
About half of the Mongolian territory is mountainous with an average elevation of 1,580 m a.s.l.; about 81% of its territory is above 1,000 m and 19% below 1,000 m (Yembuu, 1906). These mountains are divided into cool and dry types according to their vertical vegetation range. The Khentii, Khuvsgul, northwestern Mongolian Altai, Northern Khangai, and Khyangan mountains are cool types and are covered with steppe vegetation of the lower range. The Southern Altai, Gobi Altai, Gobi, and Zuungar mountains are of the dry type with desert vegetation and high-cold steppe (Indree, 2014). The steppe ecosystems are associated with the semi-arid and arid continental temperate climates of the region and are ecologically fragile and sensitive to climate change and anthropogenic disturbances (Li et al., 2007). Perennial plants (50–90%) dominate the Mongolian steppe. The highest percentage of perennial plants occurs in the high-cold steppe. In contrast, the percentage of shrub, dwarf shrub, biennials, and annuals is minimum in the high-cold steppe and gradually increases in the desert steppe (Indree, 2014). About 80% of the territory is covered by pasture land, 10% by forest, 1% by farmland, and 9% by other land cover types. Steppe vegetation occupies about 83% of the territory (Indree, 2014).
A number of meteorological and other datasets are needed to feed the vadose zone model and for the calculation of vadose zone lag time. The data have been collected from various sources in order to fulfill the lack of in situ measurements. The daily precipitation data have been acquired from NAMEM for the 2007–2011 study period. The daily grass-reference potential evapotranspiration, ET0, was calculated by using the temperature-based Hargreaves method (Batsukh et al., 2021). According to the FAO, the Aridity Index (AI) is computed as the ratio between mean annual precipitation and ET0 and will be used in our study to determine climate classes (Spinoni et al., 2015). A daily crop coefficient, Kc, was used to convert ET0 into the biome-specific potential evapotranspiration, ETp, according to the protocol used by Batsukh et al. (2021). Potential evaporation, Ep, and potential transpiration, Tp, were obtained from ETp by using the time-variant leaf area index (LAI) maps based on remote-sensing products (Batsukh et al., 2021). There are no permanent stations for measuring ETa in Mongolia. In this study, we use an available map of ETa provided by FAO (2009) to test and validate our model simulations. In general, the mean annual groundwater recharge rate in Mongolia is low especially in the southern parts; it is entirely neglected when this component of the water budget is compared to precipitation (e.g., Nandintsetseg et al., 2010). The main study related to the groundwater recharge in Mongolia by Jadambaa et al. (2012) is based historically and methodologically on the “Regional Hydrogeological Map of Mongolia, Multi-year Mean Flow of Surface Water and Groundwater (Regional Hydrogeologic Map of Mongolia, Multi-year Mean Flow of Surface Water and Groundwater, 1981)” at the scale of 1:1,000,000. The map shows the surface water runoff as contours and the groundwater flow as polygons. The groundwater flow polygons represent the total flow that originates from lateral groundwater flow, infiltration of surface water, and precipitation and are presented in mm year−1. Using data from stream gauging, spring analyses, aquifer characteristics, and borehole information, the Renewable Groundwater Resource Map (Jadambaa et al., 2012, Figures A1–74) was developed by hydrograph separation and used over 40 years for state planning, but GR concept was never used. The renewable groundwater resources (GR and lateral inflow) represented on the Renewable Groundwater Resource Map have been explained as dependent on precipitation, the hydraulic connection between surface water and groundwater, and groundwater flow from adjacent areas. The legend presents a classification of the natural resources per 1 km2 as follows: <5, 5–10, 10–20, 20–50, 50–100, 100–200, and >200 mm year−1 (Jadambaa et al., 2012, p. 305).
It is worth noticing that in the north and in the mountainous regions, the density of streams increases together with the natural groundwater resources (Jadambaa et al., 2012, p. 20, Figure 1 and p. 23, Figure 2). Low density of streams in the southern part are signs of the negligible contribution of focused recharge into GR, which is low itself.
The depth to water table data in our study locations were obtained from available hydrogeological maps (Mineral Resources and Petroleum Authority, 1994) with substantial uncertainty. The unknown depths to the water table in some locations are approximated as 10 m.
Due to the absence of in situ measurements of soil hydraulic parameters, the pedotransfer functions (PTFs) are used to get soil hydraulic parameters from soil physical properties in the study locations (Nasta et al., 2021). In these locations, the most reliable source is Soilgrids250m (van den Bosch and Batjes, 2013; Hengl et al., 2017), and therefore, this data product was used in our study. SoilGrids250m is a system of global digital soil mapping based on state-of-the-art machine learning methods to map the spatial distribution of soil properties across the globe. Sand (%), silt (%), clay (%) content, and bulk density (BD, expressed in kg m−3) have been obtained in six functional layers (0–0.05, 0.05–0.15, 0.15–0.30, 0.30–0.60, 0.60–1.0, and 1–2 m) up to 2-m depth (https://soilgrids.org/). The soil physical and hydraulic properties pertaining to the sixth layer were assumed for the deep vadose zone between the soil depth of 2 m and depth to water table. SoilGrids250m prediction models are fitted using over 230,000 soil profile observations from the WoSIS database and a series of environmental covariates. The outputs of SoilGrids250m are global soil property maps at six standard depth intervals (according to the GlobalSoilMap International Union of Soil Sciences working group and its specifications) at a horizontal spatial resolution of 250 m. Prediction uncertainty is quantified by the lower and upper limits of a 90% prediction interval (van den Bosch and Batjes, 2013).
Yanagawa et al. (2015) identified a 0.50-m-thick soil layer in Mongolia as the predominant root zone. Some of the species present in the study area have a well-developed root system, such as Haloxylon ammodendron, Nitraria sphaerocarpa, and less often Tamarix ramosissima. In our study, Ekhiin gol and Tooroi locations are covered by Haloxylon ammodendron; thus, a root depth of 0.97 m has been set for this specific vegetation according to Wang et al. (2017). The root zone in other study locations was considered as a 0.30-m-thick soil layer.
Methodology
Model Conceptualization
Precipitation is partly intercepted by vegetation and partially lost by the runoff. Infiltrating water is transpired by plant roots, evaporated from the soil surface, and drained downward below the root zone. GRp is assumed as the infiltrated water past the root zone (drainage). GRa is assumed equal to GRp after soil moisture traverses the vadose zone toward the water table (Crosbie et al., 2010). Our study estimates the recharge at plot scale in 41 experimental locations in Mongolia by setting up a soil profile, which separates the soil surface from the depth to water table.
The soil profile (Figure 1) is split into a layered shallow vadose zone delimited by the blue rectangle from soil surface up to the soil depth of 2 m and a uniform deep vadose zone (orange rectangle from soil depth of 2 m up to depth to the water table). The shallow vadose zone is assumed as the operational water mass control volume. HYDRUS-1D is used to simulate water flow across the shallow vadose zone and estimate GRp assumed as drainage at the soil depth of 2 m (Dcv) under specific soil, vegetation, and climate conditions (Wang et al., 2009). The shallow vadose zone is made up by six soil layers (0–0.05, 0.05–0.15, 0.15–0.30, 0.30–0.60, 0.60–1.0, and 1–2 m delimited by the horizontal solid lines in the blue rectangle). Water flow in the shallow vadose zone is described by the Richards equation that requires the net precipitation (P), obtained by subtracting rainfall intercepted by vegetation from gross precipitation measured by the weather station, and biome-specific potential evapotranspiration, ETp, as boundary forcings. ETp is split into potential evaporation (Ep) and potential transpiration (Tp) by using a time-variant leaf area index obtained from remote-sensing products. Other important input data are root zone depth (Drz) and soil hydraulic properties (SHPs). The output data include actual evaporation (Ea), actual transpiration (Ta), water storage (WS), and GRp.
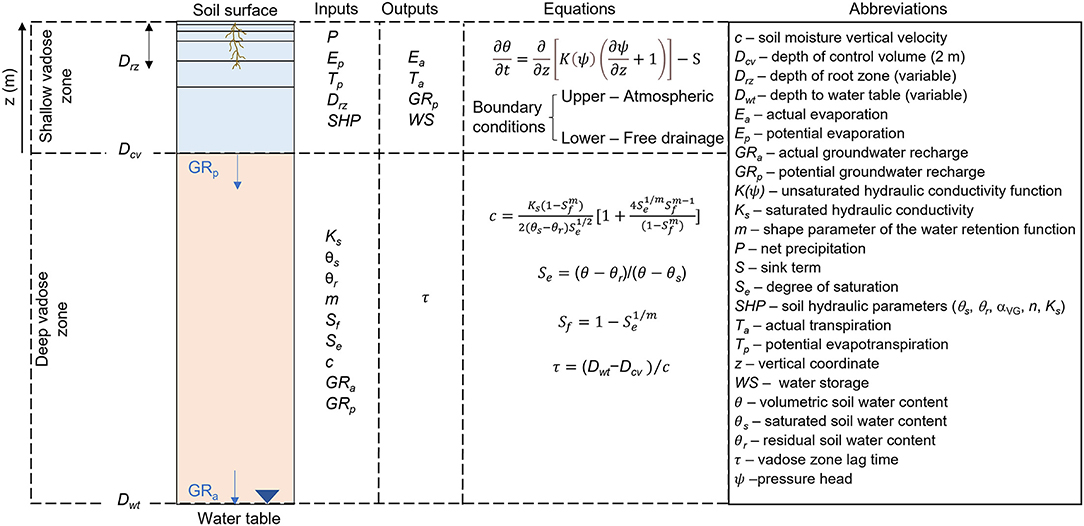
Figure 1. Schematics of the soil profile split into shallow (blue rectangle) and deep (orange rectangle) vadose zone to estimate actual groundwater recharge (GRa) depending on potential groundwater recharge (GRp) and lag time (τ). All symbols are reported and explained in the following sections.
The soil moisture from GRp travels through the deep unsaturated vadose zone and becomes GRa at the water table depth (Dwt) after a delay (or lag time, τ). It is apparent from the calculations of water mass conservation that the GR rate will not change if there are no impeding soil layers between the root zone and the aquifer (Zlotnik et al., 2007; Rossman et al., 2014). The time to reach the water table is calculated by using a simplified physically based equation defined by the depth to the water table, soil moisture profile, and soil hydraulic parameters. This time may vary on the scale from years to many centuries (Rossman et al., 2014; Dandekar et al., 2018).
Setup of HYDRUS-1D in the Shallow Vadose Zone
HYDRUS-1D is a public-domain Windows-based model used for simulating water, heat, and solute movement across the vadose zone (Šimunek et al., 2016). HYDRUS-1D solves the Richards equation for describing water flow in unsaturated or fully saturated porous media:
where t is time expressed in units of days (d), ψ is the pressure head (m), z is the soil depth (positive upward) (m), θ is the volumetric soil water content (m3 m−3), and S is the sink term (d−1) describing the actual plant root water extraction rate function depending on z, ψ, and the potential transpiration (Tp).
The soil water retention function, θ (ψ) is described by van Genuchten's equation denoted here as VG for brevity (van Genuchten, 1980):
where αVG (m−1), m (–), and n (–) are water retention shape parameters, and θr (m3 m−3) and θs (m3 m−3) are residual and saturated water contents, respectively.
Parameters m and n are related as follows: m = 1–1/n (Mualem, 1976). Considering the degree of saturation, Se = (θ-θr)/(θs-θr), which varies from 0 (θ = θr) to 1 (θ = θs), the unsaturated hydraulic conductivity function, K(Se) is given by the following equation:
where Ks (m d−1) is the saturated hydraulic conductivity, and l is the tortuosity parameter that is assumed to be 0.5 (Mualem, 1976).
The upper boundary condition depends on fluxes occurring at the soil surface (namely P and Ep). Gross precipitation Pg is intercepted by vegetation; thus, rainfall interception IR has been calculated as shown in the following equation (Nasta and Gates, 2013):
where a (m d−1) is an empirical coefficient, assumed as 0.00025 m d−1, and b (–) denotes the soil cover fraction given by
where κ is a dimensionless extinction coefficient for global solar radiation inside the canopy and is assumed to be equal to 0.463. Interception is subtracted from Pg to obtain the net rainfall P that has been calculated in study locations and used as input in HYDRUS-1D.
ETp is calculated by multiplying ET0 by a dimensionless biome-specific coefficient, Kc (i.e., ETp = ET0 × Kc). The LAI is also used to partition ETp into Ep and Tp using the following equation (Ritchie, 1972):
Potential transpiration (Tp), corresponding to potential root water uptake, is obtained by subtracting Ep from ETp. Kc and LAI are time-variant and change daily (Batsukh et al., 2021). The root distribution is assumed to be linear in the soil profile and spans from 1 (corresponding to the maximum root density) at the soil surface to 0 (corresponding to the minimum root density) at the root zone bottom.
The sink term, S, is defined as the actual plant root water extraction rate function (Feddes et al., 1978):
where αF(ψ) is a piecewise linear function (0 ≤ αF(ψ) ≤ 1) depending on prescribed pressure head values for describing the root-water uptake water stress (de Melo and de Jong van Lier, 2021). HYDRUS-1D provides tabulated values for ψ depending on plant characteristics. In this study, pasture was selected as a suitable plant in Mongolia.
The lower boundary condition is set to free drainage (unit vertical hydraulic gradient). Information on initial soil moisture or matric potential profile at the beginning of the numerical simulation is unavailable (Yu et al., 2019). Thus, the initial condition was set with the soil moisture results from model spin-ups.
PTFs have been widely used to predict soil hydraulic parameters in favor of expensive laboratory or field measurements (Schaap et al., 2001; Zhang and Schaap, 2017). Most PTFs estimate VG parameters of empirical hydraulic functions with modest accuracy (Zhang and Schaap, 2017), when available from generalized regional data. The Rosetta PTF, built into the HYDRUS-1D and based on artificial neural network analysis, is used for the estimation of the soil hydraulic parameters in this study.
Calculation of Lag Time in the Deep Vadose Zone
Drainage rates in thick unsaturated zones rarely reflect current fluxes or recharge rates at the water table (Scanlon et al., 2002). Annual average drainage in HYDRUS-1D in the top 2-m-thick soil layer is assumed equal to GRp traveling from control volume bottom (Dcv=2 m) to the water table depth (Dwt). The assumption is made that the soil moisture profile in the deep vadose zone is uniform, which is characteristic for semi-arid regions with a stable climate, e.g., in the High Plains in the USA as observed by McMahon et al. (2006). Then, vadose zone lag time can be calculated using the water table depth and soil moisture vertical velocity (c) according to Zlotnik et al. (2007) and Rossman et al. (2014). The equation for calculating c is obtained using the traveling wave solution of the Richards equation and can be expressed for VG soil properties in Equations 1 and 2 as follows:
where Sf is:
Once c has been determined from Equation 8, the lag time τ can be computed as follows:
Evaluation Criteria and Statistical Analysis
Datasets of water balance components obtained in HYDRUS-1D are summarized through basic indices of descriptive statistics such as mean (), standard deviation (sd), coefficient of variation (CV), minimum (min), and maximum (max). Student's t-test is applied to estimate the population mean of P, ET0, ETp, AI, Ea, Ta, and GRp; the sample mean is used when the population standard deviation is unknown. Student's t-distribution is used to construct the 95% confidence interval (α = 0.05) around the sample mean in each emission scenario to infer the population mean (μ):
where n is the number of weather stations (degrees of freedom are therefore defined as n-1), and tα, n−1 is Student's t-value at 95% confidence interval and n-1 degrees of freedom. To measure the predictive capability of all prediction methods, we selected two statistical performance indicators: the root mean square error (RMSE), which combines both bias and lack of precision, and the coefficient of determination (R2), which measures how well the data pairs fit to a line:
where oi is the reference value, is the mean of reference values, and ei indicates values modeled by the prediction method. The subscript i is the index of the weather stations, and n is the total number of stations (n = 41).
Partial least-squares regression (PLSR) is a statistical method for analyzing the complex interaction of a large array of predictors and the dependent variable (Wold et al., 2001; Carrascal et al., 2009). PLSR is an extension of the multiple linear regression model for which the dependent variable (y) is predicted by a set of predictors (x) as follows:
where β0 is the regression coefficient for the intercept, βi is the i-th regression coefficient, and p is the total number of predictor variables. PLSR was used to define the explained variance of GRp and τ patterns by exploiting soil–climate–vegetation factors as predictor variables. Soil proxy data are the percentages of sand, silt, and clay contents, and bulk density, as well as the depth to water table. Climate data are FAO aridity index (AI), whereas the available land cover auxiliary variable considered in this study is the annual-average leaf area index (LAI) retrieved from freely available remote-sensing products. This technique generates new components as linear combinations of the original predictor variables. PLSR finds combinations of the predictors that have a large covariance with the dependent variable. The predictive ability of the PLSR will be expressed in terms of R2 and RMSE, which evaluate the scatter of the data points around the identity line and the bias between PLSR-based and composite model simulated GRp and τ values. In the PLSR modeling, the importance of a predictor is indicated by the variable importance in the projection (VIP) (Yan et al., 2013). The factors with high VIP values of more than 1 are the most relevant in explaining the dependent variable and are considered to be significantly influential predictors. Wold (1995) suggests that those predictors with VIP>0.8 are the most relevant for explaining the dependent variable, and those with VIP <0.5 are considered to be of minor importance for the prediction of the dependent variable. It is thus possible to determine those environmental factors (predictor variables) that strongly interact with GRp and τ (the dependent variables).
Results
Assessment of Potential Groundwater Recharge Rates in the Shallow Vadose Zone
GRp simulated in HYDRUS-1D depends on climate forcings (P, Ep, and Tp), soil hydraulic parameters (SHPs) in each soil layer, root depth (Drz), root vertical distribution, initial conditions in terms of soil moisture, and prescribed pressure head values controlling the Feddes reduction factor (αF). Due to lack of information, the last three factors were kept constant over the 41 experimental sites in Mongolia. In contrast, the first three factors characterizing climate, soil, and vegetation influence the numerical simulations in HYDRUS-1D and the spatial variability of output data. As done in Batsukh et al. (2021), we considered the numerical simulations in two (Sukhbaatar, Arvaikheer) sites in the steppe region and one site (Saikhanovoo) in the Gobi Desert (Figure 2). The three sites are characterized by contrasting climate and vegetation cover with maximum (Sukhbaatar), average (Arvaikheer), and minimum (Saikhanovoo) AI and annual-average LAI values in Mongolia (Table 1).
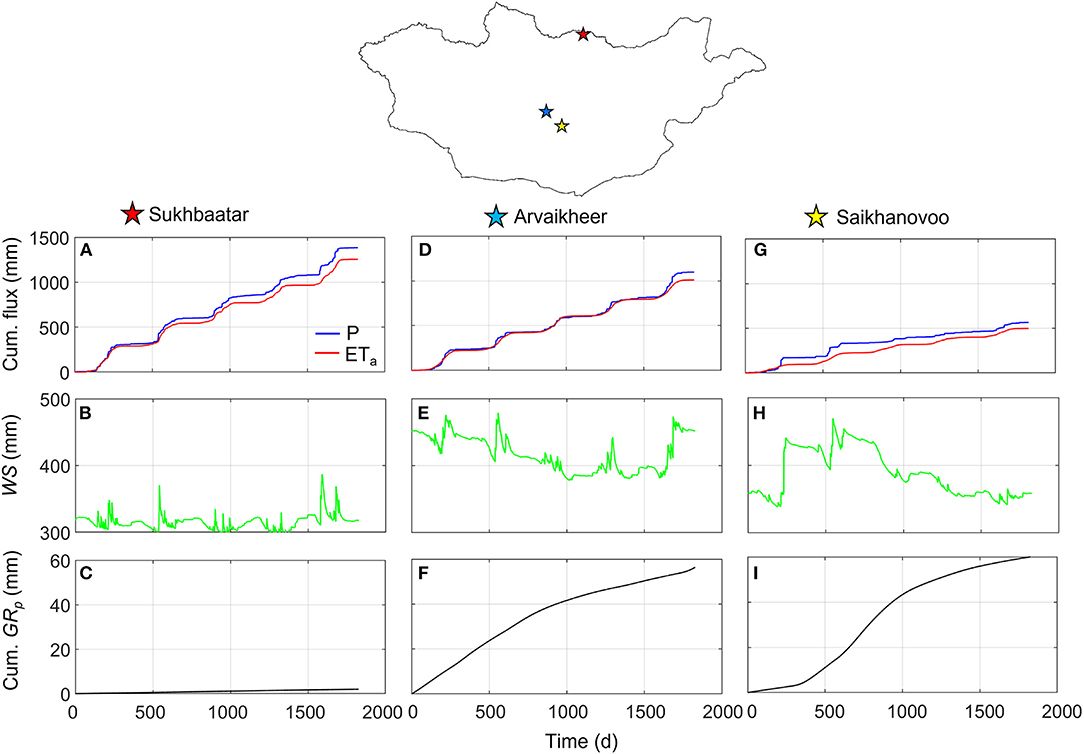
Figure 2. Cumulative net precipitation (blue line), cumulative actual evapotranspiration (red line), water storage, WS (green line), and cumulative potential groundwater recharge GRp (black line) at (A–C) Sukhbaatar, (D–F) Arvaikheer, and (G–I) Saikhanovoo.
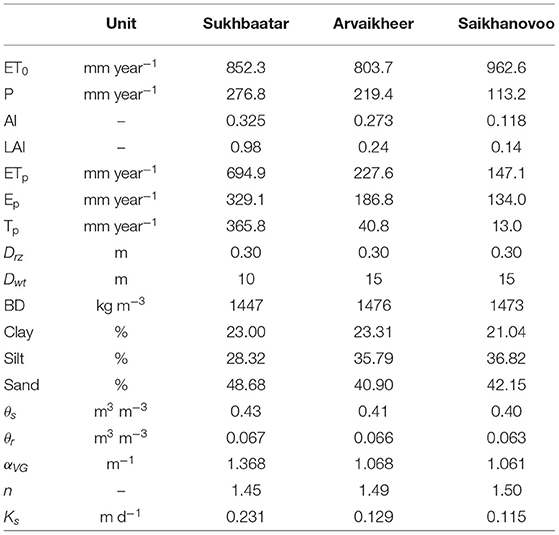
Table 1. Climate annual mean variables (ET0, P, AI, ETp, Ep, Tp), soil physical (Drz, Dwt, BD, clay, silt, sand), and hydraulic (θs, θr, αVG, n, Ks) parameters and vegetation characteristics (LAI) at Sukhbaatar, Arvaikher, and Saikhanovoo experimental sites.
The numerical simulations of cumulative P, cumulative ETa, WS, and cumulative GRp can be visualized in Figure 2. The mean annual GRp in Saikhanovoo (Gobi Desert) is similar to the one simulated in Arvaikheer (steppe region). Mean annual precipitation (P = 113 mm year−1) and actual evapotranspiration (ETa = 99.7 mm year−1) fluxes in Saikhanovoo are half those in Arvaikheer (P = 219 mm year−1 and ETa = 202 mm year−1). Ta represents 11 and 19% of ETa in Saikhanovoo and Arvaikheer, respectively. This is reflected in average WS values of 382 and 415 mm. The mean annual GRp in Saikhanovoo and Arvaikheer is higher than the mean annual GRp in Sukhbaatar with a higher-than-normal P in Mongolia (P = 277 mm year−1). Nevertheless, the higher-than-normal vegetation cover in Sukhbaatar induces high actual transpiration fluxes (51% of ETa) occurring during the rainy season by reducing WS (296 mm < WS < 387 mm corresponding to vertical-average soil water content of 0.148 m3 m−3 < θ < 0.194 m3 m−3) and consequently GRp.
Table 2 shows the sample mean (), standard deviation (sd), coefficient of variation (CV), minimum (min), and maximum (max) of soil physical (sand, silt, clay, bulk density) and soil hydraulic parameters (θr, θs, αVG, n, Ks) for the six functional layers over the 41 weather stations. The soil physical properties (sand, silt, clay, bulk density) downloaded from SoilGrids250m are quite uniform in space as depicted by their CV that is lower than 15%. The soil physical parameters are implemented in Rosetta PTF to obtain the soil hydraulic parameters featuring in the water retention function (Equation 2) and in the hydraulic conductivity function (Equation 3). The low spatial variability of SHPs is contrasted by the high spatial variability of annual-average LAI (Batsukh et al., 2021).
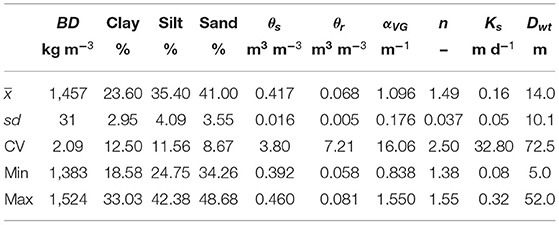
Table 2. Statistics of soil physical and hydraulic properties for six functional layers over the 41 weather stations.
The descriptive statistics of mean annual water balance components, namely gross precipitation (Pg), rainfall interception (IR), grass-reference potential evapotranspiration (ET0), biome-specific potential evapotranspiration (ETp), actual evapotranspiration (ETa), and potential groundwater recharge (GRp), simulated in HYDRUS-1D over the 41 weather stations are reported in Table 3.
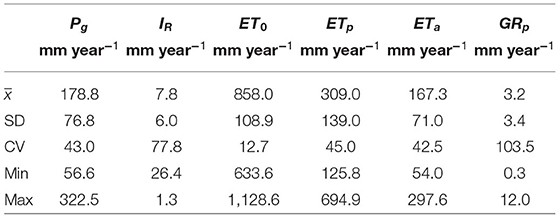
Table 3. Statistics of the water balance components simulated in HYDRUS-1D over the 41 weather stations.
The spatial-average mean annual Pg and ET0 are about 180 and 860 mm year−1, respectively. Precipitation spans between 56.6 and 323 mm year−1 and therefore is characterized by relevant spatial variability (CV = 43%) while ET0 is spatially quite uniform. By using a time-variant crop coefficient adapted for Mongolia, we report a relevant reduction of ET0 into ETp (Batsukh et al., 2021). The population mean (μ) values of ETa and GRp range between 151 and 184 and 2.5 and 4.0 mm year−1, respectively. ETa represents the main water balance component simulated in HYDRUS-1D and on average ETa constitutes more than 95% of rainfall. Runoff was zero in all numerical simulations over the 41 study locations as the soil is dry during most of the year (Banzragch and Shinoda, 2011).
We point out that, according to Batsukh et al. (2021), 29 stations belong to the steppe region where spatial-average mean annual P and ET0 are about 213 and 810 mm year−1, respectively, resulting in semi-arid climate (AI = 0.27). The remaining 12 stations belong to the Gobi Desert, where spatial-average mean annual P and ET0 are about 97 and 974 mm year−1, respectively, resulting in AI = 0.10, which corresponds to the arid climate. ETp/ET0 is on average 50 and 20% in the steppe and Gobi Desert, respectively. Tp/ETp is on average 30 and 11% in the steppe and Gobi Desert, respectively.
The simulations of the water balance in HYDRUS-1D report the following outcomes. In the steppe region, spatially averaged mean annual Ea, Ta, and GRp are 130, 61, and 3.3 mm year−1, respectively. On average ETa and GRp represent 94 and 1.7% of P, respectively. In the Gobi Desert, spatially averaged mean annual Ea, Ta, and GRp are 77, 14, and 3.8 mm year−1, respectively. On average, ETa/P = 94% is similar, while GRp/P = 3.5% doubles if compared to the values reported for the steppe region. On average Ta is 33% of ETa in steppe regions with higher LAI, while it decreases toward the Gobi region where Ea constitutes from 71 to 89% of ETa.
The model simulations were tested with values reported in the available maps. The simulated mean annual ETa values were compared to those reported in the FAO map (Figure 3A). Figure 3B shows the relationship between mapped and simulated mean annual ETa values by reporting RMSE = 59.3 mm year−1 and R2 = 0.61. This relatively high discrepancy is due to underestimation in seven locations, especially in the steppe region in northern Mongolia.
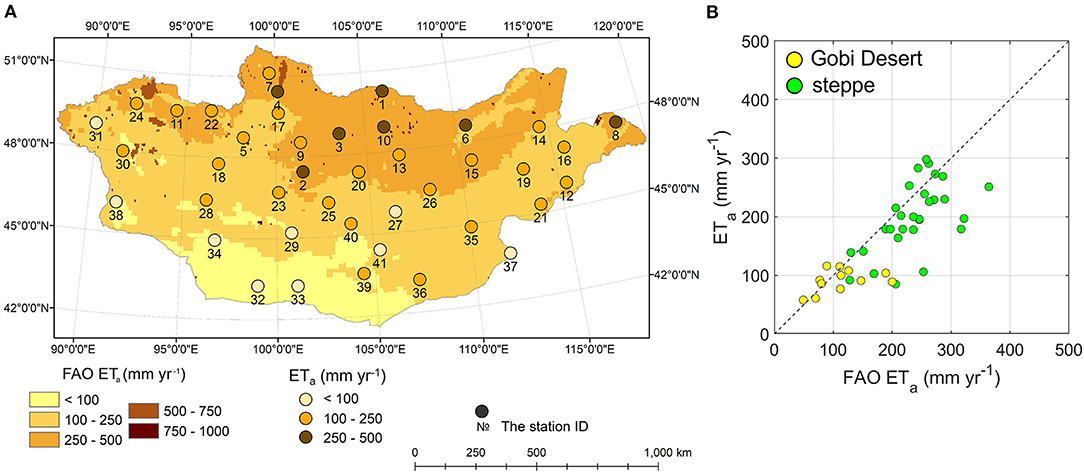
Figure 3. ET characteristics: (A) mean actual annual evapotranspiration (ETa) simulated in HYDRUS-1D (black dots) over the 41 weather stations on the FAO map; and (B) comparison between ETa values reported in the FAO map (FAO ETa) and ETa values simulated in HYDRUS-1D (ETa). Green and yellow circles indicate the steppe region and Gobi Desert, respectively.
The simulated mean annual GRp values are compared to the values reported in the Renewable Groundwater Resources map (Figure 4A). We observe fair agreement only in the class at the lowest GRp values (<5 mm year−1) over 20 weather stations (Figure 4B). In all other classes, we report a significant underestimation of GRp, especially in classes with the highest GRp values (10–300, 50–100, and 100–200 mm year−1).
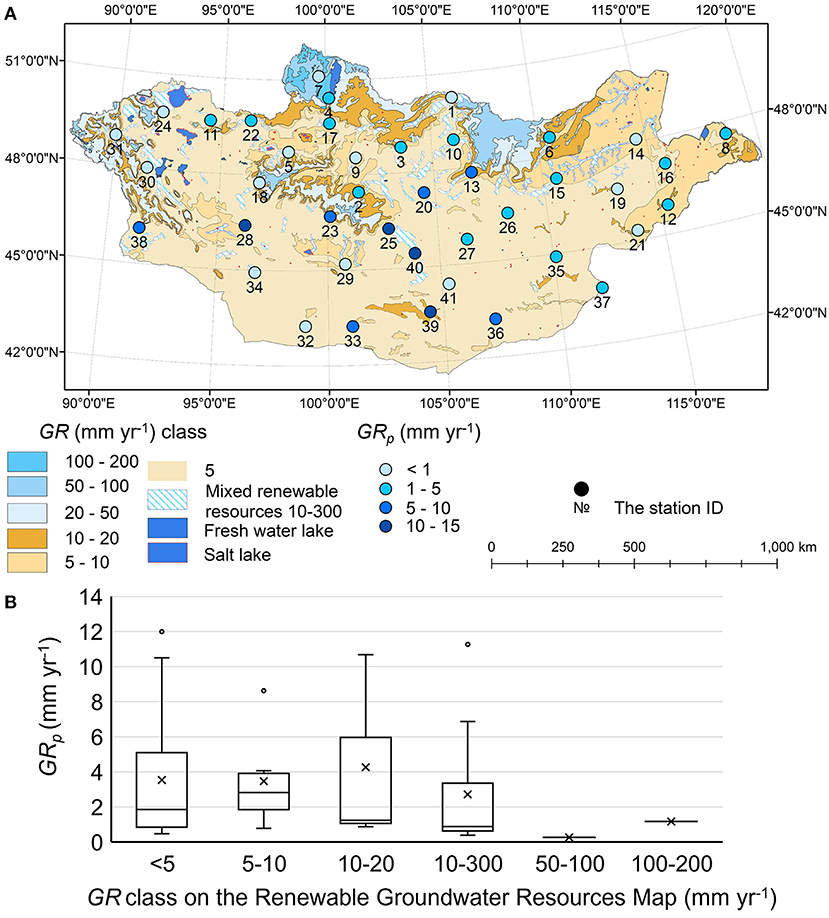
Figure 4. GR statistics: (A) mean annual potential groundwater recharge (GRp) simulated in HYDRUS-1D (black dots) on the Renewable Groundwater Resources Map grouped in GRp classes; (B) boxplots (box delimited by the two quartiles and vertical bars indicate the range between the 10th and 90th percentile) of mean annual potential groundwater recharge (GRp) simulated in HYDRUS-1D by considering GRp classes. Mean values are indicated by the cross symbol, while outliers are depicted by the circle.
These results can be compared quantitatively in more detail by analyzing the effect of environmental controls on mean annual GRp values (Yin et al., 2017). We used the PLSR approach to assess soil–climate–vegetation controlling factors (bulk density, sand, silt, clay, LAI, and AI) (Figure 5). The PLSR automatically generates six new components, which reproduce mean annual GRp patterns with R2 = 0.53, RMSE = 2.3 mm year−1, and an explained variability of 47.1%. However, the match with the identity line (1:1 line) is consistent up to GRp = 8 mm year−1, but it deteriorates for greater values. GRp values higher than 8 mm year−1 are underestimated by PLSR-modeled estimates. The variable importance in the projection (VIP) of each explanatory variable helps indicate the most important predictors in explaining the spatial variability of GRp. By considering a total of six components (the same number of predictor variables), clay, LAI, and AI are the most important predictors with VIP>0.8 while the least relevant ones are bulk density and sand content with VIP of 0.22 and 0.49, respectively.
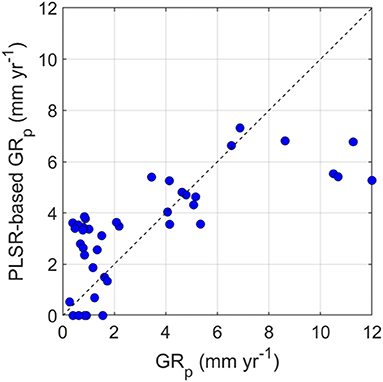
Figure 5. Comparison between GRp simulated in HYDRUS-1D and modeled by using PLSR over the 41 weather stations.
Few studies use PLSR for explaining the spatial variability of GRp. Shawul et al. (2019) found that land cover classes are able to explain more than 90% of GR at catchment scale in a PLSR analysis carried out in Ethiopia. Most studies use PLSR analysis to detect those environmental factors controlling near-surface soil moisture or other water balance components (Huang et al., 2015; Li et al., 2017).
Assessment of Lag Time in the Deep Vadose Zone
Once the GRp values are simulated in HYDRUS-1D, the lag time τ can be calculated from soil moisture vertical velocity (c), depth to the water table (Dwt), and depth of control volume (Dcv) in Equation 10. While Dwt and Dcv are known, soil moisture featuring in the degree of saturation Se in Equation 10 is unknown. Therefore, we assume that soil moisture at the soil depth of 2 m (θ2m) at the end of the numerical simulation is equal to the soil moisture across the deep soil profile (Dwt – Dcv) by crudely ignoring its vertical variation. Therefore, a sensitivity analysis of τ-values to the soil moisture profile is highly recommended (Figure 6). In doing so, we calculate the lag time (Equation 10) depending on the soil water content at the soil depth of 2 m in Sukhbaatar (0.148 m3 m−3 < θ2m <0.194 m3 m−3), Arvaikheer (0.189 m3 m−3 < θ2m <0.239 m3 m−3), and Saikhanovoo (0.169 m3 m−3 < θ2m <0.235 m3 m−3). Figure 6 shows that the lag time is highly sensitive to soil moisture simulated in HYDRUS-1D. The lag time decays exponentially between 25.3 and 352.3 years in Sukhbaatar, between 5.2 and 37.8 years Arvaikheer, and between 5.2 and 84.6 years Saikhanovoo. Therefore, a small change in soil moisture might influence the lag time by two orders of magnitude, and this indicates the paramount importance of numerical simulations in the shallow vadose zone.
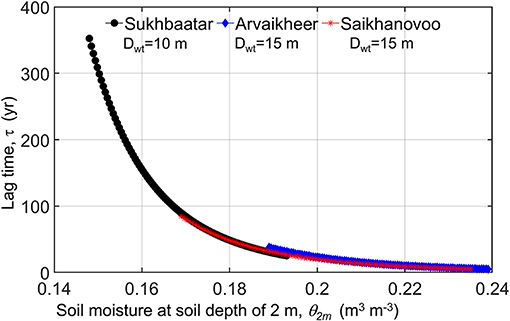
Figure 6. Relationship between soil moisture at a soil depth of 2 m (θ2m) simulated in HYDRUS-1D and lag time τ in Sukhbaatar (black circles), Arvaikheer (blue diamonds), and Saikhanovoo (red asterisks).
The lag times calculated over the 41 experimental sites span between 4.4 and 557.8 years with spatial-average τ of 92.5 years. We analyzed the predictive ability of the five soil controlling factors (bulk density, sand, silt, clay, depth to water table) to explain the spatial variability of τ. To do so, the PLSR was used, and the results are illustrated in Figure 7. The comparison betweenτ simulated in HYDRUS-1D and modeled with the PLSR is expressed using the R2, RMSE, and explained variance by using five components that are fairly able to reproduce τ patterns with R2 = 0.61, and explained variability of 59.1%. RMSE = 71.69 years indicates a large uncertainty. According to the VIP values, the most important contributors are depth to the water table and silt with VIP = 1.88 and VIP = 0.86, respectively. Bulk density is the least relevant factor in explaining the spatial variability of τ by reporting VIP = 0.37. The PLSR results highlight the relevant importance of assessing the depth to water table and silt as key predictors for travel time in Mongolia.
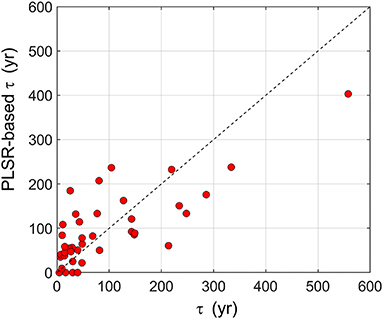
Figure 7. Comparison between τ based on θ2m in HYDRUS-1D and τ modeled by using PLSR over the 41 weather stations.
Discussion
Groundwater modeling requires aquifer properties (hydraulic conductivity, thickness of saturated zone, specific yield, storage coefficient), lateral boundary conditions, and rates of groundwater recharge GRa and withdrawals. Nonetheless, obtaining this set of input data is time-consuming and expensive, especially in data-poor countries under arid and semi-arid conditions (Scanlon et al., 2006). It is apparent that over a vast territory such as Mongolia, the magnitude of the diffuse recharge compared to focused recharge from surface water–groundwater interactions varies significantly due to the diversity of hydrologic conditions, and previously such estimates were entirely missing. Therefore, our results are not applicable in areas with extensive surface water–groundwater interactions. The diffuse GRp depends on the climate, water table depth, soil hydraulic properties of the vadose zone, and vegetation characteristics influencing evapotranspiration fluxes. It is very difficult to characterize the soil hydraulic properties of layered soil profiles throughout large-scale domains. In this study, only information on soil physical properties within the top 2 m of the vadose zone was used to simulate water fluxes in HYDRUS-1D. The Rosetta PTF was employed in six soil layers to retrieve five unknown soil hydraulic parameters (θr, θs, αVG, n, Ks) describing the soil water retention and hydraulic conductivity functions. Other existing PTFs developed for large datasets could be tested as well (Nasta et al., 2021; Weihermüller et al., 2021). Nonetheless, the SoilGrids250m database provides soil texture data distributed mainly in the following classes: clay loam, sandy clay loam, and loam. The mean annual GRp values depicted using the USDA texture triangle (Figure 8) are lower than 2 mm year−1 (reddish color) in the sandy clay loam and clay loam classes and are variable in the loam class. In contrast, lag time τ tends to be lower than 100 years in the loam class, with some exceptions.
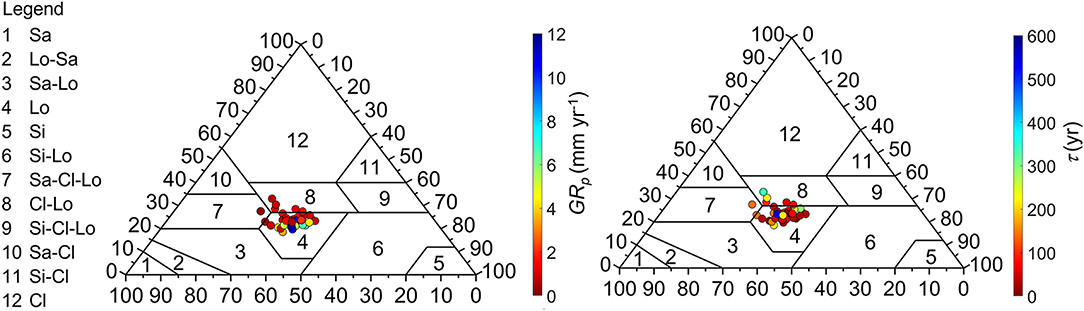
Figure 8. GRp values and τ values in the soil texture distribution (Sa, sand; Si, silt; Lo, loam; Cl, clay) over the 41 experimental soil profiles.
Estimating all of the water balance components of the vadose zone is the key to providing a robust assessment of diffuse GR. This recharge is the residual amount of water moving to the water table after the water losses of actual evapotranspiration and runoff. Topography was ignored in this study, and we assumed one-dimensional independent soil columns for 41 experimental soil profiles (Cuthbert et al., 2019).
We observed weak sensitivity of the mean annual precipitation–recharge relationship in Mongolia, which is supported by some studies in similar regions (Deng et al., 2015; Huang et al., 2017). Soil moisture profiles across the vadose zone under permanent dry conditions simulated in HYDRUS-1D induce weak sensitivity of mean annual GRp to precipitation supply. Therefore, it is unfeasible to obtain simple empirical relationships as done in other parts of the world (Crosbie et al., 2010; Cuthbert et al., 2019).
The substantial role of recharge resulting from surface water–groundwater interactions clearly can explain higher values of GR in topographic depressions occupied by streams and wetlands with runoff from mountainous areas. The effects of the accumulation and snowmelt on recharge were ignored as well (Small, 2005).
Vegetation characteristics were provided in terms of LAI retrieved from freely available remote-sensing products (Mao and Yan, 2019). LAI is used to quantify rainfall interception, the partition of ETp into Ep and Tp, which are crucial steps for obtaining reliable numerical simulations in HYDRUS-1D (Kool et al., 2014; Anderson et al., 2017; Lama et al., 2021). Vegetation influences evapotranspiration that decreases exponentially with decreasing root depth (Adane et al., 2018). The role of vegetation characteristics in assessing ETp was already considered by Batsukh et al. (2021). The validation of ETa values simulated in HYDRUS-1D with those reported in the FAO-map corroborates the acceptable prediction capability. In New Mexico and Nevada, Gee et al. (1994) found that water percolated in vegetation-free deep lysimeters, whereas percolation did not occur in lysimeters with growing vegetation. Recharge is generally much greater in non-vegetated than in vegetated regions (Gee et al., 1994) and greater in areas with annual crops and grasses than in areas with perennial plant such as trees and shrubs (Prych, 1998; Scanlon et al., 2002; Adane et al., 2018). According to our results, GRp is lower in areas with denser vegetation as well as in areas with deeper root systems. Desert vegetation such as the shrub Larrea (Creosote bush) has relatively deep root systems (David and Vokhmin, 2002), and it transpires until the soil water pressure reaches the wilting point (ψ > 810.00 m) (Pockman and Sperry, 2000). GRp values in two of our study locations that are covered by shrubs with deep root systems are lower than those simulated in other study locations in the Gobi Desert. More detailed studies on the plant-specific uptake parameters in Mongolia are needed in the future for improving model simulations.
The Renewable Groundwater Resource Map representing diffuse and local GR is practically the only published material that can be used for indirect inference of groundwater recharge in Mongolia. Our results are consistent with the map: the renewable groundwater resources on the map are greater than simulated GR rates, especially in large river catchments as well as within the mountain ranges. The prediction of GRp in the study locations presented in this paper have similar results in surrounding regions such as Inner Mongolia, China (e.g., Huang and Pang, 2013; Huang et al., 2017). According to Huang et al. (2017), the diffuse recharge beneath the grassland is 0.11–0.32 mm year−1, based on the chloride mass balance over seven soil profiles. On the other hand, according to Huang and Pang (2013), recharge in the northwestern part of China is commonly <3.6 mm year−1, where precipitation is <200 mm year−1, and groundwater is mainly recharged by mountain runoff. The recharge rates increase in the rainfed Loess Plateau, ranging from 30 to 100 mm year−1 beneath the main crop represented by wheat. An average recharge rate of 1.4 mm year−1 is also found by Gates et al. (2008) in Badain Jaran Desert in northwestern China. These studies indicate that the groundwater recharge decreases toward the arid grassland steppe in China. According to our study, GRp does not typically exceed 12 mm year−1 in Mongolia without an additional irrigation supply. Our results are validated by groundwater observations, although uncertainties are still substantial (Taylor et al., 2013; Sood and Smakhtin, 2015; Turkeltaub et al., 2015).
Groundwater recharge occurs as water percolates through overlying unsaturated zones to become stored in an aquifer system. Determining the lag time for the vadose zone is critical for quantifying groundwater renewable resources and water quality (Jasechko, 2019). Some progress in the calibration of process-based models using isotope-based techniques (Stumpp et al., 2012; Sprenger et al., 2016; Boumaiza et al., 2020) has been published recently.
We have collated a basic data archive to feed physically based models for estimating GR over a limited number of locations in Mongolia and short time series of daily weather data (a 5-year-long dataset). The ever-increasing availability of input data from other archives and potential field studies will increase the reliability of analyses.
Conclusions
We present the first study explicitly estimating the diffuse GR in Mongolia by using a composite physically based model approach. Previously, the GR concept and analyses for water resource evaluations were underutilized in Mongolia.
Results provide diffuse GR in 41 locations of Mongolia at the spatial resolution of about 200 km × 200 km by using climate data for the 2007–2011 period. Estimates utilize easily accessible databases for weather data (precipitation and biome-specific potential evapotranspiration), soil physical properties (bulk density, sand, silt, clay), and freely available remote-sensing products for vegetation characteristics (leaf area index). Acquisition of key input data might further enhance model performance. PLSR analysis identifies the most important contributors in explaining the spatial variability of GR and τ.
In Mongolia, the diffuse GR rates are very low compared to precipitation in all locations, with an annual mean of <12 mm year−1 in all considered study locations. ETa is the most relevant water balance component that was verified by available FAO data.
Our results on GR values in most regions of Mongolia are consistent with the Renewable Groundwater Resource map that is based on hydrograph separation, while it shows differences in river watersheds, topographic depressions, and other areas of focused recharge. This comparison is also consistent with GR composition, which includes both diffuse recharge and localized recharge due to the surface water–groundwater interactions. Among future topics, research should evaluate the impact of climate, land use, and land cover changes on water balance components of the vadose zone, including GR and lag time. Verification of results can be assessed by setting up ground-truth measurements in representative locations for the steppe region and the Gobi Desert.
Data Availability Statement
The original contributions presented in the study are included in the article/Supplementary Material, further inquiries can be directed to the corresponding author/s.
Author Contributions
All authors listed have made a substantial, direct, and intellectual contribution to the work and approved it for publication.
Funding
This study was supported by the Fulbright scholarship from 2019 to 2021 to KB and a grant to VZ from the Daugherty Water for Food Institute, University of Nebraska-Lincoln.
Conflict of Interest
The authors declare that the research was conducted in the absence of any commercial or financial relationships that could be construed as a potential conflict of interest.
Publisher's Note
All claims expressed in this article are solely those of the authors and do not necessarily represent those of their affiliated organizations, or those of the publisher, the editors and the reviewers. Any product that may be evaluated in this article, or claim that may be made by its manufacturer, is not guaranteed or endorsed by the publisher.
Acknowledgments
We acknowledge the U.S. Department of State-funded Fulbright Student Program for support of KB's graduate program in UNL, the Daugherty Water for Food Institute, University of Nebraska, USA for aiding with the data acquisition, the EAS Department, UNL for supporting computational efforts, and the National Agency of Meteorology and Environmental Monitoring of Mongolia for cooperation. We are also grateful to N. Jadambaa for his help with reviewing methodologies used for developing the Renewable Groundwater Resource Map of Mongolia.
Supplementary Material
The Supplementary Material for this article can be found online at: https://www.frontiersin.org/articles/10.3389/frwa.2022.802208/full#supplementary-material
References
Adane, Z. A., Nasta, P., Zlotnik, V., and Wedin, D. (2018). Impact of grassland conversion to forest on groundwater recharge in the Nebraska Sand Hills. J. Hydrol. 15, 171–183. doi: 10.1016/j.ejrh.2018.01.001
Anderson, R. G., Zhang, X., and Skaggs, T. H. (2017). Measurement and partitioning of evapotranspiration for application to Vadose Zone studies. Vadose Zone J. 16, 1–9. doi: 10.2136/vzj2017.08.0155
Banzragch, N., and Shinoda, M. (2011). Seasonal change of soil moisture in Mongolia: its climatology and modelling. Int. J. Climatol. 31, 1143–1152. doi: 10.1002/joc.2134
Batsukh, K., Zlotnik, V. A., Suyker, A., and Nasta, P. (2021). Prediction of biome-specific potential evapotranspiration in mongolia under a scarcity of weather data. Water 13:2470. doi: 10.3390/w13182470
Bayanzul, B., Nakamura, K., Machida, I., Watanabe, N., and Komai, T. (2019). Construction of a conceptual model for confined groundwater flow in the Gunii Khooloi Basin, Southern Gobi Region, Mongolia. Hydrogeol. J. 27, 1581–1596. doi: 10.1007/s10040-019-01955-8
Boumaiza, L., Chesnaux, R., Walter, J., and Stumpp, C. (2020). Constraining a flow model with field measurements to assess water transit time through a Vadose Zone. Ground Water 59:13056. doi: 10.1111/gwat.13056
Carrascal, L. M., Galván, I., and Gordo, O. (2009). Partial least squares regression as an alternative to current regression methods used in ecology. Oikos 118, 681–690. doi: 10.1111/j.1600-0706.2008.16881.x
Crosbie, R., Scanlon, B., Mpelasoka, F., Reedy, R., Gates, J., and Zhang, L. (2013). Potential climate change effects on groundwater recharge in the High Plains Aquifer, USA. Water Resourc. Res. 49, 3936–3951. doi: 10.1002/wrcr.20292
Crosbie, R. S., Jolly, I. D., Leaney, F. W., and Petheram, C. (2010). Can the dataset of field based recharge estimates in Australia be used to predict recharge in data-poor areas? Hydrol. Earth Syst. Sci. 14, 2023–2038. doi: 10.5194/hess-14-2023-2010
Cuthbert, M. O., Taylor, R. G., Favreau, G., Todd, M. C., Shamsudduha, M., Villholth, K. G., et al. (2019). Observed controls on resilience of groundwater to climate variability in sub-Saharan Africa. Nature 572, 230–234. doi: 10.1038/s41586-019-1441-7
Dandekar, A. T., Singh, D. K., Sarangi, A., and Singh, A. K. (2018). Modelling vadose zone processes for assessing groundwater recharge in semi-arid region. Curr. Sci. 114, 608–618. doi: 10.18520/cs/v114/i03/608-618
David, F. H., and Vokhmin, V. (2002). The global biogeography of roots. J. Nucl. Sci. Technol. 39, 286–289. doi: 10.1080/00223131.2002.10875464
de Melo, M. L. A., and de Jong van Lier, Q. (2021). Revisiting the Feddes reduction function for modeling root water uptake and crop transpiration. J. Hydrol. 603, 126952. doi: 10.1016/j.jhydrol.2021.126952
Deng, L., Wang, W., Cai, Y., Hu, A., and Tan, L. (2015). Groundwater diffuse recharge and its response to climate changes in semi-arid northwestern China. Terrestr. Atmos. Ocean. Sci. 26, 451–461. doi: 10.3319/TAO.2015.03.18.01(Hy)
Doble, R. C., and Crosbie, R. S. (2017). Revue: Méthodes courantes et émergentes pour la modélisation de la recharge à l'échelle du bassin versant et de l'évapotranspiration d'eaux souterraines peu profondes. Hydrogeol. J. 25, 3–23. doi: 10.1007/s10040-016-1470-3
FAO (2009). Global Map of Yearly Actual ET. Retrieved from: https://data.apps.fao.org/map/catalog/srv/eng/catalog.search#/home (accessed November 17, 2020).
Feddes, R. A., Kowalik, P. J., and Zaradny, H. (1978). Simulation of Field Water Use and Crop Yield. Wageningen : Centre for Agricultural Publishing and Documentation. Retrieved from: http://lib.ugent.be/catalog/rug01:000032129
Gates, J. B., Edmunds, W. M., Ma, J., and Sheppard, P. R. (2008). A 700-year history of groundwater recharge in the drylands of NW China. Holocene 18, 1045–1054. doi: 10.1177/0959683608095575
Gee, G. W., Wierenga, P. J., Andraski, B. J., Young, M. H., Fayer, M. J., and Rockhold, M. L. (1994). Variations in water balance and recharge potential at three western desert sites. Soil Sci. Society of Am. J. 58, 63–72. doi: 10.2136/sssaj1994.03615995005800010009x
Gombo, D., and Dambaravjaa, O. (2012). Part 1. Surface Water Resources Assessment - Integrated Water Management National Assessment Report Volume I. Ulaanbaatar, Mongolia.
Healy, R. W. (2011). Estimating Groundwater Recharge. Cambridge University Press. doi: 10.1017/CBO9780511780745
Hengl, T., de Jesus, J., Heuvelink, G. B. M., Ruiperez Gonzalez, M., Kilibarda, M., Blagotić, A., et al. (2017). SoilGrids250m: global gridded soil information based on machine learning. PLoS ONE 12, e0169748. doi: 10.1371/journal.pone.0169748
Huang, T., and Pang, Z. (2013). Groundwater recharge and dynamics in Northern China: implications for sustainable utilization of groundwater. Proc. Earth Planet. Sci. 7, 369–372. doi: 10.1016/j.proeps.2013.03.182
Huang, T., Pang, Z., Liu, J., Yin, L., and Edmunds, W. M. (2017). Groundwater recharge in an arid grassland as indicated by soil chloride profile and multiple tracers. Hydrol. Proc. 31, 1047–1057. doi: 10.1002/hyp.11089
Huang, X., Shi, Z.-H., Zhu, H. D., Zhang, H., Lei, A., and Yin, W. (2015). Soil moisture dynamics within soil profiles and associated environmental controls. Catena 136, 14. doi: 10.1016/j.catena.2015.01.014
Indree, T. (2014). The Steppe Vegetation of Mongolia. Ulaanbaatar. Retrieved from: https://www.researchgate.net/publication/271448082_The_Steppe_Vegetation_of_Mongolia
Jadambaa, N., Batjargal, D., Linden, W., van der Batsukh, N., and Borchuluun, U. (2012). Part 4. Groundwater Resources Assessment in Integrated Water Management - National Assessment Report Volume I. Ulaanbaatar. Retrieved from: http://bic.iwlearn.org/en/documents/documents/state-reports/2012/integrated-water-management-natioinal-report-volume-i-english/view
Jasechko, S. (2019). Global isotope hydrogeology—review. Rev. Geophys. 57, 835–965. doi: 10.1029/2018RG000627
Jyrkama, M. I., Sykes, J. F., and Normani, S. D. (2002). Recharge estimation for transient ground water modeling. Ground Water 40, 638–648. doi: 10.1111/j.1745-6584.2002.tb02550.x
Kool, D., Agam, N., Lazarovitch, N., Heitman, J. L., Sauer, T. J., and Ben-Gal, A. (2014). A review of approaches for evapotranspiration partitioning. Agric. Forest Meteorol. 184, 56–70. doi: 10.1016/j.agrformet.2013.09.003
Lama, G. F. C., Giovannini, M. R. M., Errico, A., Mirzaei, S., Padulano, R., Chirico, G. B., et al. (2021). Hydraulic efficiency of green-blue flood control scenarios for vegetated rivers: 1D and 2D unsteady simulations. Water. 13, 2620. doi: 10.3390/w13192620
Lerner, D., Issar, A. S., and Simmers, I. (1990). Groundwater recharge: a guide to understanding and estimating natural recharge. J. Environ. Qual. 21, 345. doi: 10.2134/jeq1992.00472425002100030036x
Li, S. G., Asanuma, J., Kotani, A., Davaa, G., and Oyunbaatar, D. (2007). Evapotranspiration from a Mongolian steppe under grazing and its environmental constraints. J. Hydrol. 333, 133–143. doi: 10.1016/j.jhydrol.2006.07.021
Li, Z., Xu, X., Xu, C., Liu, M., Wang, K., and Yu, B. (2017). Annual runoff is highly linked to precipitation extremes in Karst catchments of Southwest China. J. Hydrometeorol. 18, 2745–2759. doi: 10.1175/JHM-D-17-0032.1
Mao, J., and Yan, B. (2019). Global Monthly Mean Leaf Area Index Climatology, 1981-2015. Oak Ridge, TN: ORNL DAAC.
McMahon, P. B., Dennehy, K. F., Bruce, B. W., Böhlke, J. K., Michel, R. L., Gurdak, J. J., et al. (2006). Storage and transit time of chemicals in thick unsaturated zones under rangeland and irrigated cropland, High Plains, United States. Water Resourc. Res. 42:4417. doi: 10.1029/2005WR004417
Meixner, T., Manning, A. H., Stonestrom, D. A., Allen, D. M., Ajami, H., Blasch, K. W., et al. (2016). Implications of projected climate change for groundwater recharge in the western United States. J. Hydrol. 534, 124–138. doi: 10.1016/j.jhydrol.2015.12.027
Mineral Resources and Petroleum Authority (1994). Hydrogeology Map 1:500000. Mineral resources and Petreloum Authority, Ulaanbaatar, Mongolia.
Mualem, Y. (1976). A new model for predicting the hydaulic conductivity of unsaturated porous media. Water Res. Res. 12, 513. doi: 10.1029/WR012i003p00513
Nandintsetseg, B., Shinoda, M., Kimura, R., and Ibaraki, Y. (2010). Relationship between soil moisture and vegetation activity in the Mongolian steppe. Sci. Online Lett. Atmos. 6, 29–32. doi: 10.2151/sola.2010-008
Nasta, P., and Gates, J. B. (2013). Plot-scale modeling of soil water dynamics and impacts of drought conditions beneath rainfed maize in Eastern Nebraska. Agric. Water Manag. 128, 120–130. doi: 10.1016/j.agwat.2013.06.021
Nasta, P., Szabó, B., and Romano, N. (2021). Evaluation of pedotransfer functions for predicting soil hydraulic properties: a voyage from regional to field scales across Europe. J. Hydrol. 37, 100903. doi: 10.1016/j.ejrh.2021.100903
Pockman, W., and Sperry, J. (2000). Vulnerability to xylem cavitation and the distribution of Sonoran desert vegetation. Am. J. Botany 87, 1287–1299. doi: 10.2307/2656722
Pozdniakov, S. P., Vasilevsky, P. Y., Grinevskiy, S. O., Lekhov, V. A., Sizov, N. E., and Wang, P. (2020). Variability in spatial-temporal recharge under the observed and projected climate: a site-specific simulation in the black soil region of Russia. J. Hydrol. 590, 125247. doi: 10.1016/j.jhydrol.2020.125247
Prych, E. A. (1998). Using Chloride and Chlorine-36 as Soil-Water Tracers to Estimate Deep Percolation at Selected Locations on the US Department of Energy Hanford Site. Washington, DC: US Geological Survey.
Regional Hydrogeologic Map of Mongolia, Multi-year Mean Flow of Surface Water and Groundwater (1981). Aerogeology Research Institute, Moscow, Soviet Union.
Ritchie, J. T. (1972). Model for predicting evaporation from a row crop with incomplete cover. Water Resourc. Res. 8, 1204–1213. doi: 10.1029/WR008i005p01204
Rossman, N. R., Zlotnik, V. A., Rowe, C. M., and Szilagyi, J. (2014). Vadose zone lag time and potential 21st century climate change effects on spatially distributed groundwater recharge in the semi-arid Nebraska Sand Hills. J. Hydrol. 519, 656–669. doi: 10.1016/j.jhydrol.2014.07.057
Scanlon, B., Healy, R., and Cook, P. (2002). Choosing appropriate techniques for quantifying groundwater recharge. Hydrogeol. J. 10, 18–39. doi: 10.1007/s10040-001-0176-2
Scanlon, B. R., Keese, K. E., Flint, A. L., Flint, L. E., Gaye, C. B., Edmunds, W. M., et al. (2006). Global synthesis of groundwater recharge in semiarid and arid regions. Hydrol. Proc. 20, 3335–3370. doi: 10.1002/hyp.6335
Schaap, M. G., Leij, F. J., and Van Genuchten, M. T. (2001). Rosetta: a computer program for estimating soil hydraulic parameters with hierarchical pedotransfer functions. J. Hydrol. 251, 163–176. doi: 10.1016/S0022-1694(01)00466-8
Shawul, A., Chakma, S., and Melesse, A. (2019). The response of water balance components to land cover change based on hydrologic modeling and partial least squares regression (PLSR) analysis in the Upper Awash Basin. J. Hydrol. 26, 100640. doi: 10.1016/j.ejrh.2019.100640
Šimunek, J., van Genuchten, M. T., and Šejna, M. (2016). Recent developments and applications of the HYDRUS computer software packages. Vadose Zone J. 15, 33. doi: 10.2136/vzj2016.04.0033
Small, E. E. (2005). Climatic controls on diffuse groundwater recharge in semiarid environments of the southwestern United States. Water Resourc. Res. 41, 1–17. doi: 10.1029/2004WR003193
Sood, A., and Smakhtin, V. (2015). Revue des modèles hydrologiques globaux. Hydrol. Sci. J. 60, 549–565. doi: 10.1080/02626667.2014.950580
Spinoni, J., Vogt, J., Naumann, G., Carrao, H., and Barbosa, P. (2015). Towards identifying areas at climatological risk of desertification using the Köppen-Geiger classification and FAO aridity index. Int. J. Climatol. 35, 2210–2222. doi: 10.1002/joc.4124
Sprenger, M., Seeger, S., Blume, T., and Weiler, M. (2016). Travel times in the vadose zone: Variability in space and time. Water Resourc. Res. 52, 5727–5754. doi: 10.1002/2015WR018077
Stumpp, C., Stichler, W., Kandolf, M., and Šimunek, J. (2012). Effects of land cover and fertilization method on water flow and solute transport in five lysimeters: a long-term study using stable water isotopes. Vadose Zone J. 11:75. doi: 10.2136/vzj2011.0075
Taylor, R. G., Scanlon, B., Döll, P., Rodell, M., Van Beek, R., Wada, Y., et al. (2013). Ground water and climate change. Nat. Clim. Change 3, 322–329. doi: 10.1038/nclimate1744
Turkeltaub, T., Kurtzman, D., Bel, G., and Dahan, O. (2015). Examination of groundwater recharge with a calibrated/validated flow model of the deep vadose zone. J. Hydrol. 522, 618–627. doi: 10.1016/j.jhydrol.2015.01.026
van den Bosch, R., and Batjes, N. H. (2013). ISRIC - World Soil Information (WDC-Soils). Ulaanbaatar: Ministry of Environment and Tourism.
van Genuchten, M. T. (1980). A closed-form equation for predicting the hydraulic conductivity of unsaturated soils. Soil Sci. Society Am. J. 44, 892–898. doi: 10.2136/sssaj1980.03615995004400050002x
Wang, T., Zlotnik, V. A., Šimunek, J., and Schaap, M. G. (2009). Using pedotransfer functions in vadose zone models for estimating groundwater recharge in semiarid regions. Water Resourc. Res. 45, 1–12. doi: 10.1029/2008WR006903
Wang, Z. Y., Hou, J., Qu, Z. Q., Guo, J. Y., and Li, J. R. (2017). Root distribution of 430 plants in temperate grassland of northern China. Appl. Ecol. Environ. Res. 15, 1625–1651. doi: 10.15666/aeer/1503_16251651
WaterGAP 2.1, University of Frankfurt/Main; modified by WHYMAP B. (2008). Mean Annual Groundwater Recharge for the WMO Standard Hydrological Period 1961-1990. Retrieved from: https://www.whymap.org/whymap/EN/Maps_Data/Gwv/gw_recharge_g.html;nn=9930678 (accessed May 10, 2021).
Weihermüller, L., Lehmann, P., Herbst, M., Rahmati, M., Verhoef, A., Or, D., et al. (2021). Choice of pedotransfer functions matters when simulating soil water balance fluxes. J. Adv. Model. Earth Syst. 13, 2404. doi: 10.1029/2020MS002404
Wold, S. (1995). PLS for Multivariate Linear Modeling. Chemometric Methods in Molecular Design, 195–218. Retrieved from: http://ci.nii.ac.jp/naid/10031086076/en/
Wold, S., Sjöström, M., and Eriksson, L. (2001). PLS-regression: a basic tool of chemometrics. Chemometr. Intel. Lab. Syst. 58, 109–130. doi: 10.1016/S0169-7439(01)00155-1
Yan, B., Fang, N. F., Zhang, P. C., and Shi, Z. H. (2013). Impacts of land use change on watershed streamflow and sediment yield: an assessment using hydrologic modelling and partial least squares regression. J. Hydrol. 484, 26–37. doi: 10.1016/j.jhydrol.2013.01.008
Yanagawa, A., Fujimaki, H., Okuro, T., Jamsran, U., and Takeuchi, K. (2015). Comparison of drought tolerances in a root water uptake model for two co-occurring grass species in Mongolia. J. Jpn. Soc. Soil Phys. 130, 3–10.
Yembuu, B. (1906). The physical geography of Mongolia: Ulaanbaatar, Mongolia. Nature 74. doi: 10.1038/074527a0
Yin, L., Hou, G., Huang, J., Li, Y., Wang, X., Yang, Z., et al. (2011). “Using chloride mass-balance and stream hydrographs to estimate groundwater recharge in the Hailiutu River Basin, NW China,” in ISWREP 2011–Proceedings of 2011 International Symposium on Water Resource and Environmental Protection, vol. 1 (Piscataway, NJ: IEEE), 325–328.
Yin, Z., Feng, Q., Yang, L., Wen, X., Si, J., and Zou, S. (2017). Long term quantification of climate and land cover change impacts on streamflow in an alpine river catchment, northwestern China. Sustainability 9, 1278. doi: 10.3390/su9071278
Yu, D., Yang, J., Shi, L., Zhang, Q., Huang, K., Fang, Y., et al. (2019). On the uncertainty of initial condition and initialization approaches in variably saturated flow modeling. Hydrol. Earth Syst. Sci. 23, 2897–2914. doi: 10.5194/hess-23-2897-2019
Yu, W., Wu, T., Wang, W., Li, R., Wang, T., Qin, Y., et al. (2016). Spatiotemporal changes of reference evapotranspiration in Mongolia during 1980-2006. Adv. Meteorol. 2016, 1–14. doi: 10.1155/2016/9586896
Zhang, Y., and Schaap, M. G. (2017). Weighted recalibration of the Rosetta pedotransfer model with improved estimates of hydraulic parameter distributions and summary statistics (Rosetta3). J. Hydrol. 547, 39–53. doi: 10.1016/j.jhydrol.2017.01.004
Zlotnik, V. A., Wang, T., Nieber, J., and Šimunek, J. (2007). Verification of numerical solutions of the Richards equation using a traveling wave solution. Adv. Water Resour. 30, 1973–1980. doi: 10.1016/J.Jhydrol.2015.12.019
Zlotnik, V. A., Ward, A. S., Harvey, J. W., Lautz, L. K., Rosenberry, D. O., and Brunner, P. (2016). “Groundwater-surface water interactions,” in The Handbook of Groundwater Engineering: Third Edition, eds J. Cushman and D. Tartakovsky (Boca Raton, FL: CRC Press), 237–288. doi: 10.1201/9781315371801-10
Keywords: HYDRUS-1D, soil moisture, lag time, Rosetta, semi-arid climate, partial least squares regression (PLSR)
Citation: Batsukh K, Zlotnik VA and Nasta P (2022) Analysis of Groundwater Recharge in Mongolian Drylands Using Composite Vadose Zone Modeling. Front. Water 4:802208. doi: 10.3389/frwa.2022.802208
Received: 26 October 2021; Accepted: 13 January 2022;
Published: 03 March 2022.
Edited by:
Younes Fakir, Cadi Ayyad University, MoroccoReviewed by:
Jie Niu, Jinan University, ChinaBroder Merkel, Freiberg University of Mining and Technology, Germany
Adam Szymkiewicz, Gdansk University of Technology, Poland
Copyright © 2022 Batsukh, Zlotnik and Nasta. This is an open-access article distributed under the terms of the Creative Commons Attribution License (CC BY). The use, distribution or reproduction in other forums is permitted, provided the original author(s) and the copyright owner(s) are credited and that the original publication in this journal is cited, in accordance with accepted academic practice. No use, distribution or reproduction is permitted which does not comply with these terms.
*Correspondence: Paolo Nasta, paolo.nasta@unina.it
†These authors have contributed equally to this work