 Vinícius O. Silva1
 Carlos R. de Mello
 Li Guo
- 1Water Resources Department, Universidade Federal de Lavras, Lavras, Brazil
- 2Instituto Nacional de Pesquisas Espaciais, Cachoeira Paulista, Brazil
- 3State Key Laboratory of Hydraulics and Mountain River Engineering, College of Water Resource and Hydropower, Sichuan University, Chengdu, China
The Brazilian Pantanal is a remarkable ecosystem, encompassing vital aspects such as fish, fruit, and grain production, greenhouse gas emission regulation, temperature and precipitation modulation, and groundwater recharge. However, 2019 and 2020 experienced prolonged and severe drought that profoundly impacted the Pantanal region. Although these impacts are still under review, their effects on wildlife, vegetation, and the local population are undeniable. To enhance our understanding of the magnitude and consequences of the 2019/2020 drought, the present study conducted a comprehensive evaluation of drought occurrences in the Pantanal biome. Utilizing two well-established drought indices, the standard precipitation index (SPI) and the standard precipitation evapotranspiration index (SPEI), we analyzed the available observational data provided by the Climate Research Unit (CRU). Additionally, we endeavored to project droughts throughout the 21st century, thereby facilitating the visualization of potential reoccurrences of hazardous events in the Pantanal area. Two regional climate model (RCM) ensembles, the Eta ensemble (E1) and CORDEX ensemble (E2), along with representative concentration pathways (RCP4.5 and RCP8.5 scenarios) were used to project the severity of droughts in the Brazilian Pantanal until 2098/2099. The findings indicate that the hydrological year of 2019/2020 was the driest on record in the Pantanal over the past 80 years. The E1 ensemble did not project such an extreme event, whereas the E2 ensemble forecasted extreme droughts before the 2040s under the RCP4.5 and RCP8.5 scenarios. Using the SPEI, both ensembles showed similar results, with extreme droughts projected toward the end of the 21st century. Notably, the SPI demonstrated effectiveness in detecting short-term droughts, while the SPEI was more efficient for long-term assessments, projecting extreme drought events for the last two decades. The SPEI, employed with the Eta and CORDEX ensembles, can provide valuable insights into drought projections. Moreover, the potential recurrence of extreme droughts, characterized by significant below-average precipitation spanning vast areas throughout the hydrological year, poses a severe threat to the Pantanal biome in this century.
Introduction
The Brazilian Pantanal region is an extensive tropical wetland covering an area of approximately 150,000 km2 in the Upper Paraguay River Basin (UPRB) at the center of South America. As a wetland ecosystem, the Pantanal provides habitat to many species that have adapted to the annual precipitation cycle between the wet and dry seasons. However, wetlands are susceptible to several pressures, including land-use changes, hydrological modifications, contaminant runoff, eutrophication, and erosion and sedimentation, which pose potential threats to their ecosystems (Ostad-Ali-Askari, 2022). The Pantanal’s unique characteristics, such as its various environments comprising open water, ground, perennial, and floating vegetation, make it a distinct biome in South America and the world (Pott A. et al., 2011).
The rainfall pattern in the Upper Paraguay River Basin is modulated by the South America Summer Monsoon (Marengo et al., 2010), which trades winds and the vapor flux from the equatorial Atlantic Ocean (Bergier et al., 2018). The annual average precipitation in the Pantanal is approximately 1,300 mm, which is highly seasonal, and most falls between October and March.
Wetlands are critical environments that provide billions of dollars in ecosystem services, including fish, fruits, grain production, water storage, greenhouse gas regulation, temperature and precipitation regulation, and groundwater recharge (Ivory et al., 2019). For example, during Hurricane Sandy, wetlands in the United States saved $625 million in direct flood damage (Narayan et al., 2017). However, rapid urbanization and expanding agricultural areas have caused wetland damage in recent years. Over the last 20 years, China has lost 2,883 km2 of wetlands to urban expansion (Mao et al., 2018), while Europe has lost 45% of its original wetland area (Hu et al., 2017).
The Pantanal is home to nearly 2,000 plant species, including at least 280 aquatic macrophytes (Pott V. et al., 2011). The annual precipitation cycle affects the Pantanal flora, with aquatic plants responding to flood dynamics. Wetland plants have adapted to seasonal water-level fluctuations, resulting in stable communities with shifts in species dominance (Catian et al., 2018). Nevertheless, the Pantanal biome faces increased climate risks, which could be observed with recent droughts. Drought is a complex climate phenomenon that harms natural and urbanized environments and socioeconomic systems worldwide (Javadinejad et al., 2020; Peng et al., 2020). It is generally defined as a temporal deviation from the average climate for a specific region resulting in water scarcity due to below-average precipitation, above-average temperature, or both (Clark et al., 2016). Droughts can be classified from various perspectives, including meteorological (negative precipitation and/or positive temperature anomalies), agricultural (soil moisture deficiency), hydrological (negative runoff anomaly), socioeconomic (response of society to water supply and demand), and environmental or ecological (AghaKouchak et al., 2015; Peng et al., 2020) perspectives.
Between 2019 and 2020, the Pantanal biome was affected by an extreme drought event classified as a megadrought that evolved differently in space and time (Thielen et al., 2021). This drought event was first observed in the central section of the Pantanal at the beginning of 2019, spreading eastward by mid-year, hitting more than 80% of the Pantanal, which persisted for a longer period than any previous drought observed in the region.
This megadrought in the Brazilian Pantanal had several consequences, including fires. These fires caused significant destruction, underscoring the potential for large-scale wildfires due to a combination of extreme weather, management of grasslands for farmers, and inadequate governance. Therefore, it is essential to enhance our understanding of droughts and the impacts of climate change in the region to enable effective decision-making and actions (Ferreira Barbosa et al., 2022).
Given the severity of the 2019/2020 drought in the Pantanal, it is crucial to examine past drought behavior, which could be pertinent to climate change research modeling. These droughts have likely intensified across the country over the last decade and are linked to climate change (Silva and Mello, 2020; IPCC, 2022; Junqueira et al., 2022). However, only a few studies have examined droughts over time, primarily relying on ensembles from various global climate models. Thus, the novelty of this study is that it estimates the spatiotemporal propagation of meteorological droughts in the Pantanal and projects their recurrence through two different ensembles of regional climate model cores, Eta and CORDEX (International Conference on the Coordinated Regional Climate Downscaling Experiment). This study sought to answer three key questions: (i) was the 2019/2020 drought the most severe in the last 80 years? (ii) Can such an event occur in this century? (iii) How relevant are the regional climate model data for decision-makers in the Pantanal region? The answers to these questions aim to understand drought climatology, enhance the comprehension of this phenomenon in tropical wetlands, and support drought severity in the Pantanal throughout the 21st century.
Materials and methods
Study area
This study is geographically focused on the Pantanal biome, which is located between 15° and 23°S and between 54° and 60°W (Figure 1). In Brazil, 65% of the Pantanal is in the state of Mato Grosso do Sul, and 35% is in Mato Grosso. According to the CRU dataset, the annual average precipitation in the Pantanal is 1,300 mm, with a range of 1,023 mm in the eastern region to 1,481 mm in the southwestern region. The average temperature varies from 21.2°C in the south to 28°C in the north. The annual average evapotranspiration is 1,623 mm, with a range of 1,371 mm in the southern region to 1736 mm in the northern region. The Pantanal has two distinct seasons, a rainy and a dry season. However, from a hydrological perspective, four seasons can be identified: the flooding season (January–March), the recession limb season (April–June), the dry season (July–September), and the rising limb season (October–March; Almeida et al., 2015). The flooding season marks the progressive flooding of the Pantanal area, while the recession limb season occurs when the rainy season is over and the water levels start to decrease. The dry season coincides with the time of year when rainfall is scarce and the vegetation is dry. The rising limb season indicates that the rainy season begins, and the wetland is preparing to flood again.
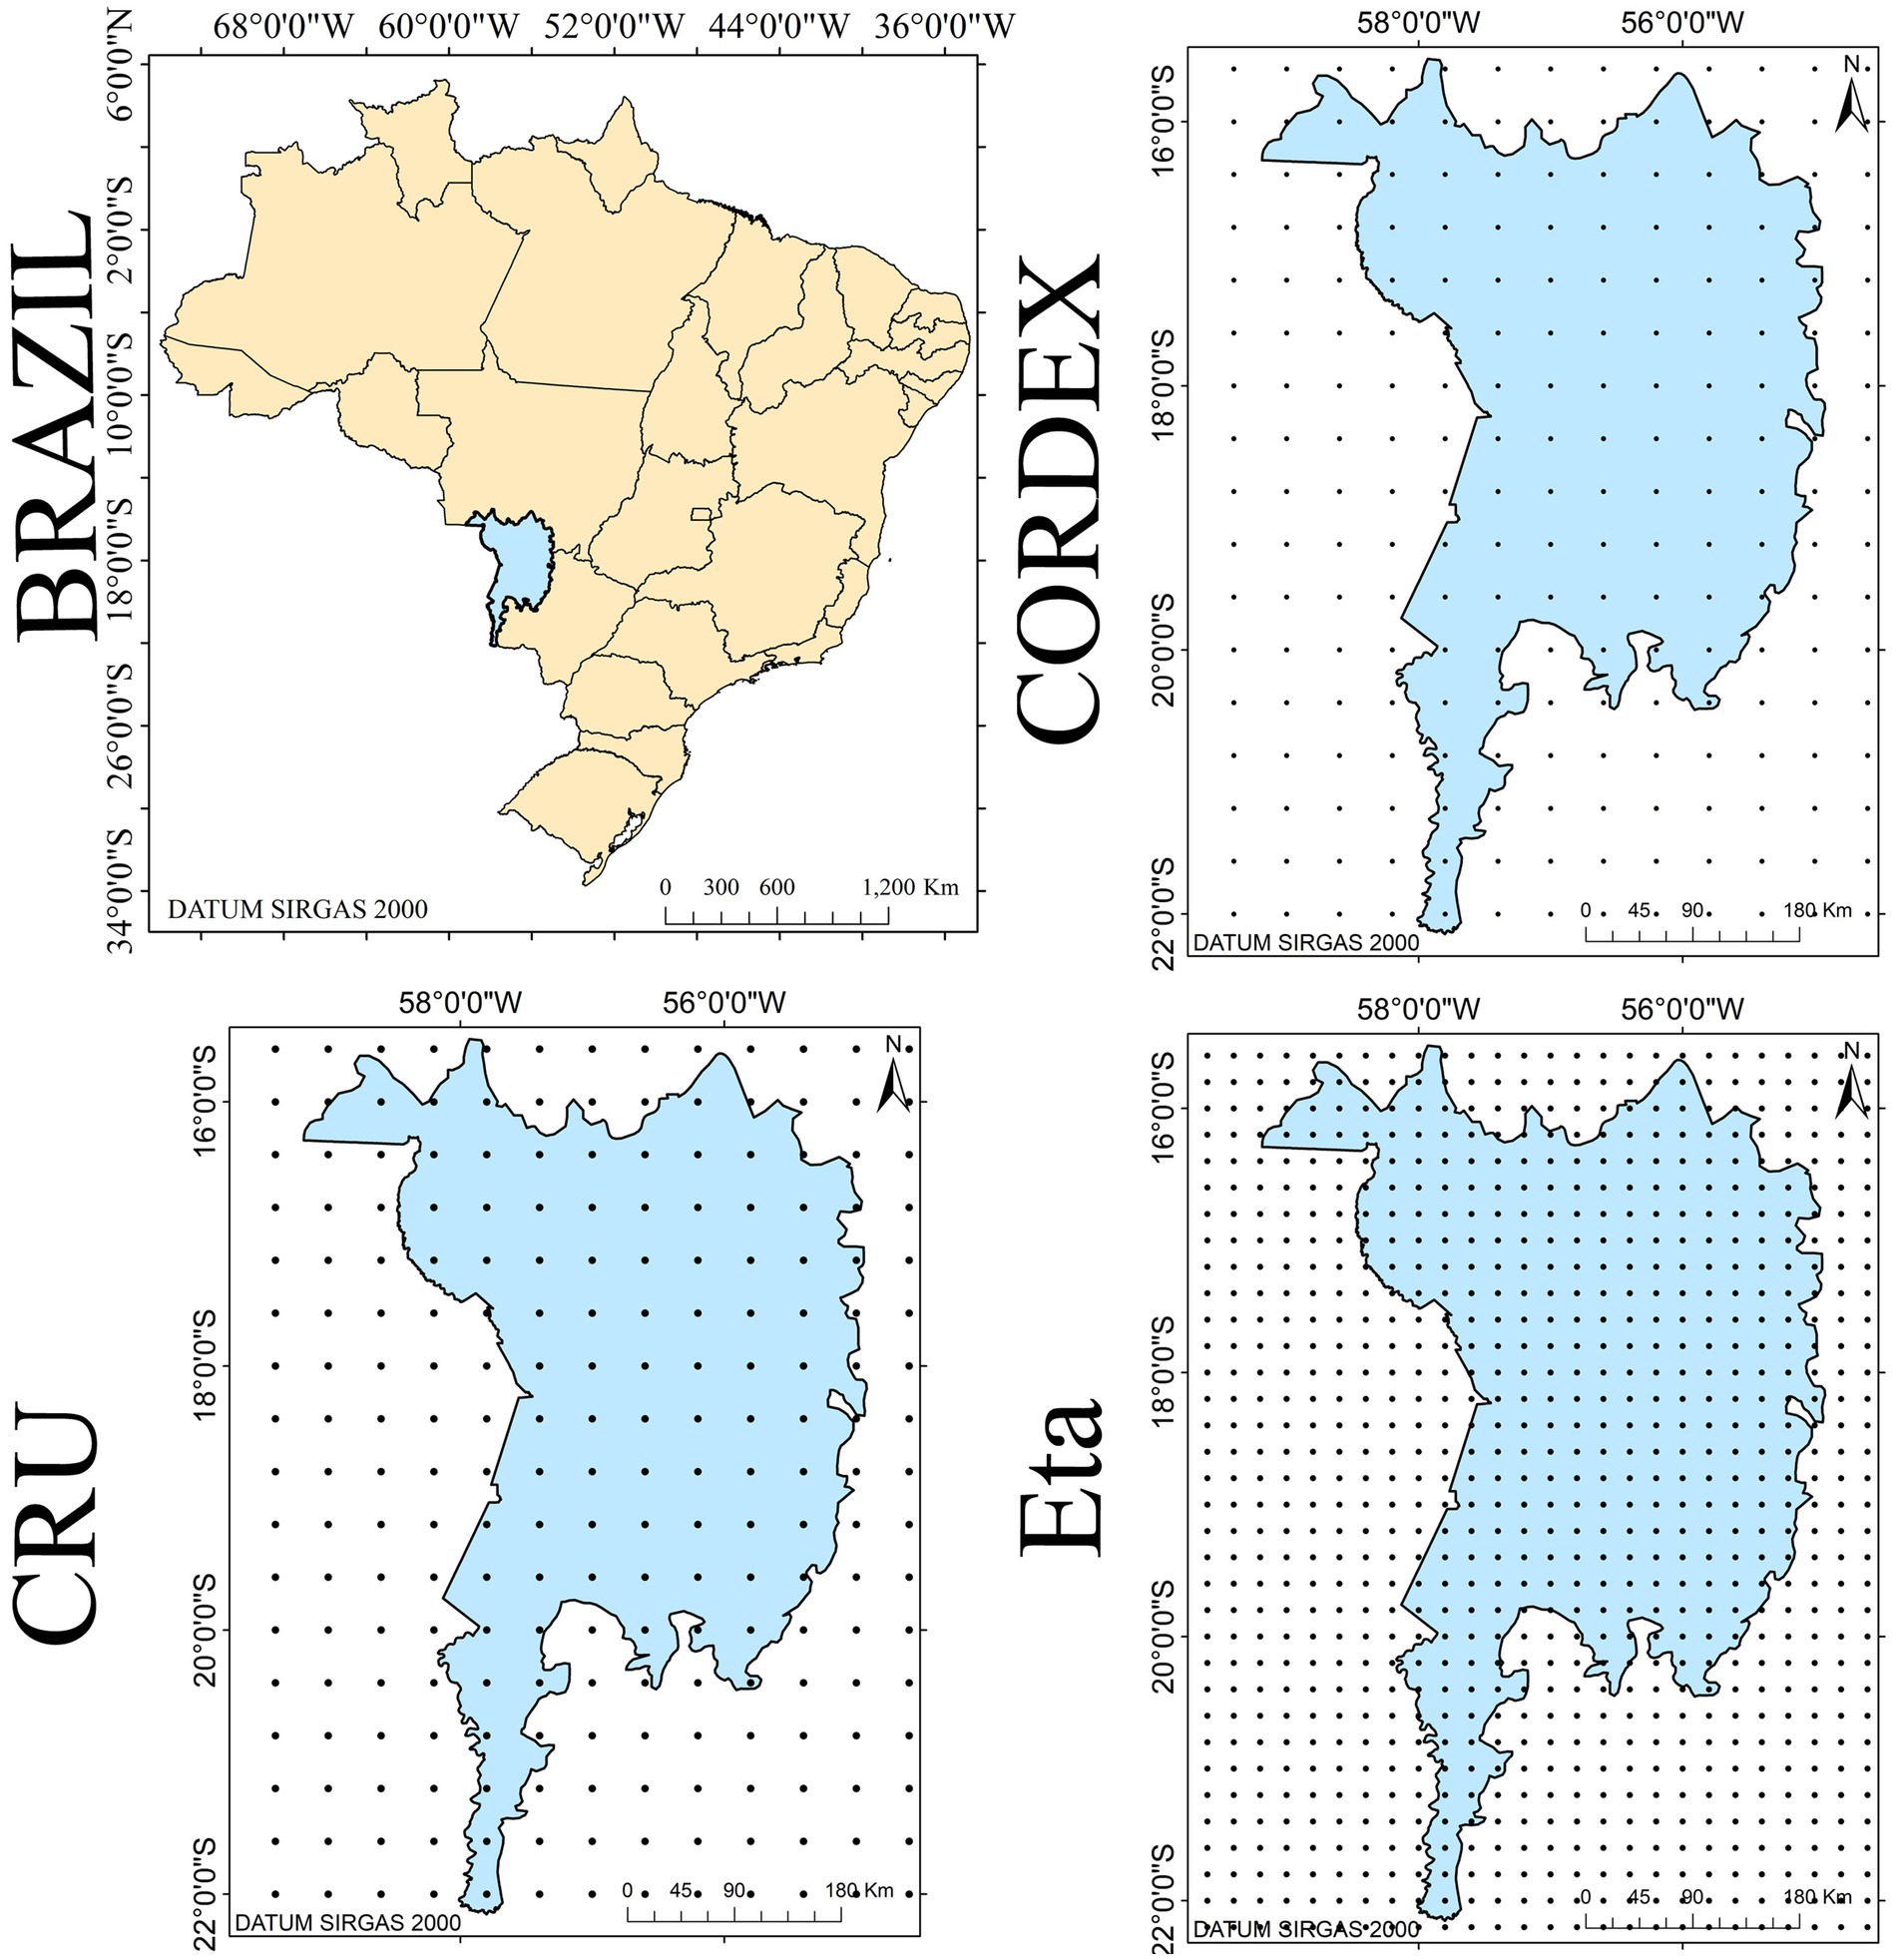
Figure 1. The location of the Pantanal biome in Brazil and grid points of the CRU, CORDEX, and Eta model simulation datasets.
Precipitation and temperature datasets
During the summer rainy season, the rivers overflow Pantanal banks and flood their lowlands, inundating as much as 70% of the floodplain (Marengo et al., 2015). Local meteorological monitoring is scarce and, when available, presents gaps that prevent its usage. Therefore, the observational dataset used in this study was retrieved from the global gridded climatology of the Climate Research Unit, CRU TSv.4.06 (Harris et al., 2014). This version of the CRU (Figure 1) dataset covers the entire Pantanal area from 1901 to 2020 with a monthly temporal resolution and 0.5o x 0.5o of horizontal resolution. In this study, the evaluation period was constrained between 1940 and 2020 to minimize uncertainties resulting from the low number of weather stations. Monthly rainfall and temperature datasets were organized in hydrological years, in which the former variable was summed, and the latter was averaged. The hydrological years will allow for better coverage of the rainy and dry seasons in the Pantanal.
Climate research unit precipitation and temperature evaluation using observational datasets
To validate the suitability of the CRU in the Pantanal, precipitation and temperature data were analyzed using the point-to-pixel method (Nogueira et al., 2018). The observational data from four surface meteorological stations (Cáceres, −16.04o S and − 57.68o W; Campo Grande, −20.4o S and − 54.7o W; Cuiabá, 15.60o S and − 56.10o W; and Nhumirim, −18.98o S and − 56.62o W) were taken as references, and the closest data points from the CRU grid were selected. No observational data were available before 1970, so the validation was conducted from 1970 to 2020. The Pearson linear coefficient of correlation (r), root mean square error (RMSE), and Kling-Gupta efficiency coefficient (KGE) were computed (Equations 1–3, respectively). The coefficient of correlation measures the strength and direction of the linear correlation between the observed and estimated values, with values closer to 1 (in absolute value) indicating a strong correlation. An RMSE close to zero indicates reasonably accurate estimates. KGE is considered a rigorous statistic because it considers the correlation, variability, and bias of data, with values closer to 1 indicating better simulation results (Gupta et al., 2009).
where O and CRU are the observed and CRU data, respectively; and are the means of the observed and estimated data, respectively; i refers to the position of the data in the series; n is the size of the series; ; and , in which and refer to the standard deviation of the estimated and observed variables, respectively.
Climate research unit bias correction
The CRU monthly precipitation data bias correction using the linear scaling method followed the procedures described by Lenderink et al. (2007) and Teutschbein and Seibert (2012). This method (Equation 4) involves correcting the bias in the estimated data using monthly correction factors.
where CRU* is the daily precipitation and temperature data with bias correction, CRU is the daily data, is the mean daily observed precipitation and temperature at the four weather stations in the reference period, and is the mean daily precipitation and temperature for the reference period. To correct the bias of the points of the CRU grid, a Thiessen polygon was developed, and every point inside was corrected with the closest Pantanal station linear factor.
Climate change projections for the Pantanal biome
We used the simulations from the downscaling by the Swedish Meteorological and Hydrological Institute (SMHI) for Atmospheric Regional Climate Model, RCA4-RCM (Popke et al., 2013), and the Eta model (Pesquero et al., 2010; Chou et al., 2012; Marengo et al., 2012). The RCA4 dataset was retrieved from the CORDEX project and is available at a horizontal resolution of 0.44o x 0.44o. The Eta model outputs have a horizontal resolution of approximately 20 km. The model outputs used in this study consisted of monthly temperature and precipitation over the historical period (baseline), 1961–2005, and the future period, 2010–2099, under two different emission scenarios, RCP4.5 and RCP8.5. RCP4.5 is an intermediary scenario with an increase in greenhouse gasses up to 2050, while RCP8.5 is an extreme scenario, with greenhouse gasses increasing until the end of the 21st century. Table 1 lists the four ensemble members of the CORDEX project and the four members of the Eta model.
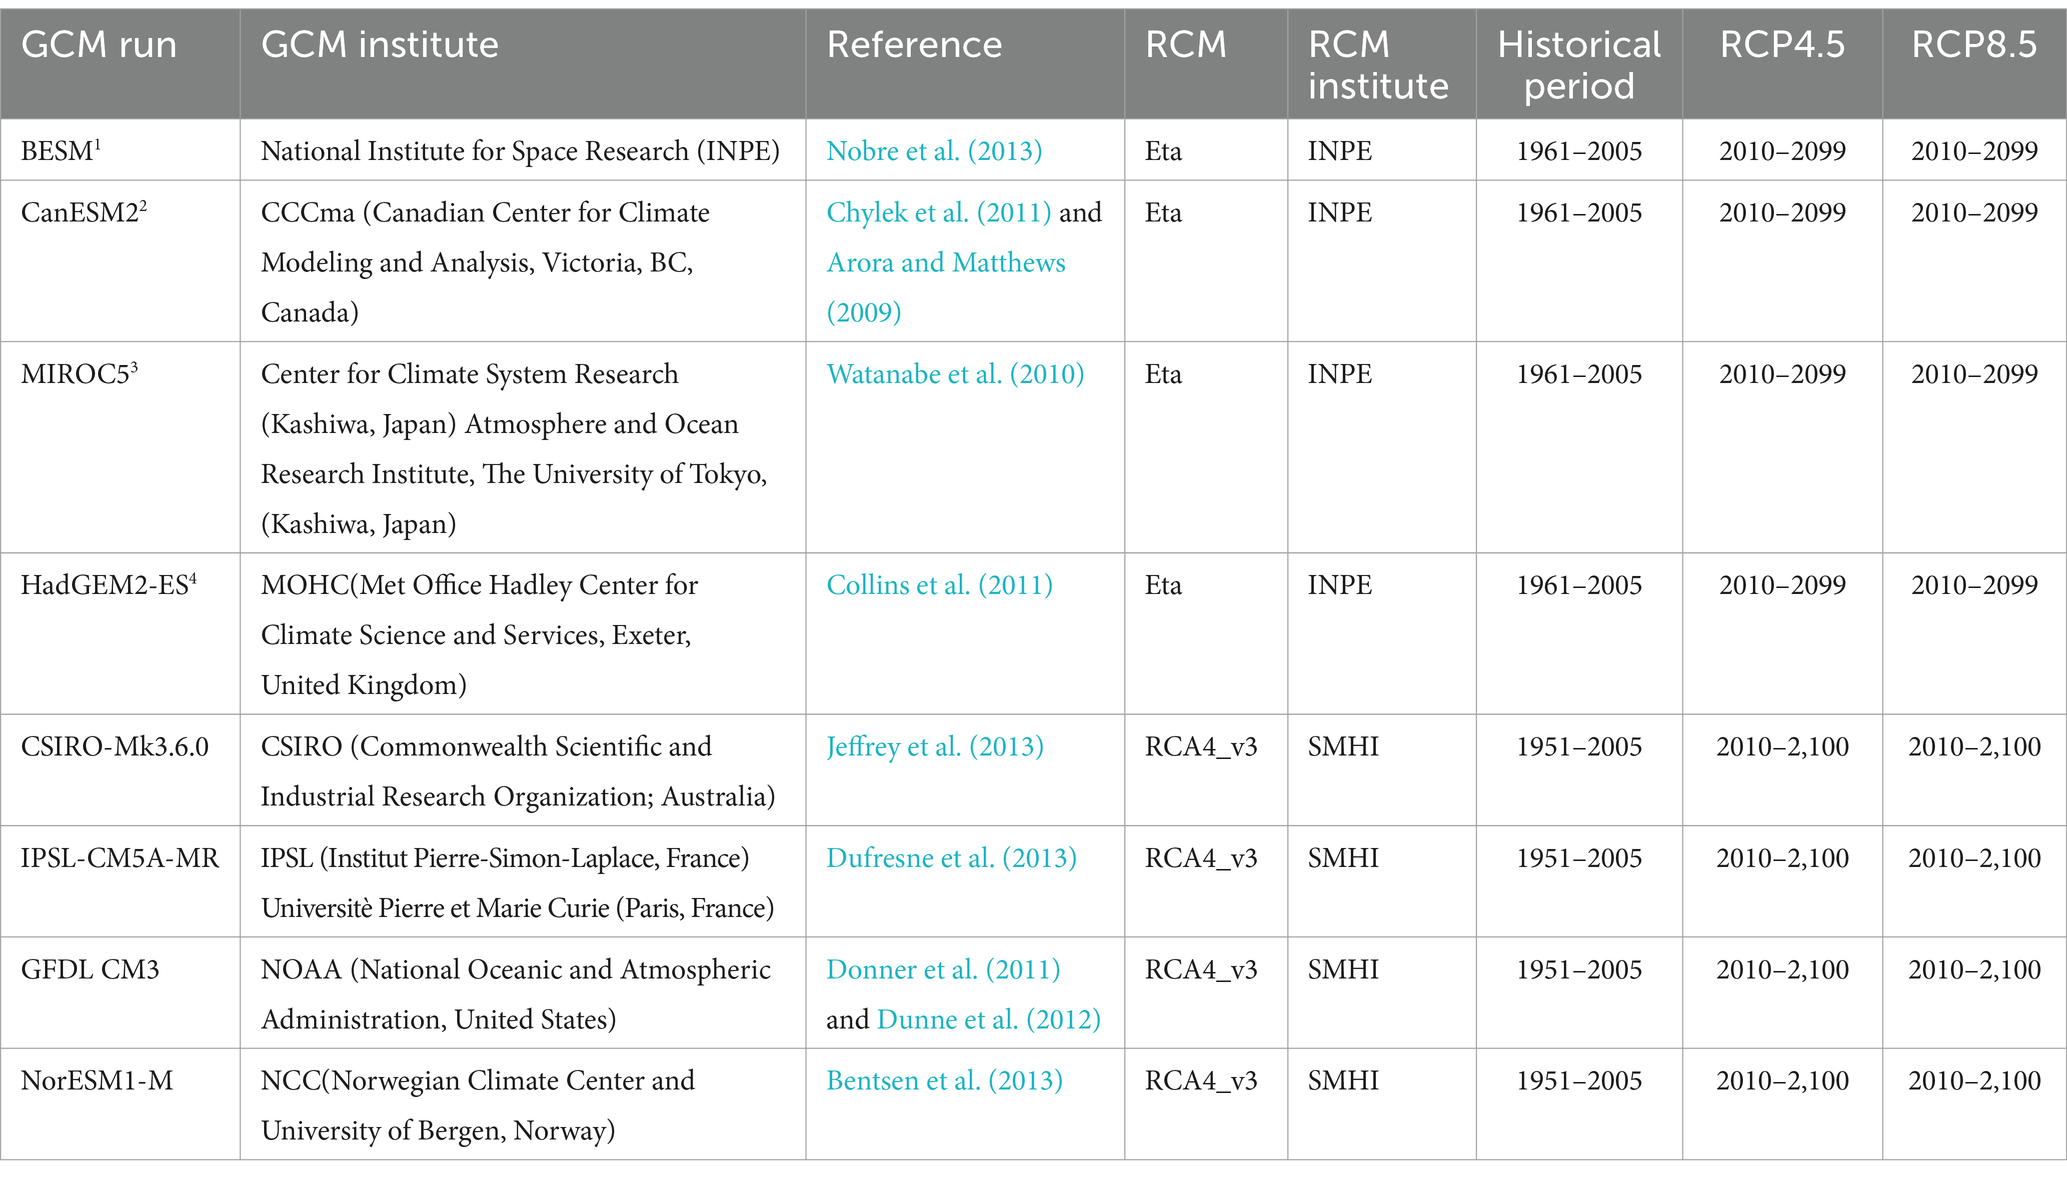
Table 1. List of GCMs and RCMs considered in this study.
To evaluate the precipitation and temperature datasets, a similar methodology was applied to the CRU datasets (Equations 5, 6). The linear scaling method for precipitation and temperature utilizes monthly correction factors based on the differences between observed and historically simulated values. The equations below outline this method:
where RCM are the monthly precipitation and temperature, respectively; , and are the means of the temperature and precipitation within the month, respectively; and ‘baseline’, ‘scenario’ and ‘CRU*’ refer to the baseline period, scenarios and CRU-corrected data, respectively.
Standardized precipitation index and SPEI calculation
The standardized precipitation index (SPI), recommended by the World Meteorological Organization and widely used for drought monitoring (Meresa et al., 2016), was developed by McKee et al. (1993) and serves as a tool for characterizing drought events. The SPI utilizes statistical analysis to examine local precipitation over a specific time scale. This study aggregated monthly datasets into hydrological years (Oct-Sep) in the Pantanal region, and a cumulative probability distribution was fitted. The gamma probability density function (PDF) with two parameters was fitted using the maximum likelihood approach (McKee et al., 1993; Coelho et al., 2014), and its adherence was tested through the nonparametric Anderson–Darling test (Anderson and Darling, 1954). To determine the SPI, we standardized the distribution using an equiprobability transformation from the cumulative nonexceedance probability to the standard normal PDF (μ = 0; σ2 = 1). Finally, the SPI was calculated as the Z value, reflecting the standardized deviation from the mean.
The standardized precipitation evapotranspiration index (SPEI) (Vicente-Serrano et al., 2010a) enhances the sensitivity of drought assessments by incorporating atmospheric demand. Unlike the SPI, the SPEI considers both precipitation (P) and potential evapotranspiration (ETp), resulting in the P-ETp long-term series as its basis. Including ETp in the SPEI computation has proven beneficial for improving drought identification (Vicente-Serrano et al., 2010b; Silva and Mello, 2020). The ETp was calculated using the Thornthwaite method, which requires only the air temperature as input. Studies by Begueria et al. (2014) and McEvoy et al. (2012) have demonstrated similar results when applying both the Thornthwaite and Penman–Monteith methods for SPEI calculation, thereby justifying the former method, particularly in regions with limited climate variable monitoring.
The monthly P-ETp values were also organized into hydrological years, and the empirical nonexceedance frequencies were fitted with the generalized extreme value probability density function (GEV). The next steps are the same as those applied for the SPI calculation.
The severity of drought events is assessed based on SPI and SPEI values, following the classification provided by the World Meteorological Organization (WMO, 2016). Values below −1 indicate intense drought, and we categorized them as follows: (i) moderately dry: −1.0 to −1.5; (ii) severely dry: −1.5 to −2.0; and (iii) extremely dry: < −2.0. The spatial distribution of drought episodes in the Pantanal region was determined by employing ordinary kriging to map the SPI12 and SPEI12 using observed data from 1940 to 2020 as well as downscaled simulations from the Eta and CORDEX for the period 2010–2099. This approach enables a better understanding of the geographic patterns of drought occurrences in the study area and identifies areas more susceptible to droughts.
Results
Evaluation of precipitation and temperature data estimated by CRU in the Pantanal region
A validation process was conducted to compare the climatological data from the CRU with the observed data (Figure 2). Due to the limited number of meteorological stations, the validation of the CRU data was restricted to four stations. The CRU dataset demonstrated the ability to capture the region’s seasonality, although it overestimated precipitation. On average, CRU overestimated precipitation by 12.1 and 7.5% in the wet months of January and December, respectively, and by 30.6 and 19.8% during the dry months of July and August, respectively. Similar findings were reported by Prado et al. (2012), who reported that CRU adequately represents summer precipitation in the central region of Brazil and exhibits sensitivity to meteorological phenomena such as the South Atlantic Convergence Zone. They also noted that CRU tends to overestimate precipitation by up to 80 mm between December and February in central Brazil.
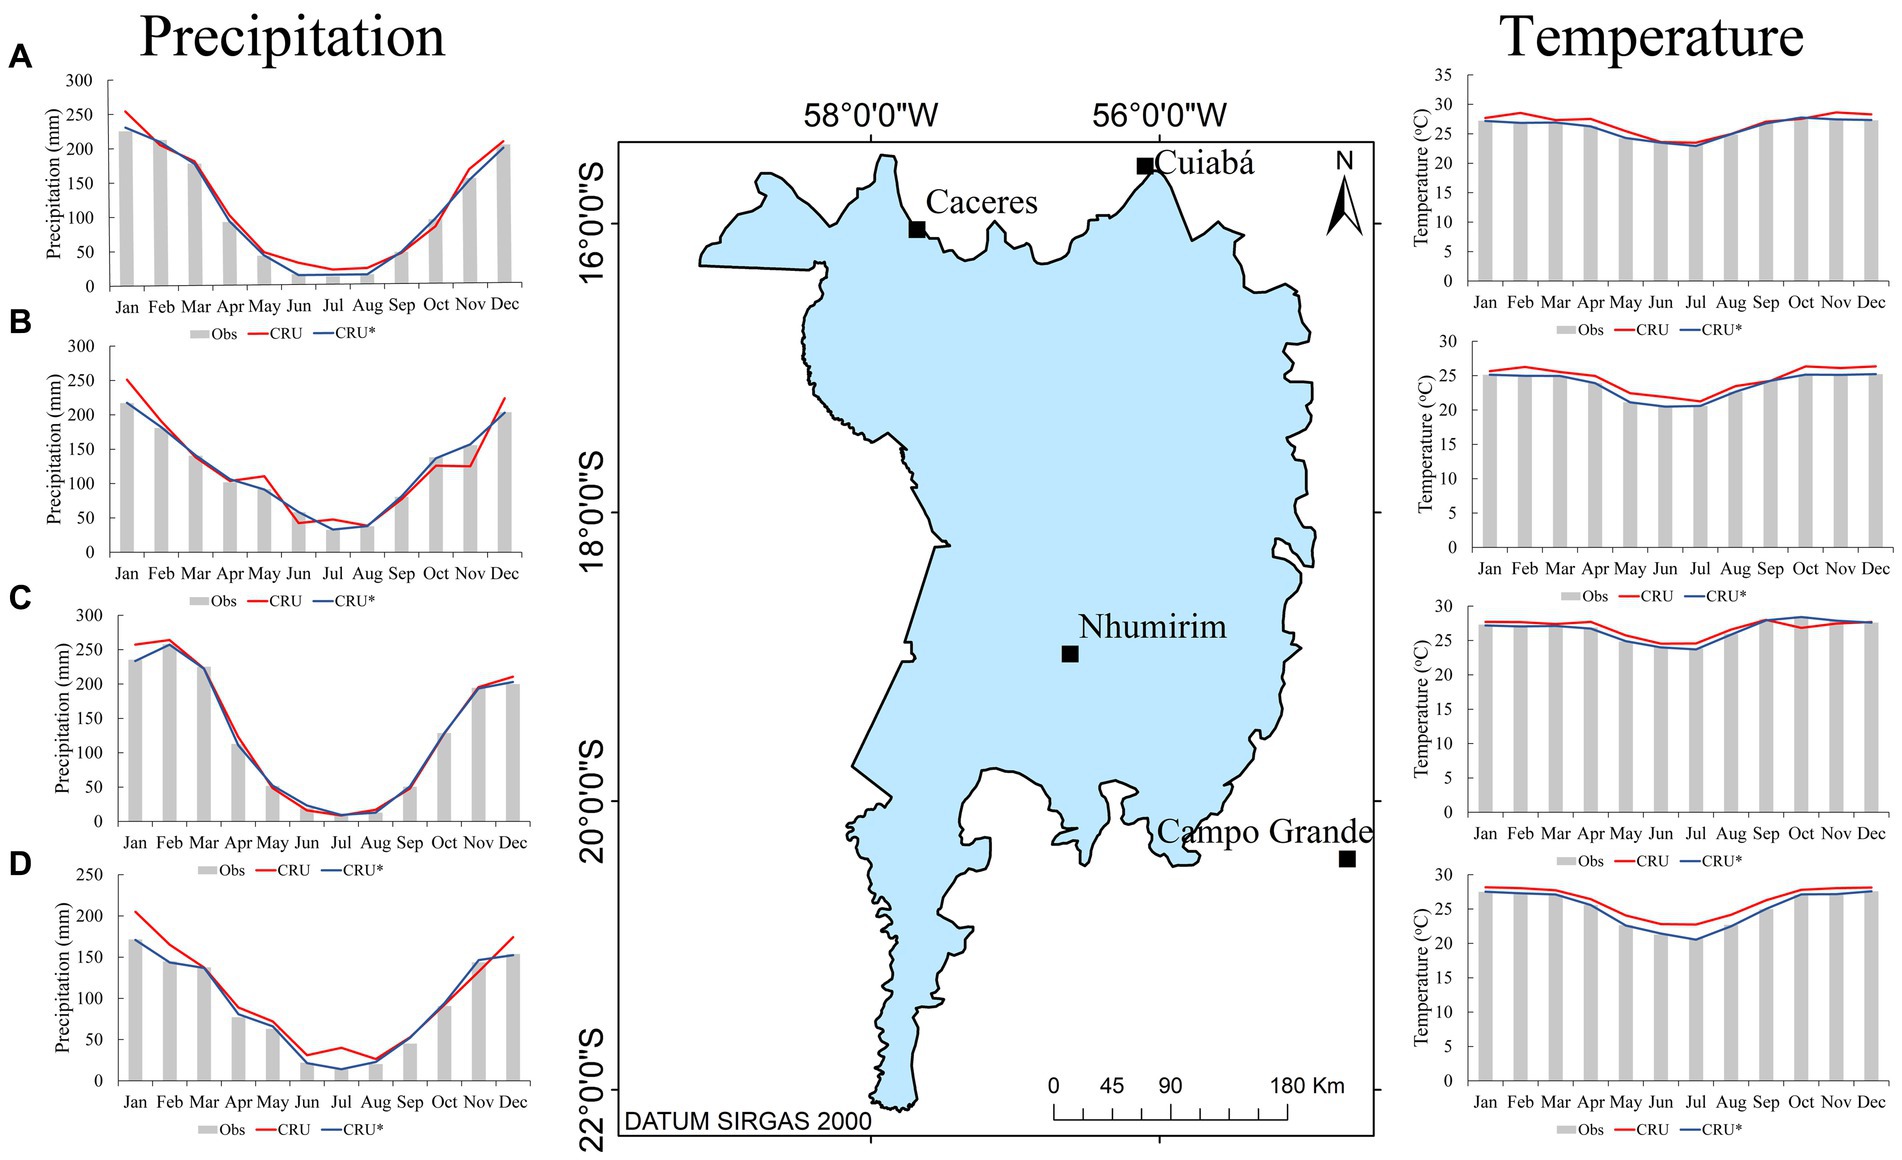
Figure 2. CRU performance for four meteorological stations in the Pantanal region and neighborhoods of (A) Cáceres, (B) Cuiabá, (C) Campo Grande, and (D) Nhumirim (CRU: average data; CRU*: average data bias corrected).
Upon applying bias removal techniques to the CRU data, improvements were observed in its performance compared to the observed data. The coefficient of correlation (r) increased from 0.807 to 0.822, the root mean square error (RMSE) decreased from 63.9 mm to 53.4 mm, and the Kling-Gupta efficiency (KGE) improved from 0.104 to 0.126. These findings align with those reported by Marengo et al. (2016) in their investigation of temperature trends in Brazil using the CRU dataset. Notably, significant improvements in the performance metrics were observed, including an increase in the coefficient of correlation (from 0.926 to 0.962), a decrease in the root mean square error (from 4.286 to 4.022), and a substantial increase in the Kling-Gupta efficiency (from 0.21 to 0.41).
In the 1970–2020 period, the CRU dataset slightly overestimated temperatures in the Pantanal region. The greatest discrepancies were observed from May to July, with average overestimations of 4.9, 3.8, and 4.7%, respectively.
Drought episodes in the Pantanal region
Figure 3 displays the annual maps of the SPI12 (Standardized Precipitation Index) and SPEI12 (Standardized Precipitation Evapotranspiration Index) for the hydrological years spanning from 1940/1941 to 2019/2020, considering only negative values, i.e., occurrences of droughts. The SPI12 and SPEI12 successfully captured the severity of these drought events (Figure 3). Specifically, the hydrological years 1961/1962 (SPI12 = −1.72; SPEI12 = −1.50), 1963/1964 (SPI12 = −1.67; SPEI12 = −1.29), 1966/1967 (SPI12 = −1.76; SPEI12 = −1.32), and 1968/1969 (SPI12 = −0.95; SPEI12 = −1.36) exhibited the driest conditions over the studied period, which is consistent with the results of the Alho and Silva (2012) hydrological study. Furthermore, they noted that from 1973/1974 to 1988/1989, the Pantanal region experienced multiple flood events, indicating that no droughts occurred during this period.
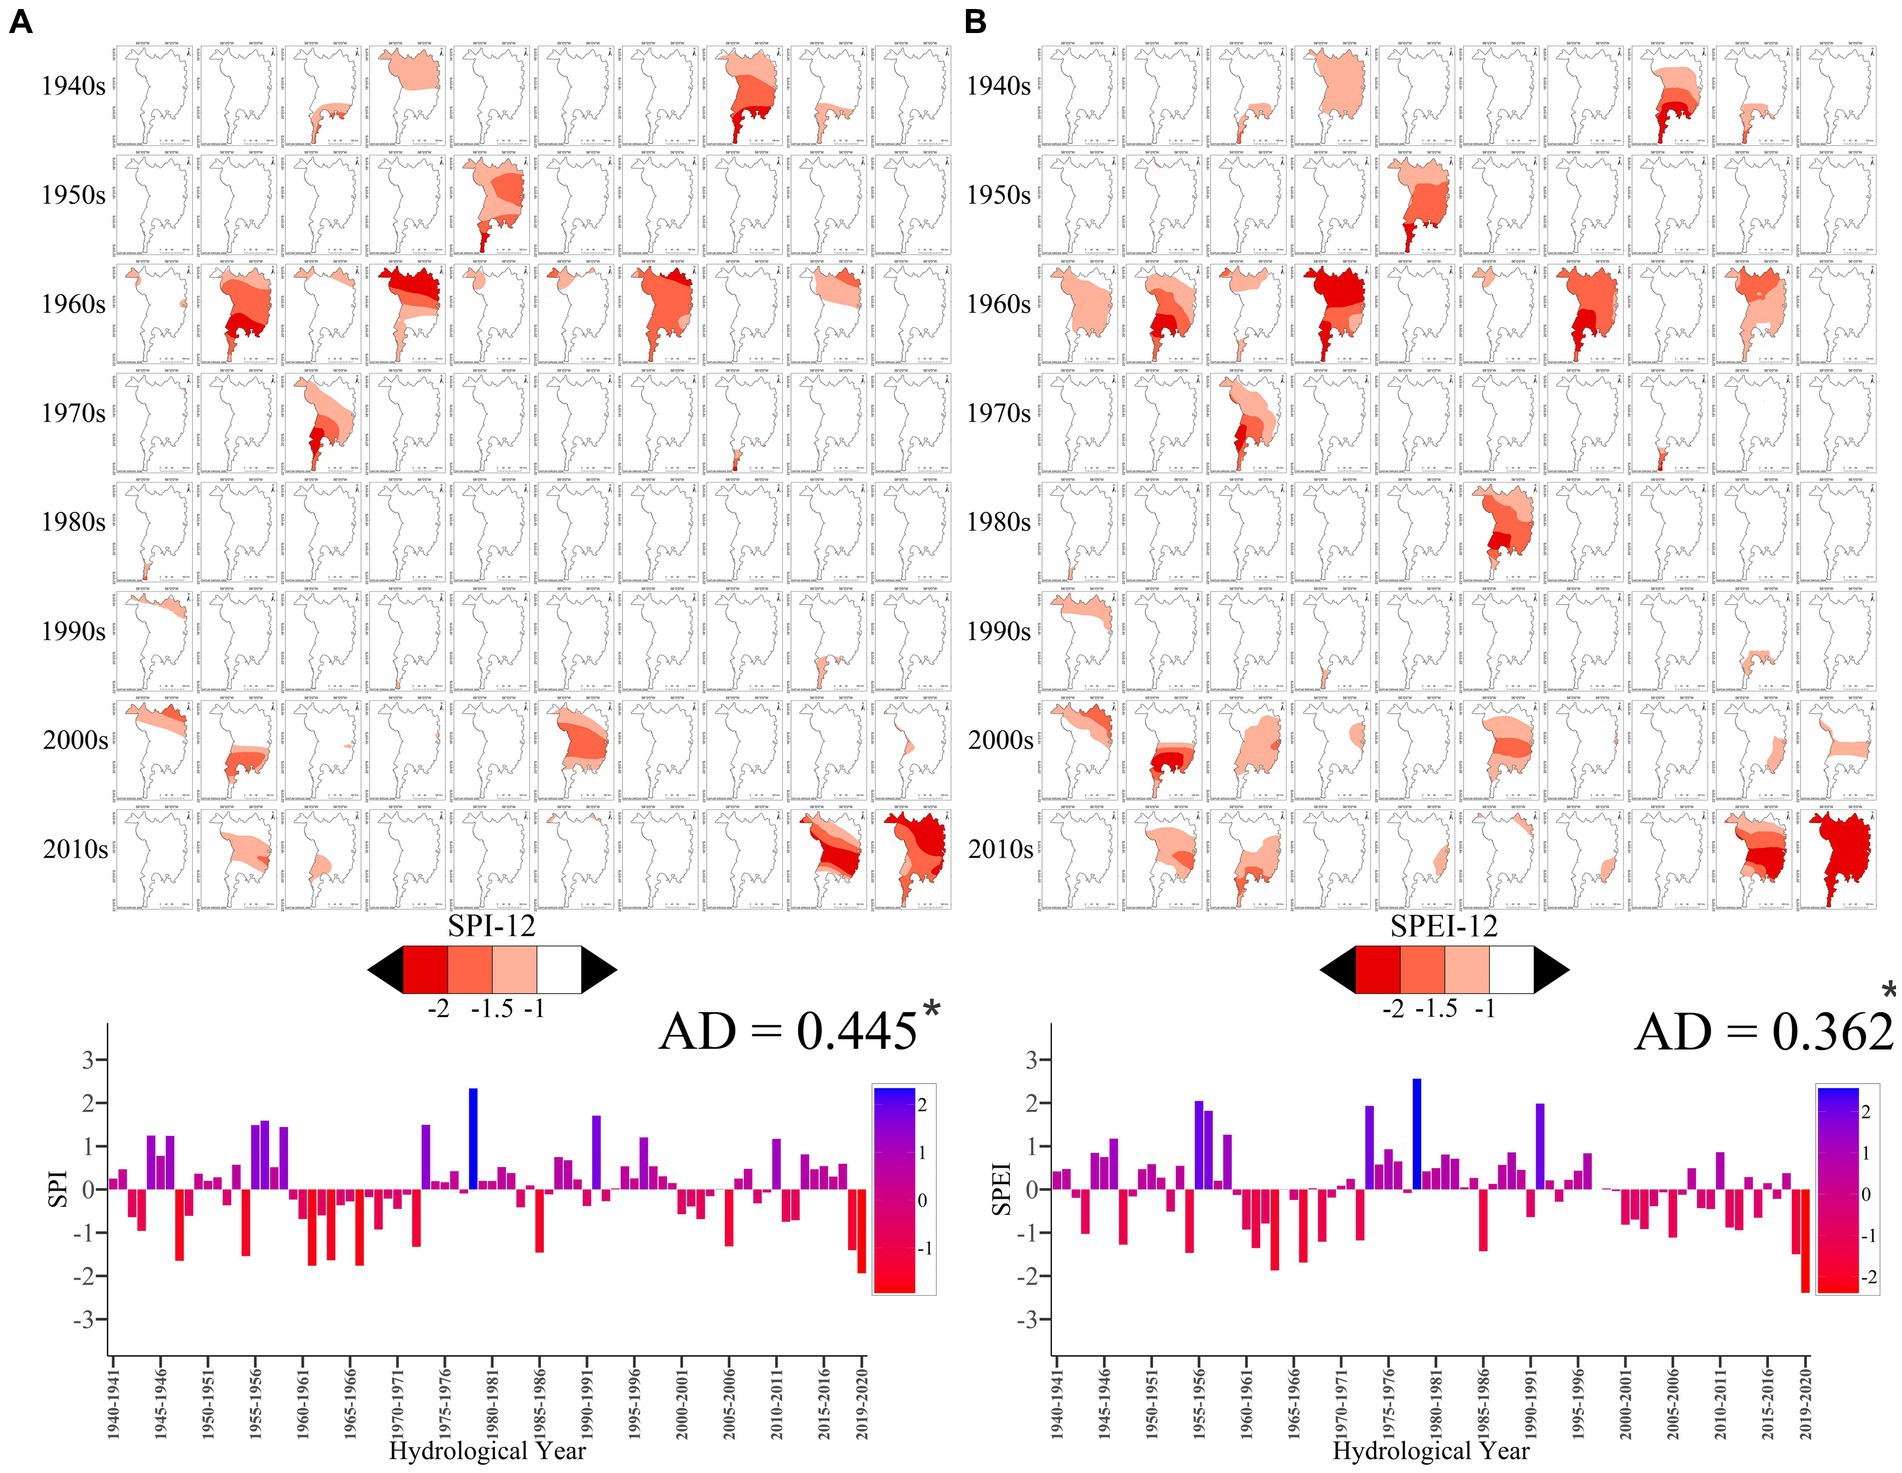
Figure 3. Drought episodes in the Pantanal region during the historical period using the (A) SPI12 and (B) SPEI12.
The hydrological year 2019/2020 (SPI12 = −1.95; SPEI12 = −2.65) stood out as the driest year examined in this study, with occurrences of extreme drought events being rare across the time series. Similarly, during the hydrological year 1964/1965 (SPI12 = −1.68, SPEI12 = −2.07), severe and extreme droughts prevailed throughout almost the entire Pantanal region. In both hydrological years, the magnitude of the SPEI surpassed that of the SPI, indicating that the combination of limited rainfall, higher temperatures, and subsequently heightened atmospheric water demand markedly contributed to the dryness observed during these periods.
The performance of the RCMs in simulating precipitation and evapotranspiration during hydrological years in the Pantanal region
A validation process was conducted to compare the CRU with the regional climate model ensembles (Eta and CORDEX) (Figure 4). A Thiessen polygon technique was applied, and four different areas were designed. The Eta and CORDEX points inside each of these areas were compared with the closest CRU location, and the mean values were calculated. The Eta Ensemble could not capture the region’s seasonality, underestimating precipitation through the wet season (Oct- March) and overestimating precipitation through the dry season (Apr- Sep). By applying bias removal techniques to the ensembles, a more remarkable performance was obtained compared to the CRU data. The coefficient of correlation (r) increased from 0.028 to 0.546 (Eta) and from 0.776 to 0.793 (CORDEX); the root mean square error (RMSE) decreased from 104.9 mm to 93 mm (Eta) and from 97.8 mm to 49.6 mm (CORDEX); and the Kling-Gupta efficiency (KGE) improved from −0.38 to 0.40 (Eta) and from −0.9 to 0.01 (CORDEX).
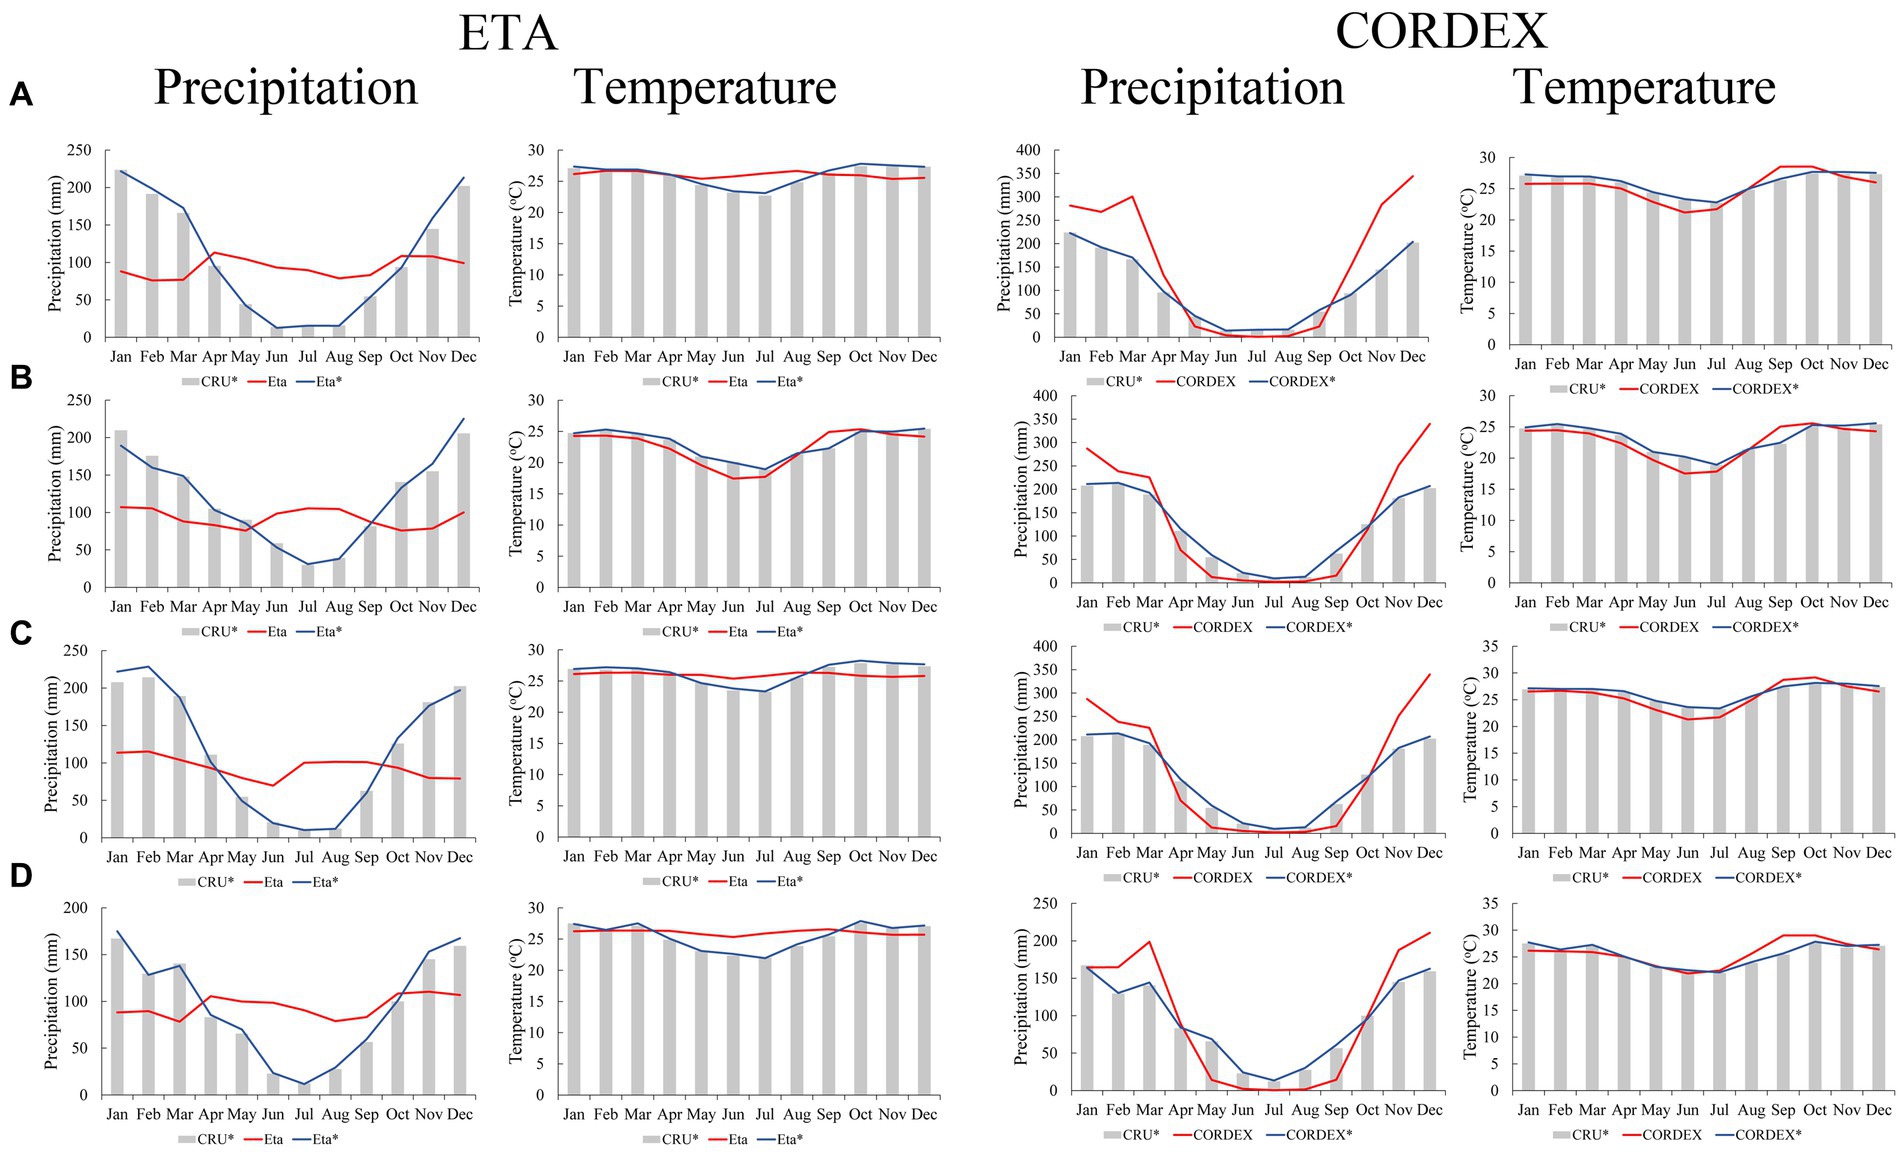
Figure 4. Eta and CORDEX ensemble performances compared to the CRU data in the Pantanal region and surroundings (A) Caceres (B) Campo Grande (C) Cuiaba (D) Nhumirim (*: bias corrected).
Unlike precipitation, the deviation of temperature from the CRU dataset is not pronounced. The Eta ensemble underestimates the temperature from October to April (reaching a maximum of −5.9% in December) and overestimates it from May to August (reaching a maximum of 9.2% in July). Similarly, the CORDEX ensemble underestimates the temperature from November to July (reaching a maximum of −8.8% in June) and overestimates it from August to October (reaching a maximum of 8.9% in September). After correction, both ensembles showed slight variations (~ 1%). Additionally, the coefficient of correlation (r) increased from an average of 0.24 to 0.60 for Eta and from 0.77 to 0.85 for CORDEX. The root mean square error (RMSE) decreased from 2.9°C to 2.3°C for Eta and from 1.7°C to 1.0°C for CORDEX, and the Kling-Gupta efficiency (KGE) improved from −0.60 to −0.56 for Eta and from −0.28 to 0.04 for CORDEX.
Projections of droughts in the Pantanal region
Figure 5 presents the projected SPI12 in the Pantanal region using the Eta RCM ensemble. The simulations under RCP4.5 for a period of 90 years (Figure 5A) indicate the absence of extreme droughts (SPI < −2). The Eta ensemble has proven to be a valuable tool in various climate change studies across South America. Chou et al. (2014b) assessed climate change projections in the region using Eta-HadGEM2-ES, Eta-MIROC5, and their ensemble, providing relevant insights for the Pantanal region. Eta-MIROC5 projected a reduction in precipitation due to the weakening activity of the South Atlantic Convergence Zone, resulting in drier summer months. In contrast, Eta-HadGEM2-ES showed a lower rainfall concentration throughout the year, resulting in less rainfall in the wet season and an increase in the dry season. Additionally, Silva et al. (2020), investigating drought projections in Minas Gerais, reported that Eta-CanESM simulations indicated a decrease in precipitation toward the end of the century.
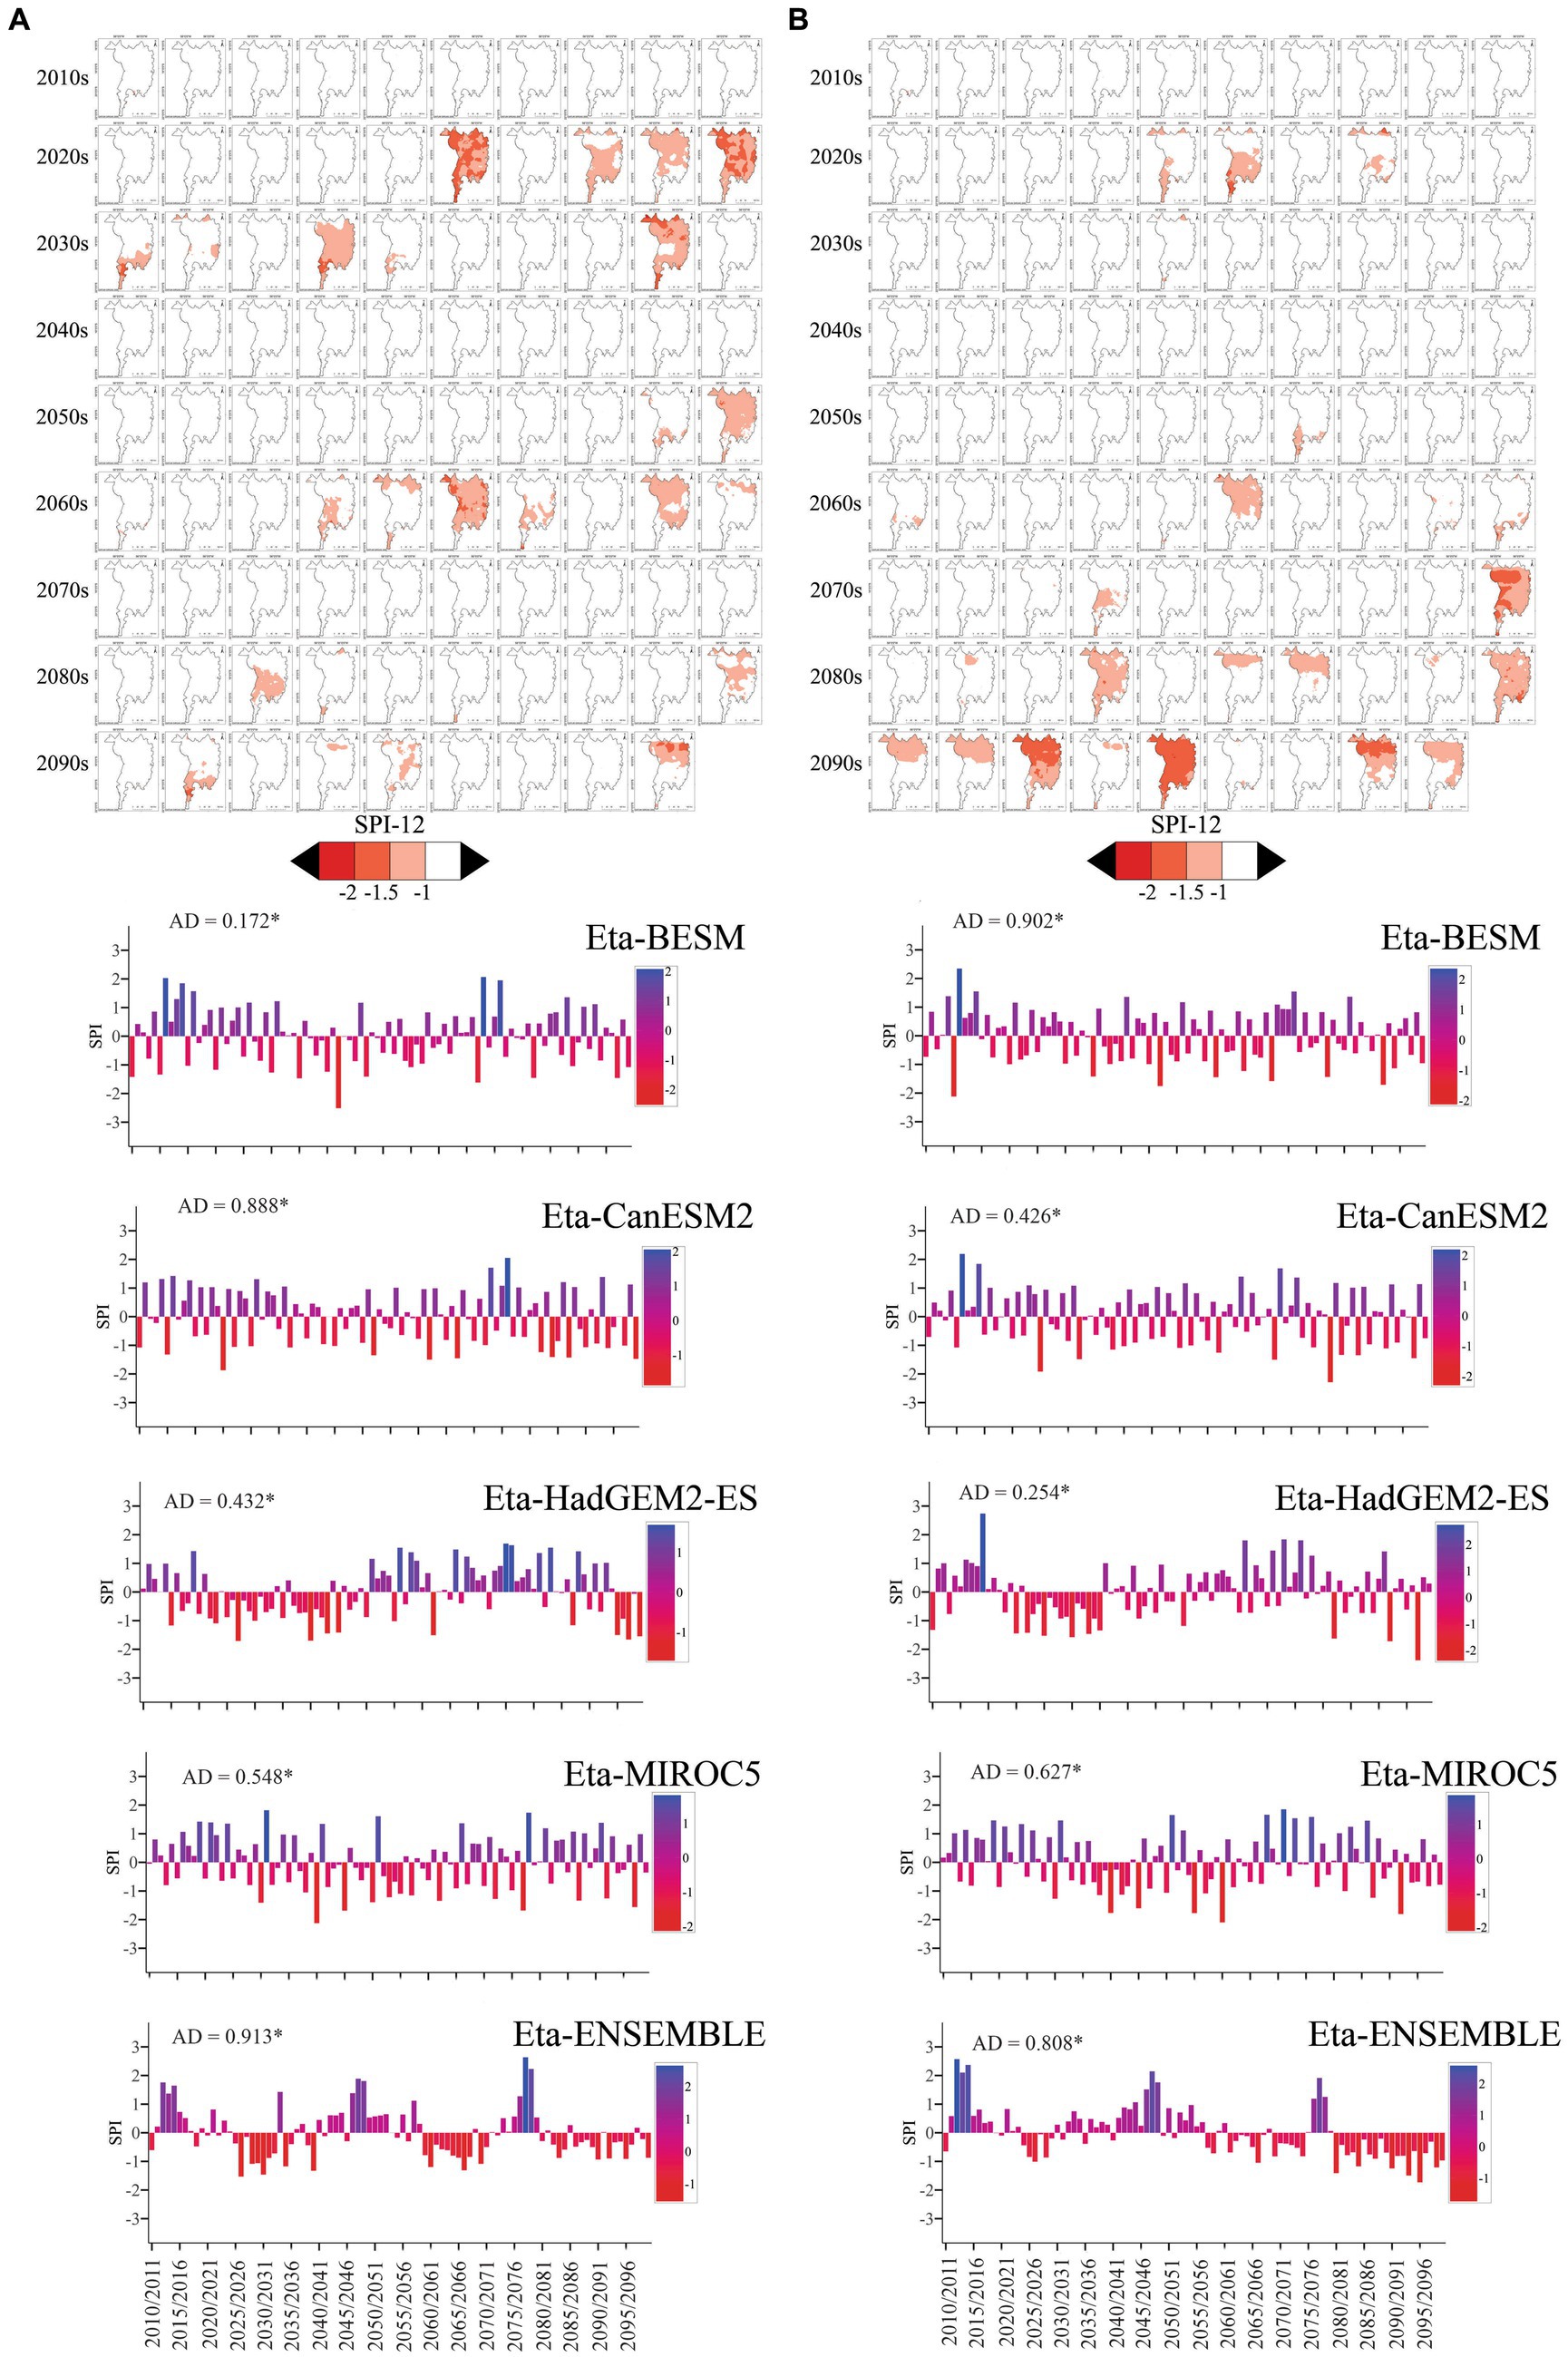
Figure 5. Annual SPI (SPI12) projected by the Eta ensemble for the RCP4.5 (A) and RCP8.5 (B) scenarios and the null statistics of the Anderson-Darling test (*Ho hypothesis significant at 5% of probability).
Figure 5A illustrates the average SPI12 values for each model and the ensemble in the Pantanal. Notably, Eta-HadGEM exhibits clustering of consecutive dry years in the 2020s and 2030s, leading to consecutive drought years. Conversely, Eta-BESM, Eta-CanESM, and Eta-MIROC depict alternating dry and wet years. As a result, the ensemble fails to capture the occurrence of extreme droughts across the entire 21st century.
In the context of RCP8.5 (Figure 5B), the projections indicate the absence of extreme droughts (SPI < −2). However, in contrast to RCP4.5, severe drought events are primarily concentrated in the 2090s. This pattern can be attributed to the reduction in rainfall toward the end of the century, particularly according to the Eta-BESM and Eta-CanESM models, which predict the emergence of extreme droughts after the 2080s, as reported by Chou et al. (2014a) and Silva et al. (2020).
Based on the CORDEX, several extreme drought events were identified (Figure 6). In the RCP4.5 scenario (Figure 6A), the simulations spanned until the end of the 21st century, with an extensive projection of an extreme event in the Pantanal in 2010/2011 (SPI12 = −2.87). Droughts were also observed in certain areas in the 2019/2020, 2034/2035, 2052/2053, and 2081/2082 hydrological years (SPI12 = −0.63, SPI12 = −1.82, SPI12 = −1.45, SPI12 = −1.22, respectively). In the RCP8.5 scenario, severe droughts are projected to occur between 2010 and 2040. An extreme event was projected in 2035/2036 (SPI = −2.55), along with localized droughts in the Pantanal region during 2012/2013, 2016/2017, and 2033/2034 (SPI12 = −1.75, SPI12 = −1.53, SPI12 = −1.42). The CORDEX-IPSL and CORDEX-GFDL simulations played a crucial role in understanding the behavior of the ensemble, as they consistently projected multiple consecutive drought events until the 2040s.
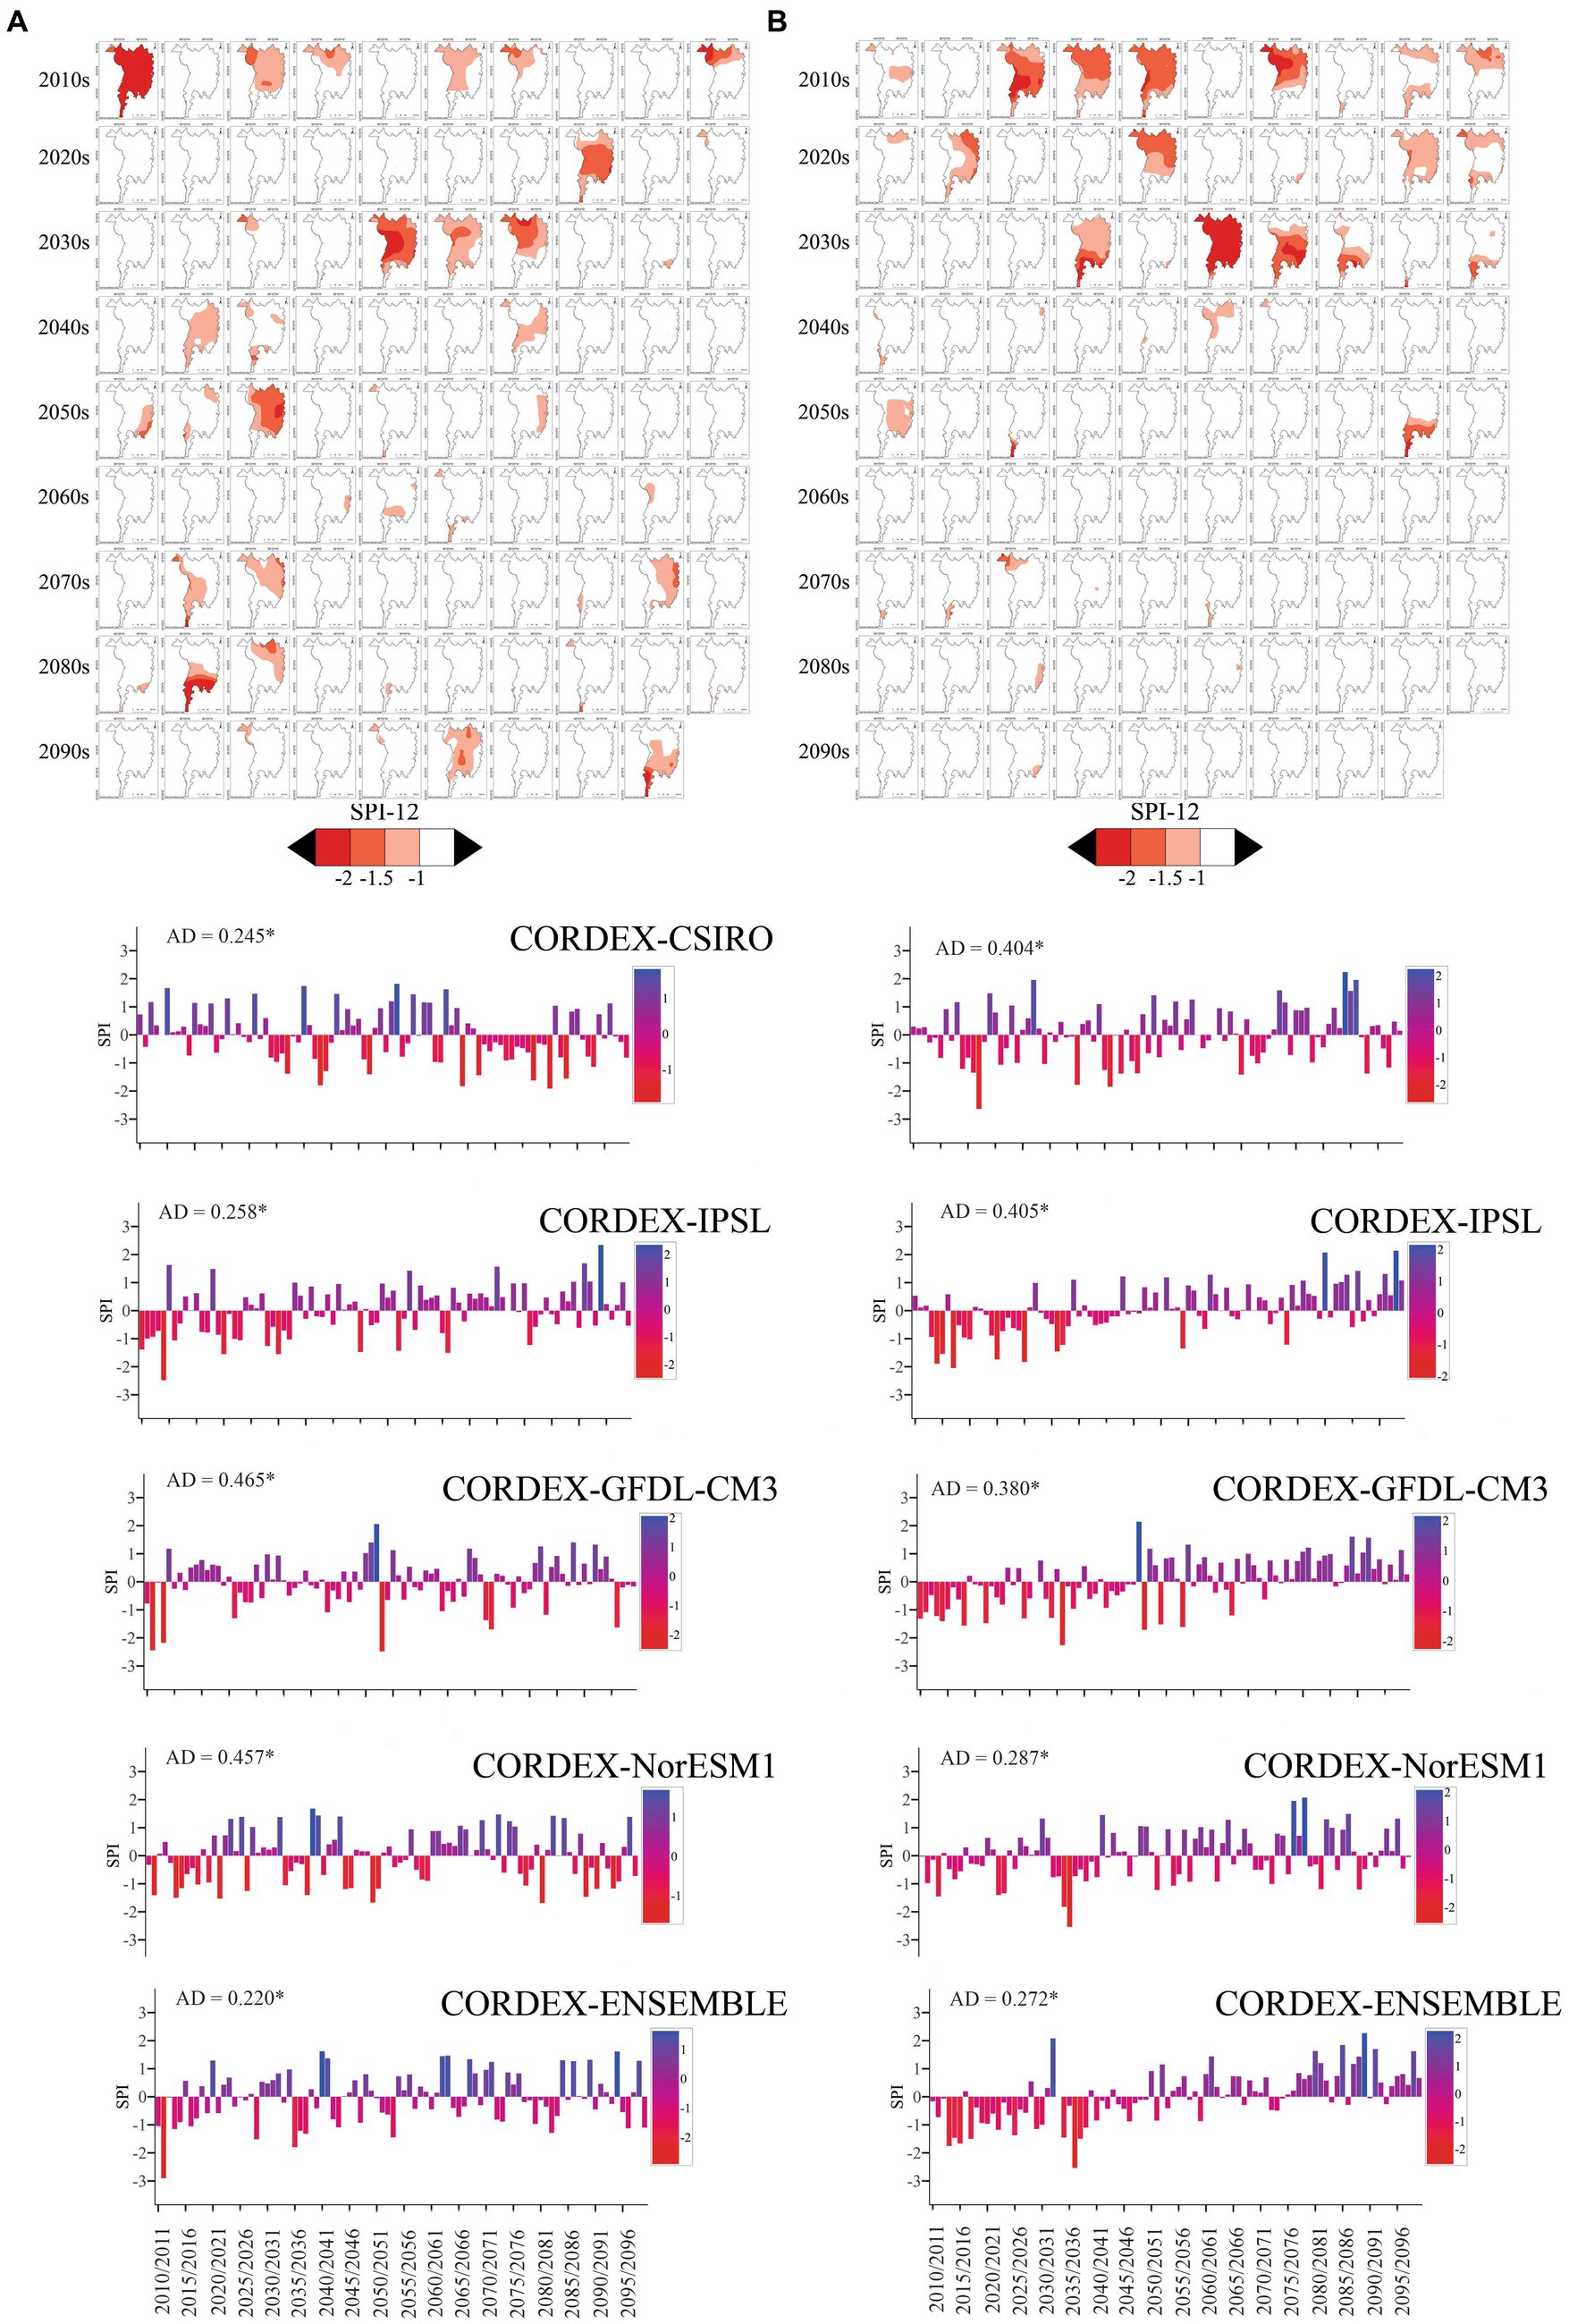
Figure 6. Annual SPI (SPI12) projected by the CORDEX ensemble for the RCP4.5 (A) and RCP8.5 (B) scenarios and the null statistics of the Anderson-Darling test (*Ho hyphotese significant at 5% of probaility).
The integration of potential evapotranspiration into the drought index significantly improved the performance of the Eta ensemble, enabling it to simulate extreme droughts accurately (Figure 7). For the RCP4.5 scenario, severe drought events were projected between 1940 and 2099, comparable to the 2019/2020 drought, in 2045/2046, 2095/2096, and 2097/2098 (SPEI12 = −1.87, SPEI12 = −2.66, SPEI = −2.36, respectively). Under RCP8.5, the majority of severe drought events were projected between the 2080s and 2090s, including three extreme droughts in 2092/2093, 2095/2096, and 2097/2098 (SPEI12 = −2.83, SPEI12 = −2.04, and SPEI12 = −2.85, respectively). Unlike those of SPI12, the SPEI of the Eta-BESM, Eta-CanESM2, Eta-HadGEM2-ES, and Eta-MIROC5 models did not significantly differ, as severe droughts were consistently projected in the latter half of the 21st century for both the RCP4.5 and RCP8.5 scenarios (Figures 7A,B).
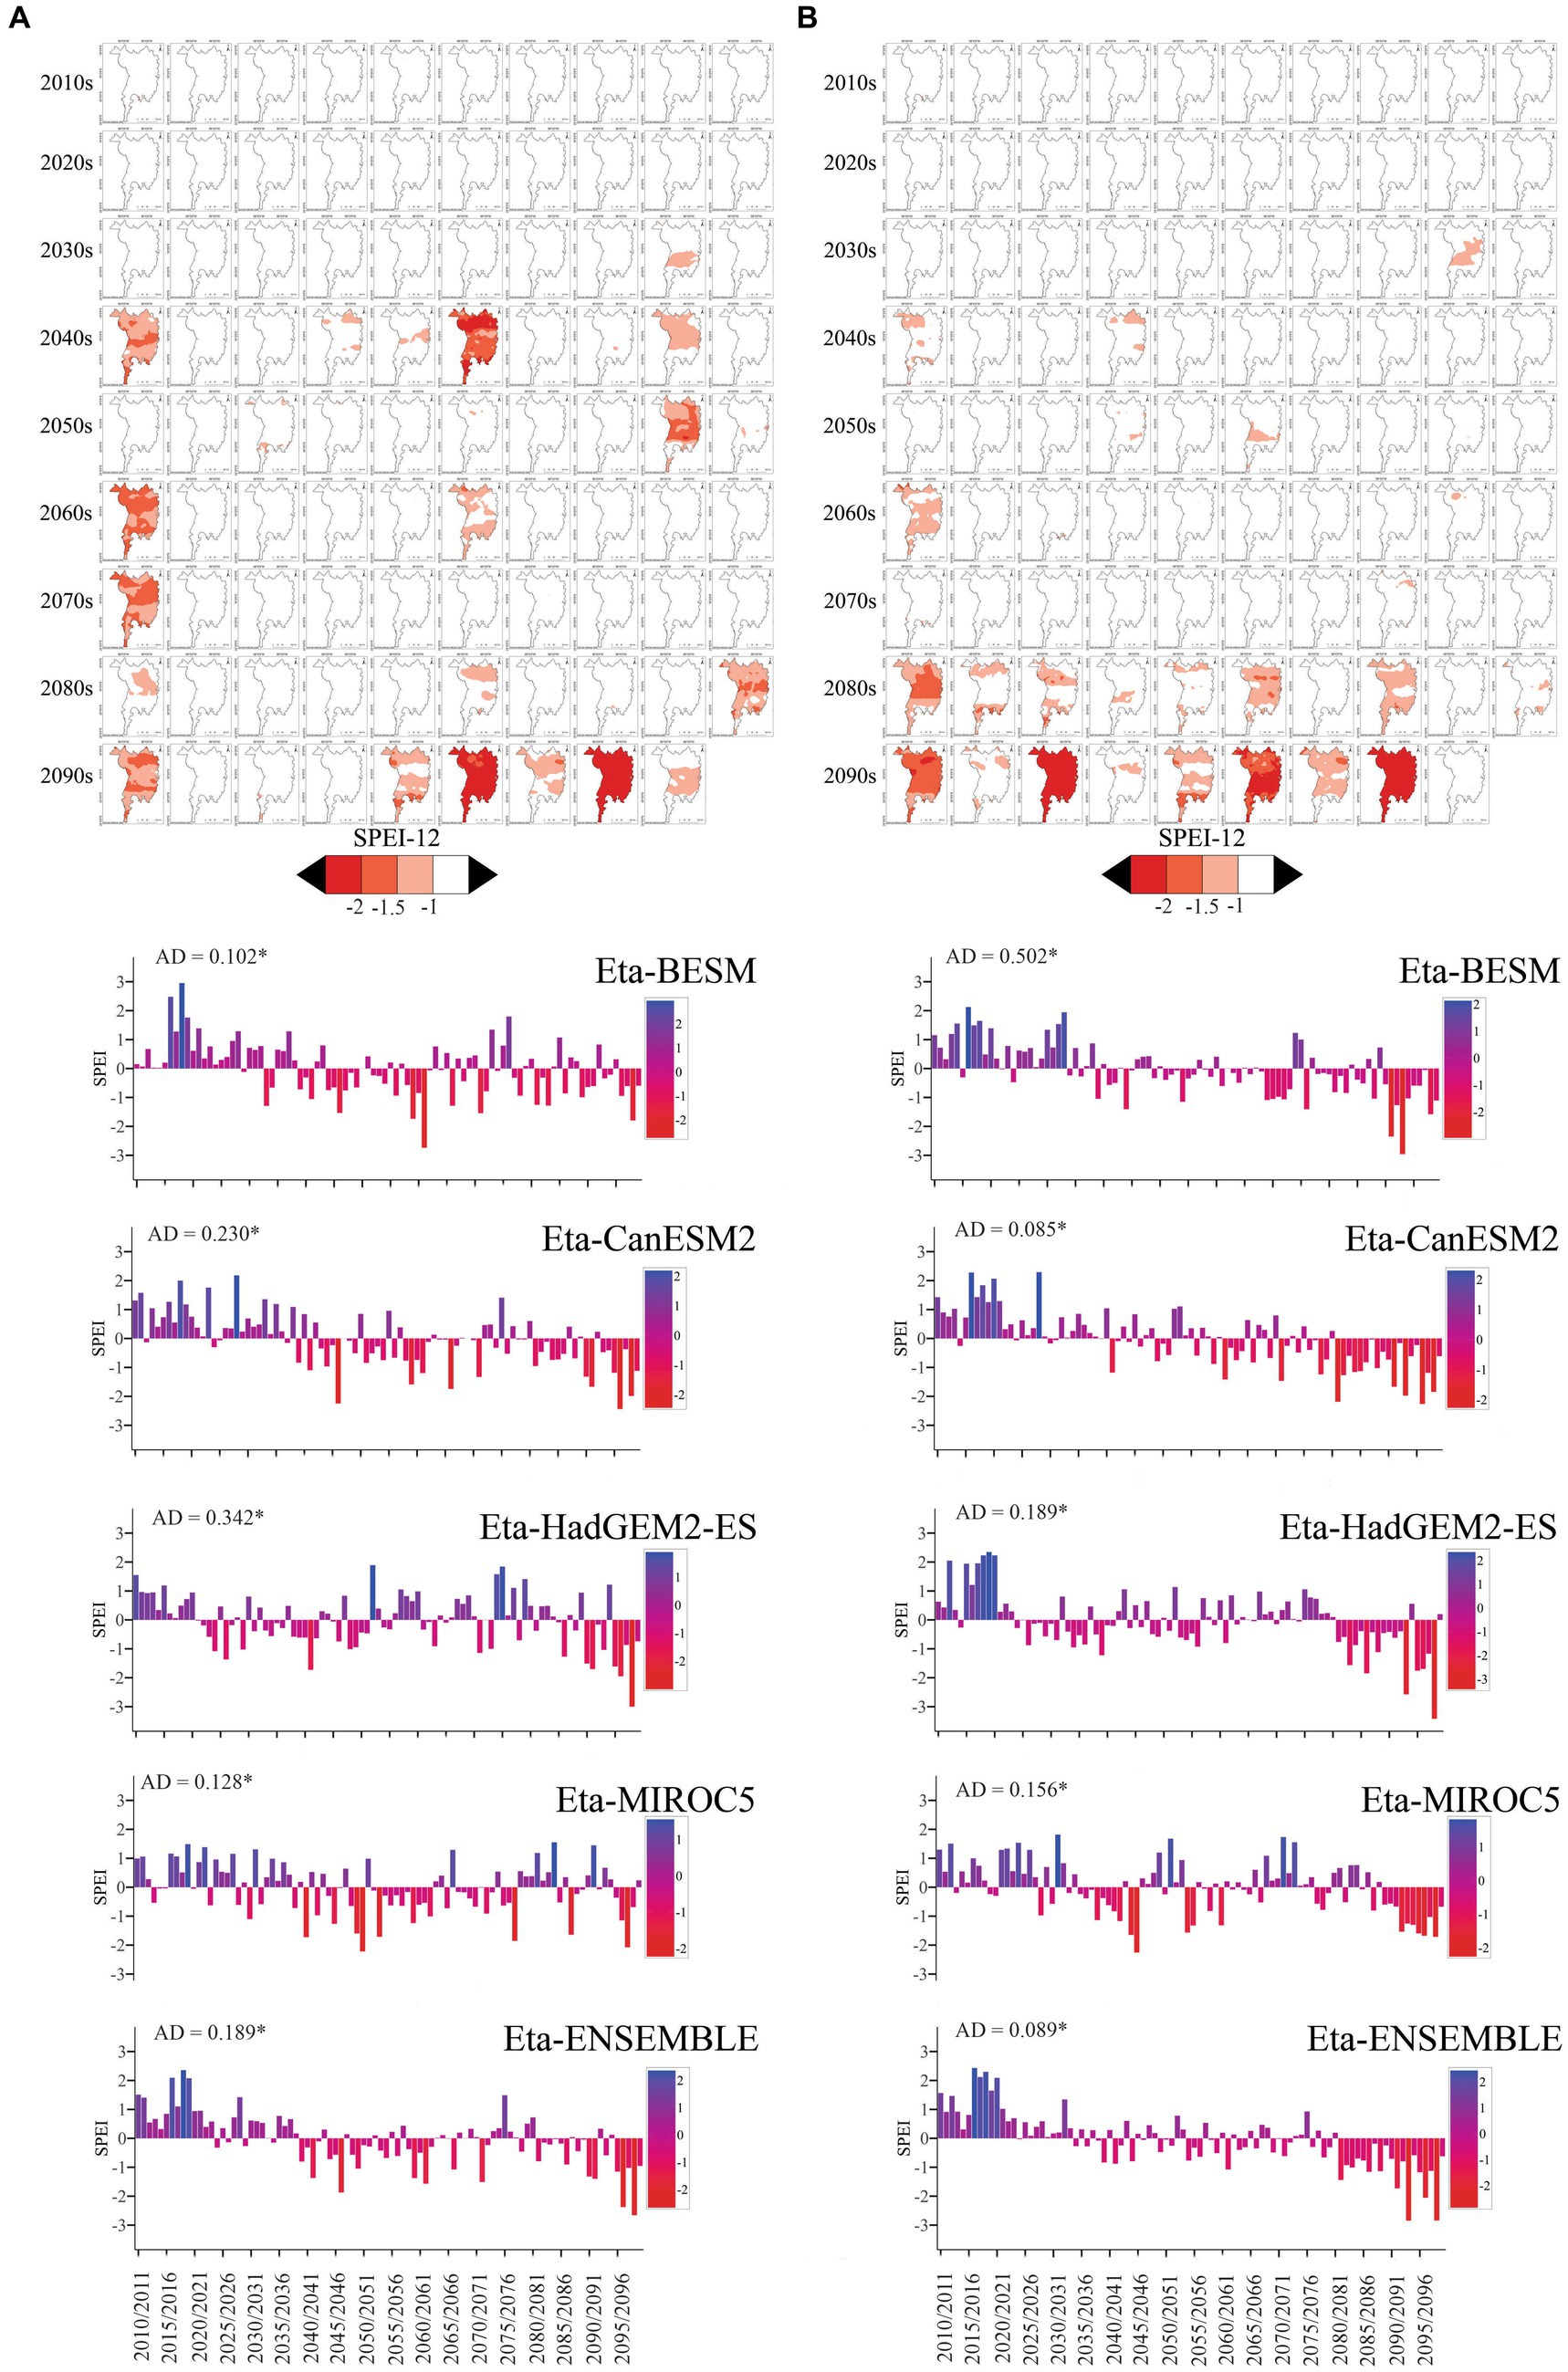
Figure 7. Annual SPEI (SPEI12) projected by the Eta ensemble for the RCP4.5 (A) and RCP8.5 (B) scenarios and the null statistics of the Anderson-Darling test (*Ho hyphotese significant at 5% of probaility).
Figure 8 presents the projected SPEI12 by the CORDEX ensemble for the RCP4.5 and RCP8.5 scenarios, and up to the 2050s, no drought events were projected. Under RCP4.5, the hydrological years 2072/2073, 2081/2082, and 2095/2096 (SPEI12 = −1.77, SPEI12 = −1.85, and SPEI12 = −2.07, respectively) were identified as the driest periods. The most severe droughts were concentrated in the last decade of the 2090s, particularly in 2092/2093 (SPEI12 = −2.92) and 2096/2097 (SPEI12 = −1.93) under the RCP8.5 scenario. The CORDEX models, driven by CSIRO, IPSL, GFDL, and NorESM1, demonstrated consistent projections with no significant differences among the models, emphasizing the occurrence of severe drought events primarily in the last three decades of the 21st century.
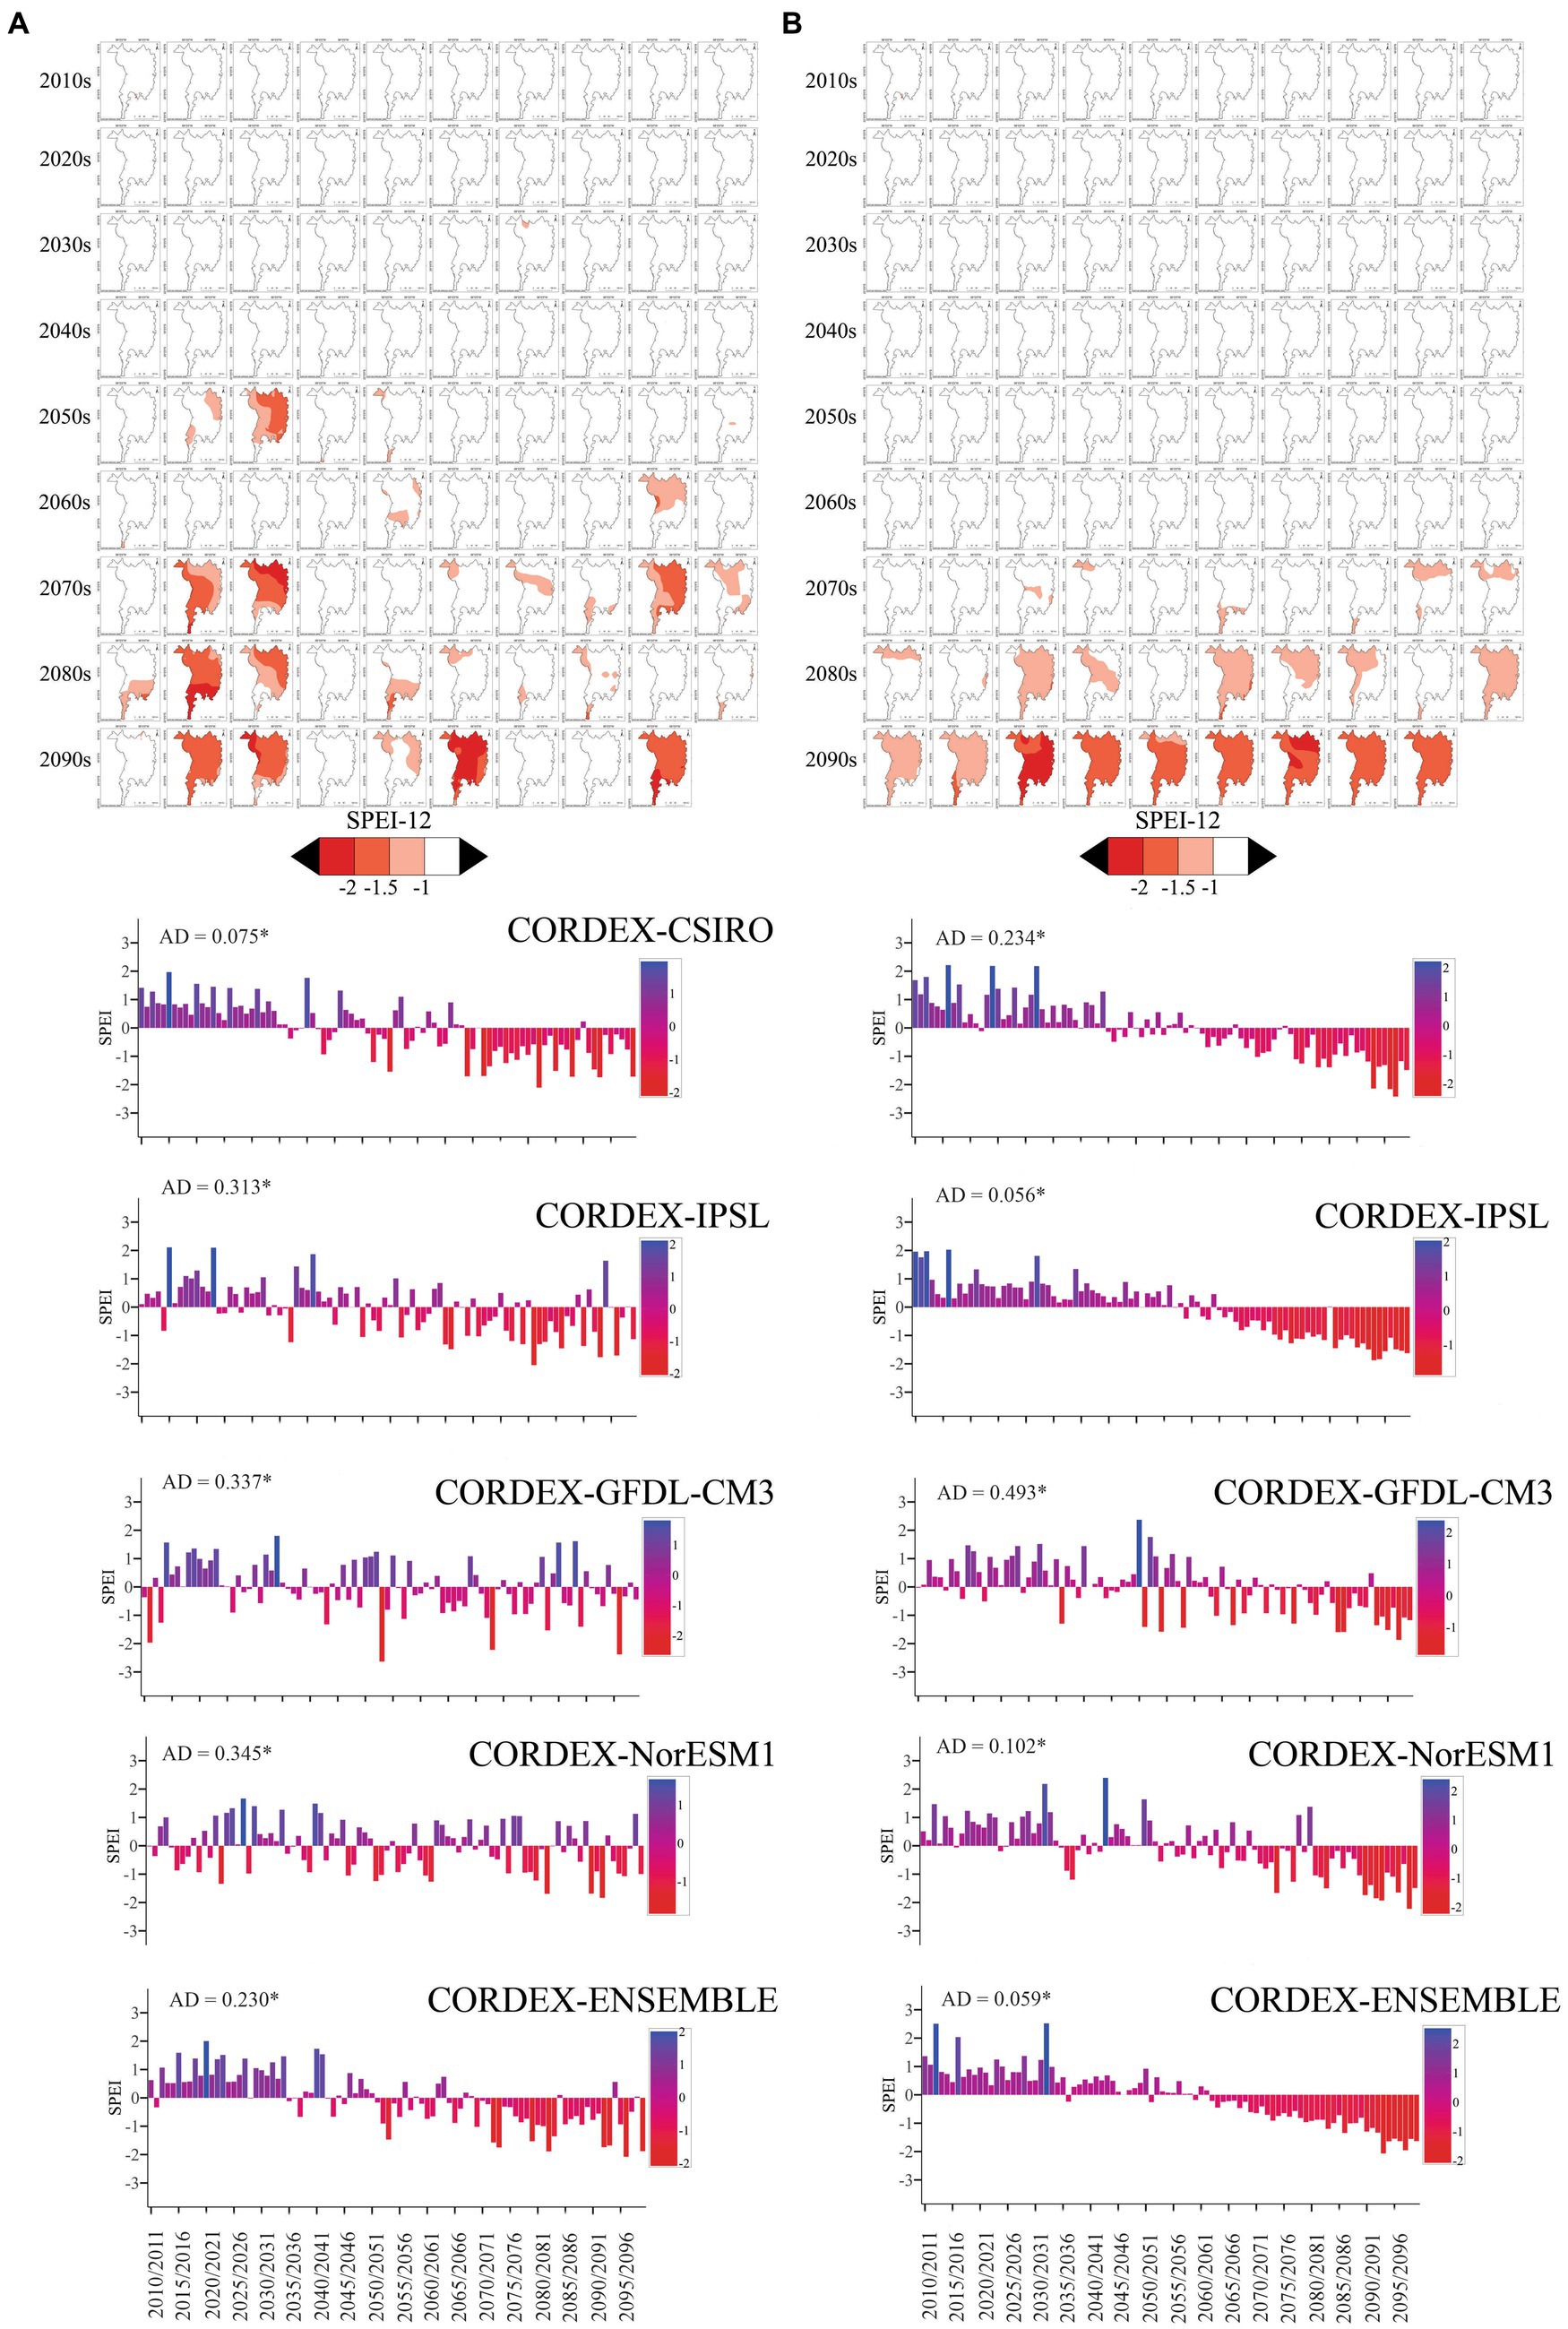
Figure 8. Annual SPEI (SPEI12) projected by the CORDEX ensemble for the RCP4.5 (A) and RCP8.5 (B) scenarios and the null statistics of the Anderson-Darling test (*Ho hyphotese significant at 5% of probaility).
Discussion
Drought episodes in the Pantanal region
There is no consensus on the influence of global-scale phenomena such as El Niño and La Niña (ENSO) events on the Pantanal region. Marengo et al. (2015) emphasized the significant interannual variability in hydrometeorological conditions in the Pantanal, suggesting that the local climate operates independently of ENSO behavior. On the other hand, Alho and Silva (2012) conducted a study covering the period from 1900 to 2012 and found that during all 30 occurrences of El Niño, no severe floods were recorded at the Ladario gage station along the Paraguay River. They identified remarkably dry periods, such as the 1960s, in which only one flooding event was recorded (1965/1966). However, Marengo et al. (2021) observed that some droughts occurred under El Niño influence and others during La Niña, making it challenging to draw conclusions regarding the influence of these events on drought occurrence in the region.
Possible explanations for the extreme drought event of the hydrological year 2019/2020 have been examined by Marengo et al. (2021). Significant changes in upper, middle, and lower-level circulation and moisture across South America were documented during the summer seasons of 2019 and 2020. From December 2019 to February 2020, an atmospheric blocking system in the Pacific Ocean, coupled with an anticyclonic anomaly over subtropical latitudes, dominated the region, impeding the development of convective storms. Consequently, intense and abnormal anticyclonic circulation throughout the continent at the 500 and 200 hPa levels accounted for the observed reduction in precipitation.
The Amazon Forest assumes a crucial role in the redistribution of moisture across South America (Nobre, 2014), with water vapor from the Amazon region supplying rainfall to the Pantanal region (Bergier et al., 2018). This moisture, known as the South Atlantic Convergence Zone (SACZ), significantly influences the hydrology of Central-South Brazil. However, during the 2019–2020 hydrological year, an anticyclone prevailed over the Pantanal, suppressing the formation of the SACZ and consequently disrupting the typical precipitation patterns.
The literature continues to document the ongoing impacts of the 2019/2020 drought in the Pantanal region. In the hydrological year of 2018/2019, a total of 6,244 fire spots were identified in the Pantanal, but this number increased to 10,693 (Instituo Nacional de Pesquisas Espaciais, 2021) in the subsequent year, representing a 71.3% increase. Analysis conducted using the ALARMES (Pinto et al., 2020) system by the Laboratory for Environmental Satellite Applications (LASA-UFRJ) revealed that approximately 26% of the Pantanal experienced wildfires resulting from megadrought, encompassing an estimated area of 3.9 million hectares (Leal Filho et al., 2022). The combination of fire and drought poses a severe threat in the Pantanal region, with the effects of the fires extending beyond the region, as the smoke permeated other states such as São Paulo, Rio de Janeiro, and Parana, resulting in decreased air quality, the occurrence of rare phenomena such as black rain, and adverse impacts on human health (Libonati et al., 2022). Moreover, extreme wildfires diminish resources for surviving species, potentially compelling them to migrate to unburned areas, including those inhabited by humans, thereby facilitating the emergence of new diseases, as highlighted by the Oswaldo Cruz Fundation (2020).
Consecutive years of extreme drought events in the Pantanal can impact the biome ecosystem and affect local ecological communities (Alho and Silva, 2012). During the 2019/2020 drought and wildfires, jaguars (Panthera onca), hyacinth macaws (Anodorhynchus hyacinthinus), and other iconic wildlife were directly affected (died, severely injured or starved) (Garcia et al., 2021). The event experienced in the Pantanal was similar to that in Australia at the end of 2019, where fires spread throughout the country and devastated thousands of houses and wildlife (Wintle et al., 2020).
The performance of the RCMs In simulating precipitation and evapotranspiration during hydrological years in the Pantanal region
One of the challenges associated with using ensembles is the limited studies available utilizing the same RCM models. Reboita et al. (2022) conducted a study in which various climate indices across South America were measured using the CORDEX ensemble (HadGEM2-ES, NorESM1-M, MPI-ESM-MR) and found that this ensemble tended to overestimate precipitation by approximately 3 mm/day in December, January, and February, which agrees with the findings of the present study. Conversely, Chou et al. (2014a) employed three global models (HadGEM2-ES, BESM, and MIROC5) downscaled by the Eta-CPTEC model. They observed that the mean ensemble precipitation was underestimated between December and February but overestimated between June and August.
Consistent with our findings, Llopart et al. (2020), in their assessment of climate projections over South America using the CORDEX ensemble (GFDL-ESM2 M, MPI-ESM-LR, HadGEM2-ES, MPI-ESM-LR), also observed a tendency toward underestimation throughout most of the year. Similarly, Chou et al. (2014a) reported that the Eta ensemble (BESM, MIROC5, and HadGEM2-ES) tended to overestimate the temperature during the summer (December to February) and underestimate the temperature during the winter (June to August).
Projections of droughts in the Pantanal region
Only a few studies have explored climate change projections using CORDEX RCM ensemble models in South America (Falco et al., 2019; Solman and Blázquez, 2019; Llopart et al., 2020). Like the Eta ensemble, the CORDEX ensemble, which comprises models such as CSIRO, IPSL, GFDL-CM3, and NorESM1, exhibits significant variability. Nevertheless, Falco et al. (2019) demonstrated that despite this variability, an overall increase in precipitation can be expected under both the RCP4.5 and RCP8.5 scenarios toward the end of the 21st century, thereby increasing the concentration of droughts in the first three decades.
Notable differences in results become apparent upon comparing the CORDEX and Eta models. Unlike the Eta ensemble, CORDEX successfully simulated droughts resembling the observed conditions in the Pantanal region during 2019/2020. The varying signs of precipitation change among the Eta ensemble projections tended to balance the projected precipitation amounts, potentially leading to an underestimation of drought magnitudes. In contrast, CORDEX models consistently projected events similar to those witnessed in the 1960s and 2010s, suggesting a pattern for droughts in the Pantanal region.
Hua et al. (2015) focused on land use change using the CanESM2 model. A reduction in the leaf area index (LAI) is projected until 2099 for the central region of Brazil, including the Pantanal. This reduction in LAI may contribute to an increase in the temperature of 0.2°C in the region. During the southern summer months (December–February), Eta-HadGEM2-ES and Eta-MIROC5 exhibited different sensitivities to greenhouse gas emissions. Under the RCP4.5 scenario, Eta-MIROC simulations projected a temperature increase of up to 2°C compared to the historical climate, while Eta-HadGEM2-ES projected an increase of approximately 4°C. For RCP8.5, toward the end of the century, Eta-HadGEM2-ES indicated warming between 5 and 7°C. Consequently, by the end of the century, potential evapotranspiration may substantially exceed precipitation, aligning with the projection of extreme drought events.
The clustering of droughts in the 2080s and 2090s (Figure 8) can indicate a transition toward a semiarid climate and the possibility of megadroughts in the Pantanal region (Garreaud et al., 2019), which could lead to reduced runoff, crop yield, and hydroelectric power generation, as well as substantial socioeconomic and environmental consequences for the region.
The recurrence of extreme dry events can contribute to an increase in the area affected by wildfires in the Pantanal region. One of the most significant impacts observed during the 2019/2020 period was widespread wildfires in the region. A study by Silva et al. (2020) revealed a correlation between high temperatures during heat waves and the extent of burned areas in the Pantanal. Additionally, they simulated the potential impacts of temperature increases under the RCP8.5 scenario using CORDEX ensemble models, which aligns with the findings of the present study. The simulation results indicate an approximate 5°C temperature increase over the Pantanal under RCP8.5, which could result in an 80% increase in heatwave occurrence in the region. The combination of elevated temperatures and reduced precipitation enhances the potential for triggering wildfires in the Pantanal, leading to the loss of vegetation and biodiversity. Therefore, we suggest the application of the SPI and SPEI methodology to evaluate the dryness extent and severity conditions of this region. Consecutive and intense drought events, as projected especially for the CORDEX ensemble, might lead to intense wildfires and loss of this unique world wetland.
Conclusion
This study highlights meteorological droughts over the Pantanal Brazilian biome, a vulnerable ecological area in the central-western region of Brazil, based on the SPI and SPEI indices, CRU datasets, and two RCM ensembles (Eta and CORDEX). The main conclusions are as follows:
a. The assessment of drought episodes from 1940 to 2020 revealed that the hydrological year of 2019/2020 experienced the most extreme drought, which triggered large wildfires. The consequences of meteorological events associated with anthropogenic actions put the Pantanal ecosystem at risk throughout the century.
b. The SPI12 and SPEI12 exhibited similar outcomes at baseline, suggesting that insufficient precipitation is the primary driver of droughts in the Pantanal region. However, in the case of extreme droughts (i.e., 2019/2020; 1964/1965), the occurrence of lower rainfall and higher temperatures can culminate in hazard events.
c. The findings from the Eta ensemble indicate a significant increase in extreme drought events during the last two decades. In contrast to the CRU observed data, there are different results between the SPI and SPEI. Although the SPI revealed limited intensity in drought events and was not capable of reproducing the observed 2019/2020 extreme drought, the SPEI simulated the occurrence of this event under RCP4.5 in 2095/2096 and 2097/2098 and under RCP8.5 in 2092/2093, 2095/2096, and 2097/2098.
d. The CORDEX ensemble could simulate extreme droughts over the Pantanal region based on the SPI and SPEI. The differences in these indices were more evident than those observed in the Eta ensemble simulations. For SPI12, the occurrence of dry events is mainly simulated in the first three decades for RCP4.5 and RCP8.5. For the SPEI12, temperature plays an essential role under RCP4.5 and RCP8.5, and drought events (extreme included) are concentrated in the 2070s under RCP4.5 and in the 2080s under RCP8.5, as a sequence of two decades of negative drought indices might indicate a substantial impact on the ecosystem of the Pantanal.
Data availability statement
Publicly available datasets were analyzed in this study. This data can be found at: INMET: https://bdmep.inmet.gov.br/# CRU: https://crudata.uea.ac.uk/cru/data/hrg/cru_ts_4.07/ CORDEX: https://www.climate4impact.eu/c4i-frontend/search Eta: https://projeta.cptec.inpe.br/#/dashboard.
Author contributions
VS: Conceptualization, Data curation, Formal analysis, Investigation, Methodology, Software, Validation, Visualization, Writing – original draft. CdM: Conceptualization, Funding acquisition, Investigation, Methodology, Supervision, Writing – original draft. SC: Conceptualization, Formal analysis, Funding acquisition, Methodology, Writing – original draft. LG: Investigation, Methodology, Visualization, Writing – original draft. MV: Conceptualization, Data curation, Resources, Visualization, Writing – original draft.
Funding
The author(s) declare financial support was received for the research, authorship, and/or publication of this article. This study was financed partially by the Coordenação de Aperfeiçoamento Pessoal de Nível Superior – Brasil (CAPES) and CNPq for the scholarship for the CM.
Acknowledgments
We would like to thank the Universidade Federal de Lavras, the Climate Research Unit, the National Institute for Space Research for the partnership, and the CORDEX project for the data availability. SC thanks CNPq for grant 312742/2021-5. CM thanks CNPq for the grant 200202/2022-9.
Conflict of interest
The authors declare that the research was conducted in the absence of any commercial or financial relationships that could be construed as a potential conflict of interest.
Publisher’s note
All claims expressed in this article are solely those of the authors and do not necessarily represent those of their affiliated organizations, or those of the publisher, the editors and the reviewers. Any product that may be evaluated in this article, or claim that may be made by its manufacturer, is not guaranteed or endorsed by the publisher.
References
AghaKouchak, A., Farahmand, A., Melton, F. S., Teixeira, J., Anderson, M. C., Wardlow, B. D., et al. (2015). Remote sensing of drought: Progress, challenges and opportunities. Rev. Geophys. 53, 452–480. doi: 10.1002/2014RG000456
Alho, C., and Silva, J. (2012). Effects of severe floods and droughts on wildlife of the Pantanal wetland (Brazil)—a review. Animals 2, 591–610. doi: 10.3390/ani2040591
Almeida, T. I. R., Penatti, N. C., Ferreira, L. G., Arantes, A. E., and Amaral, C. H. (2015). Principal component analysis applied to a time series of MODIS images: the spatiotemporal variability of the Pantanal wetland, Brazil. Wetl. Ecol. Manag. 23, 737–748. doi: 10.1007/s11273-015-9416-4
Anderson, T. W., and Darling, D. A. (1954). A test of goodness of fit. J. Am. Stat. Assoc. 49, 756–769,
Arora, V. K., and Matthews, H. D. (2009). Characterizing uncertainty in modeling primary terrestrial ecosystem processes, global Biogeochemic. Cycle 23:398. doi: 10.1029/2008GB003398
Begueria, S., Vicente-Serrano, S. M., Reig, F., and Latorre, B. (2014). Standardized precipitation evapotranspiration index (SPEI) revisited: parameter fitting, evapotranspiration models, tools, datasets and drought monitoring. Int. J. Climatol. 34, 3001–3023. doi: 10.1002/joc.3887
Bentsen, M., Bethke, I., Debernard, J. B., Iversen, T., Kirkevåg, A., Seland, Ø., et al. (2013). The Norwegian earth system model, NorESM1-M – part 1: description and basic evaluation of the physical climate. Geosci. Model Dev. 6, 687–720. doi: 10.5194/gmd-6-687-2013
Bergier, I., Assine, M. L., McGlue, M. M., Alho, C. J. R., Silva, A., Guerreiro, R. L., et al. (2018). Amazon rainforest modulation of water security in the Pantanal wetland. Sci. Total Environ. 619-620, 1116–1125. doi: 10.1016/j.scitotenv.2017.11.163
Catian, G., Silva, D. M., Súarez, Y. R., and Scremin-Dias, E. (2018). Effects of flood pulse dynamics on functional diversity of Macrophyte communities in the Pantanal wetland. Wetlands 38, 975–991. doi: 10.1007/s13157-018-1050-5
Chou, S. C., Lyra, A., Mourão, C., Dereczynski, C., Pilotto, I., Gomes, J., et al. (2014b). Assessment of climate change over South America under RCP 4.5 and 8.5 downscaling scenarios. Am. J. Clim. Chang. 3, 512–527. doi: 10.4236/ajcc.2014.35043
Chou, S. C., Lyra, A., Mourão, C., Dereczynski, C., Pilotto, I., Gomes, J., et al. (2014a). Evaluation of the eta simulations nested in three global climate models. Am. J. Clim. Change 3, 438–454. doi: 10.4236/ajcc.2014.35039
Chou, S. C., Marengo, J. A., Lyra, A. A., Sueiro, G., Pesquero, J. F., Alves, L. M., et al. (2012). Downscaling of South America present climate driven by 4-member HadCM3 runs. Clim. Dyn. 38, 635–653. doi: 10.1007/s00382-011-1002-8
Chylek, P., Li, J., Dubey, M. K., Wang, M., and Lesins, G. (2011). Observed and model simulated 20th century Arctic temperature variability: Canadian earth system model CanESM2. Atmos. Chem. Phys. 11, 893–915. doi: 10.5194/acpd-11-22893-2011
Clark, J. S., Iverson, L., Woodall, C. W., Allen, C. D., Bell, D. M., Bragg, D. C., et al. (2016). The impacts of increasing drought on forest dynamics, structure, and biodiversity in the United States. Glob. Chang. Biol. 22, 2329–2352. doi: 10.1111/gcb.13160
Coelho, C. A. S., Cardoso, D. H. F., and Firpo, M. A. F. (2014). Precipitation diagnostics of an exceptionally dry event. Theor. Appl. Climatol. 125, 769–784. doi: 10.1007/s00704-015-1540-9
Collins, W. J., Bellouin, N., Doutriaux-Boucher, M., Gedney, N., Halloran, P., Hinton, T., et al. (2011). Development and evaluation of an earth-system model – HadGEM2. Geosci. Model Dev. 4, 1051–1075. doi: 10.5194/gmd-4-1051-2011
Donner, L. J., Wyman, B. L., Hemler, R. S., Horowitz, L. W., Ming, Y., Zhao, M., et al. (2011). The dynamical Core, physical parameterizations, and basic simulation characteristics of the atmospheric component AM3 of the GFDL global coupled model CM3. J. Clim. 24, 3484–3519. doi: 10.1175/2011JCLI3955.1
Dufresne, J. L., Foujols, M. A., Denvil, S., Caubel, A., Marti, O., Aumont, O., et al. (2013). Climate change projections using the IPSL-CM5 earth system model: from CMIP3 to CMIP5. Clim. Dyn. 40, 2123–2165. doi: 10.1007/s00382-012-1636-1
Dunne, J. P., John, J. G., Adcroft, A. J., Griffies, S. M., Hallberg, R. W., Shevliakova, E., et al. (2012). GFDL’s ESM2 global coupled climate–carbon earth system models. Part I: physical formulation and baseline simulation characteristics. J. Clim. 25, 6646–6665. doi: 10.1175/JCLI-D-11-00560.1
Falco, M., Carril, A. F., Menéndez, C. G., Zaninelli, P. G., and Li, L. Z. X. (2019). Assessment of CORDEX simulations over South America: added value on seasonal climatology and resolution considerations. Clim. Dyn. 52, 4771–4786. doi: 10.1007/s00382-018-4412-z
Ferreira Barbosa, M. L., Haddad, I., da Silva Nascimento, A. L., Máximo da Silva, G., Moura da Veiga, R., Hoffmann, T. B., et al. (2022). Compound impact of land use and extreme climate on the 2020 fire record of the Brazilian Pantanal. Global Ecology and Biogeography, 31, 1960–1975. doi: 10.1111/geb.13563
Garcia, L. C., Szabo, J. K., Roque, F. O., Martins Pereira, A. M., Cunha, C. N., Damasceno-Júnior, G. A., et al. (2021). Record-breaking wildfires in the world’s largest continuous tropical wetland: integrative fire management is urgently needed for both biodiversity and humans. J. Environ. Manag. 293:112870. doi: 10.1016/j.jenvman.2021.112870
Garreaud, R. D., Boisier, J. P., Rondanelli, R., Montecinos, A., Sepúlveda, H., and Veloso-Äguila, D. (2019). The Central Chile mega drought (2010-2018): a climate dynamics perspective. Int. J. Climatol. 40, 421–439. doi: 10.1002/joc.6219
Gupta, H. V., Kling, H., Yilmaz, K. K., and Martinez, G. F. (2009). Decomposition of the mean squared error and NSE performance criteria: Implications for improving hydrological modelling, J. Hydrol., 377, 80–91, doi: 10.1016/j.jhydrol.2009.08.003
Harris, I., Jone, P. D., Osborn, T. J., and Lister, D. H. (2014). Updated high-resolution grids of monthly climatic observations–the CRUTS3.10 dataset. Int. J. Climatol. 34, 623–642. doi: 10.1002/joc.3711
Hua, W., Chen, H., Sun, S., and Zhou, L. (2015). Assessing climatic impacts of future land use and land cover change projected with the CanESM2 model. Int. J. Climatol. 35, 3661–3675. doi: 10.1002/joc.4240
Hu, S., Niu, Z., Chen, Y., Li, L., and Zhang, H. (2017). Global wetlands: potential distribution, wetland loss, and status. Sci. Total Environ. 586, 319–327. doi: 10.1016/j.scitotenv.2017.02.001
Instituo Nacional de Pesquisas Espaciais. (2021). Programa Queimadas do INPE. https://terrabrasilis.dpi.inpe.br/queimadas/portal/
IPCC (2022). Climate change 2022: Impacts, adaptation and vulnerability. Contribution of working group II to the sixth assessment report of the intergovernmental panel on climate change Cambridge university press. Cambridge, UK: Cambridge University Press, 3056.
Ivory, S., McGlue, M., Spera, S., Silva, A., and Bergier, I. (2019). Vegetation, rainfall, and pulsing hydrology in the Pantanal, the world’s largest tropical wetland. Environ. Res. Lett. 14:9326. doi: 10.1088/1748-9326/ab4ffe
Javadinejad, S., Dara, R., and Jafary, F. (2020). Potential impact of climate change on temperature and humidity related human health effects during extreme condition. Saf. Extreme Environ. 2, 189–195. doi: 10.1007/s42797-020-00021-x
Jeffrey, S., Rotstayn, L., Collier, M., Dravitzki, S., Hamalainen, C., Moeseneder, C., et al. (2013). Australia’s CMIP5 submission using the CSIRO-Mk3.6 model. Aust. Meteorol. Oceanogr. J. 63, 1–14. doi: 10.22499/2.6301.001
Junqueira, R., Viola, M. R., Amorim, J. S., Camargos, C., and Mello, C. R. (2022). Hydrological modeling using remote sensing precipitation data in a Brazilian savanna basin. J. S. Am. Earth Sci. 115:103773. doi: 10.1016/j.jsames.2022.103773
Leal Filho, W., Azeiteiro, U. M., Salvia, A. L., Fritzen, B., and Libonati, R. (2022). Fire in paradise: why the Pantanal is burning. Environ. Sci. Pol. 123, 31–34. doi: 10.1016/j.envsci.2021.05.005
Lenderink, G., Buishand, A., and Van Deursen, W. (2007). Estimates of future discharges of the river Rhine using two scenario methodologies: direct versus delta approach. Hydrol. Earth Syst. Sci., 11, 1145–1159.
Libonati, R., Geirinhas, J. L., Silva, P. S., Russo, A., Rodrigues, J. A., Belem, L. B. C., et al. (2022). Assessing the role of compound drought and heatwave events on unprecedented 2020 wildfires in the Pantanal. Environ. Res. Lett. 17:462. doi: 10.1088/1748-9326/ac462e
Llopart, M., Simões Reboita, M., and Porfírio da Rocha, R. (2020). Assessment of multimodel climate projections of water resources over South America CORDEX domain. Clim. Dyn. 54, 99–116. doi: 10.1007/s00382-019-04990-z
Mao, D., Wang, Z., Wu, J., Wu, B., Zeng, Y., Song, K., et al. (2018). China’s wetlands loss to urban expansion. Land Degrad. Dev. 29, 2644–2657. doi: 10.1002/ldr.2939
Marengo, J. A., Alves, L. M., and Torres, R. R. (2016). Regional climate change scenarios in the Brazilian Pantanal watershed. Clim Res, 68, 201–213. doi: 10.3354/cr01324
Marengo, J. A., Chou, S. C., Kay, G., Alves, L. M., Pesquero, J. F., Soares, W. R., et al. (2012). Development of regional future climate change scenarios in South America using the eta CPTEC/HadCM3 climate change projections: climatology and regional analyses for the Amazon, São Francisco and the Paraná River basins. Clim. Dyn. 38, 1829–1848. doi: 10.1007/s00382-011-1155-5
Marengo, J. A., Cunha, A. P., Cuartas, L. A., Deusdara Leal, K. R., Broedel, E., Seluchi, M. E., et al. (2021). Extreme drought in the Brazilian Pantanal in 2019–2020: characterization, causes, and impacts. Front. Water. 3:639204. doi: 10.3389/frwa.2021.639204
Marengo, J. A., Liebmann, B., Grimm, A., Misra, V., Silva Dias, P. L., Cavalcanti, I. F. A., et al. (2010). Recent developments on the south American monsoon system. Int. J. Climatol. 32, 1–21. doi: 10.1002/joc.2254
Marengo, J. A., Oliveira, G. S., and Alves, L. M. (2015). “Climate change scenarios in the Pantanal” in Dynamics of the Pantanal wetland in South America. The Handbook of Environmental Chemistry. eds. I. Bergier and M. Assine, vol. 37 (Cham: Springer).
McEvoy, D. J., Huntington, J. L., Abatzoglou, J. T., and Edwards, L. M. (2012). An evaluation of multiscalar drought indices in Nevada and eastern California. Earth Interact. 16, 1–18. doi: 10.1175/2012EI000447.1
McKee, T. B., Doesken, N. J., and Kliest, J. (1993). The relationship of drought frequency and duration to time scales. th Conference on Applied Climatology, Anaheim, pp. 179–184.
Meresa, H. K., Osuch, M., and Romanowicz, R. (2016). Hydrometeorological drought projections into the 21-st century for selected polish catchments. Water 8, 1–22. doi: 10.3390/w8050206
WMO (2016). “Handbook of drought indicators and indices” in Integrated drought management Programme (IDMP), integrated drought management tools and guidelines series 2. eds. M. Svoboda and B. Fuchs (Geneva: World Meteorological Organization (WMO) & Global Water Partnership (GWP)).
Narayan, S., Beck, M. W., Wilson, P., Thomas, C. J., Guerrero, A., Shepard, C. C., et al. (2017). The value of coastal wetlands for flood damage reduction in the northeastern USA. Sci. Rep. 7:9463. doi: 10.1038/s41598-017-09269-z
Nobre, A. D. (2014). The future climate of Amazonia, Scientific Assessment Report. CCST-INPE, INPA, ARA. São José dos Campos, Brazil, p. 42.
Nobre, P., Siqueira, L. S. P., Almeida, R. A. F., Malagutti, M., Giarolla, E., Castelão, G. P., et al. (2013). Climate simulation and change in the Brazilian climate model. J. Clim. 26, 6716–6732. doi: 10.1175/JCLI-D-12-00580.1
Nogueira, K., Fadel, S. G., Dourado, I. C., O Werneck, R., Munoz, J. A. V., Penatti, O. A. B., et al. (2018). Exploiting ConvNet Diversity for Flooding Identification. IEEE Geoscience and Remote Sensing Letters, 1–5. doi: 10.1109/lgrs.2018.2845549
Ostad-Ali-Askari, K. (2022). Management of risks substances and sustainable development. Appl Water Sci 12, 65. doi: 10.1007/s13201-021-01562-7
Oswaldo Cruz Fundation. (2020) Fiocruz assesses the impact of Pantanal fires on human health. Ministério da Saúde do Brasil, Governo Federal, Brasil. Available at: https://portal.fiocruz.br/en/print/81214.
Peng, J., Dadson, S., Hirpa, F., Dyer, E., Lees, T., Miralles, D. G., et al. (2020). A pan-African high-resolution drought index dataset. Earth Syst. Sci. Data 12, 753–769. doi: 10.5194/essd-12-753-2020
Pesquero, J. F., Chou, S. C., Nobre, C. A., and Marengo, J. A. (2010). Climate downscaling over South America for 1961–1970 using the eta model. Theor. Appl. Climatol. 99, 75–93. doi: 10.1007/s00704-009-0123-z
Pinto, M. M., Libonati, R., Trigo, R. M., Trigo, I. F., and DaCamara, C. C. (2020). A deep learning approach for mapping and dating burned areas using temporal sequences of satellite images. ISPRS J. Photogramm. Remote Sens. 160, 260–274. doi: 10.1016/j.isprsjprs.2019.12.014
Popke, D., Stevens, B., and Voigt, A. (2013). Climate and climate change in a radiative-convective equilibrium version of ECHAM6. J. Adv. Model. Earth Syst. 5, 1–14. doi: 10.1029/2012MS000191
Pott, A., Oliveira, A., Damasceno-Junior, G., and Silva, J. (2011). Plant diversity of the Pantanal wetland. Braz. J. Biol. 71, 265–273. doi: 10.1590/s1519-69842011000200005
Pott, V., Pott, A., Lima, L., Moreira, S., and Oliveira, A. (2011). Aquatic macrophyte diversity of the Pantanal wetland and upper basin. Braz. J. Biol. 71, 255–263. doi: 10.1590/s1519-69842011000200004
Prado, L. F., Wainer, I., Yokoyama, E., and Garnier, J. J. (2012). Changes in summer precipitation variability in central Brazil over the past eight decades. Int. J. Climatol 41, 4171–4186.
Reboita, M. S., Kuki, C. A. C., Marrafon, V. H., Souza, C. A., Ferreira, G. W. S., Teodoro, T., et al. (2022). South America climate change revealed through climate indices projected by GCMs and Eta-RCM ensembles. Clim. Dynam., 58, 459–485. doi: 10.1007/s00382-021-05918-2
Silva, M. V. M., Silveira, C. S., Silva, G. K., Pedrosa, W. H. V., Marcos Junior, A. D., and Souza Filho, F. A. (2020). Projections of climate change in streamflow and affluent natural energy in the Brazilian hydroelectric sector of CORDEX models. Rev. Bras. Recur. Hidr. 25:e34. doi: 10.1590/2318-0331.252020200020
Silva, V. O., and Mello, C. R. (2020). Meteorological droughts in part of southeastern Brazil: understanding the last 100 years. An. Acad. Bras. Cienc. 93:e20201130. doi: 10.1590/0001-3765202120201130
Solman, S. A., and Blázquez, J. (2019). Multiscale precipitation variability over South America: analysis of the added value of CORDEX RCM simulations. Clim. Dyn. 53, 1547–1565. doi: 10.1007/s00382-019-04689-1
Teutschbein, C., and Seibert, J. (2012). Bias correction of regional climate model simulations for hydrological climate-change impact studies: Review and evaluation of different methods. J. Hydrol. 456–457, 12–29. doi: 10.1016/j.jhydrol.2012.05.052
Thielen, D., Ramoni-Perazzi, P., Puche, M. L., Márquez, M., Quintero, J. I., Rojas, W., et al. (2021). The Pantanal under Siege—On the Origin, Dynamics and Forecast of the Megadrought Severely Affecting the Largest Wetland in the World. Water. 13:3034. doi: 10.3390/w13213034
Vicente-Serrano, S. M., Beguería, S., and López-Moreno, J. I. (2010b). A multiscalar drought index sensitive to global warming: the standardized precipitation evapotranspiration index. J. Clim. 23, 1696–1718. doi: 10.1175/2009JCLI2909.1
Vicente-Serrano, S. M., Begueria, S., Lopez-Moreno, J. I., and El Kenawy, A. (2010a). A new global 0.5° gridded dataset (1901–2006) of a multiscalar drought index: datasets based on the palmer drought severity index. J. Hydrometeorol. 11, 1033–1043. doi: 10.1175/2010JHM1224.1
Watanabe, M., Suzuki, T., O’ishi, R., Komuro, Y., Watanabe, S., Emori, S., et al. (2010). Improved climate simulation by MIROC5: mean states, variability, and climate sensitivity. J. Clim. 23, 6312–6335. doi: 10.1175/2010jcli3679.1
Keywords: droughts, natural hazards, Brazilian biomes, environmental change, climate change
Citation: Silva VO, de Mello CR, Chou SC, Guo L and Viola MR (2024) Characteristics of extreme meteorological droughts over the Brazilian Pantanal throughout the 21st century. Front. Water. 6:1385077. doi: 10.3389/frwa.2024.1385077
Edited by:
Zeli Tan, Pacific Northwest National Laboratory (DOE), United StatesReviewed by:
Donghui Xu, Pacific Northwest National Laboratory (DOE), United StatesLingcheng Li, Pacific Northwest National Laboratory (DOE), United States
Copyright © 2024 Silva, de Mello, Chou, Guo and Viola. This is an open-access article distributed under the terms of the Creative Commons Attribution License (CC BY). The use, distribution or reproduction in other forums is permitted, provided the original author(s) and the copyright owner(s) are credited and that the original publication in this journal is cited, in accordance with accepted academic practice. No use, distribution or reproduction is permitted which does not comply with these terms.
*Correspondence: Carlos R. de Mello, crmello@ufla.br