 Francesco Tavanti
 Francesco Muniz-Miranda
 Alfonso Pedone
- Department of Chemical and Geological Sciences (DSCG), University of Modena and Reggio Emilia (UniMoRE), Modena, Italy
The ability of the sepiolite mineral to intercalate CO2 molecules inside its channels in the presence of different alkaline cations (K+, Na+, and Li+) has been studied by classical molecular dynamics simulations. Starting from an alkaline-free sepiolite crystalline model, we built three models with stoichiometry Mg320Si440Al40O1200(OH)160X+40·480H2O. On these models, we gradually replaced the water molecules present in the channels with carbon dioxide and determined the energy of this exchange reaction as well as the structural organization and dynamics of carbon dioxide in the channels. The adsorption energy shows that the Li-containing sepiolite mineral retains more carbon dioxide with respect to those with sodium and potassium cations in the channels. Moreover, the ordered patterns of CO2 molecules observed in the alkaline-free sepiolite mineral are in part destabilized by the presence of cations decreasing the adsorption capacity of this clay mineral.
Introduction
The concentration in the atmosphere of greenhouse gases, and in particular those of carbon dioxide, has greatly increased since the industrial revolution (National Research Council, 2010) due to human activities. Significant consequences overall the world have been observed, such as the “global warming” (Quéré et al., 2015) and the ocean acidification (Caldeira and Wickett, 2003). In recent years, the storage of CO2 in geological structures has gained an increasing interest by the scientific community as a tool for mitigating the increment of anthropogenic carbon dioxide (Loring et al., 2012, 2014; Myshakin et al., 2013; Rao and Leng, 2016).
Since the geological structures investigated as storage sites for anthropogenic CO2 are sealed by caprock formations containing a large amount of several clay minerals, there has been an increasing interest on the study of the interaction between CO2 and clay minerals.
Indeed, the ability of phyllosilicates to trap supercritical CO2 inside their channels has been investigated not only due to the high amounts of carbon dioxide that can be stored and thus as potential capturing materials but also to determine the long-term integrity of these materials that avoid the CO2 dispersion in the atmosphere (Hildenbrand et al., 2002; Wollenweber et al., 2010). The majority of these studies focused on the smectites minerals and in particular on montmorillonite, a 2:1 phyllosilicate, that because of its swelling capacity is able to host in its interlayer space water and CO2 (Rao and Leng, 2016) and other bigger organic molecules (Monvisade and Siriphannon, 2009; Block et al., 2015; Malferrari et al., 2017).
However, other minerals have been examined such as palygorskite and sepiolite (SEP) (Galán et al., 2011). These are modular phyllosilicates composed by ribbons aligned along the x-axis with a 2:1 layered structure. The ribbons are connected each other to the next inverted SiO4 tetrahedral sheet along the y-axis through a set of Si-O-Si bonds (Galan, 1996). In SEP, the ribbons are made by connecting three pyroxene-like chains, while in palygorskite by two of these chains, obtaining in the xy-plane rectangular channels. The presence of these microchannels makes palygorskite and SEP good candidates to adsorb liquids, gases, and vapors (Galan, 1996).
Recently, we investigated the adsorption capacity toward CO2 of both phyllosilicates by using classical molecular dynamics (MD) simulations (Muniz-Miranda et al., 2016). We showed that SEP could physically intercalate about 0.2 g of carbon dioxide per gram of clay, whereas about 0.1 g of carbon dioxide could be intercalated by palygorskite. These data suggested that SEP could be a convenient mineral for carbon dioxide storage applications. The difference in the adsorbing power of these two minerals is due to the double size of SEP channels with respect to those of palygorskite. However, these absorbing capacities referred to perfect minerals without intercalated cations in the channels, whereas in real mineral, a certain amount of alkali and alkaline cations are always present, and these, as already demonstrated for montmorillonite, can have a strong impact on the capture efficiency (Myshakin et al., 2013; Bowers et al., 2017; Kadoura et al., 2017).
For example, Michels et al. (2015) recently studied the different CO2 adsorption capacities of Li-fluorohectorite, Na-fluorohectorite, and Ni-fluorohectorite at conditions close to ambient and found that Li-fluorohectorite is able to capture more CO2 and more stably than the others.
For these reasons, we have extended our previous work to study the effect of the presence of Li+, Na+, and K+ cations in the SEP channels by using MD simulations of Li+, Na+, and K+-SEP minerals with a variable amount of supercritical CO2 inside the channels. The adsorbing power of SEP in presence of cations has been compared to those found for SEP without impurities previously found (Muniz-Miranda et al., 2016).
Computational Methods
Force Field Setup and MD Parameters
Molecular dynamics simulations have been carried out with the GROMACS software (Pronk et al., 2013) adopting a number of force fields (FFs). The simulation protocol is the same we employed to study palygorskite and SEP (Muniz-Miranda et al., 2016), albeit without considering possible structural defects.
The Clayff FF (Cygan et al., 2004) has been used to model the SEP mineral since it well reproduces the structure of clay minerals (Myshakin et al., 2013) and provides good water adsorption energies, comparable to those obtained by DFT calculations (Presti et al., 2016). It is mainly composed by Coulomb and Lennard-Jones non-bonded pair potentials:
and treats only OH− anions with a (bonded) harmonic potential:
In these formulas, qi is the partial charge of the atom i, rij is the instantaneous distance between the i and j atoms, rijeq. is the (fixed) equilibrium distance between two atoms i and j, ε0 is the permittivity in vacuo, and εij and σij are the two parameters determining the Lennard-Jones potential and are built according to the Lorentz-Berthelot rules (Lorentz, 1881; Berthelot, 1898) as geometric and arithmetic means, respectively, as
with σi and εi individual parameters of the i atom given in the specific FF.
To simulate water, we employed the so-called SPC/E FF (Berendsen et al., 1987) as already available in GROMACS (Pronk et al., 2013). In addition to the previous term of the potential, it also uses a (bonded) three-body harmonic term for reproducing the bending dynamics of H-O-H angle, indicated as ϑijk
with ϑ◦ being the (fixed) equilibrium value of said angle.
Parameter for ions K+ and Na+ are retrieved from the ClayFF (Cygan et al., 2004), while values for the Li ions are obtained from the OPLSAA FF (Jorgensen and Tirado-Rives, 1988).
Finally, the carbon dioxide molecules have been described with a recently developed FF (Cygan et al., 2004) comprising all the above non-bonded and bonded potential energy terms, which have been already tested to simulate CO2 stored into water/mineral mixtures (Myshakin et al., 2013) and have been validated in simulations with palygorskite and SEP in the study by Muniz-Miranda et al. (2016). All the FF parameters are reported in the GROMACS library file included in the Supporting Information.
The total potential energy is thus given as a sum of the previous terms, as
Periodic boundary conditions have been used to simulate the bulk phases. Non-bonded forces were explicitly computed only for rij < R, with the R being a cutoff set at 13 Å, a relatively large cutoff for classical MD simulations and exceeding even that adopted in the computational study of the CO2 adsorption in montmorillonite (Cygan et al., 2012). For distances exceeding the cutoff radius, the particle mesh Ewald (Allen and Tildesley, 1989) algorithm has been adopted to treat remaining long-range electrostatic interactions. The equations of motions have been integrated by using the Verlet-leap-frog algorithm (Gunsteren and Berendsen, 1988) adopting a time step of 1 fs to correctly describe the motion of H atoms.
All results reported in this article come from NpT “production runs” of 20 ns. Most production runs have been carried out at T = 348.15 K and p = 130 bar, as performed in the study by Muniz-Miranda et al. (2016). In these p, T conditions, CO2 manifest supercritical behavior. Every production run follows an equilibration run 4 ns long in the canonical ensemble (i.e., NVT) at T = 348.15 K and with the fixed volume given as a multiple of the primitive cell as reported in the previous section. We controlled T with the Berendsen thermostat (Berendsen et al., 1984) and p with the Parrinello-Rahman barostat (Parrinello and Rahman, 1980, 1981), both with a coupling time constant of ~1.3 ps.
Models
We started from the alkali-free SEP model used previously (Muniz-Miranda et al., 2016). This was created by replicating ×4, ×4, and ×5 the orthorhombic unit cell [stoichiometry Mg4Si6O15(OH)2·6H2O] taken from the MINCRYST database (Sánchez et al., 2011) leading to a final system with formula Mg320Si480O1200(OH)160·480H2O for a total 3,760 atoms.
To create Li-SEP, Na-SEP, and K-SEP models, we randomly replaced 40 Si4+ cations with 40 Al3+ cations and added 40 cations to maintain electroneutrality and deleted 40 zeolitic water molecules to avoid excessive increment of the stresses inside the channels of the minerals. The insertion of defects and cations has brought to different CO2/H2O ratios respect to the pure SEP, as shown in Table 1.
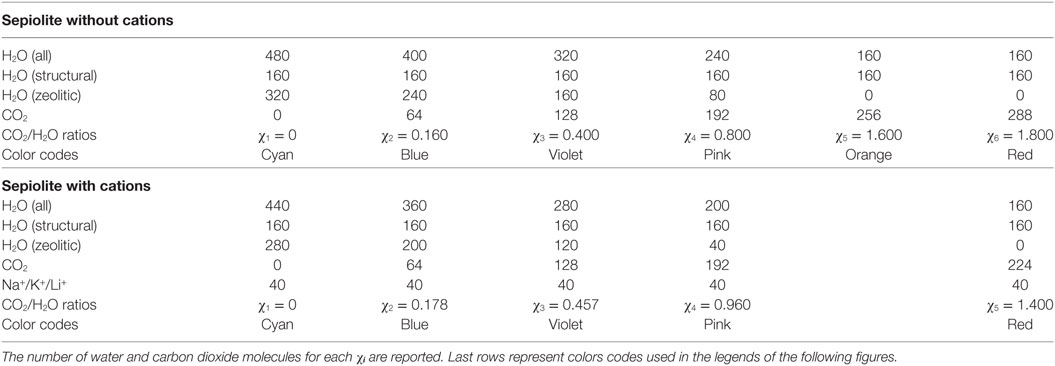
Table 1. Investigated CO2/H2O molar ratios χi inside the channels for sepiolite without cations and with them in the channels.
After that, to study the intercalation capacity of these systems toward CO2, we substituted five zeolitic H2O molecules with four carbon dioxide molecules to change the χi ratios as reported in Table 1.
After 5-to-4 substitutions have been performed (see Figure 1), the system has been let free to relax in the NVT ensemble at T = 348.15 K for 4 ns as stated in the previous section. In this way, we have employed five models to simulate different possible CO2/H2O ratios χi inside the channels of the clay mineral.
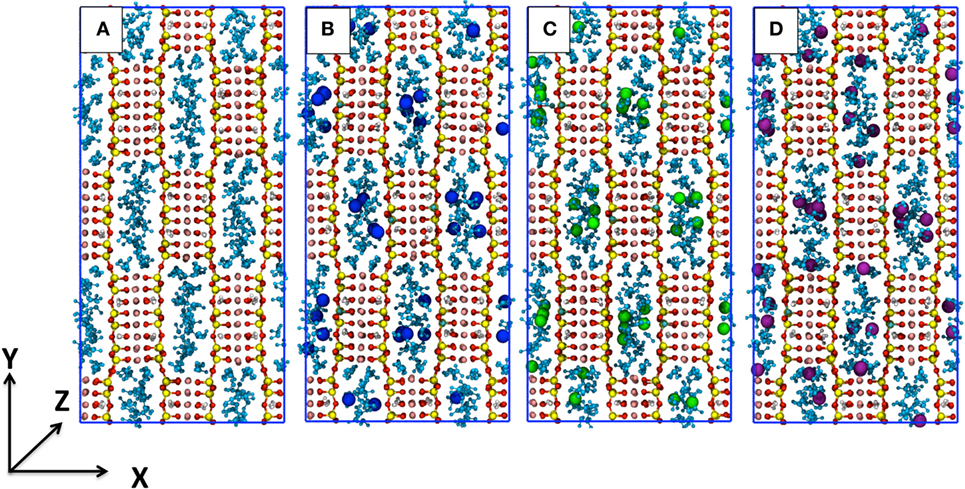
Figure 1. Representations of the simulation cells of χ1-sep with the channels completely filled with water without cations (A), with K+ (B), with Na+ (C), and with Li+ (D). Water molecules (both structural and free) are represented in light-blue, Si in yellow, Mg in pink, Al in cyan, K+ in blue, Na+ in green, Li+ in purple, and O and H atoms in red and white, respectively.
For χ1 there are only water (both structural and zeolitic) and cations and no carbon dioxide inside the cavities, whereas for χ5, the structural water remains, but most of zeolitic water has been substituted by CO2.
After the 5 ns relaxation in the NpT ensemble, a production run has been carried out for each different CO2/H2O ratio.
Results and Discussions
Energetics
To study the energetics of the H2O→CO2 replacement through the χ1 → χn models of the SEP, we have considered the following formal chemical reaction:
Here, SEP is the mineral without defects or the one that includes the Al3+ defects and the cations; H2Ostr . is the structural water inside the channels; H2Ozeol . is the zeolitic water inside the channels; is the supercritical carbon dioxide of a pure CO2 box; H2Oliq. is water of a pure H2O box. The mean energy of all the chemical species in this equation have been computed for the various integer values of n, m, and t that yield the χi models, thus allowing to plot the absorption enthalpy as a function of the CO2/H2O ratio, as shown in Figure 2.
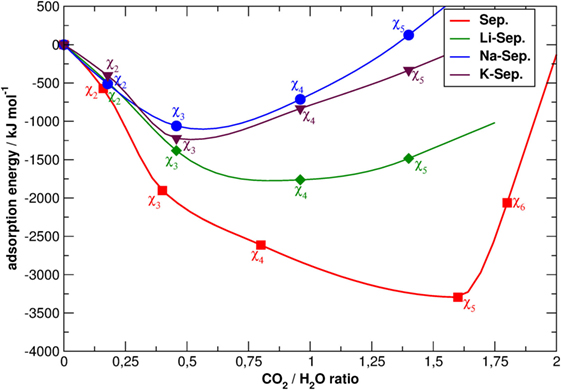
Figure 2. Absorption enthalpy as a function of the CO2/H2O molar ratio for sepiolite (SEP) with (purple for K+, blue for Na+, and green for Li+) and without cations (in red). The latter data are taken from the study by Muniz-Miranda et al. (2016). The lines are an interpolation of the triangle data sets. The χi labels refer to the models with defects.
All the energy curves of SEP with and without cations in the channels present a minimum. However, this located at the different CO2/water ratios. In all cases, the presence of cations leads to a lower intercalation capacity since obstructing the channels and establishing charge—dipolar interactions with water the substitution of the apolar carbon dioxide molecules for water molecules becomes more energetically expensive. In addition, in the presence of cations, the minimum of the energy plot of SEP is much less deep, as the energy of χ4-sep and χ5-sep is much higher than in the case of a perfect lattice. Apart from the different nature of cations–water and cations–CO2 interactions, this can also be explained considering that cations partially disrupt the CO2 double ring-like structures as previously observed in perfect SEP (Muniz-Miranda et al., 2016) and shown in Figure 3. As those structures are mainly due to attractive quadrupole–quadrupole interactions between carbon dioxide molecules, their disruption increase the energy of the simulated system.
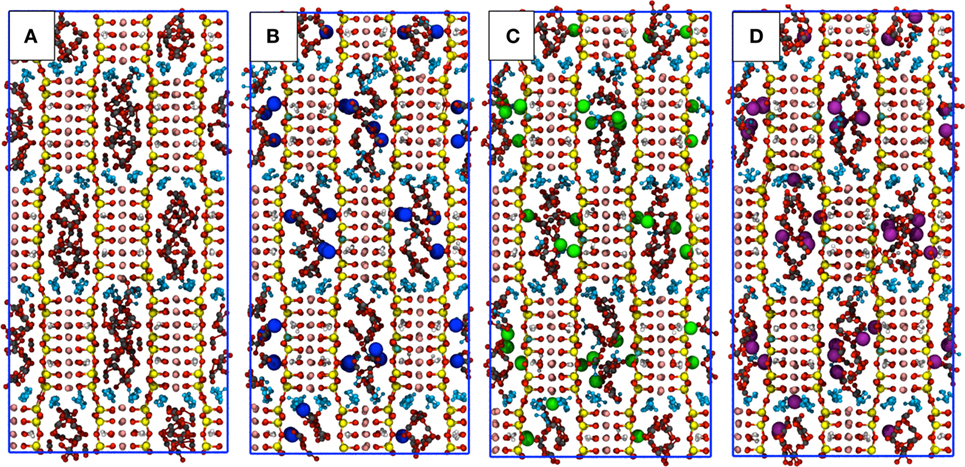
Figure 3. Snapshots of the simulation boxes of χ5-sep with the channels containing only structural water, CO2, and cations. Sepiolite (A) without cations, (B) with K+, (C) with Na+, and (D) with Li+ . The point of view is parallel to the z-axis. Atoms colors follow the CPK convention of Figure 2, with carbon atoms of CO2 in gray and oxygen atoms in dark red.
The trend of both Na-SEP and K-SEP is similar with a slightly higher propensity for K-SEP to host CO2 molecules with respect to the one with Na+, while Li-SEP has energies closer to the mineral without defects, in particular when increasing the content of CO2. The most favorable CO2/H2O ratio for both Na-SEP and K-SEP is obtained at 0.457, while for Li-SEP at approximately 0.96, but in this last case, the minimum is not well defined due to the flattening of the curve on that region.
The maximum CO2 uptake per weight of SEP is reported in Table 2. This has been computed as the ratio between the CO2 and the clay mineral mass using the energetically most favorable CO2 content. For SEP without defects, we obtained the 22% of CO2 mass over SEP mass and 5.53 mmol of CO2/g of mineral, which means that SEP without defects can capture up to 0.44 t of CO2 per cubic meter of sample. The maximum uptake of carbon dioxide is reached by Li-SEP, where 3.4 mmol of CO2 can be intercalated per gram of mineral, while K-SEP and Na-SEP can reach only 2.7 mmol of CO2/g of mineral, i.e., the half of pure SEP. Li-SEP is also able to host up to 0.33 t of CO2 per cubic meter of sample, which is the 67% more respect to K-SEP and Na-SEP.
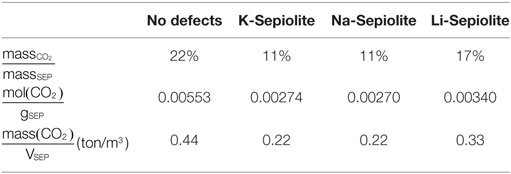
Table 2. Adsorption values for sepiolite without and with cations computed at the best CO2/H2O ratio.
Structural Features
Pair Radial Distribution Functions
Pair radial distribution functions (g(r)) have been computed for specific pairs of elements of the clay minerals with and without cations and of the molecules inside their channels. The Si-X and Al-X (X = Li, Na, K) PDFs are reported in Figure 4, the Owater-X and O(CO2)-X PDFs are reported in Figure 5, and the C(CO2)-C(CO2), C(CO2)-Owater, and Owater-Owater PDFs are reported in Figure S1 in Supplementary Material of the ESI.
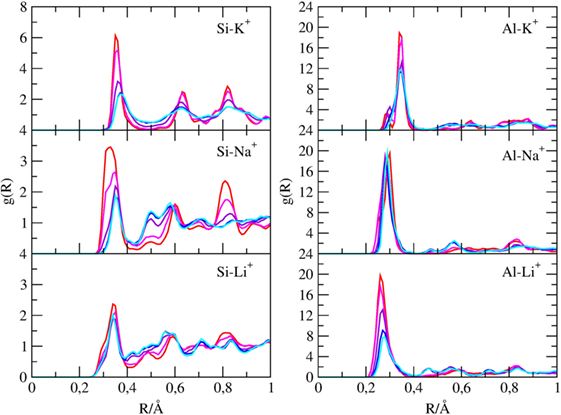
Figure 4. g(r) of silicon with cations and of aluminum atoms with cations found inside the channels of sepiolite. Each color is associated with a specific CO2/H2O ratio, as explained in Table 1.
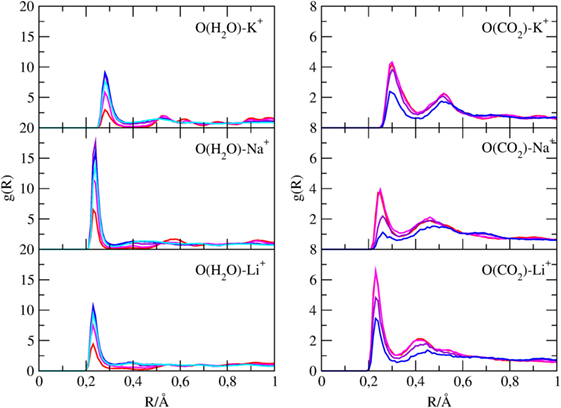
Figure 5. g(r) of water oxygen atoms with cations and of carbon dioxide oxygen atoms with cations found inside the channels of sepiolite. Each color is associated with a specific CO2/H2O ratio, as explained in Table 1.
First, the Si-X and Al-X PDFs shows that cations tend to be closer to AlO4 tetrahedra rather than SiO4 ones since the former bears a negative charge.
In fact, the Al3+-K+ PDF when channels are filled with water (χ1 ratio) shows a broad peak at 3.5 Å, which split in two peaks at 2.7 and 3.5 Å when water is replaced by carbon dioxide. Instead, the Al3+-Na+ and Al3+-Li+ present only a marked peak at 2.7 Å. Among the cations, Li+ is the one nearest to Al (distances of 2.4 Å), whereas K+ is the farthest one (distance of 2.7 Å) due to the higher VdW radius of K+.
Therefore, cations in the channels are not distributed randomly but follow the Al distribution. This latter point can be better discussed looking at Figure 3, which reports two typical snapshots of the MD simulations of χ5-sep plotted along the z-axis, which is parallel to the channels themselves. In these models, CO2 has almost completely replaced zeolitic water and arranges itself in a particular geometrical pattern inside the channels. The addition of cations completely disrupts at least one of the double rings of CO2 formed in the alkali-free SEP model, thus altering the overall structural disposition of said gas.
Figure 5 shows that oxygen atoms of both water and carbon dioxide can bind cations dispersed in the channels, showing distinct g(r) maxima. The Owater-K+ distances are around 3 Å, whereas the Owater-Na+/Li+ are around 2.5 Å. Regarding the interaction between CO2 oxygen and alkaline cations, Figure 5 reveals that CO2 interacts more strongly with Li+ than with Na+ and K+ since the Li-OCO2 distances are shorter than the Na-OCO2 and K-OCO2 ones.
This is due to the smaller ionic radius and thus on the higher ionic strength of Li+ cations that are consequently more efficient in polarizing CO2 molecules. As it will be shown in the next paragraph, this stronger interaction results in slightly different CO2 distributions in the channels.
The intensity of those peaks of CO2 and H2O follow an opposite trend with the change of the CO2/H2O ratio, as expected.
A selected set of other PDFs reported in Figure S1 in Supplementary Material of the ESI are similar to those reported in the study by Muniz-Miranda et al. (2016) and reveal that (i) structural water does not form hydrogen bonds anymore when zeolitic water is removed. In fact, the Owater…Hwater peaks at ~1.8 Å vanish when only structural water remains; on the contrary, when the channels are full of zeolitic water the hydrogen bonds peaks at ~1.8 Å are very close to that of pure water; (ii) CO2 and H2O interact weakly, as the first peak in Owater…OCO2 radial distribution functions occur at ~3 Å; (iii) CO2 molecules prefer to interact among themselves, modulating the structure and behavior of carbon dioxide in the channels as described in the following.
The coordination numbers of cations, obtained by integrating the X-O RDFs, are reported in Figures S2, S3, and S4 in Supplementary Material. They show that K+ ions interact more with SEP oxygen atoms then with water at high CO2/H2O ratios, while the trend reverses at low CO2/H2O ratios. Here, no coordination shells given by carbon dioxide have been found. A similar trend is observed for Na+ ions, but CO2 coordination appears at high CO2/H2O ratios. In the case of Li+, cations are surrounded by three CO2 molecules at high CO2/H2O ratios and by water molecules at low ratios, with a constant interaction with SEP oxygens.
Spatial Distribution of CO2 and H2O along the x and y Axes
The arrangement of the species contained in the channels of the minerals that is, cation, CO2 and H2O, can be investigated projecting their density along x axes (in our reference system, z is the axis of the canals). In Figure 6, we have projected the density of cations, as well as some atomic species belonging to CO2 and H2O molecules, along the x Cartesian axes, as defined in Figure 1.
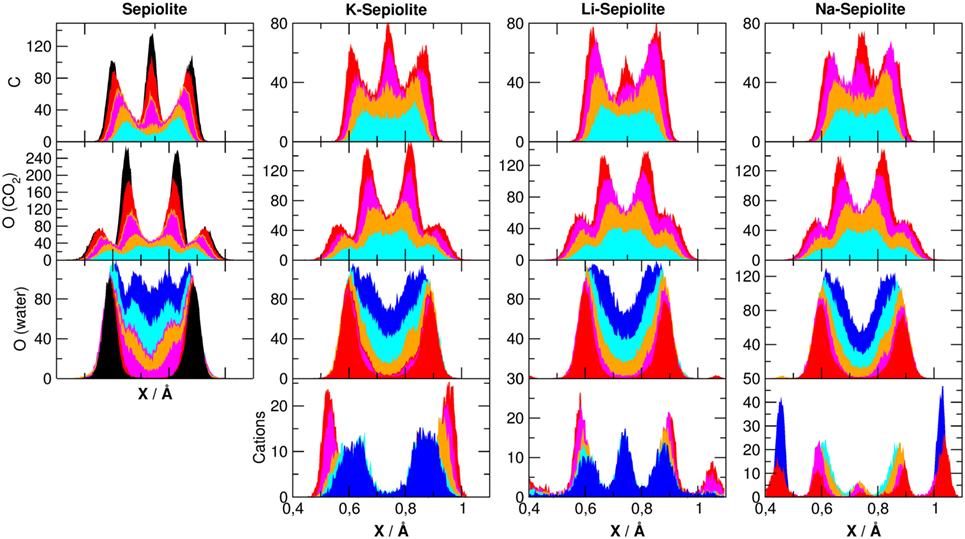
Figure 6. Averaged density distributions of atoms belonging to sepiolite along the x (upper panel) direction as defined in Figure 1. The color code of the lines is defined in Table 1. The center of each channels has been set at r = 0.75 A.
The density of silicon, oxygen (belonging to the SiO2 network), Mg, and Al is highly ordered, with very sharp peaks around the equilibrium positions of the crystal lattice as observed in the simulations without cations (Muniz-Miranda et al., 2016), and therefore, they are not been reported here, but for atoms belonging to water and carbon dioxide molecules, the picture is more complex.
For oxygen atoms belonging to water molecules, for example, we see that the distribution is critically dependent on the specific χi model, but not on the cation used: when there is plenty of water inside the channels (e.g., χ0, χ1), the projected density of water spans over the entire channel. When zeolitic water decreases and only structural water remains, we found a shift to the channel sides letting the channel center available for the CO2 molecules. By observing both the carbon and oxygen atoms of CO2, we see an increasing structuring by increasing the carbon dioxide content. In particular for carbon atoms, we found three peaks corresponding to the double ring-like structures. This is due to the fact that carbon dioxide, when entrapped inside these clays, experiences steric constraints that force CO2 in rather specific positions inside the channels. Carbon dioxide, being linear and rigid, has less possible ways to adapt inside the channels than zeolitic H2O, whose disposition is mainly driven by hydrogen bonding: as a consequence, to reside in the channels, it adopts a somewhat regular and more ordered arrangement. Moreover, as shown by the PDFs, CO2 molecules prefer to interact with each other’s rather than with water (structural and zeolitic) or the components of the lattice. This should not come as a surprise: in fact, also in montmorillonite (Myshakin et al., 2013), it has been observed that the more the space around the CO2 molecules is constrained, the more ordered they are, and vice versa. In addition, the presence of Li+ shifts the distribution of carbon atoms of CO2 from the channel center to the channel walls with respect to K+ and Na+.
The distribution of cations is peculiar. While it seems to show no definite pattern along the y-axis, on the x-axis, we can clearly see that these cations tend to clusters them on the clay surface. This is coherent with the previously mentioned observation about the increased interaction with Al3+ substituting Si4+ and also with the tendency of CO2 to occupy the center of the channels, leaving some free space only near the clay surfaces. In the cases of Na+ and Li+, we obtained that the increased amount of CO2 inside the channel shift the cations distribution to the clay surface, with a small peak in the center of the channel. This peak is enhanced in the presence of water, but it is not present for K+ where cations remain on the boundaries of the channel.
Angular Distribution of CO2 Molecules along the z-Axis
Figure 7 reports the distribution of the angle between the vector parallel to the internuclear CO2 axes and the z-axe. The orientation of each CO2 molecule (i) has been computed by exploiting the formula
with being the z component of the r(i) vector.
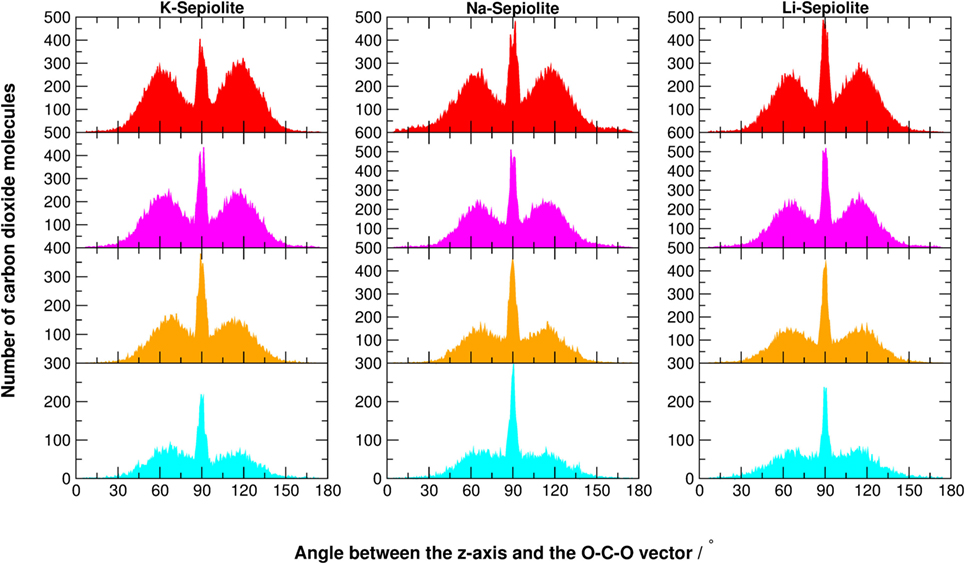
Figure 7. Angular distribution of the O-C-O vector with respect to the z-axis of K-Sepiolite, Na-Sepiolite, and Li-Sepiolite. The z-axis is perpendicular to the xy-plane shown in Figure 1. The color code of the histograms is defined in Table 1.
The structural confinement given by the mineral framework significantly alters the typical fluid distribution (of Gaussian shape), as shown in Figure 7. For SEP with cations, when there is still plenty of zeolitic water and little CO2 (cyan graphs), the distribution is still rather random, with a maximum at 90° well recognizable. As the zeolitic water content decreases and carbon dioxide fills the channels, a structured pattern appears. The maximum at 90° remains, but two other maxima at ~60 and 120° grow, as well as two minima at ~80° and 100°. This is a consequence of the steric constraints that force an increasing number of linear CO2 molecules in a very tight space. By comparing SEP with and without cations at low CO2 content, the height of the two peaks at 60 and 120° is enhanced, while the peak at 90° is strongly reduced. When increasing the number of CO2 molecules, the same trend for all SEP clays is more similar.
So, basically, the most prominent angular effect of the presence of defects in the lattice and cations in the channels is the increase of steric constraints, which in fact pushes the system toward some sort of ordered packing even with low concentration of carbon dioxide. In the absence of cations and defects, a higher content of CO2 was needed to observe such ordered patterns in the angular distributions (Muniz-Miranda et al., 2016).
Diffusion Coefficient of CO2 and Water Molecules
The diffusion coefficient (D) of CO2 and water molecules translationally moving along the channel dimension has been computed using the Einstein’s relation
where ri (t) is the position of atom ith at simulation time t and N is the total number of atoms. This method assumes a Brownian diffusion of such molecules along the channels as it is confirmed by the linear trend of MSD with time reported in Figure S5 in Supplementary Material.
The mobility of carbon dioxide inside the SEP channels, reported in Table S1 in Supplementary Material and in Figure 8, is at least three orders of magnitude lower than pure CO2 suggesting a close packing, also in the presence of several zeolitic waters. SEP without defects shows the higher mobility of CO2 molecules, followed by Li-SEP, Na-SEP, and K-SEP, where carbon dioxide has the lower mobility at all water contents, compatible with error bars. A similar trend is found for the mobility of water molecules where the SEP without defects has the highest diffusion coefficient values, followed by Li-SEP and by Na-SEP and K-SEP that have values close to each other.
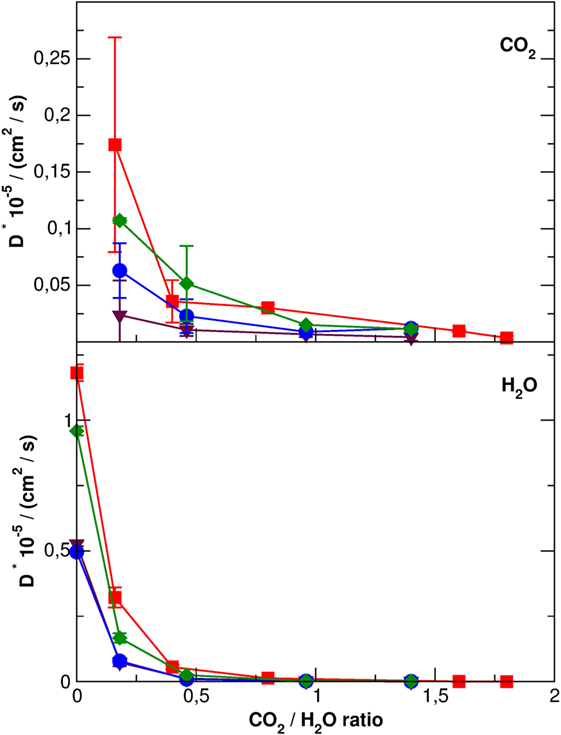
Figure 8. Diffusion coefficients with error bars of CO2 molecules (top panel) and H2O molecules (bottom panel) along the sepiolite channels. Different colors represent data for different cations: red, no cations; green, Li+; blue, Na+, and purple, K+. Error bars for H2O molecule are in the order of the graph point size.
Conclusion
In this study, the CO2 adsorbing power of SEP with and without cations inside its channels has been studied by means of MD simulations. We have observed that SEP with Li+ is able to store more CO2 inside its channels and more stably with respect to Na+ and K+, with a maximum of 3.4 mmol of CO2 per gram of mineral. However, the SEP with lithium cations has lower adsorbing power if compared to SEP without defects, which can store up to 5.53 mmol of CO2 per gram of mineral. The effect of cations is to occlude the channels with a consequent higher energetic expense to substitute water with carbon dioxide. From this point of view, SEP without cations seems the best system for carbon dioxide storage due to the higher ratio of molecules that can be physically trapped with respect to SEP with alkaline cations.
We also observed that CO2 molecules arrange themselves inside SEP channels in an ordered diamond-like shape to minimize interactions with surrounding water, as happens for pure SEP. Cations are mainly located close to the wall of the channel, and they partially disrupt the CO2 structural symmetry. Moreover, the presence of cations in SEP channels decreases the mobility of both water and carbon dioxide molecules with respect to SEP without defects.
The atomic level understanding of the interaction of CO2 with modular phyllosilicates such as SEP containing different cations in the channels can help the development of new-engineered clays for a better storage of anthropogenic CO2 molecules.
For example, a possible way to increase CO2 physical adsorption could be to deionize clays at relatively low cost by exchanging cations with ammonium that thermally desorbs in the range 100–200°C. Alternatively, one could resort to chemical adsorption by investigating the effects of alkaline earth cations such as Ca2+ and Mg2+ to promote chemical fixation through carbonation.
To this aim, the possibility to study chemical reactions should be included in the simulation procedure. This is one of the limitations of the present investigation that should be overcome in the future.
Author Contributions
FT and FM-M performed most of the simulations and wrote the manuscript. AP supervised the work. All authors read and approved the final manuscript.
Conflict of Interest Statement
The authors declare that the research was conducted in the absence of any commercial or financial relationships that could be construed as a potential conflict of interest.
Funding
This work was supported internal research grant of UniMoRE (FAR 2014) entitled “Role of modular phyllosilicates for the capture and storage of CO2: an experimental and computational investigation.”
Supplementary Material
The Supplementary Material for this article can be found online at http://www.frontiersin.org/articles/10.3389/fmats.2018.00012/full#supplementary-material.
Electronic supporting information: Supporting information contains the force field parameters for sepiolite, water, and carbon dioxide molecules; some selected radial pair distribution functions of atoms inside the sepiolite channels; the coordination number of cations with oxygen atoms; and the diffusion coefficients of water and carbon dioxide in the channels of sepiolite with and without cations.
References
Allen, M. P., and Tildesley, D. J. (1989). Computer Simulation of Liquids, Reprint Edn. Oxford: Clarendon Press.
Berendsen, H. J. C., Grigera, J. R., and Straatsma, T. P. (1987). The missing term in effective pair potentials. J. Phys. Chem. 91, 6269–6271. doi: 10.1021/j100308a038
Berendsen, H. J. C., Postma, J. P. M., van Gunsteren, W. F., DiNola, A., and Haak, J. R. (1984). Molecular dynamics with coupling to an external bath. J. Chem. Phys. 81, 3684–3690. doi:10.1063/1.448118
Block, K. A., Trusiak, A., Katz, A., Alimova, A., Wei, H., Gottlieb, P., et al. (2015). Exfoliation and intercalation of montmorillonite by small peptides. Appl. Clay Sci. 107, 173–181. doi:10.1016/j.clay.2015.01.021
Bowers, G. M., Schaef, H. T., Loring, J. S., Hoyt, D. W., Burton, S. D., Walter, E. D., et al. (2017). Role of cations in CO2 adsorption, dynamics, and hydration in smectite clays under in situ supercritical CO2 conditions. J. Phys. Chem. C 121, 577–592. doi:10.1021/acs.jpcc.6b11542
Caldeira, K., and Wickett, M. E. (2003). Oceanography: anthropogenic carbon and ocean pH. Nature 425, 365. doi:10.1038/425365a
Cygan, R. T., Liang, J.-J., and Kalinichev, A. G. (2004). Molecular models of hydroxide, oxyhydroxide, and clay phases and the development of a general force field. J. Phys. Chem. B 108, 1255–1266. doi:10.1021/jp0363287
Cygan, R. T., Romanov, V. N., and Myshakin, E. M. (2012). Molecular simulation of carbon dioxide capture by montmorillonite using an accurate and flexible force field. J. Phys. Chem. C 116, 13079–13091. doi:10.1021/jp3007574
Galan, E. (1996). Properties and applications of palygorskite-sepiolite clays. Clay Miner. 31, 443–453. doi:10.1180/claymin.1996.031.4.01
Galán, E., Aparicio, P., and Miras, A. (2011). “Chapter 16 – sepiolite and palygorskite as sealing materials for the geological storage of carbon dioxide,” in Developments in Palygorskite-Sepiolite Research Developments in Clay Science, eds E. Galàn, and A. Singer (Elsevier), 375–392. Available at: https://www.sciencedirect.com/science/article/pii/B9780444536075000165
Gunsteren, W. F. V., and Berendsen, H. J. C. (1988). A leap-frog algorithm for stochastic dynamics. Mol. Simul. 1, 173–185. doi:10.1080/08927028808080941
Hildenbrand, A., Schlomer, S., and Krooss, B. M. (2002). Gas breakthrough experiments on fine-grained sedimentary rocks. Geofluids 2, 3–23. doi:10.1046/j.1468-8123.2002.00031.x
Jorgensen, W. L., and Tirado-Rives, J. (1988). The OPLS [optimized potentials for liquid simulations] potential functions for proteins, energy minimizations for crystals of cyclic peptides and crambin. J. Am. Chem. Soc. 110, 1657–1666. doi:10.1021/ja00214a001
Kadoura, A., Narayanan Nair, A. K., and Sun, S. (2017). Molecular simulation study of montmorillonite in contact with variably wet supercritical carbon dioxide. J. Phys. Chem. C 121, 6199–6208. doi:10.1021/acs.jpcc.7b01027
Lorentz, H. A. (1881). Ueber die Anwendung des Satzes vom Virial in der kinetischen Theorie der Gase. Ann. Phys. 248, 127–136. doi:10.1002/andp.18812480110
Loring, J. S., Ilton, E. S., Chen, J., Thompson, C. J., Martin, P. F., Bénézeth, P., et al. (2014). In situ study of CO2 and H2O partitioning between Na-montmorillonite and variably wet supercritical carbon dioxide. Langmuir 30, 6120–6128. doi:10.1021/la500682t
Loring, J. S., Schaef, H. T., Turcu, R. V. F., Thompson, C. J., Miller, Q. R. S., Martin, P. F., et al. (2012). In situ molecular spectroscopic evidence for CO2 intercalation into montmorillonite in supercritical carbon dioxide. Langmuir 28, 7125–7128. doi:10.1021/la301136w
Malferrari, D., Bernini, F., Tavanti, F., Tuccio, L., and Pedone, A. (2017). Experimental and molecular dynamics investigation proves that montmorillonite traps the biogenic amines histamine and tyramine. J. Phys. Chem. C 121, 27493–27503. doi:10.1021/acs.jpcc.7b09804
Michels, L., Fossum, J. O., Rozynek, Z., Hemmen, H., Rustenberg, K., Sobas, P. A., et al. (2015). Intercalation and retention of carbon dioxide in a smectite clay promoted by interlayer cations. Sci. Rep. 5, sre08775. doi:10.1038/srep08775
Monvisade, P., and Siriphannon, P. (2009). Chitosan intercalated montmorillonite: preparation, characterization and cationic dye adsorption. Appl. Clay Sci. 42, 427–431. doi:10.1016/j.clay.2008.04.013
Muniz-Miranda, F., Lodesani, F., Tavanti, F., Presti, D., Malferrari, D., and Pedone, A. (2016). Supercritical CO2 confined in palygorskite and sepiolite minerals: a classical molecular dynamics investigation. J. Phys. Chem. C 120, 26945–26954. doi:10.1021/acs.jpcc.6b09983
Myshakin, E. M., Saidi, W. A., Romanov, V. N., Cygan, R. T., and Jordan, K. D. (2013). Molecular dynamics simulations of carbon dioxide intercalation in hydrated Na-montmorillonite. J. Phys. Chem. C 117, 11028–11039. doi:10.1021/jp312589s
National Research Council. (2010). Advancing the Science of Climate Change. Available at: https://www.nap.edu/catalog/12782/advancing-the-science-of-climate-change
Parrinello, M., and Rahman, A. (1980). Crystal structure and pair potentials: a molecular-dynamics study. Phys. Rev. Lett. 45, 1196–1199. doi:10.1103/PhysRevLett.45.1196
Parrinello, M., and Rahman, A. (1981). Polymorphic transitions in single crystals: a new molecular dynamics method. J. Appl. Phys. 52, 7182–7190. doi:10.1063/1.328693
Presti, D., Pedone, A., Mancini, G., Duce, C., Tiné, M. R., and Barone, V. (2016). Insights into structural and dynamical features of water at halloysite interfaces probed by DFT and classical molecular dynamics simulations. Phys. Chem. Chem. Phys. 18, 2164–2174. doi:10.1039/C5CP05920H
Pronk, S., Páll, S., Schulz, R., Larsson, P., Bjelkmar, P., Apostolov, R., et al. (2013). GROMACS 4.5: a high-throughput and highly parallel open source molecular simulation toolkit. Bioinformatics 29, 845–854. doi:10.1093/bioinformatics/btt055
Quéré, C. L., Moriarty, R., Andrew, R. M., Canadell, J. G., Sitch, S., Korsbakken, J. I., et al. (2015). Global carbon budget 2015. Earth Syst. Sci. Data 7, 349–396. doi:10.5194/essd-7-349-2015
Rao, Q., and Leng, Y. (2016). Molecular understanding of CO2 and H2O in a montmorillonite clay interlayer under CO2 geological sequestration conditions. J. Phys. Chem. C 120, 2642–2654. doi:10.1021/acs.jpcc.5b09683
Sánchez, M., del Río, M. S., García-Romero, E., Suárez, M., da Silva, I., Fuentes-Montero, L., et al. (2011). Variability in sepiolite: diffraction studies. Am. Mineral. 96, 1443–1454. doi:10.2138/am.2011.3761
Keywords: molecular dynamics simulations, sepiolite, carbon dioxide, alkaline cations, phyllosilicate
Citation: Tavanti F, Muniz-Miranda F and Pedone A (2018) The Effect of Alkaline Cations on the Intercalation of Carbon Dioxide in Sepiolite Minerals: A Molecular Dynamics Investigation. Front. Mater. 5:12. doi: 10.3389/fmats.2018.00012
Received: 18 January 2018; Accepted: 21 February 2018;
Published: 14 March 2018
Edited by:
Jianwen Jiang, National University of Singapore, SingaporeReviewed by:
Ravichandar Babarao, RMIT University, AustraliaSergei Noskov, University of Calgary, Canada
Copyright: © 2018 Tavanti, Muniz-Miranda and Pedone. This is an open-access article distributed under the terms of the Creative Commons Attribution License (CC BY). The use, distribution or reproduction in other forums is permitted, provided the original author(s) and the copyright owner are credited and that the original publication in this journal is cited, in accordance with accepted academic practice. No use, distribution or reproduction is permitted which does not comply with these terms.
*Correspondence: Alfonso Pedone, YWxmb25zby5wZWRvbmVAdW5pbW9yZS5pdA==
†Present address: Francesco Muniz-Miranda, Ghent University, Center for Molecular Modeling (CMM), Zwijnaarde, Belgium