- 1Department of Mathematics, City, University of London, London, United Kingdom
- 2Centre for Social Data Science, University of Copenhagen, Copenhagen, Denmark
- 3The Alan Turing Institute, British Library, London, United Kingdom
- 4UCL Centre for Blockchain Technologies, University College London, London, United Kingdom
The production and consumption of information on Bitcoin and other digital-, or crypto-, currencies have grown, along with their market capitalization. However, a systematic investigation of the relationship between online attention and market dynamics across multiple digital currencies is still lacking. Here, we quantify the interplay between the attention to digital currencies in Wikipedia and their market performance. We consider the entire edit history of currency-related pages and their views history from July 2015. First, we quantify the evolution of cryptocurrency presence in Wikipedia by analyzing the editorial activity and the network of co-edited pages. We found that a small community of tightly connected editors are responsible for most of the production of information about cryptocurrencies in Wikipedia. Then, we show that a simple trading strategy informed by Wikipedia views, performs better than baseline strategies, in terms of returns on investment, for most of the covered period, although the “buy and hold strategy” dominates during the periods of explosive market expansion. Our results contribute to the recent literature on the interplay between online information and investment markets, and we anticipate that it will be of interest for researchers as well as investors.
1. Introduction
The cryptocurrency market grew super-exponentially for more than 2 years until January 2018, before suffering significant losses in the subsequent months (ElBahrawy et al., 2017). The consequence and driver of this growth is the attention it has progressively attracted from an increasingly larger public. In this paper, we quantify the evolution of the production and consumption of information concerning the cryptocurrency market as well as its interplay with market behavior. Capitalizing on recent results showing that Wikipedia can be used as a proxy for the overall attention on the web (Yoshida et al., 2015), our analysis relies on data from the popular online encyclopedia.
The first peer to peer currency system, Bitcoin, was created in 2009 as a realization of Satoshi Nakamoto's novel idea (Nakamoto, 2008) of a digital currency. The system relies on the Blockchain technology and was built to introduce a transparent, anonymous, and decentralized digital currency. In the beginning, Bitcoin attracted technology enthusiasts, open source advocates, and whoever may need fewer restrictions on across country money transfers. In less than 10 years, Bitcoin gained popularity and was joined by more than 2, 000 cryptocurrencies1. Some of these cryptocurrencies (altcoins) are replicas of Bitcoin with small changes in terms of protocols and implementation, while others adopted entirely different protocols.
Although cryptocurrencies were first introduced as a media of exchange for daily payments (Ali et al., 2014), they are increasingly used for speculation (Glaser et al., 2014). Cryptocurrencies can be traded in online exchange platforms and extensive research has looked at the nature and main usages of Bitcoin, specifically in the hope of finding some hints on the price drivers (Kristoufek, 2015; Ciaian et al., 2016; Elendner et al., 2016; Gandal and Halaburda, 2016; Wang and Vergne, 2017; Gajardo et al., 2018; Guo and Antulov-Fantulin, 2018). Comparisons between cryptocurrencies exchange market and the stock market (Ali et al., 2014; Ceruleo, 2014) or fiat currencies (Yermack, 2013) have been drawn, in an attempt to rationalize the market and its price movements.
Social media platforms nowadays provide researchers with a vast amount of data that can signal public opinions or interests. Since stock markets are highly influenced by the rationale of investors and their interests, several studies investigated the link between online social signals and stock market prices. Pioneering studies showed how signals from Google trends and Wikipedia (Moat et al., 2013; Preis et al., 2013) or Twitter sentiment (Bollen and Mao, 2011; Curme et al., 2014) can help anticipate stock prices.
This approach has recently been extended to investigate the relationship between social digital traces and the price of Bitcoin (Kristoufek, 2013; Garcia et al., 2014; Colianni et al., 2015; Kim et al., 2016, 2017; Phillips and Gorse, 2017, 2018a; Stenqvist and Lönnö, 2017; Dickerson, 2018), or a few top cryptocurrencies (Phillips and Gorse, 2018a). While these studies showed the importance of relying on different digital sources, a systematic investigation of multiple cryptocurrencies has been lacking so far. Furthermore, only in a few cases (Colianni et al., 2015; Garcia and Schweitzer, 2015; Dickerson, 2018), mostly centered on Bitcoin, the analysis incorporated social media signals into an investment strategy in the spirit of the work in Moat et al. (2013).
Here, we investigate the interplay between the consumption and production of information in Wikipedia and market indicators. Our analysis focuses on all cryptocurrencies with a page on Wikipedia, from July 2015 until January 2019. The article is organized as follows: In “State of the art,” we overview the literature on cryptocurrencies and the online attention toward them; in “Data collection and preparation,” we describe the datasets and the pre-processing techniques; in “Results,” we present the results of our analysis. Namely, we study the interplay between cryptocurrencies' “Wikipedia pages and market properties”; we study in detail the “Evolution of cryptocurrency pages”; we investigate the “Role of editors” of cryptocurrency pages, and, finally, we explore “An investment strategy based on Wikipedia traffic.”
2. State of the Art
Two main approaches have been suggested to anticipate Bitcoin and cryptocurrency prices. The first relies on market indicators only and uses mostly algorithmic trading and machine learning algorithms to predict prices (Chang et al., 2009; Madan et al., 2015; Alessandretti et al., 2018; Jang and Lee, 2018). The second relies instead on users' data generated online, including Google search trends, Wikipedia views and Twitter data, to predict and rationalize price fluctuations. Although the relevance of altcoins has been increasing (ElBahrawy et al., 2017), most research has focused on the most notable cryptocurrencies only.
Google search trends, Wikipedia views, and Twitter data were found to correlate positively with Bitcoin prices (Kristoufek, 2013; Garcia et al., 2014; Kaminski, 2014; Colianni et al., 2015; Matta et al., 2015). Comments and replies on Bitcoin2, Ethereum3, and Ripple forums4 were found to anticipate their respective prices (Kim et al., 2016). Similar results were obtained considering data from the social news aggregator Reddit, for Bitcoin, Litecoin, Ethereum, and Monero (Phillips and Gorse, 2017, 2018b). In Kristoufek (2015) and Phillips and Gorse (2018a), the authors showed a positive correlation between multiple online signals and the prices of Bitcoin, Litecoin, Ethereum, and Monero.
The connection between Bitcoin prices and online social signals has allowed the development of successful trading strategies (Garcia and Schweitzer, 2015; Kim et al., 2017; Dickerson, 2018; Zornić et al., 2018). In Kim et al. (2017) the authors used a deep learning algorithm and data from Wikipedia, Google search trends, Bitcoin forum2, and a cryptocurrency news website5 to anticipate Bitcoin prices.
Research focusing on the nature of community discussions and the activity of contributors is very limited. In Jahani et al. (2018), the authors analyzed data from the forum “bitcointalk”2 and showed that there are two clear groups of contributors: Investors, who are driving the market hype, and technology enthusiasts, who are interested in the advancement of the cryptocurrency system.
3. Data Collection and Preparation
Wikipedia data was collected through the Wikipedia API6 and include the daily number of views and the page edit history of the 38 cryptocurrencies with a page on Wikipedia (see Supplementary Material S1).
Page-view data range from July 1st, 2015 until January 23rd, 2019, since earlier data are not accessible through the API. On the other hand, full editing history is accessible through the API, and includes the content of each edit, the editor, the time of creation and the comments to the edits. Repetitive tasks to maintain pages are often carried out by automated tools known as “bots”. Wikipedia requires bots to have separate accounts and names which include the word “BOT,” in order to make their edits identifiable. We excluded all edits from bots from our analysis.
We classified edits into two categories, namely edits with new content and maintenance edits. Maintenance edits aim to keep consensual page content by restoring more accurate old version (reverts) and fighting malicious edits (vandalism). We identified reverts by selecting edits comments containing the word “rv” or “revert” (Kittur et al., 2007b), and by creating an MD5 hashing scheme (Rivest, 1998) to identify identical files. We created an MD5 hash for all edits, and we identified edits sharing the same hash with a previous edit as reverts. Reverts which were made specifically to fight vandalism were identified by selecting edits labeled in their associated comment as “vandalism” (Kittur et al., 2007b). We considered all edits, that were neither classified as vandalism nor reverts, as new content.
We also collected data on the activity of the most active editors in other Wikipedia pages. To retrieve this data, we used Xtool7, a web tool that provides general statistics on the editors and their most edited pages.
Market data include daily price, exchange volume, and market capitalization of cryptocurrencies, all of which were collected from the “Coinmarketcap” website1. The price of a cryptocurrency represents its exchange rate (with USD or Bitcoin, typically) which is determined by the market supply and demand dynamics. The exchange volume is the total trading volume across exchange markets. The market capitalization is calculated as a product of a cryptocurrency's circulating supply (the number of coins available to users) and its price. The market share is the market capitalization of a cryptocurrency normalized by the total market capitalization of the market. Price and market capitalization data is only available from April 28th, 2013, while volume data is available from December 27th, 2013.
The Wikipedia-based investment strategy we implement in this paper can be applied only to “marginally traded” cryptocurrencies. We compiled a list of 17 such cryptocurrencies from active exchange platforms including Poloniex and Bitfinex (see Supplementary Material S2). Note that these are also the most widely traded currencies1. In our analysis, we consider that cryptocurrencies can be traded once their trading volume exceeds 100,000 USD. We excluded days where the reported volume did not lie within 2 standard deviations from the average trading volume, which are likely due to how market exchanges report their exchange volumes8.
4. Results
4.1. Wikipedia Pages and Market Properties
In this section, we investigate the connection between a cryptocurrency performance in the market and the attention it attracts on Wikipedia. Wikipedia is the 5th most visited website on the Internet9, attractive to a non-expert audience seeking compact and non-technical information. Previous work has shown that Wikipedia traffic can help to predict stock market prices (Moat et al., 2013).
The number of cryptocurrency pages on Wikipedia has grown along with their overall market capitalization. In August 2005, Ripple became the first cryptocurrency with a page. At that point, it was not identified as a cryptocurrency, but as the idea of a monetary system relying on trust. Bitcoin appeared only in March 2009, followed by other 36 currencies (see Figure 1). The number of views received daily by a Wikipedia page is a good proxy for the overall attention on the web (Yoshida et al., 2015). We find that the number of views to cryptocurrency pages has increased overall from 2015 until January 2018 (see Figure 2). In 2016, the 23 cryptocurrency pages were viewed ~4·106 times. While in 2017, 34 cryptocurrencies pages received ~16·106 views. In 2018, the sudden drop in cryptocurrency prices impacted the number of views. The total number of views received by 38 cryptocurrency pages in 2018 was ~9·106. A second aspect characterizing the evolution in time of Wikipedia pages is their edit history. We find that, on average, pages are more edited than in the past. Cryptocurrency pages (38 pages) were edited ~5·103 times in 2018. In 2016, the 23 cryptocurrency Wikipedia pages were edited a total of ~2·103 times (see Figure 2). Bitcoin, in 2016 was the most viewed cryptocurrency page, with a view and edit share of ~%74 and ~%37 over all other cryptocurrency pages, respectively. However, these numbers dropped to ~%46 and ~%16 in 2018. The fraction of editors active on Bitcoin's page over all other cryptocurrency pages has also dropped from ~34% in 2016 to 10% in 2018. On the other hand, the fraction of views to the 5 most visited pages compared to all other cryptocurrencies has grown from ~%20 in 2016 to ~%27 in 2018.

Figure 1. Cryptocurrencies on Wikipedia. Evolution in time of the cumulative number of cryptocurrencies with a Wikipedia page.

Figure 2. Market volume and attention to cryptocurrency pages. The market volume (USD) for all cryptocurrencies with a page in Wikipedia (solid blue line), the total number of views to cryptocurrency pages (solid orange line), and the total number of edits to cryptocurrency pages (solid green line). Values are aggregated using a time window of 3 months.
Interestingly, Bitcoin's share of the total market capitalization declined during the same period (ElBahrawy et al., 2017) suggesting a possible connection between the properties of the market and the evolution of attention for cryptocurrencies (see Figure 3A). We tested this connection considering all cryptocurrencies (see Figure 3B) and focused on other market properties. We found that there is a positive correlation between the average share of views and (i) the average price (Spearman correlation ρ = 0.37, p = 0.02), (ii) the average share of volume (Spearman correlation ρ = 0.71, p < 10−7), and (iii) the average market share (Spearman correlation ρ = 0.71, p < 10−6) of a cryptocurrency. Moreover, these correlations are robust in time (see Supplementary Material S3).
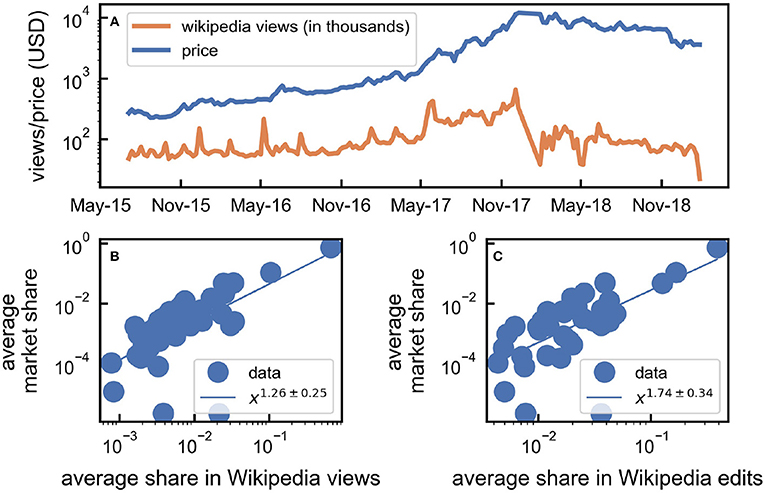
Figure 3. Overall correlation between attention on Wikipedia and market performance. (A) The temporal evolution of price (blue line) and number of Wikipedia views (orange line) for Bitcoin. Values are computed using a time window of 1 week. (B) Average market share in USD vs. the average Wikipedia views share. Each dot is a different cryptocurrency (Spearman correlation ρ = 0.71, p < 10−6). The solid line represents a power law fit of the data with exponent β = 1.26 ± 0.25. (C) Average market share vs the average Wikipedia edits share (Spearman correlation ρ = 0.68, p < 10−5). The solid line represents a power law fit of the data with exponent β = 1.74 ± 0.34.
We also found that the average share of edits of a currency is connected to the overall cryptocurrency performance in the market (see Figure 3C). We observed a positive correlation between the average fraction of edits and (i) the average price of a given currency (Spearman correlation ρ = 0.38, p = 0.017), (ii) the average share of exchange volume for a given currency (Spearman correlation ρ = 0.67, p < 10−6), and (iii) its market share (Spearman correlation ρ = 0.68, p < 10−5). These correlations are robust in time (see Supplementary Material S3).
Note that the observed correlations suggest only a connection between the relative attention to a given currency and its market properties relative to other currencies. Granger causality tests (see Supplementary Material S4), do not allow for one to conclude that changes in Wikipedia views explain changes in prices for individual currencies (the test is passed at p < 0.05 by 5 currencies out of 17).
4.2. Evolution of Cryptocurrency Pages
The demonstrated connection between cryptocurrency's success in the market and the overall consumption of information on Wikipedia sheds light on the important role of the latter. In the following sections, we focus on the production of information contained in Wikipedia pages, by analyzing the evolution of cryptocurrency pages and the role played by Wikipedia editors.
Frequency of edits and editor diversity is considered reliable indicators of the quality of information included in a Wikipedia page (Stvilia et al., 2005). Cryptocurrency pages differ with respect to their edit history (see Figure 4). Some pages, including those of Bitcoin and Ethereum, experience continuous edits throughout their history, while for other pages, including Dash and Cardano, contributions are intermittent in time, with periods of higher activity followed by calmer ones. For example, the change of the Dash logo in April 2018 triggered a spike in the number of edits.
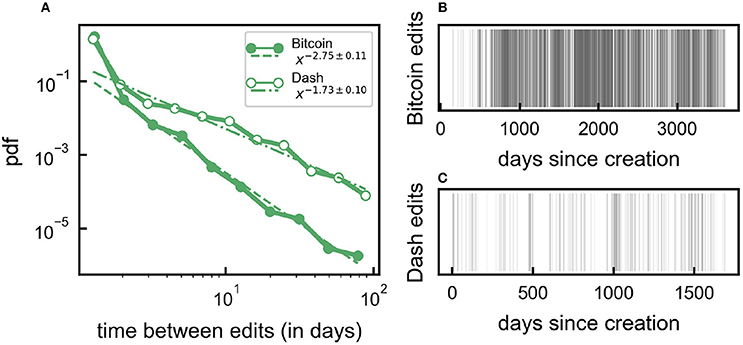
Figure 4. Example of edit histories. (A) Distribution of the inter-event time between two consecutive edits for Bitcoin (line with filled circles) and Dash (line with white circles). The dashed line is a power-law (P(x) ~ x−β) with exponents β = 2.75 and β = 1.73 for Bitcoin and Dash, shown as a guide to the eye. Edits are shown as vertical black line as a function of time for Bitcoin (B) and Dash (C).
The nature of edits changes over a Wikipedia page life. While at the beginning, editors focus largely on new content, as the page ages more efforts are dedicated to fighting vandalism and misinformation (maintenance work) (Viégas et al., 2004; Kittur et al., 2007b). We quantify maintenance work by looking at “reverts,” edits that restore a previous version of the page, and at the number of edits reporting vandalism. We find that reverts constitute 18.2% of all edits, and that, on average, they constitute 15.3% ± 4.5 of contributions to a cryptocurrency page. The fraction of reverts is stable in time (see Figure 5A). Cryptocurrency pages experience higher rates of reverts than an average page in Wikipedia (8% of the edits at the end of 2016, see Supplementary Material S5 for more details on the comparison10), suggesting there is more debate around their content. Only 0.5% of edits were reported as acts of vandalism and their occurrence is constant in time since mid 2011 (see Figure 5A). Well-established cryptocurrency pages are less subject to maintenance edits than other pages (see Figures 5B,C). Pages of cryptocurrencies forked from Bitcoin such as Bitcoin Cash, Bitcoin Private, and Bitcoin Gold were the source of many debates (Caffyn, 2015) resulting in a high number of maintenance edits (see Figure 5B).
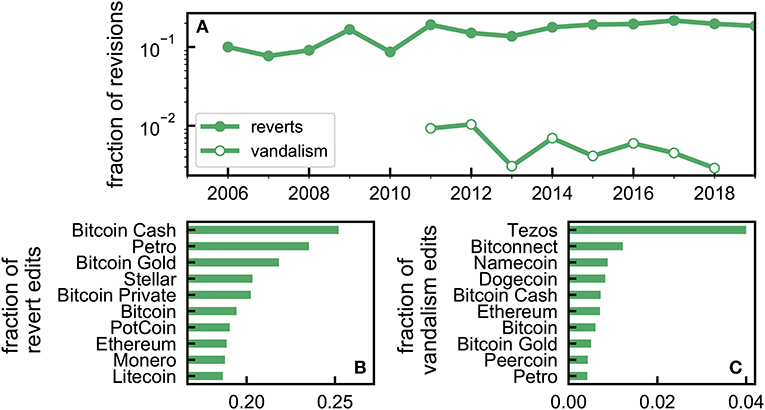
Figure 5. Reverts and vandalism revisions. (A) The fraction of “revert” edits (line with filled circles) and edits reported as vandalism (line with white circles) over time. Values are aggregated using a time-window of 1 year. (B,C) The fraction of reverts (B) and vandalism (C) edits for the top 10 cryptocurrencies sorted by number of reverts and vandalism edits, respectively.
4.3. Role of Editors
Our dataset includes ~6, 170 editors who contributed ~29, 000 total edits. Although the number of new editors/year fluctuates (see Figure 6B, and Supplementary Material S7), the number of editors has increased overall from 2006. Only in 2017, when 10 new cryptocurrency pages were created, did ~1, 200 new editors join. Interestingly, this growth does not characterize all pages on Wikipedia. For example, in Heilman and West (2015), the authors show that the number of editors in medical related articles has been decreasing.
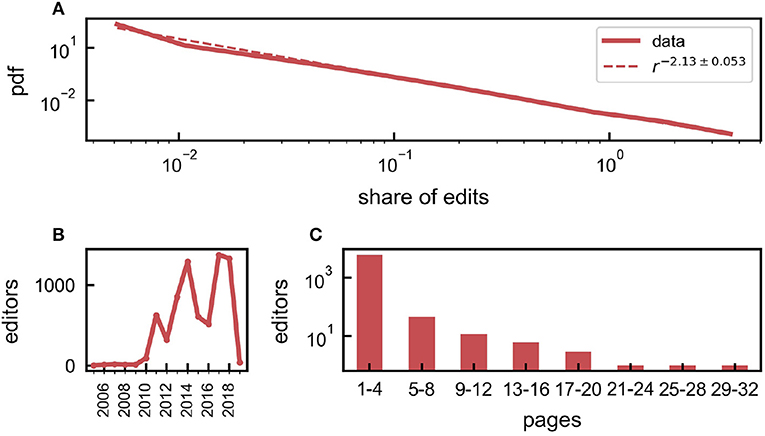
Figure 6. Uneven distribution of contributions of Wikipedia editors. (A) Distribution of share of edits between 2005 and 2018 (red solid line). The dashed line is a power-law fit (P(r) ~ r−β) with exponent β = 2.135 ± 0.053, shown as a guide to the eye. (B) The number of editors contributing to cryptocurrency pages. Values are aggregated using 1-year time window. (C) Histogram of editors based on the number of Wikipedia pages they have contributed.
The editing activity is heterogeneously distributed, as found by ranking the editors according to the number of edits (see Figure 6A). This result is in line with what is generally observed in Wikipedia (Muchnik et al., 2013), and is consistent across time (see Supplementary Material S6). In particular, the most active editor alone is responsible for ~10% of the edits (see Supplementary Material S8 for more details on the most active editor) and only ~9.6% of the editors (596) have edited at least 2 pages (Figure 6C). This group is responsible for 50% of the total number of edits for all Wikipedia cryptocurrency pages.
We then studied the evolution of editors' activity in time. We classified editors into four groups based on their total number of edits at the end of the study, in January 2019 (see Figure 7): Contributors who made more than or equal to 500 edits (6 editors, responsible for 23% of edits), contributors who made 100 to 500 edits (23 editors, responsible for 15% of edits), contributors who made 20 to 100 edits (142 editors, responsible for 19% of the edits), and editors who made less than 20 edits (97% of editors, responsible for 43% of the edits). We found that the higher the cumulative activity of a group, the more recently they started editing the pages (see Figure 7), in contrast to what is generally observed on Wikipedia (Kittur et al., 2007a; Panciera et al., 2009). Note that the group of most active contributors started editing in August 2012, 3 years after the creation of Bitcoin's page. Furthermore, Figure 8 shows that editors with the largest number of edits are responsible for the most extensive contributions in terms of the number of edited words. Some of their edits, however, may be for maintenance. By ranking editors in descending order according to their total number of edits made across the entire period of the study, we found that, for the top 10 contributors, maintenance edits amount to 20% of their edits. On average, ~18% of the edits made by the top 250 editors are maintenance work (see Figure 9A). This value is consistent among different ranking groups. Finally, top ranked editors tend to contribute in more than one page (see Figure 9B), on average ~4 pages.
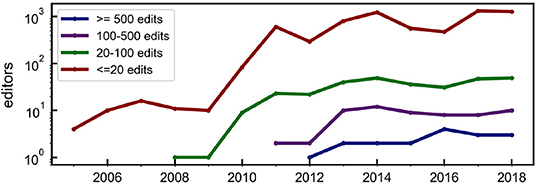
Figure 7. Active editors per group. The number of active editors per group from 2005 until 2018. Results are computed using a temporal window of 1 year. Editors are divided into four groups based on their total number of edits: More than 500 edits (blue line), 100 to 500 edits (purple line), 20 to 100 edits (green line), less than 20 edits (red line). Editors were classified according to their total contributions at January 23rd 2019, then traced back.

Figure 8. The activity of editors in different groups. The average number of words per editor. All results are computed over a temporal window of 180 days between August 2005 and January 2019. The four lines represent four groups of editors: those who contributed more than 500 total edits (blue line), 100 to 500 edits (purple line), 20 to 100 edits (green line), less than 20 edits (red line).
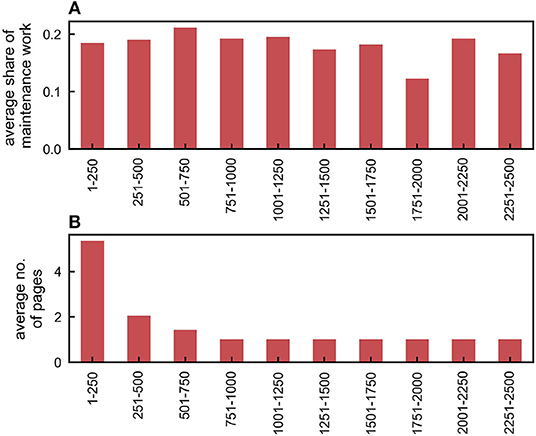
Figure 9. The focus of editors. Editors are ranked based on the total number of edits in descending order and grouped based on their rank. (A) The fraction of maintenance edits for each rank group. (B) The average number of contributed pages for each rank group. Only editors with more than one edit are considered.
To understand the general interests and the specialization of the top editors of the cryptocurrency Wikipedia pages, we focused on a subset of 6 editors that have contributed at least 500 edits each. We studied their interests in detail, considering their contribution over the entire Wikipedia. Our results showed that the main interests of these editors are cryptocurrencies and blockchain (see Figure 10). Results are consistent when we extend the analysis to the top 29 editors, who are responsible for 37% of the edits. Top editors also contribute in other non-cryptocurrency related pages; however, these pages are less homogeneous and include several different interests such as; genetically modified food, musicians, and motor companies (see Supplementary Material S4).
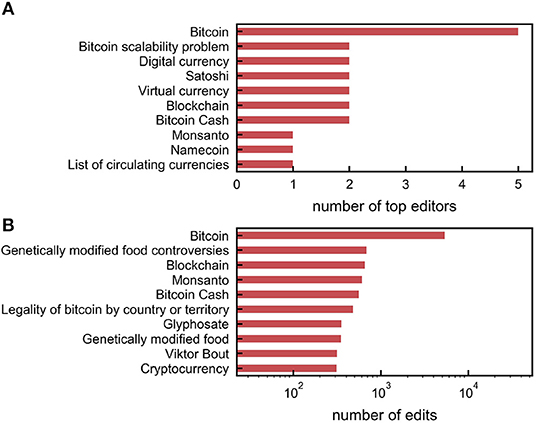
Figure 10. The activity of the top 6 cryptocurrency pages editors. (A) The top 10 pages by the number of editors. The x-axis shows the number of top editors who had this page in their top edited pages. Note that here we consider only the top 10 pages per editor. (B) The top 10 pages by the number of edits. The x-axis shows the total number of edits per page. Results are obtained for the subset of 6 most active editors.
We further studied the network of co-edited Wikipedia pages. We constructed an undirected weighted graph, where the nodes are Wikipedia pages; an edge exists between two nodes if they have at least one common editor, and link weights correspond to the number of common editors. By the end of July 2014, the network had 13 nodes (see Figure 11B) and the average node weighted degree was 〈s〉 = 78.3 with a total of 2691 editors. The weighted degree was heterogeneously distributed: Bitcoin had the largest strength, sBTC = 207, while recently introduced nodes (Dash, Auroracoin, and Nxt) had the lowest weighted degree. These properties have persisted in time (see Figures 11C,D) and a cryptocurrency page age is positively correlated with its network weighted degree (Pearson correlation ρ = 0.40, p = 0.015, see Supplementary Material S9). Bitcoin has the highest degree of centrality throughout the entire period considered (see Supplementary Material S9).
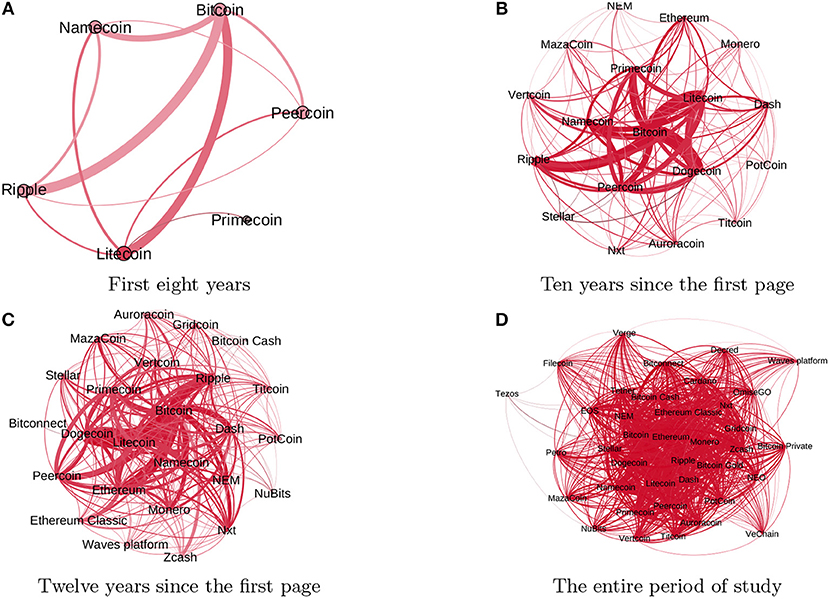
Figure 11. Evolution of the network of cryptocurrency pages. Nodes represent Wikipedia pages and edge exist between two nodes if they have at least one common editor. The radius of a node is proportional to the sum of weights of incoming links and the edge thickness is proportional to the edge weight, measured as the number of common editors. The network is aggregated over a different period of times: (A) from July 2005 until July 2013, (B) from July 2005 until July 2015, (C) from 2005 until July 2017, (D) for the entire period of study.
A giant component (see Figure 11) emerged in the network, implying that each node is connected to all other nodes when we analyzed its evolution under large time-windows (~ years). If weekly time windows are considered instead, we find that the network is disconnected (see Figure 12). Typically, new pages are created by new editors. On average, new pages connect to the giant component within 5.2 weeks from creation (see Figure 12), in most cases thanks to experienced editors who contribute the newly created page.
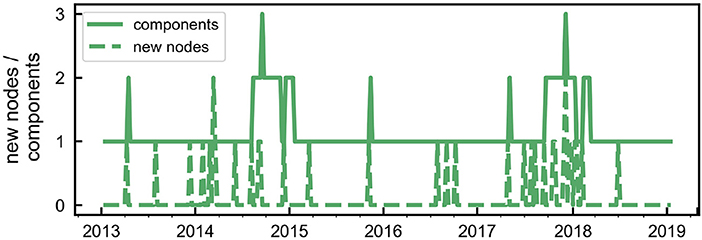
Figure 12. Short-term dynamics of the Wikipedia network evolution. The cumulative number of new nodes (dashed line) and the total number of network components (solid line). Values are aggregated using a 1 week time window.
4.4. An Investment Strategy Based on Wikipedia Attention
The demonstrated connection between how successful a cryptocurrency is and the attention it draws on Wikipedia suggests that the latter could help in informing a successful investment strategy. We investigated this possibility by testing a Wikipedia-based strategy similar to the one proposed in Moat et al. (2013) and Preis et al. (2013) for stock markets investments.
For a given page and a given day t, the Wikipedia investment strategy relies on the difference Δn(t) = v(t) − v(t − 1) between the number of page views v(t) at day t and the number of views v(t − 1) at t − 1. According to the strategy, if Δn(t) > 0, the investor sells the asset (at price p(t + 1)) at time t + 1 and then buys at time t + 2 (at price p(t + 2)). This trading position is formally known as a short position. On the other hand, if Δn(t) ≤ 0 the investor buys at time t + 1 (at price p(t + 1)) and sells at time t + 2 (at price p(t + 2)), known as a long position. We considered the closing price and the total number of views calculated over the entire day. The intuition behind the strategy is that if attention and information gathering has been rising, prices will drop, and vice-versa (Tversky and Kahneman, 1991; Moat et al., 2013). We consider Wikipedia views rather than edits, since the latter do not vary on a daily basis (the average time between edits is 10.12 days). We also consider that a longer period would overlook the cryptocurrencies' price volatility (Brauneis and Mestel, 2018). Here, we assume that investor influence is negligible, e.g., they will be “price-takers” (Fama, 1972).
We also considered three baseline strategies. The first is based on the price difference Δp(t) = p(t) − p(t − 1) rather than the page view difference Δn(t) (Alessandretti et al., 2018). In all other aspects, it is identical to the Wikipedia-based strategy. This will allow us to test which indicator (price or Wikipedia page views) has better predictive capabilities under the same conditions. The rationale behind the first baseline strategy is that if the price has been rising, a drop will follow, and vice-versa. As a second baseline, we chose a random strategy, where, at every time t, one chooses either to buy or to sell an asset with 50% probability (Moat et al., 2013). Finally, we tested a “buy and hold” strategy (see also Preis et al., 2013), implemented by buying all currencies in the beginning of a period (or when they are born) and selling them at the end of the period under study.
The performance of the different strategies is assessed by computing the cumulative return R, defined as the summation of log-returns obtained under the proposed strategies. When Δn(t) > 0 the log-return is computed as log(p(t + 1)) − log(p(t + 2)), while, in the opposite case, the log-return is log(p(t + 2)) − log(p(t + 1)). The use of the log return is motivated by the ease of calculation of the short and long positions and since we are considering multi-period returns (Hudson and Gregoriou, 2015).
We tested the Wikipedia-based strategy against the baselines for the 17 cryptocurrencies that have a Wikipedia page and can be marginally traded (see list of exchanges with margin trading support in Supplementary Material S2 and list of cryptocurrencies in Supplementary Material S1). Margin trading is a practice of borrowing funds from a broker to trade financial assets, that rely on selling assets one does not yet own. We tested the strategies considering a period from July 1st, 2015 until January 23rd, 2019.
We found that the Wikipedia based strategy outperforms the price based and the random baseline strategies, when one considers the period between July 2015 and January 2018 (see Figure 13A). However, it outperforms the “buy and hold” strategy only up to January 2017, when the explosive growth of the market made holding extremely profitable. On average, the return obtained following the Wikipedia based strategy is 〈rw〉 = 0.62 ± 0.42, while the average return obtained under the random strategy is 〈rr〉 = −0.15 ± 0.13 (see Figure 13B). The distributions of returns obtained under the two strategies are significantly different under Kolomogorov-Smirnov test, with p≪0.05. The price baseline strategy produces lower mean returns compared to the Wikipedia strategy (〈rp〉 = 0.16 ± 0.36). To evaluate the risk factor in the three strategies, we calculated the Sharpe ratio. The Sharpe ratio is defined as
where represents the average annual return and SR the standard deviation of the annual returns. We found that the Wikipedia based strategy yields a Sharpe ratio Sw = 0.066, higher than the ones obtained under the baseline strategies: Sp = −0.022 and Sr = −0.799 for the price and random strategy respectively. However, the Sharpe ratio of the Wikipedia strategy does not consistently outperform the baseline strategies along the entire period of study (see Supplementary Material S10).
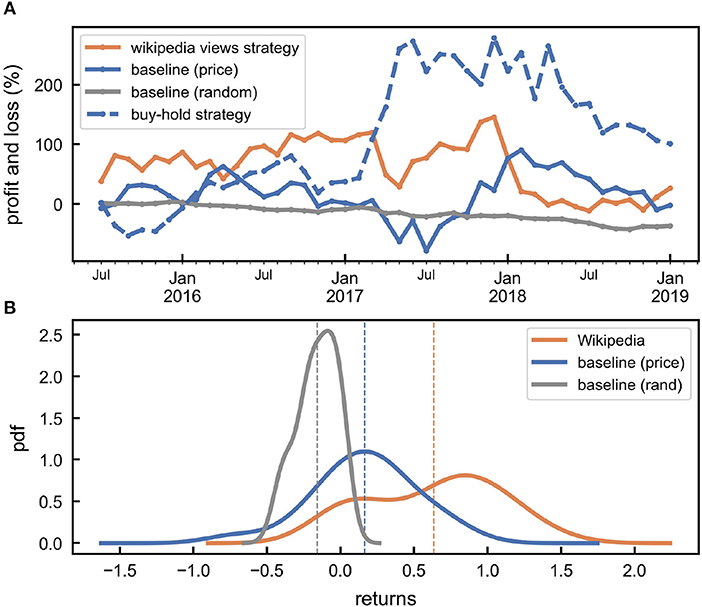
Figure 13. The Wikipedia based investment strategy outperforms the baselines. (A) The cumulative return obtained using four investment strategies: the Wikipedia-based strategy (orange line), the baseline strategy based on prices (blue solid line), the “buy and hold” strategy (blue dashed line), and the random strategy (gray line). (B) The distributions of the daily returns obtained using the Wikipedia-based strategy (orange line), the baseline strategy based on prices (blue line), and the random strategy (gray line). The average returns are 〈rw〉 = 0.62 ± 0.42 (dashed orange line), 〈rp〉 = 0.16 ± 0.36 (dashed blue line), 〈rr〉 = −0.15 ± 0.13 (dashed gray line) for the Wikipedia-based strategy, the price based baseline, and the random strategy, respectively. Data is displayed using a kernel density estimate, with a Gaussian kernel and bandwidth calculated using Silverman's rule of thumb. Data for the random strategy is obtained from 1000 independent realizations. All results are shown for investments between July 2015 and January 2019 for all cryptocurrencies which can be traded marginally combined.
A closer inspection shows that there are consistent differences between cryptocurrencies, with respect to the cumulative returns (see Figure 14), with some even yielding overall negative returns. The Wikipedia-based strategy yields a positive cumulative return of ~300% for Ethereum Classic, but for other currencies, including Ripple and Ethereum, investing based on Wikipedia leads to negative returns.
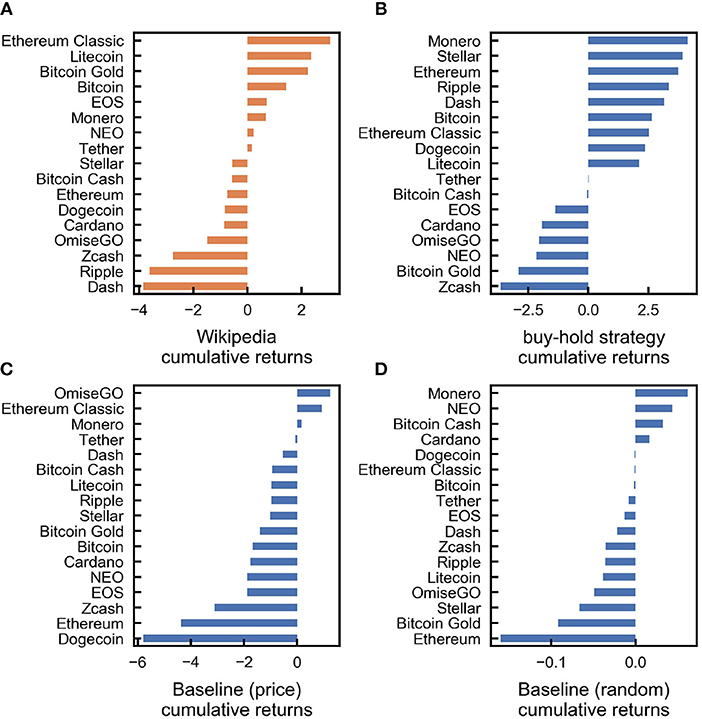
Figure 14. Performance of the strategies for different cryptocurrencies. The cumulative returns along the whole period of investment, following the Wikipedia based strategy (A) the buy hold strategy (B), the price-based baseline strategy (C), and the random strategy (D) for the 17 cryptocurrencies considered.
The observed differences could be potentially explained by the correlation or causality between changes in daily price and in Wikipedia views (see more details on the correlation and Granger causality for each cryptocurrency in Supplementary Material S4). Instead, we observed that, neither the correlation nor the Granger causality explains the results observed, suggesting that other mechanisms could be in play (Garcia and Schweitzer, 2015).
For example, our proposed strategy does not simply map to buying a cryptocurrency when its Wikipedia page views increase. In order to gain positive returns using our proposed strategy, an increase in the number of views at time t, should be followed by an increase in price in the next day t + 1 and a decrease of the price in the day after t + 2. Positive returns will also occur in case of a decrease in the number of views at time t if it was followed by a decrease in the price at time t + 1 and an increase in price at time t + 2.
Finally, we investigated the role of the start and end times of the investment period (see Figure 15). We found that, for most of the choices, the Wikipedia-based strategy has a higher cumulative return than the random and price baseline strategy. It outperforms both baseline strategies for the majority of the periods ending before January 2018, when the market entered a period of dramatic losses. Instead, the “buy and hold” strategy yields higher returns for start dates before March 2017, especially for long hold periods. The Wikipedia strategy outperforms the “buy and hold” strategy when trading starts after November 2017.
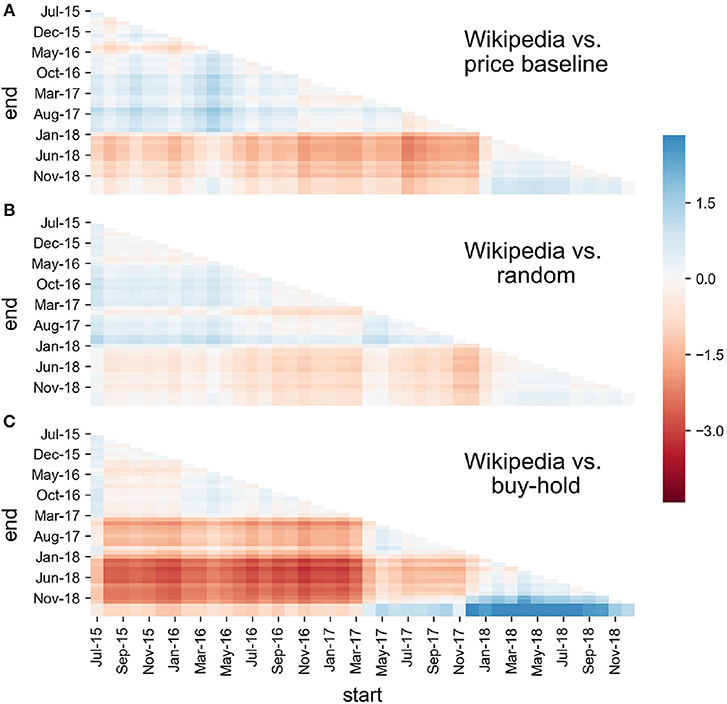
Figure 15. Comparison between strategies across different periods of time. Difference between the cumulative log returns of the Wikipedia based strategy and the price based baseline (A) or the random baseline (B) or “buy and hold” strategy (C) given a different start and end dates.
5. Conclusion and Discussion
In this paper, we investigated the interplay between the production and consumption of information about digital currencies in Wikipedia and their market performance. We have shown that there is a positive correlation between a cryptocurrency's overall success in the market, as measured by its price, volume, and market share and the overall attention gained by its Wikipedia page, measured by the number of page views and the number of page edits. This result suggests that the production and consumption of information in Wikipedia is relevant for investment purposes.
We have analyzed the edit history of cryptocurrency pages in Wikipedia. We have shown that contributions to cryptocurrency pages are bursty in time, with periods of high activity followed by calmer ones. We have found that cryptocurrency pages have experienced a higher number of revert edits (18%) compared to other pages, suggesting that they have been subject to vivid debates around their content. Also, we have found that the number of cryptocurrency page editors has increased in the period considered, while this is not the case for editors of other topics in Wikipedia. However, very few editors are responsible for most of the edits, consistent with the rest of Wikipedia. Interestingly, this subset of editors have started contributing relatively recently (after 2012), which is also in contrast with the rest of Wikipedia. We have shown that the information in Wikipedia is, to a large extent, provided by cryptocurrency and technology enthusiasts. In fact, we have found that editors who are very active on cryptocurrency pages focus their editing activity almost exclusively on cryptocurrencies and blockchain. We have found that the community of cryptocurrency editors is tight: On average, each page is connected to 37 other pages through an average of 7 editors and active contributors tend to edit many pages. New cryptocurrency pages are typically created by new editors, but then also edited by more experienced ones. For this reason, we find that older pages have a higher degree in the co-editing network. Further investigation of the nature of edits which arises as a response to price changes could uncover another interesting dimension of the relationship between Wikipedia editors and the market.
Finally, we have proposed a trading strategy relying on Wikipedia page views, similar to the Wikipedia based strategy proposed for the stock market (Moat et al., 2013) and found that it yields significant returns compared to baseline strategies. However, the strategy is less profitable than the simple “buy and hold” approach after the explosive growth of the market that started in January 2017 and becomes generally unsuccessful after January 2018, when the cryptocurrency market started suffering major losses. To further enrich the picture, we have discussed the relative performance between different strategies also by considering the effect of the hypothetical starting and ending period of trading, showing that the Wikipedia strategy is a valid option to be considered. In order to delimit the scope of our findings, it is important to note that, although our strategy yields overall positive returns, when considering currencies individually, returns are positive only for 8/17 of them. Furthermore, our strategy neglects the role played by fees, which could significantly decrease profits in real scenarios. Finally, for the sake of simplicity and as is customary for a study like ours, we have assumed that investor influence is too small to perturb the market; relaxing this assumption could be an interesting aspect to include in future works.
Characterizing the production and consumption of information around cryptocurrencies is key to understanding the market dynamics and in informing investment decisions (De Domenico and Baronchelli, 2019). Although our study was limited to the analysis of Wikipedia data, other sources of information including traditional news outlets such as Twitter, Reddit, or bitcointalk2 could reveal important information about cryptocurrency market dynamics.
Data Availability Statement
The datasets generated and analyzed for this study along with the code to regenerate the figures can be found in ElBahrawy11.
Author Contributions
AE, LA, and AB: study design, interpretation of results, and drafting of the manuscript. AE: data acquisition, pre-processing, and analysis.
Conflict of Interest
The authors declare that the research was conducted in the absence of any commercial or financial relationships that could be construed as a potential conflict of interest.
Acknowledgments
We would like to thank Miriam Redi from the Wikimedia Foundation for her valuable discussion on the Wikipedia structure. AE acknowledge the support of the Alan Turing Institute.
Supplementary Material
The Supplementary Material for this article can be found online at: https://www.frontiersin.org/articles/10.3389/fbloc.2019.00012/full#supplementary-material
Footnotes
1. ^coinmarketcap (2013). Available online at: coinmarketcap.com (accessed February 19, 2019).
2. ^(2016). Bitcoin forum (accessed February 19, 2019).
3. ^(2016). Ethereum forum (accessed February 19, 2019).
4. ^(2016). Rippl chat (accessed February 19, 2019).
5. ^(2013). coindesk (accessed February 19, 2019).
6. ^(2016b). Available online at: www.mediawiki.org/wiki/API:Main_page (accessed February 19, 2019)
7. ^(2016). Available online at: xtools.wmflabs.org (accessed February 19, 2019).
8. ^blog.coinmarketcap (2017). Available online at: https://blog.coinmarketcap.com/2018/07/19 (accessed February 19, 2019).
9. ^(n.d.). Available online at: alexa.com/topsites (accessed February 19, 2019).
10. ^(2016a). stats.wikimedia (accessed February 19, 2019).
11. ^ElBahrawy, A. (2019). Cryptocurrencies-and-Wikipedia. Available online at: https://github.com/abeeryehia/cryptocurrencies-and-wikipedia (accessed February 19, 2019).
References
Alessandretti, L., ElBahrawy, A., Aiello, L. M., and Baronchelli, A. (2018). Anticipating cryptocurrency prices using machine learning. Complexity 2018, 1–16. doi: 10.1155/2018/8983590
Ali, R., Barrdear, J., Clews, R., and Southgate, J. (2014). The economics of digital currencies. Bank Engl. Q. Bull. 54, 276-286.
Bollen, J., and Mao, H. (2011). Twitter mood as a stock market predictor. Computer 44, 91–94. doi: 10.1109/MC.2011.323
Brauneis, A., and Mestel, R. (2018). Price discovery of cryptocurrencies: Bitcoin and beyond. Econ. Lett. 165, 58–61. doi: 10.1016/j.econlet.2018.02.001
Caffyn, G. (2015). What Is the Bitcoin Block Size Debate and Why Does It Matter. Available online at: http://www.coindesk.com(accessed November 27, 2015).
Ceruleo, P. (2014). Bitcoin: a rival to fiat money or a speculative financial asset? (Master's thesis). LUISS Guido Carli, Rome.
Chang, P. C., Liu, C. H., Fan, C. Y., Lin, J. L., and Lai, C. M. (2009). “An ensemble of neural networks for stock trading decision making,” in Emerging Intelligent Computing Technology and Applications. With Aspects of Artificial Intelligence, International Conference on Intelligent Computing, eds D. S. Huang, K. H. Jo, H. H. Lee, H. J. Kang, and V. Bevilacqua (Berlin; Heidelberg: Springer), 1–10.
Ciaian, P., Rajcaniova, M., and Kancs, D. (2016). The economics of bitcoin price formation. Appl. Econ. 48, 1799–1815. doi: 10.1080/00036846.2015.1109038
Colianni, S., Rosales, S., and Signorotti, M. (2015). Algorithmic Trading of Cryptocurrency based on Twitter Sentiment Analysis. CS229 Project.
Curme, C., Preis, T., Stanley, H. E., and Moat, H. S. (2014). Quantifying the semantics of search behavior before stock market moves. Proc. Natl. Acad. Sci. U.S.A. 111, 11600–11605. doi: 10.1073/pnas.1324054111
De Domenico, M., and Baronchelli, A. (2019). The fragility of decentralised trustless socio-technical systems. EPJ Data Sci. 8:2. doi: 10.1140/epjds/s13688-018-0180-6
Dickerson, A. (2018). Algorithmic Trading of Bitcoin Using Wikipedia and Google Search Volume. Available online at: https://ssrn.com/abstract=3177738
ElBahrawy, A., Alessandretti, L., Kandler, A., Pastor-Satorras, R., and Baronchelli, A. (2017). Evolutionary dynamics of the cryptocurrency market. R. Soc. Open Sci. 4:170623. doi: 10.1098/rsos.170623
Elendner, H., Trimborn, S., Ong, B., and Lee, T. M. (2016). The Cross-Section of Crypto-Currencies as Financial Assets: An Overview. Technical report, Humboldt University, Berlin.
Fama, E. F. (1972). Perfect competition and optimal production decisions under uncertainty. Bell J. Econ. Manage. Sci. 3, 509–530. doi: 10.2307/3003035
Gajardo, G., Kristjanpoller, W. D., and Minutolo, M. (2018). Does bitcoin exhibit the same asymmetric multifractal cross-correlations with crude oil, gold and djia as the euro, great british pound and yen? Chaos Solitons Fract. 109, 195–205. doi: 10.1016/j.chaos.2018.02.029
Gandal, N., and Halaburda, H. (2016). Can we predict the winner in a market with network effects? competition in cryptocurrency market. Games 7:16. doi: 10.3390/g7030016
Garcia, D., and Schweitzer, F. (2015). Social signals and algorithmic trading of bitcoin. R. Soc. Open Sci. 2:150288. doi: 10.1098/rsos.150288
Garcia, D., Tessone, C. J., Mavrodiev, P., and Perony, N. (2014). The digital traces of bubbles: feedback cycles between socio-economic signals in the bitcoin economy. J. R. Soc. Interface 11:20140623. doi: 10.1098/rsif.2014.0623
Glaser, F., Zimmermann, K., Haferkorn, M., Weber, M. C., and Siering, M. (2014). Bitcoin-Asset or Currency? Revealing Users' Hidden Intentions. Tel Aviv: ECIS. Available online at: https://ssrn.com/abstract=2425247
Guo, T., and Antulov-Fantulin, N. (2018). Predicting short-term bitcoin price fluctuations from buy and sell orders. arXiv preprint arXiv:1802.04065.
Heilman, J. M., and West, A. G. (2015). Wikipedia and medicine: quantifying readership, editors, and the significance of natural language. J. Med. Internet Res. 17:e62. doi: 10.2196/jmir.4069
Hudson, R. S., and Gregoriou, A. (2015). Calculating and comparing security returns is harder than you think: a comparison between logarithmic and simple returns. Int. Rev. Finan. Anal. 38, 151–162. doi: 10.1016/j.irfa.2014.10.008
Jahani, E., Krafft, P. M., Suhara, Y., Moro, E., and Pentland, A. S. (2018). Scamcoins, s*** posters, and the search for the next bitcoin tm: collective sensemaking in cryptocurrency discussions. Proc. ACM Hum.Comput. Interact. 2:79. doi: 10.1145/3274348
Jang, H., and Lee, J. (2018). An empirical study on modeling and prediction of bitcoin prices with bayesian neural networks based on blockchain information. IEEE Access 6, 5427–5437. doi: 10.1109/ACCESS.2017.2779181
Kaminski, J. (2014). Nowcasting the bitcoin market with twitter signals. arXiv preprint arXiv:1406.7577.
Kim, Y. B., Kim, J. G., Kim, W., Im, J. H., Kim, T. H., Kang, S. J., et al. (2016). Predicting fluctuations in cryptocurrency transactions based on user comments and replies. PLoS ONE 11:e0161197. doi: 10.1371/journal.pone.0161197
Kim, Y. B., Lee, J., Park, N., Choo, J., Kim, J.-H., and Kim, C. H. (2017). When bitcoin encounters information in an online forum: using text mining to analyse user opinions and predict value fluctuation. PLoS ONE 12:e0177630. doi: 10.1371/journal.pone.0177630
Kittur, A., Chi, E. H., Pendelton, B. A., Suh, B., and Mytkowicz, T. (2007a). “Power of the few vs wisdom of the crowd: Wikipedia and the rise of the bourgeoisie,” in CHI '07: Proceedings of the SIGCHI Conference on Human Factors in Computing Systems (San Jose, CA).
Kittur, A., Suh, B., Pendleton, B. A., and Chi, E. H. (2007b). “He says, she says: conflict and coordination in Wikipedia,” in Proceedings of the SIGCHI Conference on Human Factors in Computing Systems (San Jose, CA: ACM), 453–462.
Kristoufek, L. (2013). Bitcoin meets google trends and wikipedia: quantifying the relationship between phenomena of the internet era. Sci. Rep. 3:3415. doi: 10.1038/srep03415
Kristoufek, L. (2015). What are the main drivers of the bitcoin price? evidence from wavelet coherence analysis. PLoS ONE 10:e0123923. doi: 10.1371/journal.pone.0123923
Madan, I., Saluja, S., and Zhao, A. (2015). Automated Bitcoin Trading via Machine Learning Algorithms. Available online at: http://cs229.stanford.edu/proj2014/Isaac%20Madan,%20Shaurya%20Saluja,%20Aojia%20Zhao,Automated%20Bitcoin
%20Trading%20via%20Machine%20Learning%20Algorithms.pdf,
Matta, M., Lunesu, I., and Marchesi, M. (2015). “Bitcoin spread prediction using social and web search media,” in Workshop Deep Content Analytics Techniques for Personalized & Intelligent Services, UMAP Workshops (Dublin), 1–10.
Moat, H. S., Curme, C., Avakian, A., Kenett, D. Y., Stanley, H. E., and Preis, T. (2013). Quantifying wikipedia usage patterns before stock market moves. Sci. Rep. 3:1801. doi: 10.1038/srep01801
Muchnik, L., Pei, S., Parra, L. C., Reis, S. D., Andrade, J. S. Jr, Havlin, S., et al. (2013). Origins of power-law degree distribution in the heterogeneity of human activity in social networks. Sci. Rep. 3:1783. doi: 10.1038/srep01783
Nakamoto, S. (2008). Bitcoin: A Peer-to-Peer Electronic Cash System. Available online at: https://bitcoin.org/bitcoin.pdf
Panciera, K., Halfaker, A., and Terveen, L. (2009). “Wikipedians are born, not made: a study of power editors on Wikipedia,” in Proceedings of the ACM 2009 International Conference on Supporting Group Work (Sanibel Island, FL: ACM), 51–60.
Phillips, R. C., and Gorse, D. (2017). “Predicting cryptocurrency price bubbles using social media data and epidemic modelling,” in 2017 IEEE Symposium Series on Computational Intelligence (SSCI) (Honolulu, HI: IEEE, 1–7.
Phillips, R. C., and Gorse, D. (2018a). Cryptocurrency price drivers: wavelet coherence analysis revisited. PLoS ONE 13:e0195200. doi: 10.1371/journal.pone.0195200
Phillips, R. C., and Gorse, D. (2018b). “Mutual-excitation of cryptocurrency market returns and social media topics,” in Proceedings of the 4th International Conference on Frontiers of Educational Technologies (New York, NY: ACM), 80–86.
Preis, T., Moat, H. S., and Stanley, H. E. (2013). Quantifying trading behavior in financial markets using google trends. Sci. Rep. 3:1684. doi: 10.1038/srep01684
Rivest, R. L. (1998). The MD4 Message Digest Algorithm. MIT Laboratory for Computer Science Network Working Group.
Stenqvist, E., and Lönnö, J. (2017). Predicting Bitcoin Price Fluctuation With Twitter Sentiment Analysis. Accessed: 19 February 2019.
Stvilia, B., Twidale, M. B., Smith, L. C., and Gasser, L. (2005). “Assessing information quality of a community-based encyclopedia,” in Proceedings of the International Conference on Information Quality-ICIQ 2005 (Cambridge, MA: MITIQ), 442–454.
Tversky, A., and Kahneman, D. (1991). Loss aversion in riskless choice: a reference-dependent model. Q. J. Econ. 106, 1039–1061.
Viégas, F. B., Wattenberg, M., and Dave, K. (2004). “Studying cooperation and conflict between authors with history flow visualizations,” in Proceedings of the SIGCHI Conference on Human Factors in Computing Systems (New York, NY: ACM), 575–582.
Wang, S., and Vergne, J.-P. (2017). Buzz factor or innovation potential: what explains cryptocurrencies returns? PLoS ONE 12:e0169556. doi: 10.1371/journal.pone.0169556
Yermack, D. (2013). Is Bitcoin a Real Currency? An Economic Appraisal. Technical report, National Bureau of Economic Research.
Yoshida, M., Arase, Y., Tsunoda, T., and Yamamoto, M. (2015). “Wikipedia page view reflects web search trend,” in Proceedings of the ACM Web Science Conference (Oxford, UK: ACM), 65.
Keywords: cryptocurrency, Wikipedia, Bitcoin, complex networks, investment strategy
Citation: ElBahrawy A, Alessandretti L and Baronchelli A (2019) Wikipedia and Cryptocurrencies: Interplay Between Collective Attention and Market Performance. Front. Blockchain 2:12. doi: 10.3389/fbloc.2019.00012
Received: 27 February 2019; Accepted: 13 September 2019;
Published: 09 October 2019.
Edited by:
Claudio J. Tessone, University of Zurich, SwitzerlandReviewed by:
Wolfgang Lohmann, Independent Researcher, Stuttgart, GermanyDavid Garcia, Medical University of Vienna, Austria
Copyright © 2019 ElBahrawy, Alessandretti and Baronchelli. This is an open-access article distributed under the terms of the Creative Commons Attribution License (CC BY). The use, distribution or reproduction in other forums is permitted, provided the original author(s) and the copyright owner(s) are credited and that the original publication in this journal is cited, in accordance with accepted academic practice. No use, distribution or reproduction is permitted which does not comply with these terms.
*Correspondence: Andrea Baronchelli, YW5kcmVhLmJhcm9uY2hlbGxpLjFAY2l0eS5hYy51aw==
 Abeer ElBahrawy
 Laura Alessandretti
 Andrea Baronchelli