 Geetha Rajasekharan Sabareesh
 Masahiro Matsui2
- 1Department of Mechanical Engineering, BITS-Pilani, Hyderabad, India
- 2Wind Engineering Research Centre, Tokyo Polytechnic University, Atsugi, Japan
- 3School of Civil Engineering, Chongqing University, Chongqing, China
- 4Wind Engineering Research Centre, Tokyo Polytechnic University, Tokyo, Japan
Exposure of a building to a tornado often proves fatal, resulting in massive destruction of property and structures. The effect of disasters can be minimized by understanding the nature of fluid-structure interactions when a tornado hits a building on its path. Earlier researchers have investigated extensively on building models exposed to stationary type vortex generated in a laboratory type tornado simulator; however studies using translating type vortex are few. In the present investigation, the external and internal pressures experienced by a building model are discussed based on experiments conducted using a translating tornado-like flow simulator at Tokyo Polytechnic University, Japan. The swirl ratio which characterizes the strength of vortices generated is kept constant. The investigation attempts to explore the opening locations which can result in higher internal pressures and net roof forces in building and the vulnerability of roof structures of buildings when exposed to tornado-like flow. The effect of translating speed on internal pressure fluctuations when compared to those of external pressures are investigated using aerodynamic admittance functions. Results indicate that there is an increased amount of internal pressure fluctuations at higher translating speeds.
Introduction
Tornadoes are one of the most violent of nature's wind storms. Due to the unpredictability associated with tornado, full scale studies on their nature as well as effect on structures are very rare. Tornado wind speeds were determined based on structural damage by Amde et al. (1985) and Mehta et al. (1976). The effect of tornadoes on residential masonry structures and the causes and sequence of structural failure were investigated by Pinelli and O'Neill (2000). Lee and Wurman (2005) tried to determine the axisymmetric structure of Mulhall Tornado from a mobile Doppler radar technique and confirmed a number of kinematic and dynamic aspects such as angular momentum profile, pressure pattern, relationship between swirl ratio, and multiple vortices etc. Selvam and Millet (2003) have attempted to model tornado forces computationally in the past. Sengupta et al. (2006) investigated on the transient wind load effects on a cubic building model in a microburst and tornado using Large Eddy Simulation. Their investigation revealed that slowly moving and smaller-sized tornadoes produced higher peak loads.
Attempts have also been made to understand the effect of tornadoes on structures by mimicking their behavior in laboratories, using tornado-like flow simulators, (Ward, 1972; Baker and Church, 1979). Some of these simulators have ability to produce stationary vortex, whereas others generate translating tornado-like vortex.
Earlier laboratory studies to understand the nature of tornado-structure interactions used tornado simulators which produced stationary vortex with a rotational component, such as Chang (1971), Jischke and Light (1983), Mishra et al. (2008b), and Sabareesh et al. (2012, 2013a,b), but these failed to take into effect the translational feature of tornado-like vortices. Based on results from these studies some of the observations related to the interaction of building with tornado like flow included,
• Symmetric nature of pressure distribution on side walls of a building engulfed in tornado like flow
• Very high negative pressure coefficients on roof surface compared to side walls,
• Leading edges to flow experiencing higher negative pressures compared to trailing edges when exposed to a stationary vortex.
Real time studies give an account of the combined translating and rotational nature of tornadoes. Thus, to better understand the nature of tornado-structure interaction, the translating nature of tornado vortices also needs to be considered and the pressure coefficients on building surfaces and internal needs to be determined. The translating vortex combined with its rotational effect could result in pressures on the building external and interior that could be different from the case while considering only a stationary vortex with rotational effect alone. There have been attempts to generate translating tornado-like flow simulator by researchers such as Haan et al. (2010), which could incorporate the translating nature of vortex also. Yang et al. (2011) investigated on the characteristics of wake vortex and turbulent flow structures around building models exposed to tornado wind and resulting tornado-wind loads on the structure, but analysis was restricted to high-rise buildings. Kumar et al. (2012) discussed on the failure of wood-framed low rise buildings under tornado-wind loads. Tornado-induced wind loads were applied to the finite element models of gable roof buildings to evaluate the stress distribution in the structure. Case et al. (2014) investigated on the effect of low-rise building geometry on tornado-induced wind loads. The study revealed that the peak loads varied with eave height, plan area, aspect ratio, and other changes in geometry of the low-rise building structure. Refan et al. (2014) investigated on tornado-like flow fields generated under WindEEE dome facility and found that a range of vortices from single to two-cell could be generated using the facility. Strasser et al. (2016) utilized the dynamic load factor concept to assess the possible dynamic amplification of structures under tornado-like winds. Cao et al. (2015) investigated on the effect of tornado-like vortex on a cooling tower. They found that pressure drop accompanying a tornado dominates the pressure coefficient magnitudes for the cooling tower when located at tornado core center.
The characterization of flow field developed under the translating tornado-like flow at Tokyo Polytechnic University, Japan was investigated in an earlier study Sabareesh et al. (2013c) which provide insights into the nature and size of tornado core developed.
In the present investigation an attempt is made to provide better insights into the external and internal pressure fluctuations on a low-rise building model exposed to tornado like flow taking into account the effect of vortex translation. The effect of variation in translation speed on external and internal pressures is also investigated. Post-damage investigations reveal the vulnerability of roofs and development of dominant openings on low-rise buildings when a tornado interacts with it. One of the commonly occurring failures include separation of roof sheathing from roof framing members, see Figure 1. Positive internal pressures and large uplift wind forces acting on the roof causes these separations. These are found at roof corners or ridges where wind induced effects are greatest. Some of these were observed during the post-tornado damage investigations carried out by the authors at Noshiro, Akita, Japan and Tsuchiura, Ibaraki, Japan. Henderson et al. (2013) also observed high uplift loads during severe wind storms and discussed on the failure mechanisms of roof sheathing under fluctuating wind loads. Moreover, an account of damage assessments after a tornado outbreak based on post-disaster investigations can be accessed at (Jordan, 2007; Curtis and Mills, 2012; Chmielewski et al., 2013; Zanini et al., 2017).
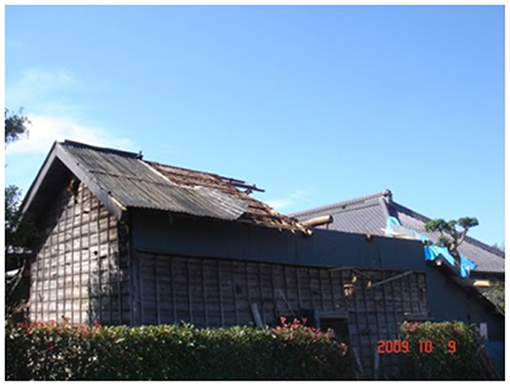
Figure 1. Roof sheathing removed after a tornado in Tsuchiura, Ibaraki, 2009.
Thus, there exists a need to understand better the relation between external and internal pressure fluctuations, the admittance functions and its influence on roof loads when a tornado interacts with a structure and also the influence of opening location with respect to the translating vortex on the resultant loads.
Experimental Setup
The experimental setup used for the present investigation comprises of a translating tornado-like flow simulator as shown in Figure 2. It comprises of an updraft system equipped with an axial flow fan capable of diverting the surrounding air into the confluence region, which gets converged together at the center of vortex before ascending up, (Sabareesh et al., 2013c). Convection region houses a honey comb structure that removes the vorticity as the flow ascends up. Updraft system has two layers which enables the flow that ascends up to return as a rear flank downdraft, (see arrows shown in Figure 2). Rear downdrafts are a common feature in naturally occurring tornadoes (Rasmussen and Straka, 1998). This feature is simulator to the ISU simulator (Haan et al., 2008). The floor of the simulator could be adjusted to obtain different inflow heights using a pneumatic arrangement. The length of the simulator floor was ~2 m over which the tornado-like vortex translates. The translation of updraft system could be remotely controlled using a desktop computer. The radius of updraft hole was 225 mm and the inflow region had a height of 160 mm. The outer diameter of the updraft system was 1,300 mm. The required angular momentum for the inflow is provided by the guide vanes at the periphery of the updraft system. The swirl ratio, which characterizes the strength of the generated vortices is obtained as in Equation (1)
Here, “θ” corresponds to the guide vane angle and a = H/ro is the aspect ratio. “H” is the inflow height and “ro” is the radius of updraft hole. In the present set of experiments, the swirl ratio was maintained constant at S = 0.72, which corresponds to a laminar vortex (Monji, 1985) and no vortex break down was observed; see Figure 3 and aspect ratio calculated from geometry was 1.4. Laminar vortex here refers to a rotational flow with a small or moderate swirl. The central core is observed to be smooth and laminar as seen from the flow visualization and the core extended till the full height of experimental volume, with very little spread of radius with height (Church et al., 1979). The translating speed of the updraft system which mimics the translation of a tornado-type vortex was varied from 20 to 240 mm/s. The translating speeds observed in an atmospheric tornado is of the order of 10–30 m/s (Liu and Ishihara, 2016). The translational velocities were normalized using the corresponding maximum updraft speeds.
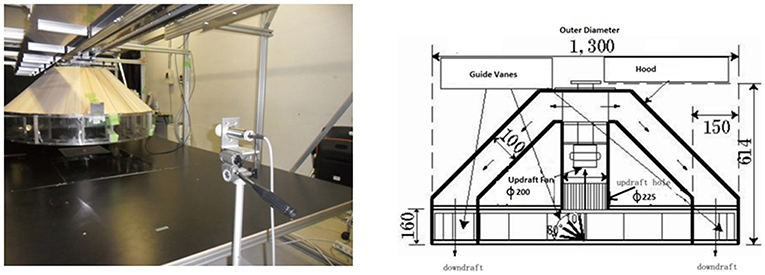
Figure 2. Translating tornado-like flow simulator at Tokyo Polytechnic University and schematic showing the dimensions.
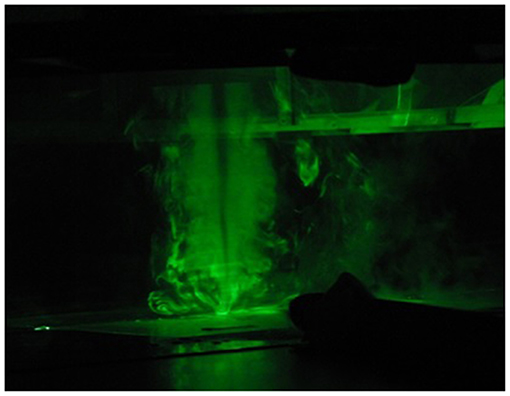
Figure 3. Flow visualization showing tornado vortex core generated in the simulator.
Velocity and Pressure Measurements
Hot-wire anemometers were used to measure the maximum horizontal velocity at roof height in absence of the building model corresponding to different translation speeds of tornado vortex, (Sabareesh et al., 2013c). Building model considered was a low-rise model which was equipped with pressure taps on the surface as well as in its interior so as to capture the external and internal pressure variation when exposed to a translating tornado like flow. A volume chamber is placed beneath the simulator floor as per the requirements to scale the internal volume to avoid internal volume distortion taking place at model scale and maintain similarity in dynamic response of volume between full scale and model scale. The volume chamber was also instrumented with pressure taps. Pressure measurements were made using a high-speed multi-channel pressure scanner with a sampling frequency of 700 Hz. The measurements were conducted for the entire translation of the updraft system through the simulator floor. The updraft system was translated for 10 runs across the simulator floor and it was noted that the RMS variation in obtained pressure coefficient values were minimal. The correction for the length of tubing was performed to remove tubing effects using gain and phase shift characteristics.
The raw pressure data obtained is the difference between the pressure at any point on the building model and the static pressure measured at a location far from the simulator. These were then converted to pressure coefficients by normalizing them with the dynamic pressure calculated using the maximum horizontal velocity measured at roof height of model using hot-wire anemometer for the corresponding translational speed. This corresponds to the velocity at the radius of maximum winds.
Internal pressures were simultaneously measured at multiple pressure taps distributed evenly inside the building model and the volume chamber and numerically averaged. The pressure coefficient (Cpj) at any point “j” is defined by equation
In the tornado-like flow regime, “Pj” represents the wind pressure acting at the pressure tap location, “P∞” represents the reference static pressure measured far away from the vortex and “qr” represents the dynamic pressure. There were 25 pressure taps distributed on the roof face to capture the external pressure acting on the roof.
Scaling Considerations
The building model used was scaled in the ratio 1:1,000, to accommodate the radius of the tornado vortex developed. The building model chosen was a low-rise building model with dimensions 30 mm (B) × 30 mm (L) × 15 mm (H), see Figure 7.
For the present investigation, the ratio of building model side dimension (B) to radius of vortex (rc) is a given below.
If the tornado vortex is scaled in the same ratio as that of model scale, the generated tornado in full scale will have a radius of order of 36 m, which matches with those reported for tornadoes occurring in the mainland of Japan (Kobayashi et al., 2007).
The velocity measured at roof height, which was used for normalizing the pressure coefficients was of the order of 2–3.5 m/s. The translational velocities considered were in the range of 0.02–0.24 m/s, which were the typical possible extremes approachable in the simulator. The opening porosity of the dominant opening was calculated as 3.9%. The definition of “opening porosity” in the present case is the ratio of opening area to single wall area. This correspond to a realistic type of opening existing in a real building (Oh et al., 2007). Tryggvason (1979) introduced the importance of scaling the dynamic component of internal pressure. He argued that the fractional changes in internal volume can lead to change in pressures of order much larger than static pressurization. This leads to the need for scaling the acoustic stiffness of the enclosed volume. Holmes (1979) introduced this method of internal volume scaling in model scale wind tunnel experiments.
Holmes derived the scaling parameter for cavity pressure dynamics as
where “λVo” corresponds to the volume in model scale required. “λL” is the length scale and “λU” is the velocity scale. The volume scale was obtained corresponding to the wind speed of F2-F3 type of tornado with those attainable in the simulator (2–3.5 m/s), and the length scale of 1:1,000. F2-F3 tornado corresponds to a ~92 m/s wind speed in the scale for rating tornado intensity.
Results and Discussion
Experiments were conducted to determine the nature of external and internal pressures experienced by a building model when exposed to a translating tornado like vortex. The following experimental cases were considered to capture the behavior of pressure variations on building model.
(1) Variation of external pressures on building model surface for a range of translating speed was obtained for a fixed swirl ratio.
(2) Variation of internal pressures was obtained keeping independently open the dominant opening on any one of the four side walls. This was repeated for a range of translating speed but for a fixed swirl ratio.
(3) Resulting net roof pressure coefficients were also calculated
The time history of the above cases was plotted and is as shown in Figures 4–6. The track of tornado vortex with respect to the building model is as shown in Figure 7. The building model was kept stationary at the center of floor of simulator and the updraft system that produces the tornado-like vortex moved from one end of simulator to the other with the building model on the path.
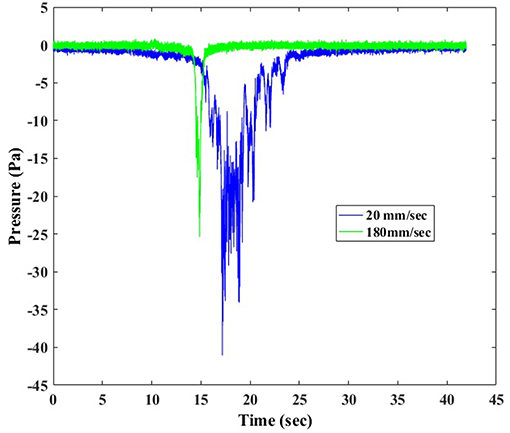
Figure 4. Time history of pressures on roof pressure tap at different translating speeds.
The pressure tap located at the center of the roof was observed at different translating speeds of the updraft system, and the time history of the pressures were recorded and is as shown in Figure 4. The two translating speeds considered are 20 and 180 mm/s which correspond to non-dimensionalized translation speeds of 0.01 and 0.1, respectively. The translation speeds were non-dimensionalized with corresponding updraft flow speeds in the simulator. It can be seen that with the increase in translating speed there is a decrease in magnitude of pressure experienced by the pressure tap at the center of the building model.
Figure 5, shows the time history of internal pressures for openings at different walls, when the tornado was translating at a translating speed of 120 mm/s. The internal pressures experienced by the building model, when the opening was facing the translating vortex (opening on windward wall) was higher in magnitude, followed by the case when the opening was facing away from the translating vortex (opening on the leeward wall). The opening when located on side wall experienced least magnitude pressures among the three cases considered.
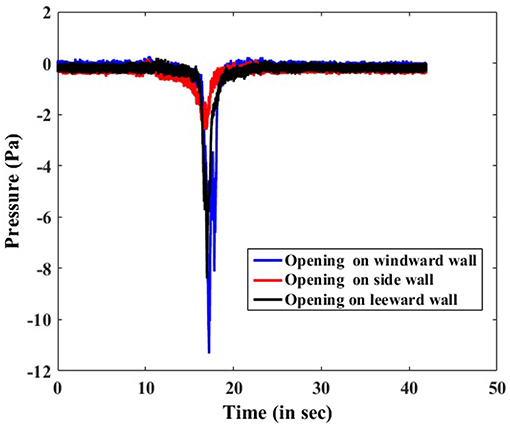
Figure 5. Time history of internal pressures for different wall opening positions at a translating speed of 120 mm/s.
Figure 6, shows the variation of time history of pressure coefficients for pressure taps located at different external side walls and internal of building for the same translating speed of 180 mm/s and opening on windward wall kept open. It is observed that the roof experienced very high negative pressures compared to windward side. The leeward side was experiencing lower magnitude pressures compared to the roof pressure, windward side pressure, and internal pressure cases.
The dynamic pressure was evaluated from the maximum horizontal velocity measured at roof height for each translating velocity case.
The exploded view of the low-rise building model is shown in Figure 7 with the different pressure taps on external faces considered for analysis along with the actual experimental model with dimensions. The internal pressure coefficient variation under different translating cases was compared. From Figure 8, it can be observed that irrespective of the translational velocity considered, the building with windward opening registered a higher negative pressure coefficient compared to similar opening configuration on side walls or leeward side. At any translational speed, the maximum percentage difference in the value of internal pressure coefficients obtained corresponding to opening on different walls was of the order of 75%.
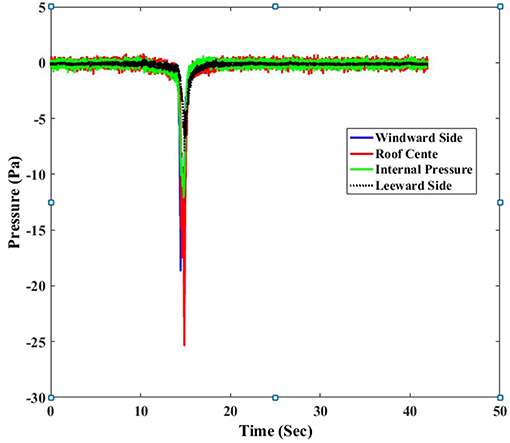
Figure 6. Time history of pressures for pressure taps located on building model at different locations with respect to a translating speed of 180 mm/s.
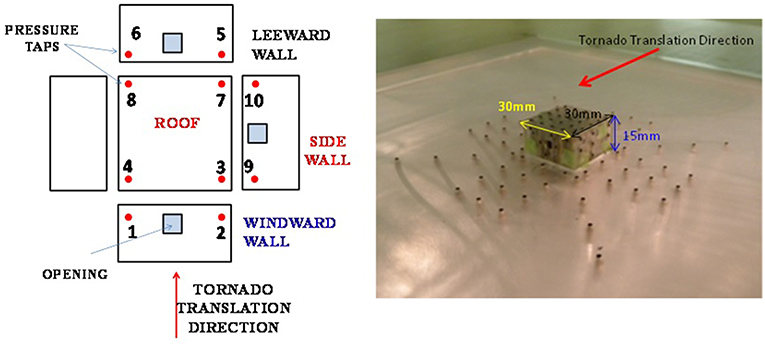
Figure 7. Exploded view of the low-rise building model showing the pressure taps and the experimental model.
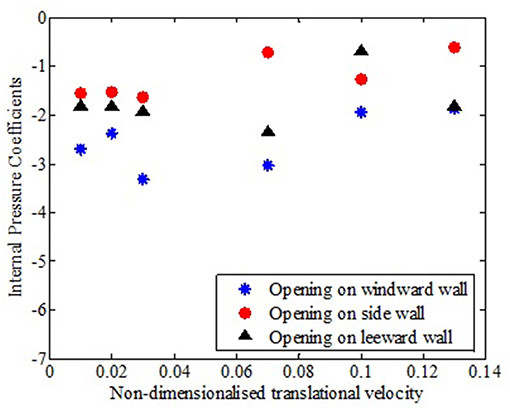
Figure 8. Internal pressure coefficients for various translational velocities and different wall openings.
From Figure 9, it can be observed that roof corners experienced greater suction (pressure taps 3 & 4) compared to pressure taps located on windward wall corners near roof edges to the translating vortex (pressure taps 1 & 2). Similar observations were recorded for roof corners in leeward side and the pressure taps located on the leeward wall of the translating tornado-vortex. These results indicate that the roof structures are more vulnerable to tornado effects compared to the side walls. Comparing the external pressure coefficients at any translational speed, no specific trend could be observed with respect to the difference in their magnitude. As can be observed from Figures 9, 10, magnitudes of external pressure coefficient on windward face and roofs were comparatively higher in magnitude compared to corresponding pressure taps on leeward side for all the translational speeds of the vortex. Also it is to be noted that the difference in pressure coefficients between roof and faces became more predominant at higher translational speeds.
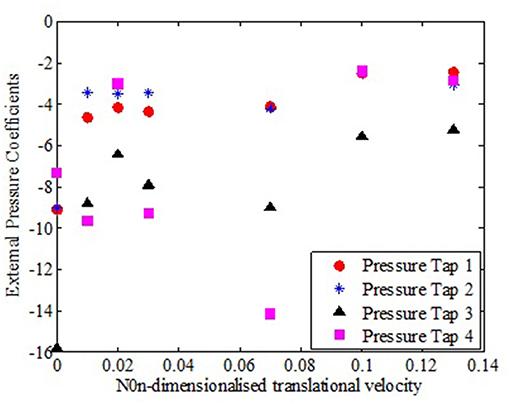
Figure 9. External pressure co-efficients at different locations of windward wall to translating vortex and roof at various translational velocities.
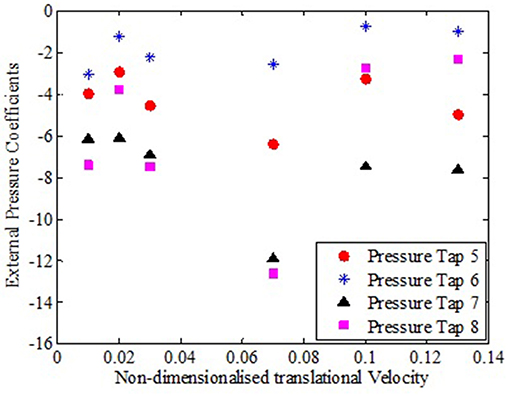
Figure 10. External pressure co-efficients at different locations of leeward wall to translating vortex and roof at various translational velocities.
Analyzing the external pressure coefficients experienced by the side walls, Figure 11, it can be observed that the windward edge of side wall (pressure tap 9) experienced almost comparable pressure coefficients with leeward edge of side wall for lower translating speeds, the difference became considerable for intermediate translation speeds observed.
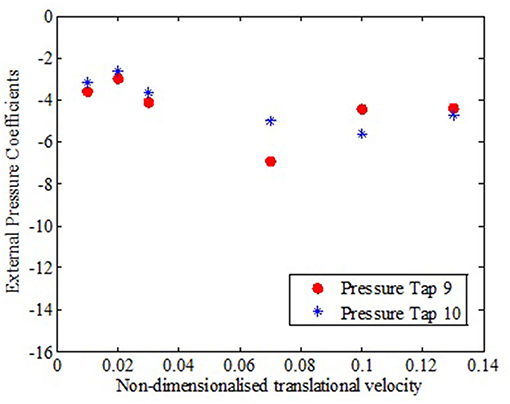
Figure 11. External pressure coefficients at different locations of side wall to translating vortex at various translational velocities.
Analyzing the lowest minimum net roof force coefficients for openings located on different side walls, Figure 12, it can be observed that at lower translational speeds, the roof experienced higher negative net force coefficients for opening located on side wall, whereas for higher translational speeds of the tornado vortex, the opening on wind ward wall was producing the higher negative net force coefficients.
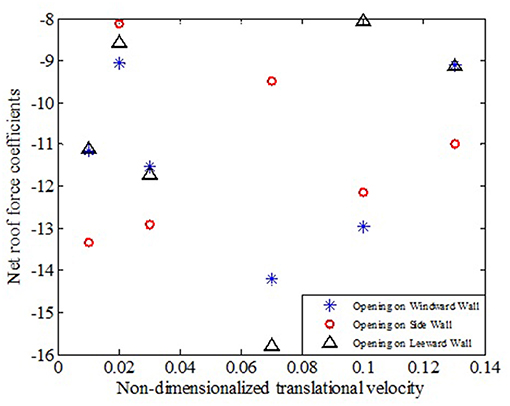
Figure 12. Lowest minimum net peak roof force coefficients for openings located on different walls.
To understand the cross-correlation between external and internal pressures of building model when exposed to a translating tornado-like flow, the admittance functions were evaluated. The admittance functions of internal to external pressure coefficients under tornado—like flow for opening on windward wall to the translating flow is as shown in Figure 13. It can be observed that the gain at resonance increased with increase in translating speed of the tornado-like flow. Also, shifting of peak to lower frequency side is observed with increasing translating speed, indicating that Helmholtz resonance takes place at lower frequency. The fluctuation characteristics of internal flow may be increasing at higher translation speeds due to lower external pressures experienced by building surface when exposed to higher translating speed flows.
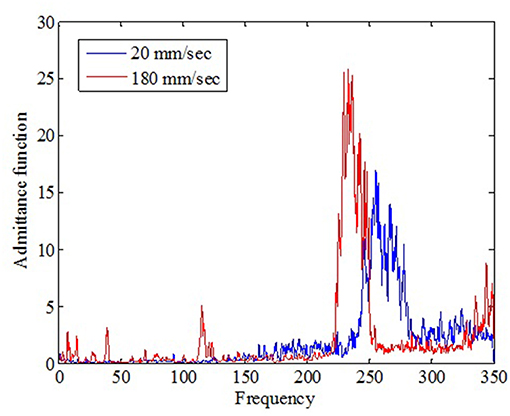
Figure 13. Admittance functions for two different translating speeds.
A precise understanding of wind loads on structure requires the knowledge of correlation between external and internal pressures. Correlation coefficients describe the dependence between the external and internal pressure coefficients. In the present investigation, this is obtained at the instant when the minimum external pressure is recorded by the pressure tap at the periphery of the building as the translating tornado hits the structure. The correlation coefficient values for openings located on windward wall, leeward wall to the translating tornado-like flow is as shown in Figures 14, 15. It can be observed that for opening on windward wall, irrespective of translational velocity, when the external pressure tap 1 and 2 as shown in Figure 7, are considered, there is almost a perfect correlation between external and internal pressures. It can be observed from Figure 14 that for windward wall opening at lower translational speeds, the correlation between external and internal pressures is poor uniformly compared to cases with higher translational speeds for the same pressure tap under consideration. Also it can be observed that the external pressures experienced by pressure taps located far away from the incident translating flow showed poor correlation with internal pressures developed due to opening on windward wall. When analyzing the correlation coefficients between external and internal pressure cases with opening on leeward wall, as shown in Figure 15, it can be observed that the internal pressure correlation with external pressure taps located on incident flow direction were rather poor compared to the case with pressure taps located away from the incident flow.
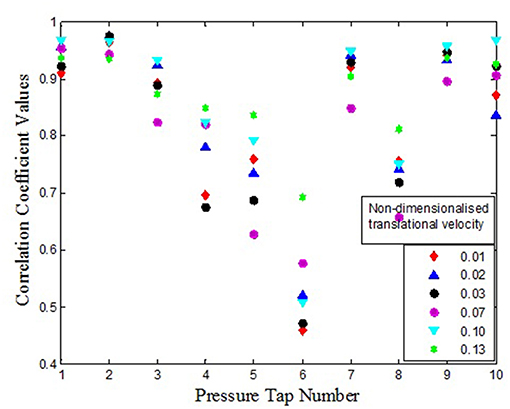
Figure 14. Correlation coefficient values for opening on windward wall.
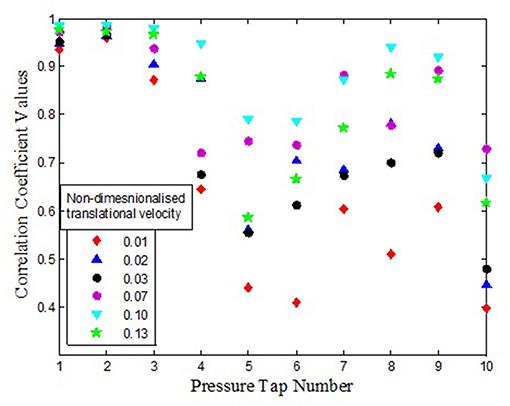
Figure 15. Correlation coefficient values for opening on leeward wall.
Summary
An attempt was made in the present investigation to understand the nature of external and internal pressures experienced by a building model when exposed to a translating tornado like vortex. The translating speeds as well as the location of opening on building wall with respect to vortex were varied to understand the impact of these parameters on fluctuating internal and external pressures. The following observation could be made
(1) The roof of a building exposed to a translating vortex is more vulnerable compared to the side walls, as observed from the external pressure coefficients and net roof force coefficients.
(2) The windward wall of the building model to the translating vortex experienced higher negative pressure coefficients compared to the side and leeward walls for any case of translating speed of the vortex considered.
(3) Also it was observed that when opening was located on the windward wall of the building model to the translating flow, the internal pressures recorded were highest in magnitude compared to side walls and leeward walls.
(4) The aerodynamic admittance function was showing a higher peak at higher translating speed, indicating increased internal pressure fluctuations compared to external pressures at higher translating flow.
(5) Correlation coefficients indicated a higher correlation between external pressure taps on wind ward wall and internal pressures developed due to opening on windward wall, whereas the trend was reverse for internal pressures developed due to opening on leeward wall to the translating flow.
The present investigation thus describes the vulnerability of roof structures of buildings exposed to tornado like flows and tries to identify the opening locations which can result in higher internal pressures and net roof forces in building under different translating speeds.
The translating vortex combined with its rotational effect could result in pressures on the building external and interior and the relation between them, the admittance functions and its influence on roof loads when a tornado interacts with a structure is better understood through this study.
Author Contributions
The experiment work was done by GS during his post-doctoral studies at Tokyo Polytechnic University under the guidance of MM and YT.
Funding
This study was funded by the Ministry of Education, Culture, Sports, Science and Technology, Japan through the Global Center of Excellence Program 2008-2012, which is gratefully acknowledged.
Conflict of Interest Statement
The authors declare that the research was conducted in the absence of any commercial or financial relationships that could be construed as a potential conflict of interest.
References
Amde, M. W. T., Porter, M. L., and Mckeown, D. I. (1985). Wind speed analyses of tornadoes based on structural damage. J. Climate Appl. Meteorol. 24, 699–710.
Baker, G. L., and Church, C. R. (1979). Measurements of core radii and peak velocities in modeled atmospheric vortices. J. Atmos. Sci. 36, 2413–24. doi: 10.1175/1520-0469(1979)036<2413:MOCRAP>2.0.CO;2
Cao, S., Wang, J., Cao, J., Zhao, L., and Chen, X. (2015). Experimental study of wind pressures acting on a cooling tower exposed to stationary tornado-like vortices. J. Wind Eng. Ind. Aerodynamics 145, 75–86. doi: 10.1016/j.jweia.2015.06.004
Case, J., Sarkar, P., and Sritharan, S. (2014). Effect of low-rise building geometry on tornado-induced loads. J. Wind Eng. Ind. Aerodynamics 133, 124–134. doi: 10.1016/j.jweia.2014.02.001
Chang, C. C. (1971). Tornado wind effects on buildings and structures with laboratory simulation. In: Proceedings of the 3rd International Conference on Wind Effects on Buildings and Structures, 231–240.
Chmielewski, T., Nowak, N., and Walkowiak, K. (2013). Tornado in Poland of August 15, 2008: results of post-disaster investigation. J. Wind Eng. Ind. Aerodyn. 118 54.–60. doi: 10.1016/j.jweia.2013.04.007
Church, C. R., Snow, J. T., and Agee, E. M. (1979). Characteristics of tornado-like vortices as a function of swirl ratio. a laboratory investigation, 36. Am. Meteorol. Soc. 36, 1755–1774.
Curtis, A., and Mills, J. W (2012) Spatial video data collection in a post-disaster landscape: the tuscaloosa tornado of April 27th 2011. Appl. Geogr. (2012) 32, 393–400. doi: 10.1016/j.apgeog.2011.06.002
Haan, F. L. Jr., Balaramudu, V. K., and Sarkar, P. P. (2010). Tornado-induced wind loads on a low rise building. J. Struct. Eng. 106.–116. doi: 10.1061/(ASCE)ST.1943-541X.0000093
Haan, F. L. Jr., Sarkar, P. P., and Gallus, W. A. (2008). Design, construction and performance of a large tornado simulator for wind engineering applications. Eng. Struct. 30, 1146–1159. doi: 10.1016/j.engstruct.2007.07.010
Henderson, D. J., Williams, C., Gavanski, E., and Kopp, G. A. (2013). Failure mechanisms of roof sheathing under fluctuating wind loads. J. Wind Eng. Ind. Aerodynamics 114, 27–37. doi: 10.1016/j.jweia.2013.01.002
Holmes, J. D. (1979). Mean and fluctuating internal pressures induced by wind. In: Proceedings of the Fifth International Conference on Wind Engineering, Colorado State University, 435.–450.
Jischke, M. C., and Light, B. D. (1983). Laboratory simulation of tornadic wind loads on a rectangular model structure. J. Wind Eng. Ind. Aerodynamics 13, 371–382. doi: 10.1016/0167-6105(83)90157-5
Jordan, J. W. (2007). Tornado damage assessment for structural engineers. Forensic Eng. ASCE, 1.–17. doi: 10.1061/40943(250)2
Kobayashi, F., Sugimoto, Y., Suzuki, T., Maesaka, T., and Moteki, Q. (2007). Doppler radar observation of a tornado generated over the Japan seacoast during a cold air outbreak. J. Meteorol. Soc. Japan 85, 321–334. doi: 10.2151/jmsj.85.321
Kumar, N., Dayal, V., and Sarkar, P. P. (2012). Failure of wood-framed low-rise buildings under tornado wind loads. Eng. Struct. 29, 79–88. doi: 10.1016/j.engstruct.2012.02.011
Lee, W. C., and Wurman, J. (2005). Diagnosed three-dimensional axisymmetric structure of the Mulhall Tornado on 3 May 1999. J. Atmospher. Sci. 62, 2373–2393. doi: 10.1175/JAS3489.1
Liu, Z., and Ishihara, T. (2016). Study of the effects of translation and roughness on tornado-like vortices by large-eddy simulations. J. Wind Eng. Ind. Aerodynamics 151, 1–24. doi: 10.1016/j.jweia.2016.01.006
Mehta, K. C., Minor, J. E., and McDonald, J. R. (1976). Wind speed analysis of April 3.–4 tornadoes. J. Struct. Division ASCE 102, 1709–1724.
Mishra, A. R., James, D. L., and Letchford, C. W. (2008b). Physical simulation of a single-celled tornado-like vortex, Part B: wind loading on a cubic model. J. Wind Eng. Ind. Aerodynamics 96, 1258–1273. doi: 10.1016/j.jweia.2008.02.027
Monji, N. (1985). A Laboratory investigation of the structure of multiple vortices. J. Meteorol. Soc. Japan 63, 703–712. doi: 10.2151/jmsj1965.63.5_703
Oh, J. H., Kopp, G. A., and Inculet, D. R. (2007). The UWO contribution to the NIST aerodynamic database for wind loads on low buildings: Part 3 internal Pressures. J. Wind Eng. Ind. Aerodynamics 95, 755–779. doi: 10.1016/j.jweia.2007.01.007
Pinelli, J. P., and O'Neill, S. (2000). Effect of tornadoes on residential masonry structures. Wind Struct. J. 3, 23–40. doi: 10.12989/was.2000.3.1.023
Rasmussen, E. N., and Straka, J. M. (1998). Variations in supercell morphology. Part 1: observations of the role of upper level storm-relative flow. Bull. Am. Meteorol. Soc. 126, 2406–2421.
Refan, M., Hangan, H., and Wurman, J. (2014). Reproducing Tornadoes in laboratory using proper scaling. J. Wind Eng. Ind. Aerodynamics 135,136.–148. doi: 10.1016/j.jweia.2014.10.008
Sabareesh, G. R., Masahiro, M., and Yukio, T. (2013a). Characteristics of internal pressure and resulting roof wind force in tornado-like flow. J. Wind Eng. Ind. Aerodynamics 112, 52–57. doi: 10.1016/j.jweia.2012.11.005
Sabareesh, G. R., Masahiro, M., and Yukio, T. (2013b). Ground roughness effects on internal pressure characteristics for buildings exposed to tornado-like flow. J. Wind Eng. Ind. Aerodynamics 122, 113–117. doi: 10.1016/j.jweia.2013.07.010
Sabareesh, G. R., Masahiro, M., and Yukio, T. (2013c). Characteristics of tornado vortex developed under a translating tornado-like flow simulator. In: 8th Asia Pacific Conference on Wind Engineering, Chennai, India.
Sabareesh, G. R., Matsui, M., and Yukio, T. (2012). Dependence of surface pressures on a cubic building in tornado like flow on building location and ground roughness. J. Wind Eng. Ind. Aerodynamics 103, 50–59. doi: 10.1016/j.jweia.2012.02.011
Selvam, R. P., and Millet, P. C. (2003). Computer modeling of tornado forces on buildings. Wind Struct. J. 6, 209–220. doi: 10.12989/was.2003.6.3.209
Sengupta, A., Haan, F. L., Sarkar, P. P., and Balaramudu, V. (2006). Transient Loads on Buildings in Microburst and Tornado-Winds. In: Proc. of the Fourth International Symposium on Computational Wind Engineering (CWE2006), Yokohama.
Strasser, M. N., Yuosef, M. A. A., and Selvam, R. P. (2016). Defining the vortex loading period and application to assess dynamic amplification of tornado-like wind loading. J. Fluids Struct. 63, 188–209. doi: 10.1016/j.jfluidstructs.2016.03.004
Tryggvason, B. V. (1979). Aero elastic modeling of pneumatic and tensioned fabric structures. In: Proceedings of the Fifth International Conference on Wind Engineering, Colorado State University, 1061.–1072.
Ward, N. B. (1972). Exploration of certain features of tornado dynamics using a laboratory model. J. atmosphere. Sci. 29, 1194–1204. doi: 10.1175/1520-0469(1972)029<1194:TEOCFO>2.0.CO;2
Yang, Z., Sarkar, P. P., and Hu, H. (2011). An experimental study of a high-rise building model in tornado-like winds. J. Fluids Struct. 27, 471–486. doi: 10.1016/j.jfluidstructs.2011.02.011
Keywords: tornado, external and internal pressures, tornado simulator, admittance function, translation speed
Citation: Sabareesh GR, Matsui M and Tamura Y (2019) Vulnerability of Roof and Building Walls Under a Translating Tornado Like Vortex. Front. Built Environ. 5:53. doi: 10.3389/fbuil.2019.00053
Received: 17 November 2018; Accepted: 05 April 2019;
Published: 24 April 2019.
Edited by:
Gregory Alan Kopp, University of Western Ontario, CanadaReviewed by:
Lorenzo Hofer, University of Padova, ItalyStefanie Gillmeier, Eindhoven University of Technology, Netherlands
Copyright © 2019 Sabareesh, Matsui and Tamura. This is an open-access article distributed under the terms of the Creative Commons Attribution License (CC BY). The use, distribution or reproduction in other forums is permitted, provided the original author(s) and the copyright owner(s) are credited and that the original publication in this journal is cited, in accordance with accepted academic practice. No use, distribution or reproduction is permitted which does not comply with these terms.
*Correspondence: Geetha Rajasekharan Sabareesh, c2FiYXJlZXNoMjAwNUBnbWFpbC5jb20=