 Olga Markogiannaki
- 1Department of Mechanical Engineering, University of Western Macedonia, Kozani, Greece
- 2Department of Civil Engineering, Aristotle University of Thessaloniki, Thessaloniki, Greece
Cable-stayed bridges have been used widely in the last 60 years in bridge construction practice and are key components of transportation networks. Therefore, the potential damages and losses, either in terms of economic cost or fatalities due to natural or man-made threats could become considerably large. Several researchers have identified the significance of risk assessment, especially to natural hazards and have proposed risk assessment frameworks for bridges. Recently, it has been identified that climate change affects the occurrence of extreme events and should be also incorporated in risk assessment. In the present research work, a risk assessment framework for cable-stayed bridges is proposed. The goal is to prioritize single and total risk to provide a useful tool in the decision-making process on the design and maintenance actions for cable-stayed bridges. Herein, the case study is an indicative design alternative of a cable-stayed bridge in a coastal area in the New York Region. which is expected to face sea-level rise due to climate change. Multi-hazard risk evaluation on the investigated bridge shows that it has low risk to the seismic hazard, while it has increased risk to hurricanes, which changes from low to high depending on the investigated sea-level rise projections and hurricane intensity levels. Hence, hurricane governs the resulting total risk of the case study bridge.
Introduction
Cable-stayed bridges have been used widely in the last 60 years in bridge construction practice. Ren and Obata (1999) state that reasons for their use are appealing aesthetics, full and efficient utilization of structural materials, increased stiffness over suspension bridges, efficient and fast mode of construction and relatively small size of bridge elements. However, cable-stayed bridges are often exposed to threats, natural or man-made. The potential damages and losses, either in terms of economic cost or fatalities that could occur due to collapse, reduced performance or limited accessibility of a cable-stayed bridge could become considerably large. The collapse of Genoa Morandi Bridge in 2018 left 43 dead and an estimated cost of 422 million euros due to physical damages and business interruptions (The Japan Times, 2018).
The consequences of bridge failures have attracted several researchers to work toward the safety of cable-stayed bridges. Man-made threats in cable-stayed bridges, i.e., terrorist attacks, have been extensively investigated by using blast loads to evaluate their vulnerability and assess the risk they face (Bensi et al., 2005; Yan and Chang, 2009, 2010). Other critical threats that cable-stayed bridges face, similarly to other bridge types are induced by natural hazards, e.g., earthquakes, hurricanes, and tsunamis, during their service life. The significance of assessing risk to such threats in infrastructure has been identified from several researchers that provide frameworks to address multiple natural hazards and give a good insight on how to handle this issue (Kafali, 2008; Li and Ellingwood, 2009; Apaydin, 2010; McCullough and Kareem, 2011; Li and van de Lindt, 2012; Li et al., 2012; Topkara et al., 2015). Especially for typical concrete bridges, there have been studies that focus on multi-hazard risk assessment considering multiple extreme events like earthquakes and hurricanes (Decò and Frangopol, 2011; Kameshwar and Padgett, 2014). However, for cable-stayed bridges most attempts to assess natural hazard vulnerability and risk focus on single hazards. In some research studies the main goal is to assess seismic vulnerability and risk of cable-stayed bridges (Khan et al., 2004; Casciati et al., 2008; Khan and Datta, 2010; Akhoondzade and Bargi, 2016; Zhong et al., 2018). Ovett et al. (2018) deal with wind as a single hazard and specifically with cable-stayed bridges' vulnerability to wind effects beyond design basis. Recently there have been studies toward the multi-hazard treatment of cable stayed bridges. Domaneschi et al. (2015) deal with cable-stayed bridges in a multi-hazard approach by introducing adaptable control schemes to provide wind and earthquake protection and Domaneschi and Martinelli (2015) focus on resilient strategies for cable stayed bridges. A multi-hazard approach is also presented in Chen et al. (2017) where earthquake and wind hazard are investigated in a preliminary approach to multi-hazard assessment (e.g., flooding is not considered).
Furthermore, it is widely accepted that climate change affects the occurrence of extreme events, e.g., hurricanes, which can increase potential losses substantially (Jacob et al., 2011; Rosenzweig et al., 2011). Boin and Mc Connell (2007) have shown that severe climatic change along with natural disasters, can greatly affect the life, functionality and security of critical infrastructure. Milly et al. (2008) have noted that new bridge designs or maintenance actions on existing bridges based on climate averages derived from historical records, e.g., probability of flooding, may not include all future threats. Many articles and reports highlight the need for updating design standards to address more intense and frequent weather extremes [Zimmerman, 2002; U. S. and Department of Transportation (US DOT), 2006; Intergovernmental Panel on Climate Change (IPCC), 2007]. Hence, there is an urgent need to develop integrated multi-hazard risk assessment frameworks for bridges to account for climate change effects.
In the last years, scientists have published a few studies that consider climate change in the vulnerability and risk assessment of bridges. AECOM report (AECOM, 2015) provides guidance to incorporate climate change adaptation in infrastructure planning and design. Dong and Frangopol (2016) presented a methodology for loss and resilience assessment of highway bridges under earthquake and flood hazard considering climate change effects. Khelifa et al. (2013) account for climate change impacts in the evaluation of bridge vulnerability to scour. However, there is still a lot of room for the development of multi-hazard risk assessment frameworks for bridges considering climate change. Especially for cable-stayed bridges, there have not been yet any specific methodologies developed for this bridge type.
The present research work proposes such a risk assessment methodology for cable-stayed bridges accounting for natural hazards and climate change impact. A simplified framework that avoids high computational costs is presented as the means to prioritize risk for a more effective decision-making process on the design or maintenance actions of cable-stayed bridges. The paper aims also to highlight and provide a better understanding of natural hazards and climate change impact on coastal cable-stayed bridges. The proposed framework will be a useful tool in reducing disaster risk and increasing cable-stayed bridge resilience to climate change. In the context of the present paper, a case study is used to apply the proposed framework and evaluate its effectiveness. An indicative design alternative of a cable-stayed bridge in a coastal area of New York City is selected as the case study, since New York Metropolitan Region is expected to be highly affected from climate change (NPCC, New York City Panel on Climate Change, 2013). However, the proposed framework is not limited to this application and could be also applied to a variety of bridges facing different natural hazards.
Risk Assessment Framework
A step-wise framework is proposed in this research work as a tool for efficient prioritization of risk in the planning phase of the design or retrofit of cable-stayed bridges. The adopted methodology comprises of four steps that involve qualitative and quantitative estimation of bridge vulnerability and risk for different natural hazards. In Figure 1, the flowchart of the proposed framework is presented.
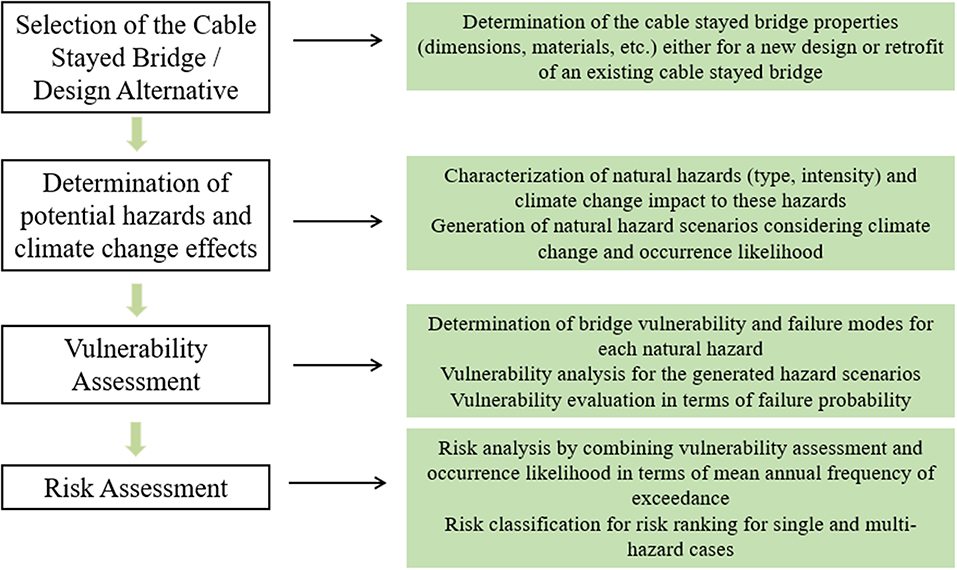
Figure 1. Adaptation methodology for cable-stayed bridges.
First Step
The first step of the framework is the identification of the cable-stayed bridge under study. The properties of the selected bridge in the preliminary phase of either the design of a new or the retrofit of an existing cable-stayed bridge are determined (geometry, materials, etc.). Information for the topography of the area and any special requirements in the design loads are also recorded in this step. It is noted, that when it comes to cable-stayed bridges, it is expected to perform bridge specific risk assessment since they present unique characteristics, unlike conventional reinforced concrete bridges that are often categorized and assessed in bridge classes (Nielson, 2005; Padgett, 2007).
Second Step
The second step is the designation of the hazard scenarios to represent low medium and high intensities. Firstly, potential natural hazards in coastal regions are identified, critical threats within each hazard are determined and climate impact on these hazards is discussed and quantified based on climate projection models. Herein, earthquakes and hurricanes are the focus of the case study presented in the following section. Earthquakes constitute a hazard of high significance since cable-stayed bridges can develop potential damages due to their flexibility and low inherent damping (Pacheco et al., 1993; Chang et al., 2004). The seismic hazard threat adopted in the proposed methodology is ground shaking. Hurricanes are also considered as critical natural hazards for coastal regions, as recent hurricane disasters indicate. It has been observed that the predominant failure modes of bridges during hurricanes are caused by wind, storm surge and waves (Kameshwar and Padgett, 2014). These are the main threats considered for the hurricane hazard.
While climate change has no impact on earthquakes, there is a significant impact on storm surge heights. For coastal bridges, sea-level rise is the most influential climate effect. In particular, as sea-level rises due to climate change, coastal flooding associated with storms will very likely increase in intensity, frequency, and duration. In the present study, the increase in coastal flood intensity and height are considered as a gradual increase in sea-level and as an increase in surge height by using projection models for 2100s. Given that climate impact on frequency and intensity of the wind speed is still a debate for scientists, potential changes in wind speed are neglected. However, it is noted that any climate impact in the frequency or intensity of storms themselves would result in even more frequent large flood events. Given that economic losses and fatalities after a cable-stayed bridge collapse due to extreme events can be tremendous, hazard scenarios are developed including hazard intensity levels beyond the established design levels. To provide a homogenous basis for calculating the annual risk for different hazards, the annual probability of occurrence is used. The probability of occurrence of an event is found by subtracting the appropriate annual probabilities of exceedance, since the annual probability of exceedance assigned to each hazard event is the sum of the probabilities of occurrence of events that will produce the same level of intensity or higher (Salman and Li, 2017, 2018). A number of different hazard intensity levels of low medium and high intensities are selected to sufficiently cover the hazard curves. To account for climate change, hazard scenarios that account for sea-level rise are also generated. Table 1 shows the characteristics of natural hazards that are included in the development of the scenarios for the implementation of the risk assessment framework.
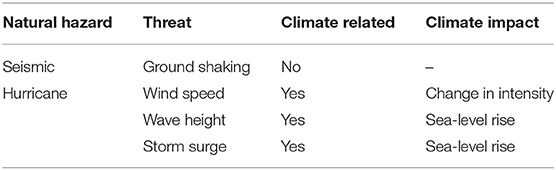
Table 1. Hazard characteristics.
Third Step
In the third step, the vulnerability of the selected cable-stayed bridge to the designated natural hazards is assessed. Although different approaches are used to quantify vulnerability depending on the investigated hazard type, a common basis on the annual probability of occurrence is used for all hazard types. It is noted that more rigorous calculations could be incorporated into the steps of the presented framework to increase accuracy in future works.
Earthquake Vulnerability
Figure 2 shows the process followed to evaluate earthquake vulnerability. The earthquake vulnerability of a structure is calculated as the probability of failure, P(Fx)e, in Equation (1) by a probabilistic relationship between the capacity (C) expressed as limit state values and the earthquake demand (D) for a given intensity measure (IM), such as spectral acceleration (Sa), peak ground acceleration (PGA), probability of recurrence, or specified ground motion magnitude.
In the present research work, vulnerability to the investigated hazard intensity levels is evaluated. The sub-steps that are followed to conduct seismic vulnerability assessment are the following:
1. Development of the 3D finite element model (FE Model) of the bridge. The selected bridge is simulated in robust analysis software to investigate the seismic behavior of the bridge. Bridge modeling is conducted depending on the computational cost and accuracy required. To achieve a balance between cost and accuracy and since load variation is taken into account in the next steps, material uncertainties are not considered in the present methodology. Therefore, one bridge model adopting mean values for material strengths is used.
2. Selection of ground motions to fit the selected hazard intensity levels. The selected earthquake intensity parameter (IM) is peak ground acceleration (PGA). For each seismic hazard intensity level, the corresponding response spectra are developed based on code provisions. Appropriate ground motions are selected from a global database and scaled to fit these response spectra.
3. Definition of failure damage states for each bridge component and threshold values.
Damage states (DS) reflect the capacity (C) of the cable-stayed bridge. In the proposed methodology one damage state for each component failure is determined, which is a common practice for cable-stayed bridges (Barnawi and Dyke, 2014) since they are expected to remain in the elastic range. This is considered a conservative approach, although it does not necessarily represent the ultimate failure of the bridge deck and tower sections. Although several parameters have been used to derive fragility for cable-stayed bridges (Iemura and Pradono, 2003; Domaneschi, 2005; Casciati et al., 2008; Pang et al., 2014), the parameters proposed in Barnawi and Dyke (2014) are adopted herein: deck's displacement, base shear forces and overturning moments at the piers. Regarding deck response, the maximum absolute deck displacement for each time history analysis is compared to the displacement threshold value equal to 0.1% of the bridge length. Regarding pier response, the threshold value for the base shear force at the deck level and the maximum overturning moment at the footings are calculated from American Concrete Institute (ACI) (2014) specifications.
4. Computation of bridge component response by conducting time history analysis, e.g., pier shear forces and moments are calculated.
5. Calculation of vulnerability at component level and for the global system.
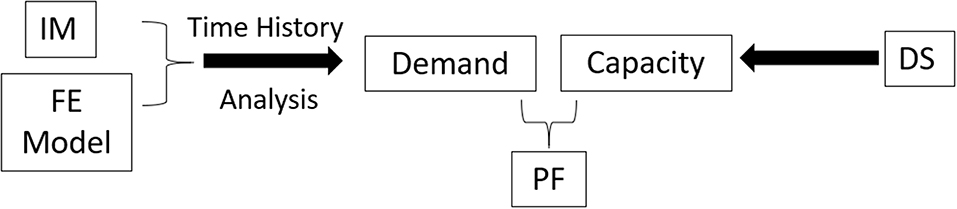
Figure 2. Seismic vulnerability assessment process.
The probability of failure for each critical bridge component is calculated from Equation (2).
where P(Fj)ec is the probability of failure of its bridge component j (i.e., piers, deck), ni is equal to the number of realizations exceeding failure threshold values for the damage state DSi and Na is the total number of analyses for the specific intensity measure (IM).
First-order reliability theory, which expresses the system fragility in the form of upper and lower bounds, is used to combine component vulnerability to calculate bridge systemic fragility. Maximum component fragility is the lower bound, while the upper bound is calculated as shown in Equation (3).
where, N is the number of different components and P(Fbr)e is the total probability of failure of the bridge to earthquake hazard, P(Fjmax)ec is equal to the maximum probability of failure among the components of the same group (e.g., the maximum probability of failure of 1st, 2nd, 3rd, etc. pier).
Uncertainties are considered in terms of intensity measure, while for material properties the mean values are used. To sufficiently cover the hazard curve, different hazard intensity levels (low, medium and high) are investigated by scaling a set of recorded ground motions (Vamvatsikos and Cornell, 2002).
Hurricane Vulnerability
Hurricane hazard is a complex phenomenon where wind, storm surge and waves are considered as critical threats. On the one side wind introduces excitation forces to bridge members, while storm surge/flooding and wave height result in multiple effects like wave impact, current induced scour, and floating debris impact that induce further loads in the bridge system. The physics of these aerodynamic and hydrodynamic loads are complex in nature and difficult to model analytically. Gidaris et al. (2017) highlight that in the last years researchers (Ataei and Padgett, 2012; Padgett et al., 2012; Kameshwar and Padgett, 2014) have made some efforts toward the development of fragility models for coastal bridges against hurricanes. However, there is still plenty of work to do to arrive at robust methods that consider all aspects of a hurricane or flooding event. Especially for cable-stayed bridges there are few studies available that investigate the effect of hurricanes which focus only on extreme wind speeds (Chen, 2015; Chen et al., 2017; Ovett et al., 2018). To provide a more integrated framework accounting for storm surge, wave height and wind speed for assessing vulnerability against hurricane hazard, two approaches are adopted to calculate the probability of failure of the bridge system considering wind, storm surge and wave height. The first approach adopted is the failure probability function for coastal bridges suggested by Kameshwar and Padgett (2014), as shown in Equations (4) and (5). The failure mode that is considered in this approach is the potential deck uplift/unseating due to storm surge and wave height impact. Probability of failure is calculated directly for the global bridge system.
where S is the storm surge, H is the wave height dependent on the wind speed, HB is the pier height from sea-level to the deck, g is the resulting logit function obtained from stepwise logistic regression and is only dependent on the surge, bridge height and wave height.
The second approach evaluates bridge vulnerability to extreme wind forces developed on the bridge during a hurricane event. Ovett et al. (2018) proposed a method that pertains a simple but effective combination of static wind loading and dynamic wind effects to identify critical bridge elements and their vulnerability to failure. Bridge components and sections are evaluated for vertical (lift), horizontal (drag), and torsional (pitch) loading scenarios. Each of these loading scenarios forces the components to undergo compression, tension, flexure, shear, or a combination. In this approach, dynamic wind loads are considered in terms of an equivalent static wind load, and the demand and capacity of the cable-stayed bridge structure are determined for each component for growing wind speed between the minimum and maximum values of wind speed for a specific hurricane intensity. Vehicular loads are not included in the analysis because the bridge is assumed to be closed during hurricane events.
According to Ovett et al. (2018) the total wind force, FT, to be applied on the bridge to perform vulnerability analysis, is described in Equation (6).
where FS is the static wind force, indicating the mean pressure loads and FDYN is the dynamic force including both fluctuating loads due to wind turbulence and inertial forces due to the bridge motion. The static force's, Fs, components are described in Equations (7–9) as lateral, Fsd, vertical, FsL, and torsional forces, Msp, on the bridge deck and lateral forces on the towers, FsL, Tower, and cables, FsL, Cables. Regarding the parameters introduced in Equations (7–11), ρ is the density of the air, u is the velocity of the wind, d is the depth of the deck or diameter of cables, B is the width of the deck, T is the thickness of the tower. The coefficients, Cx, Cz, Cm, Cc, Ct, are non-dimensional numbers experimentally derived from wind tunnel testing that describe the aerodynamic configuration of the shape. The dynamic force component, FDYN, is calculated based on Equation (12).
where U is a dynamic factor applied to the static force (Fs), Fm is the inertial force term and nm is the number of modes used in the analysis.
The wind speeds used to compute the wind forces are selected on a basis to have average wind speed equal to the mean wind speed for the investigated hurricane hazard intensity level. The wind forces are then applied into the finite element model of the bridge and analysis is performed. The damage states used in the vulnerability assessment are the same used for the assessment of earthquake vulnerability. To calculate probability of failure at each component, P(Fj)hwc, Equation (2) is used by substituting ni and N with the corresponding values from the wind analysis and at system level, P(Fbr)hw, Equation (3) is used by substituting P(F_j)ec with the component probability of failure for the hurricane hazard, P(Fj)hwc.
The total probability of failure of the bridge system considering both approaches is equal to the maximum of the system probabilities of failure P(Fbr)hu and P(Fbr)hw, Equation (13).
To account for climate change effects, each hurricane hazard intensity level is investigated along with selected scenarios for sea-level rise. In this manner, the total storm surge height H, will be equal to the sum of the hurricane storm surge and the expected sea-level rise. It is noted that if fragility functions for cable-stayed bridges are developed in future studies, they can easily replace these direct calculations in the implementation of the proposed methodology.
Fourth Step
The fourth step is to conduct risk assessment for the cable-stayed bridge under study as the annual probability of damage based on Kameshwar and Padgett (2014) methodology. Single risk, Rs (h), is computed as the product of the annual frequency of occurrence, AFOz, and the probability of damage of the bridge system, P(Fbr)z, of each investigated hazard intensity, I, Equation (14). Given that the joint occurrence of hurricanes and earthquakes has negligible probability, the total annual risk can be calculated by summing up the single annual risk values, Equation (15), for earthquake and hurricane hazard (Kameshwar and Padgett, 2014).
To provide an improved visualization of risk for supporting decision-making systems a 3-grade risk classification for single and multi-hazard risk is proposed. In Table 2, the qualitative aspects of risk classes are illustrated. According to this classification, grade 1 corresponds to low risk (green color), grade 2 corresponds to medium risk (orange color), grade 3 corresponds to extreme risk (red color). The description of the qualitative risk definition has been derived from AECOM (2015). To quantify annual risk classes, three equal intervals are determined ranging from zero to the maximum possible annual risk value for a single hazard, Rs(h)max. Rs(h)max is calculated by substituting in Equation (14) the system probability of failure, P(Fbr)z, equal to 1 for every hazard intensity level.
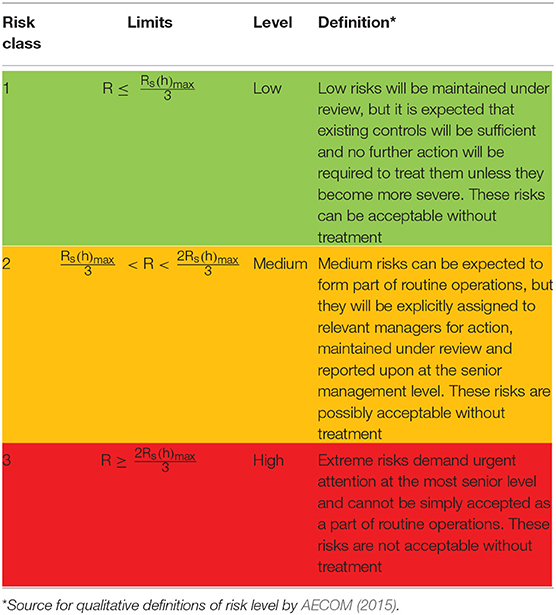
Table 2. Multi-hazard Risk classification.
Case Study
Description of the Selected Cable-Stayed Bridge
The selected case study is the planning of Goethals Bridge replacement. Goethals Bridge was an old truss bridge that provided a direct connection between Staten Island and New Jersey since 1920's and facilitated mobility between New York and New Jersey within the larger context of the trans-Hudson bridges and tunnels in the New York City metropolitan region. The location map is shown in Figure 3. In this region, climate change impact is apparent and will be even more in the near future. Although the replacement project is already under construction including two cable-stayed bridges (one for each traffic direction) that have a total length of approximately 540 m with a 265 m long main span with two towers, herein a design alternative for the new Goethals Bridge is investigated for demonstrating the efficiency of the proposed methodology accounting for natural hazards and climate change effects. The investigated design alternative, Figure 4 is a cable-stayed bridge that is continuous over a total length of 1,020 m with 255 m main spans and 127.5 m long end spans to prevent uplift at the end piers. The width of the bridge is equal to 17 m. There are four pylons Y shaped with a hollow rectangular cross-section, 2.4 × 3.65 m with a thickness of 0.45 m. Their height is 40 m with the deck located 9.5 m above sea-level. Although there is a navigation clearance for permitting passage of deep-sea vessels, it is neglected to allow for lower pylon heights that show higher sensitivity to climate change effects. The base of the pylons has rectangular size 10 × 20 m. The deck is 0.40 m thick and rests on sliding pot bearings over the piers. The concrete strength for the pylons and the deck is 40 MPa. There are 252 cables which are made of 14 mm diameter steel strands (grade 1862 MPa) with the number of strands varying between 15 and 37.
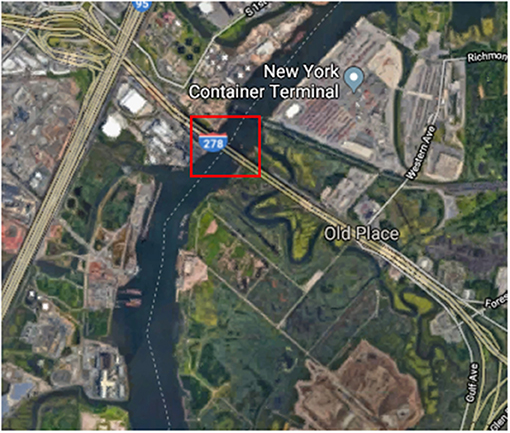
Figure 3. Bridge location (Google, 2018).
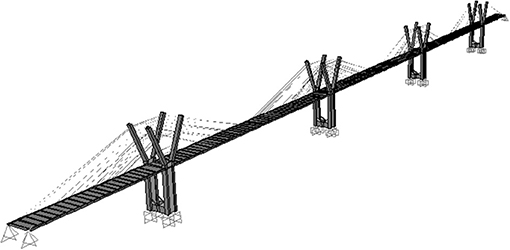
Figure 4. 3D Elevation view of the cable-stayed bridge.
Implementation of the Risk Assessment Methodology
The proposed risk assessment methodology is conducted to evaluate the multi-hazard annual risk for the selected cable-stayed bridge. Given that the bridge under study is located in the Hudson river region in the New York Metropolitan area, the natural hazards that are identified as critical are the seismic and hurricane hazard. No interaction between these two hazards is considered since the simultaneous occurrence of these events is extremely rare. For each hazard, eight hazard intensity levels are investigated to sufficiently cover the hazard curve (low, medium and high intensities). To compute single and multi-hazard risks the mean annual frequency of occurrence for each intensity level is used.
Firstly, the seismic hazard intensity levels are determined. In Figure 5 the seismic hazard curve for the Goethal's Bridge location (40.634830794, −74.191499234) is presented in terms of mean annual frequency of exceedance as generated by the United States Geological Survey (U.S. Geological Survey, 2019) tool that provides seismic hazard curves for different locations in the United States describing the mean annual frequency of exceeding different seismic intensity levels. The earthquake event with a probability of exceedance of 10% in 50 years, which is the design load for life safety, with a return period of 475 years is selected for the development of the corresponding ASCE-16 acceleration response spectrum for soft soils. Seven recorded ground motions are selected via Rexel (Iervolino et al., 2010). The ground motions cover a range in magnitudes (Mw = 5.5–7.0) and epicentral distances (R = 10–30 km) and are appropriately scaled so that their average elastic acceleration response spectrum is compatible with the code response spectrum. In Figure 6 the scaled response spectrum for each ground motion record, the mean response spectrum and the targeted response spectrum are presented. To investigate different earthquake intensities, the set of ground motions is then scaled to cover Spectral Acceleration (Sa) values from 0.08 to 0.8 g (a total number of eight intensities).
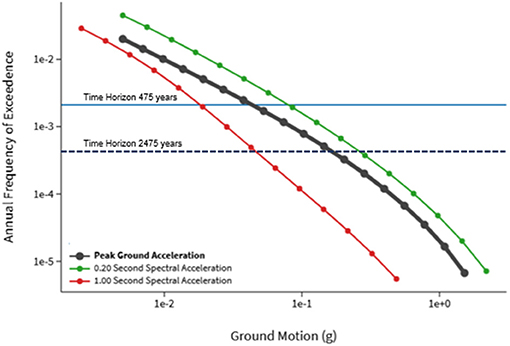
Figure 5. Seismic Hazard Curve for Goethal's Location, USGS.
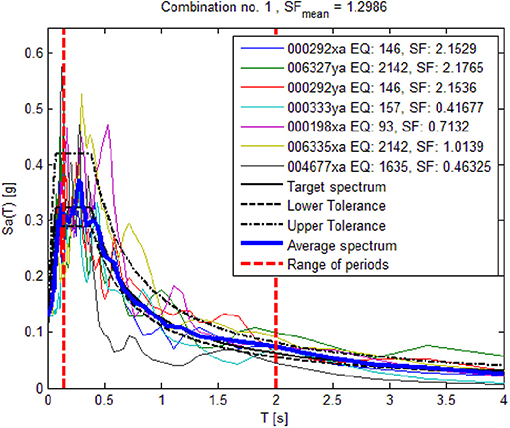
Figure 6. Record spectra, average scaled response spectrum of the accelerograms and NEHRP response spectrum (soft soil) for Tr = 475 years.
Unlike seismic hazard data, hurricane hazard models are less available and present wide variations in their predictions. Lopeman (2015) identified that during hurricane Sandy, there was a total storm surge of 5.27 m that corresponded to 2.75 m flood height, 2.45 m tidal height and 0.07 m current sea-level rise. The last two flood heights are used as the basis to add on the selected hurricane hazard storm surge intensities. Lopeman et al. (2015) also indicated that Sandy was 103-year event flood while other researchers estimate that this storm surge height corresponds to events with larger return periods (500–3,500 years). Lin et al. (2016) have estimated that Sandy had a return period of 398 years (NCEP-2000 curve), which seems a reasonable prediction among the extremes found in literature. Hence, herein the NCEP-2000 curve for flood heights from Lin et al. (2016) is used to determine hurricane hazard intensities to sufficiently cover all hurricane levels (low, medium, and high) and eight storm surge heights are selected based on their corresponding return periods ranging from 100 to 104 years. Annual risk is calculated based on the mean annual frequency of occurrence for the selected hazard intensities. Wind speed for each hurricane storm surge intensity is selected based on the Lin et al. (2010) wind speed and storm surge correlation curve. To conduct wind analysis, seven wind speed intensities are used which are distributed uniformly with a deviation of ±6 m/s from the mean derived wind speed. Considering that in shallow waters, waves are fetch limited, wave heights are calculated based on wave height approximations provided in the Shore Protection Manual (USACE, 1984). Using the approximation that the maximum wave height is equal to 0.78 × depth and considering that the depth in the area is 15 m deep, the upper limit for wave height is 11.7 m.
New York Metropolitan area has been also identified as extremely sensitive to climate change (Rosenzweig et al., 2011) and the most important impact of climate change will be sea-level rise. In particular, Horton et al. (2014) state that sea-level is projected to rise along the tidal Hudson by 0.05–0.254 m (2–10 in.) by the 2020s, 0.20–0.76 m (8–30 in.) by the 2050s, 0.33–1.47 m (13–58 in.) by the 2080s and 0.48–1.75 m (15–75 in.) by the 2100s. As mentioned in the previous section, sea-level rise affects directly the height of storm surge (Garnera et al., 2017), since it is directly added upon it. To account for sea-level rise in vulnerability assessment four sea-level rise scenarios are selected and incorporated in the hazard analysis. The first scenario represents the current situation (SLR0), the second scenario is 0.6 m of sea-level rise (SLR1) corresponding to sea-level rise by the 2020s, the third scenario is 1.2 m (SLR2) corresponding to sea-level rise by the 2080s and the fourth is 1.75 m (SLR3) corresponding to sea-level rise by the 2100s. To be consistent with predictions for 2100, in the SLR3 scenario, the NECP prediction model for 2100 storm surge height from Lin et al. (2016) is adopted. Table 3 summarizes the values of each parameter for the selected hurricane return periods combined with climate change impact. Based on this table a total number of 20 hurricane combined with sea-level rise scenarios are investigated.
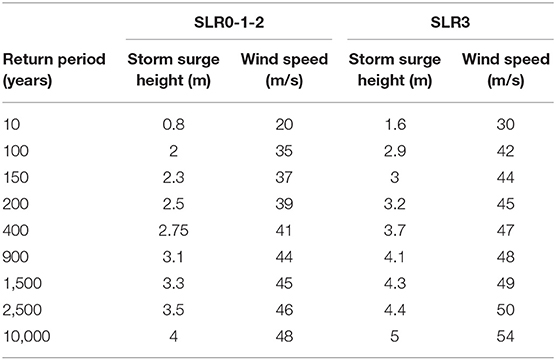
Table 3. Storm surge height and wind speed for the selected return periods and sea-level rise scenarios.
The next step in the proposed methodology is to conduct the vulnerability assessment for the investigated hazard intensity levels. Firstly, a 3D finite element model of the bridge is developed. The deck is modeled with shell elements and pylons are modeled with frame elements. The cables are modeled as single beam elements such that low frequency modes such as cable vibrations are not captured in the global system response. The application of thermal loads in the concrete deck is used to consider the post-tensioning effect in the cables and continuity strands. Time history analysis is performed for the selected seismic hazard intensities and maximum deck displacement, base shear forces and moments are recorded.
To calculate the probability of failure for the investigated seismic intensities for each bridge member the threshold values for the determined damage state are derived. The limit state of deck displacement is equal to 1.1 m (0.1% of bridge length); Based on ACI requirements (American Concrete Institute (ACI), 2014) the analysis shows that a limit state of 15356 kN for shear capacity and 109142 kNm for moment capacity are suitable for this study and are within the ultimate thresholds of the towers. Hurricane vulnerability, P(Fbr)hu is directly calculated for the global bridge system according to Equations (4) and (5). To perform the equivalent static wind analysis, the static and dynamic forces on the bridge are calculated for the selected wind speeds for the derived wind speed values. The aerodynamic coefficients and U (fluctuating dynamic coefficient) were selected based on the aerodynamic configuration of the structure empirically using conservative values as shown in Table 4. The inertial force, Fm, is not included in the analysis due to its small contribution to the model based on preliminary modal analysis (Ovett et al., 2018).
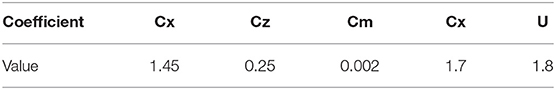
Table 4. Coefficients for wind analysis.
Results and Discussion
In Figure 7, component and systemic earthquake vulnerability for the investigated seismic intensities are presented as the probability of damage relative to the annual frequency of occurrence. As it is expected, it is less probable for the bridge to fail under low seismic intensity values that have larger probability of occurrence. It is observed that the piers are more vulnerable to shear forces rather than to flexure. It is also noted that the global probability of failure of the bridge system is large for high seismic intensity levels even for the lower bound of Equation (3). Figure 8 demonstrates the computed vulnerability at component and bridge system level due to the wind forces induced by the selected hurricane intensity levels. The analysis has shown that the deck is more vulnerable in comparison to the towers of the cable-stayed bridge for all wind speed intensities. For instance, when mean wind speed is 50 m/s, the deck probability of failure exceeds 50%. To calculate bridge vulnerability to storm surge and wave height, the probability of failure for the global bridge system is directly calculated from Equations (4) and (5). The maximum probability of failure for each hurricane intensity level and SLR scenario is then derived as the maximum of the two global bridge system probabilities of failure for wind speed and storm surge. This probability of failure is used in the calculation of the annual risk to hurricane hazard. Figure 9 shows the calculated probability of failure to storm surge and wave height and the final maximum probability of failure for each of the investigated scenarios without and with SLR. It is observed that for the current sea-level the bridge has a low probability of failure for events with storm surge lower than 3 m and noticeably higher for extreme hurricane events with over 2,500 years return period and smaller mean annual frequency. However, there is a dramatic increase in the vulnerability of the bridge to hurricanes when sea-level rise projections are applied, especially at SLR3, which is the worst-case scenario. It should be highlighted that this increase in vulnerability in SLR3 is attributed also to the increased storm surge heights for the same return periods used in the analysis. It is also observed, based on the red points on the plots of Figure 9, which depict the maximum probability of failure, that wind forces are the dominant cause of bridge vulnerability for SLR0 and for the low hurricane intensity levels for the rest of SLR scenarios.
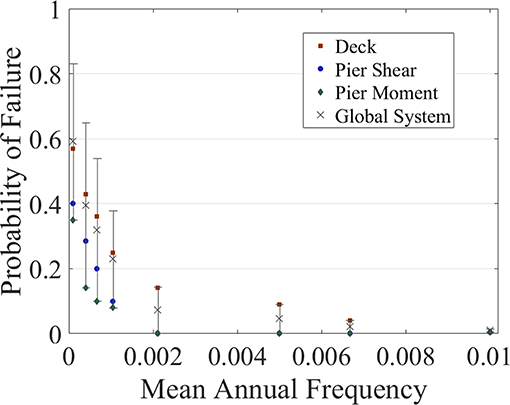
Figure 7. Component and systemic probability of failure to earthquake hazard.
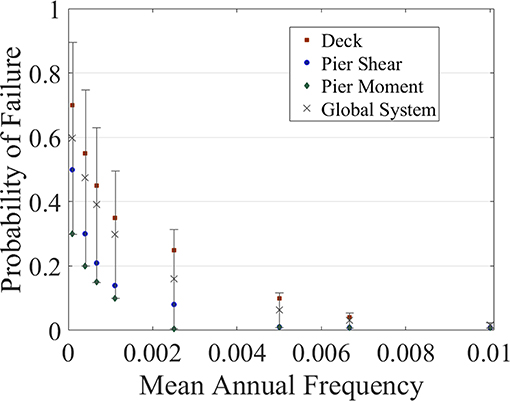
Figure 8. Component and systemic probability of failure to wind hazard during hurricane events.
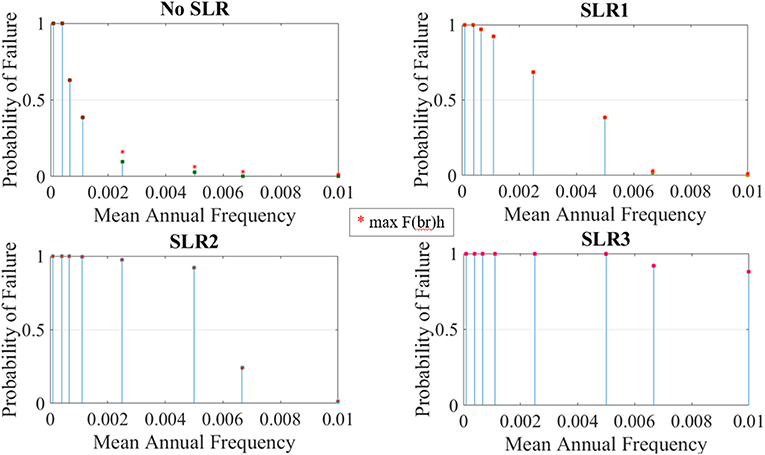
Figure 9. Systemic probability of failure to storm surge and wave height and maximum probability of failure for the selected hurricane events and sea-level rise scenarios.
Single and multi-hazard risk is calculated according to Equations (14) and (15). Mean annual frequency of occurrence of the selected hazard intensities is multiplied with the probability of damage to provide a consistent basis for risk quantification. Figure 10 presents the calculated risk values for single, earthquake (E) and hurricane (H) hazard, and multi-hazard scenarios. Regarding earthquake hazard, the calculated risk is low. Regarding hurricane hazard, the bridge faces low risk for the SLR0 and SLR1 medium for the SLR2 and high for SLR3. As shown in Figure 10 when both hazards are considered in the first three scenarios of sea-level rise, total risk follows hurricane risk levels which means that it is low for the SLR0 and SLR1, medium for SLR2 and high for SLR3, which is the worst sea-level rise scenario. In light of the above, it is evident that the governing hazard for the bridge performance is the hurricane and that the risk is higher when climate change impact is adopted in the analysis. Hence, the study can be an indicator for measures to be taken to mitigate hurricane hazard and reduce climate change impact. For instance, in the investigated design alternative bridge pier height can be increased to lower the probability of failure of the bridge system.
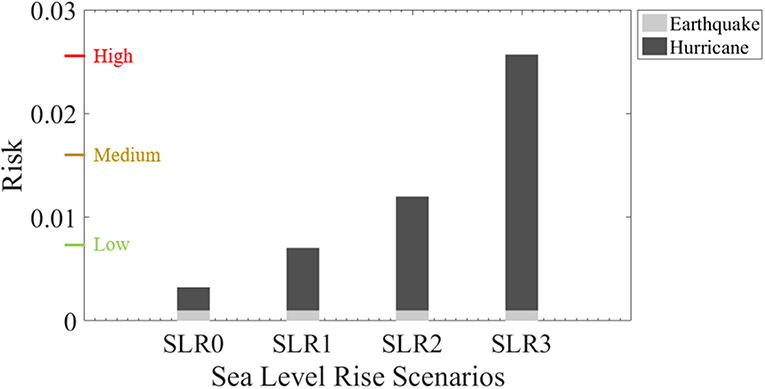
Figure 10. Single and multi-hazard risk for the investigated sea-level rise scenarios.
In the light of the above, a practical implication of the research should be highlighted. Current regulations and standards still haven't included climate change scenarios in their provisions to associate them with specific hazard intensity levels. A practical challenge, is how to establish the incorporation of climate change scenario when addressing the demand of different natural hazards. As mentioned above, there are several climatic models that show variable climate change levels. However, it is accepted by most scientists that some effects like sea level rise are inevitable. Hence, the premise of this research is that by understanding the climate change impact on bridges, it can contribute to the improvement of standards and regulations for multi-hazard assessment of infrastructure toward this direction.
Conclusions
The consideration of climate change and natural hazard risk in the design or maintenance of cable-stayed bridges is a significant challenge. Risk quantification is important for stakeholders and project managers to perform justified decision-making processes. In the last years, there have been some attempts to incorporate climate change into multi-hazard risk assessment methodologies. However, research on assessment methodologies for cable-stayed bridges is still limited. The present study focuses on a risk assessment methodology of cable-stayed bridges to natural hazards and climate change impact. A simplified framework that avoids high computational cost is presented as the means to prioritize risk. The following conclusions are derived:
• In the proposed methodology different hazard intensity levels are selected to represent sufficiently the hazard curve. To provide a consistent basis for risk calculation the mean annual frequency of occurrence is considered for each investigated hazard intensity level. It should be noted that hurricane hazard data is less available than earthquake hazard data and presents diversity among the estimations of different researchers. Climate change impact is also adopted in the analysis by incorporating the increase of sea-level in establishing hurricane hazard scenarios.
• Earthquake and hurricane vulnerability at component and system level are computed independently based on discrete hazard events. Regarding hurricane vulnerability, the effects of storm surge and wave height along with wind forces on bridge components affecting the structure's aeroelastic stability are considered.
• Single hazard risk is evaluated as the product of the mean annual frequency of occurrence and probability of damage. To estimate multi-hazard risk, single risk values are added for each case study scenario. The qualitative and quantitative classification of risk contributes to the establishment of useful indicators for decision-making processes on adopting mitigation measures.
• The application of the proposed risk assessment methodology on the case study cable-stayed bridge in New York Metropolitan Region, considers both earthquake and hurricane hazard along with sea-level rise projections due to climate change. The analysis has shown that the bridge has low risk to seismic hazard. Regarding hurricanes, the application of the proposed methodology demonstrates that the annual probability of damage is very low for the current situation, while it is much higher in the worst-case scenario of sea-level rise. In the integrated multi-hazard assessment, hurricane is the dominant hazard of the total risk, which is classified low for the first two the scenarios of sea-level rise, medium for the intermediate level of sea-level rise and high for the projection corresponding to 2100's.
Data Availability Statement
The raw data supporting the conclusions of this manuscript will be made available by the authors, without undue reservation, to any qualified researcher.
Author Contributions
The author confirms being the sole contributor of this work and has approved it for publication.
Conflict of Interest
The author declares that the research was conducted in the absence of any commercial or financial relationships that could be construed as a potential conflict of interest.
References
AECOM (2015). Global Climate Change, Adaptation and Infrastructure Issues Knowledge Management Support.
Akhoondzade, V., and Bargi, K. (2016). Study on different cable configurations of cable-stayed bridges using developed seismic risk assessment. Str. Eng. Int. 26, 312–323. doi: 10.2749/101686616X14555428759280
American Concrete Institute (ACI) (2014). Building Code Requirements for Structural Concrete and Commentary. ACI 318-14, Detroit.
Apaydin, N. M. (2010). Earthquake performance assessment and retrofit investigations of two suspension bridges in Istanbul. Soil Dyn. Earth. Eng. 30, 702–710. doi: 10.1016/j.soildyn.2010.02.011
Ataei, N., and Padgett, J. E. (2012). Probabilistic modeling of bridge deck unseating during hurricane events. J. Bridge Eng. 19, 275–286. doi: 10.1061/(ASCE)BE.1943-5592.0000371
Barnawi, W., and Dyke, S. (2014). Seismic fragility relationships of a cable-stayed bridge equipped with response modification systems. J. Bridge Eng. 19:A4013003. doi: 10.1061/(ASCE)BE.1943-5592.0000468
Bensi, M., Bhattacharya, B., and Chajes, M. J. (2005). Evaluating the risk of a terrorist attack on a cable-stayed bridge: a probabilistic, structural analysis based approach. WIT Trans. Built Environ. 82, 133–142. doi: 10.2495/SAFE050141
Boin, A., and Mc Connell, A. (2007). Preparing for critical infrastructure breakdowns: the limits of crisis management and the need for resilience. J. Contingencies Crisis Manage. 15, 50–59. doi: 10.1111/j.1468-5973.2007.00504.x
Casciati, F., Cimellaro, G. P., and Domaneschi, M. (2008). Seismic reliability of a cable-stayed bridge retrofitted with hysteretic devices. Comp. Struct. 86, 1769–1781. doi: 10.1016/j.compstruc.2008.01.012
Chang, K. C., Mo, Y. L., Chen, C. C., Lai, L. C., and Chou, C. C. (2004). Lessons learned from the damaged Chi-Lu cable-stayed bridge. J. Bridge Eng. 4, 343–352. doi: 10.1061/(ASCE)1084-0702(2004)9:4(343)
Chen, S., Zhou, Y., Wub, J., Chen, F., and Hou, G. (2017). Research of long-span bridge and traffic system subjected to winds: a system and multi-hazard perspective. Int. J. Trans. Sci. Technol. 6, 184–195. doi: 10.1016/j.ijtst.2017.07.006
Chen, X. (2015). Analysis of multimode coupled buffeting response of long-span bridges to nonstationary winds with force parameters from stationary wind. J. Struct. Eng. 141:04014131. doi: 10.1061/(ASCE)ST.1943-541X.0001078
Decò, A., and Frangopol, D. M. (2011). Risk assessment of highway bridges under multiple hazards. J. Risk Res. 14, 1057–89. doi: 10.1080/13669877.2011.571789
Domaneschi, M. (2005). Structural control of cable-stayed suspended bridges (Doctoral dissertation). The University of Pavia, Pavia, Italy.
Domaneschi, M., and Martinelli, L. (2015). Earthquake resilience-based control solutions for the extended benchmark cable-stayed bridge. J. Struct. Eng. 142:4015009. doi: 10.1061/(ASCE)ST.1943-541X.0001392
Domaneschi, M., Martinelli, L., and Perotti, F. (2015) Wind earthquake protection of cable-supported bridges. Bridge Eng. 169, 157–171. doi: 10.1680/bren.14.00026
Dong, Y., and Frangopol, D. M. (2016). Probabilistic time-dependent multihazard life-cycle assessment and resilience of bridges considering climate change. J. Perform. Constr. Facil. 30:04016034. doi: 10.1061/(ASCE)CF.1943-5509.0000883
Garnera, A., Mannc, M., Emanuele, K., Koppb, R., Ling, N., and Alleyh, R. (2017) Impact of climate change on New York City's coastal flood hazard: increasing flood heights from the preindustrial to 2300 CE. PNAS 114, 11861–11866. doi: 10.1073/pnas.1703568114.
Gidaris, I., Padgett, J. E., Barbosa, A. R., Chen, S., Cox, D., Webb, B., et al. (2017). Multiple-hazard fragility and restoration models of highway bridges for regional risk and resilience assessment in the United States: state-of-the-art review. J. Struct. Eng. 143:04016188. doi: 10.1061/(asce)st.1943-541x.0001672
Google (2018). Retrieved from: https://www.google.gr/maps/@40.63538,-74.19598,13z
Horton, R., Yohe, G., Easterling, W., Kates, R., Ruth, M., Sussman, E., et al. (2014). “Ch. 16: Northeast,” in Climate Change Impacts in the United States: The Third National Climate Assessment, eds J. M. Melillo, T. C. Richmond, and G. W. Yohe (U.S. Global Change Research Program), 371–395. doi: 10.7930/J0SF2T3P
Iemura, H., and Pradono, M. H. (2003). Application of pseudo-negative stiffness control to the benchmark cable-stayed bridge. J. Struct.Control 10, 187–203. doi: 10.1002/stc.25
Iervolino, I., Galasso, C., and Cosenza, E. (2010). REXEL: computer aided record selection for code-based seismic structural analysis. Bull. Earthq. Eng. 8, 339–362. doi: 10.1007/s10518-009-9146-1
Intergovernmental Panel on Climate Change (IPCC) (2007). Climate Change 2007: Synthesis Report. Available online at http://www.ipcc.ch/publications_and_data/ar4/syr/en/contents.html
Jacob, K., Deodatis, G., Atlas, J., Whitcomb, M., Lopeman, M., Markogiannaki, O., et al. (2011). Responding to climate change in New York State: the ClimAID integrated assessment for effective climate change adaptation in New York State: transportation. Ann. N. Y. Acad. Sci. 1244, 299–362. doi: doi.org/10.1111/j.1749-6632.2011.06331.x
Kafali, C. (2008). System performance under multihazard environment (Ph.D. thesis). Cornell University, Ithaca, NY, United States.
Kameshwar, S., and Padgett, J. E. (2014). Multi-hazard risk assessment of highway bridges subjected to earthquake and hurricane hazards. Eng. Struct. 78, 154–166. doi: 10.1016/j.engstruct.2014.05.016
Khan, R., and Datta, T. (2010). Probabilistic risk assessment of fan type cable-stayed bridges against earthquake forces. J. Vibr. Contr. 16, 779–799. doi: 10.1177/1077546308097266
Khan, R., Datta, T., and Ahmad, S. (2004). “Seismic risk analysis of cable stayed bridges with support flexibility,” in 13th World Conference on Earthquake Engineering (Vancouver, BC).
Khelifa, A., Garrow, L., Higgins, M., and Meyer, M. (2013). Impacts of climate change on scour-vulnerable bridges: assessment based on HYRISK. J. Infr. Syst. 19, 138–146. doi: 10.1061/(ASCE)IS.1943-555X.0000109
Li, Y., Ahuja, A., and Padgett, J. E. (2012). Review of methods to assess, design for, and mitigate multiple hazards. J. Perform. Constr. Facil. 26, 104–17. doi: 10.1061/(ASCE)CF.1943-5509.0000279
Li, Y., and Ellingwood, B. (2009). Framework for multihazard risk assessment and mitigation for wood-frame residential construction. J. Struct. Eng. 135, 159–68. doi: 10.1061/(ASCE)0733-9445(2009)135:2(159)
Li, Y., and van de Lindt, J. W. (2012). Loss-based formulation for multiple hazards with application to residential buildings. Eng. Struct. 38, 123–33. doi: 10.1016/j.engstruct.2012.01.006
Lin, N., Emanuel, K., Smith, J., and Vanmarcke, E. (2010). Risk assessment of hurricane storm surge for New York City. J. Geoph. Res. 115, 1–11. doi: 10.1029/2009JD013630
Lin, N., Kopp, R., Horton, B., and Donnelly, J. (2016). Hurricane Sandy's flood frequency increasing from year 1800 to 2100. Proc. Natl. Acad. Sci. U.S.A. 113, 12071–12075. doi: 10.1073/pnas.1604386113
Lopeman, M. (2015). Extreme storm surge hazard estimation and windstorm vulnerability assessment for quantitative risk analysis (Ph.D. thesis). Columbia University, New York, NY, United States.
Lopeman, M., Deodatis, G., and Franco, G. (2015). Extreme storm surge hazard estimation in lower Manhattan. Nat. Hazards 78, 355–391. doi: 10.1007/s11069-015-1718-6
McCullough, M., and Kareem, A. (2011). “A framework for performance-based engineering in multi-hazard coastal environments,” in Structures Congress ASCE (Las Vegas, NV: ASCE), 1961–1972. doi: 10.1061/41171(401)171
Milly, P. C. D., Betancourt, J., Falkenmark, M., Hirsch, R. M., Kundzewicz, Z. W., Lettenmaier, D. P., et al. (2008). Stationarity is dead: whither water management. Science 319, 573–574. doi: 10.1126/science.1151915
New York City Panel on Climate Change (2013). “Climate risk information 2013: observations, climate change projections, and maps,” in NPCC2. Prepared for use by the City of New York Special Initiative on Rebuilding and Resiliancy, eds C. Rosenzweig and W. Solecki (New York, NY).
Nielson, B. (2005). Analytical fragility curves for highway bridges in moderate seis- mic zones (Ph.D. thesis). Georgia Institute of Technology, Atlanta, GA, United States.
Ovett, M., Chorzepa, M., Durham, S., Christian, J., and Davis, B. (2018). Vulnerability to failure of cable-stayed bridges for beyond-design basis wind events. Eng. Fail.Anal. 91, 182–200. doi: 10.1016/j.engfailanal.2018.04.038
Pacheco, B. M., Fujino, Y., and Sulekh, A. (1993). Estimation curves for modal damping in stay cables with viscous damper. J. Struct. Eng. 119, 1961–1979. doi: 10.1061/(ASCE)0733-9445(1993)119:6(1961)
Padgett, J. E. (2007) Seismic vulnerability assessment of retrofitted bridges using probabilistic methods (Ph.D. thesis). School of Civil and Environmental Engineering Georgia Institute of Technology, Atlanta, GA, United States.
Padgett, J. E., Spiller, A., and Arnold, C. (2012). Statistical analysis of coastal bridge vulnerability based on empirical evidence from Hurricane Katrina. Struct. Infrastruct. Eng. 8, 595–605. doi: 10.1080/15732470902855343
Pang, Y., Wu, X., Shen, G., and Yuan, W. (2014). Seismic fragility analysis of cable-stayed bridges considering different sources of uncertainties. J. Bridge Eng. 19:04013015. doi: 10.1061/(ASCE)BE.1943-5592.0000565
Ren, W. X., and Obata, M. (1999). Elastic-plastic seismic behavior of long span cable-stayed bridges. J. Bridge Eng. 3, 194–203. doi: 10.1061/(ASCE)1084-0702(1999)4:3(194)
Rosenzweig, C., Solecki, W., DeGaetano, A., O'Grady, M., Hassol, S., and Grabhorn, P. (2011). Responding to climate change in New York state: the ClimAID integrated assessment for effective climate change adaptation. Ann. N. Y. Acad. Sci. 1244, 2–149. doi: 10.1111/j.1749-6632.2011.06331.x
Salman, A. M., and Li, Y. (2017). Multihazard risk assessment of electric power systems. J. Struct. Eng. 143:04016198. doi: 10.1061/(ASCE)ST.1943-541X.0001688
Salman, A. M., and Li, Y. (2018). A probabilistic framework for multi-hazard risk mitigation for electric power transmission systems subjected to seismic and hurricane hazards. Struct. Infrastruct. Eng. 14, 1499–1519. doi: 10.1080/15732479.2018.1459741
The Japan Times (2018). Bridge Collapse Costs Genoa Companies€422 Million in Damages: Chamber of Commerce. Availabe online at: https://www.japantimes.co.jp/news/2018/11/09/business/bridge-collapse-costs-genoa-companies-e422-million-damages-chamber-commerce/#.XDRUCs3QCUk
Topkara, N., Sarica, G. M., Caner, A., and Askan, A. (2015). “Preliminary assessment of seismic vulnerability of lifelines with a focus on bridges,” in New York City Bridge Conference 2015 (New York, NY).
U.S. Geological Survey (2019). Earthquake Hazards Program – Unified Hazard Tool. Available online at: https://earthquake.usgs.gov/hazards/interactive/
U. S. Department of Transportation (US DOT) (2006). Strategic Plan 2006-2010. Center for Climate Change and Environmental Forecasting. Available online at http://climate.dot.gov/documents/splan_2006.pdf
USACE (1984). Shore Protection Manual, Vol. 2. Washington, DC: US Army Engineer Waterways Experiment Station, Coastal Engineering Research Center, US Government Printing Office.
Vamvatsikos, D., and Cornell, C. A. (2002). Incremental dynamic analysis. Earthq. Eng. Struct. Dynam. 31, 491–514. doi: 10.1002/eqe.141
Yan, D., and Chang, C. C. (2009). Vulnerability assessment of cable-stayed bridges in probabilistic domain. J. Bridge Eng.14, 270–278. doi: 10.1061/(ASCE)1084-0702(2009)14:4(270)
Yan, D., and Chang, C. C. (2010). Vulnerability assessment of single-pylon cable-stayed bridges using plastic limit analysis. Eng. Struct. 32, 2049–2056. doi: 10.1016/j.engstruct.2010.03.005
Zhong, J., Jeon, J., and Ren, W. (2018). Risk assessment for a long-span cable-stayed bridge subjected to multiple support excitations. Eng. Struct. 176, 220–230. doi: 10.1016/j.engstruct.2018.08.107
Zimmerman, R. (2002). Global Climate Change and Transportation Infrastructure: Lessons From the New York Area. Washington, DC: U.S. Department of Transportation, Center for Climate Change and Environmental Forecasting. Available online at http://climate.dot.gov/documents/workshop1002/zimmermanrch.pdf
Keywords: bridge vulnerability, seismic risk, hurricane risk, cable-stayed bridge, multi-hazard, sea-level rise, climate change, New York Metropolitan area
Citation: Markogiannaki O (2019) Climate Change and Natural Hazard Risk Assessment Framework for Coastal Cable-Stayed Bridges. Front. Built Environ. 5:116. doi: 10.3389/fbuil.2019.00116
Received: 17 February 2019; Accepted: 20 September 2019;
Published: 09 October 2019.
Edited by:
Joan Ramon Casas, Universitat Politecnica de Catalunya, SpainReviewed by:
Abdullahi M. Salman, University of Alabama in Huntsville, United StatesMarco Domaneschi, Politecnico di Torino, Italy
Copyright © 2019 Markogiannaki. This is an open-access article distributed under the terms of the Creative Commons Attribution License (CC BY). The use, distribution or reproduction in other forums is permitted, provided the original author(s) and the copyright owner(s) are credited and that the original publication in this journal is cited, in accordance with accepted academic practice. No use, distribution or reproduction is permitted which does not comply with these terms.
*Correspondence: Olga Markogiannaki, b21hcmtvZ2lhbm5ha2lAdW93bS5ncg==