 Beema Dahal
 Debakanta Mishra
- 1Department of Civil Engineering, Boise State University, Boise, ID, United States
- 2School of Civil and Environmental Engineering, Oklahoma State University, Stillwater, OK, United States
Particle shape and mineralogy have been found to greatly affect railroad ballast response under train loading. In this research effort, the effect of particle breakage on ballast permanent deformation behavior was studied using the Discrete Element Method (DEM). Real ballast particle shapes were digitized using an inexpensive imaging tool, and agglomerates of spheres were used to regenerate those complex shapes. Particle crushing tests were carried out in the laboratory, and discrete element models simulating the crushing test were calibrated based on the laboratory test results. Model parameters established through this calibration process were subsequently used to study the permanent deformation response of ballast layers comprising complex-shaped breakable ballast particles under repeated loading. The effect of particle shape was studied by comparing the permanent deformation behavior for ballast layers comprising simplified ellipsoid particles to those comprising the complex-shaped particles simulated using agglomerates of spheres. The simulation results clearly highlighted the significance of particle breakage in ballast permanent deformation accumulation under cyclic loading. Most particle breakage was observed to occur under the initial load cycles, which also corresponded to the highest rate of permanent strain accumulation. The particle breakage as well as the rate of strain accumulation gradually decreased with increasing load cycles.
Introduction
As a part of the railroad track substructure, the ballast layer performs various functions like resisting the vertical, longitudinal, and transverse forces from trains; distributing the high stresses to protect underlying track layers; absorbing the shock from dynamic loads from moving trains, and facilitating the free drainage conditions (Nimbalkar and Indraratna, 2015). As the ballast layer ages, it is progressively fouled with materials that are finer than the initial ballast aggregates (Qian et al., 2014). The main cause of ballast fouling is attributed to ballast degradation and breakdown of the uniformly-graded ballast aggregates under repeated train loading (Selig et al., 1988, 1992). It has been reported that ~76% of the ballast layer fouling occurs due to ballast breakage (Selig and Waters, 1994). Particle breakage significantly influences the shear strength and deformation behavior of railroad ballast layers (Indraratna et al., 1998; Anderson and Key, 2000), resulting in unacceptable differential settlement of track and pumping of underlying soft subgrade soils which eventually necessitate frequent costly track maintenance (Indraratna and Nimbalkar, 2011). Accordingly, to study the influence of particle breakage on the strength and deformation characteristics of granular soils, numerous experimental (Shenton, 1975; Lackenby et al., 2007; Aursudkij et al., 2009; Indraratna et al., 2010b), and numerical-discrete element (DE) (Lim and McDowell, 2005; LoboGuerrero and Vallejo, 2006; Lu and McDowell, 2010) studies have been conducted. Numerical studies have been frequently used for the ballast breakage studies as they give a complete picture of where the degradation starts, how it evolves, and how it affects the permanent deformation of railroad tracks (LoboGuerrero and Vallejo, 2006).
Most three-dimensional DE codes use spheres to represent particle shapes due to their ease in the detection of inter-particle contact and force calculation. Models to describe the physics of contacts between spheres with walls, and with each other are relatively well-known (Di Maio and Renzo, 2004; Kruggel-Emden et al., 2007). Spheres can be used to approximate the qualitative behavior of the granular materials, but cannot give the information on the quantitative measures and therefore show deviant mechanical behavior than the actual material in consideration (Latham and Munjiza, 2004; Kruggel-Emden et al., 2009; Ferellec and McDowell, 2010). Particle shape, size, and minerology have been found to have significant impacts on the mechanical behavior of the granular materials (Azéma et al., 2013; Höhner et al., 2013). However, representation of the particle shape has been one of the main challenges of DE simulations (Markauskas et al., 2010). There are Discrete Element Method (DEM) tools such as like BLOKS3D that can simulate actual interaction between the polyhedral shapes (Zhao et al., 2006) but are not able to simulate breakages. Hence, using PFC3D this research study uses the concept of agglomerates where spheres are bonded together to represent the complex and irregular polyhedral particle shapes as they can make the contact detection and force calculation easy. Similar approaches have been used by (McDowell and Harireche, 2002; Thornton and Liu, 2004; Alshibli and Cil, 2014) to model the particle breakage. It should be noted that in the remainder of this manuscript, polyhedral and ellipsoid shapes were actually approximated by using agglomerates of bonded spheres. To understand the significance of ballast breakage considerations on permanent deformation behavior of railroad ballast layer under repeated loading, the authors initially conducted a study using simple ellipsoid shapes as representative ballast shapes and reported the findings in an earlier manuscript (Dahal et al., 2018). However, since the ballast particles in Dahal et al. (2018) were simulated as ellipsoids, the results were arguably different from real-world scenarios where the ballasts are polyhedral in nature. Besides, the bond strength values (primarily governing the particle breakage) assigned to the ballast agglomerates were modified from the values obtained from the literature (Indraratna et al., 2010b). Accordingly, subsequent research tasks focused on modeling railroad ballast behavior under repeated loading by considering realistic particle shapes as well as breakage potential. This manuscript presents major findings from these efforts.
Research objectives
The primary objective of this research effort was to study the importance of considering realistic particle shapes during discrete element modeling while studying the permanent deformation and breakage behavior of railroad ballast under repeated loading. To achieve this objective, one of the tasks involved conducting laboratory tests to quantify the crushing strengths for actual ballast particles, and calibrating DE models of the crushing strength test to establish relevant model parameters to be used in subsequent modeling tasks. The final objective of this manuscript was to compare the results obtained for complex-shaped ballast particles (simulated using the agglomerates of spheres) to those obtained for simplified ellipsoid shapes; this would help identify the importance of considering realistic particle shapes during discrete element modeling.
Acquisition of real ballast shapes
Several researchers have used expensive and complex image analysis approaches to create polyhedral particles for use in DE simulations (Paixão et al., 2001; Le Pen et al., 2013; Qian et al., 2013; Sun et al., 2014). However, such expensive imaging equipment to obtain the scanned 3D image of the ballast shapes are not readily accessible. In such instances, exploration of alternative inexpensive alternatives to digitize realistic ballast particle shapes becomes imperative. With the advent of modern smartphones, it has become increasingly easier to capture high-resolution images that can be easily digitized. This research effort utilized such an approach to digitize actual ballast particle shapes that were subsequently imported into the DE model.
Three different ballast shapes were selected to demonstrate this approach. To capture the images, each ballast was placed on a flat surface such that the flattest part of the particle rested on the platform. More than twenty (20) sequential images of the ballast particles were taken by rotating the particles from 0° to 360° on a horizontal plane, and the images were then imported into the Autodesk® Recap Software (Autodesk Inc., 2018). The flat surface was closed using a built-in feature of the software, and was finally exported in “.stl” format to be used in PFC3D (DE software). Figures 1A–F show the chosen ballast shapes and exported images of ballasts from the software for Ballast 1 (B1), Ballast 2 (B2), and Ballast 3 (B3), respectively. These shapes were approximated within PFC3D using the agglomerates of spheres to be used in the subsequent simulations.
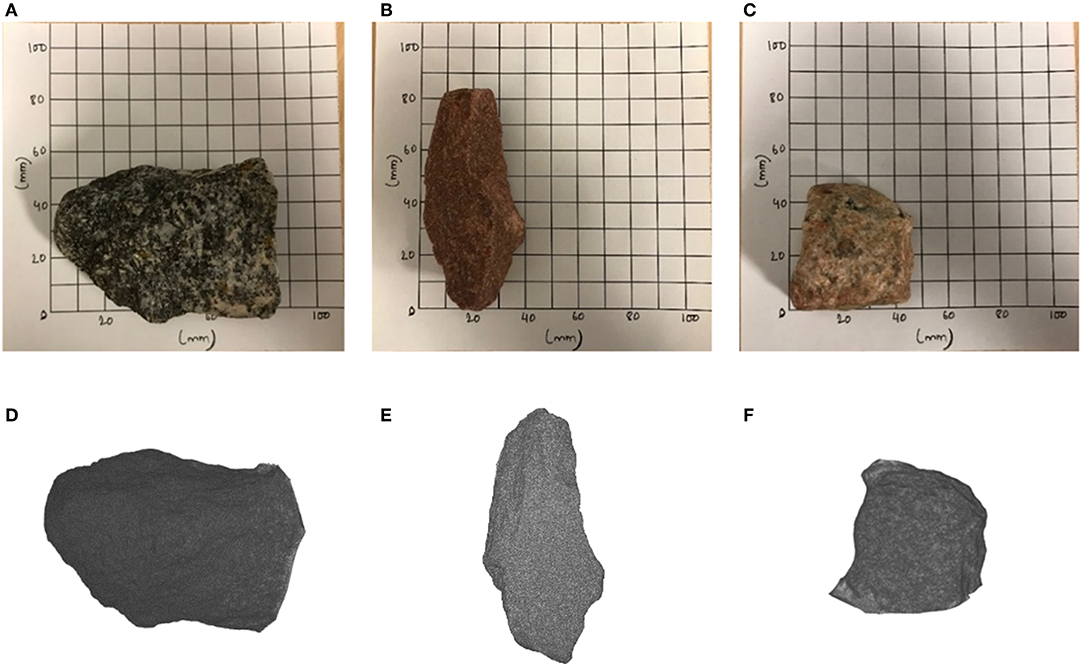
Figure 1. Images of (A) B1; (B) B2; and (C) B3 ballast particles captured using a smartphone; same images have been digitized using Autodesk Recap software (D–F, respectively).
Laboratory specific gravity test
The specific gravity test was conducted to accurately simulate the ballast particles in the DE model. Specific gravity of the selected ballasts was calculated using the following procedure. The test apparatus was set up and the temperature of water was set to 25°C. Each ballast particle was taken separately and was weighed to calculate its dry weight (W1). The particle was then put in water and weighed (W2). Finally, the particle was removed from water, surface dried with a towel by rolling inside a towel for ~5 s, and weighed to obtain the surface dry weight (W3). The specific unit weight or specific gravity was calculated using the equation below.
The specific gravity values for B1, B2, and B3 were obtained to be 2,741, 2,555, 2,534 kg/m3, respectively.
Single particle crushing test
Several different factors such as angularity, uniformity of gradation, lower particle strength, coarseness, stress level, and anisotropy govern the crushing of railroad ballast particles (Bohac et al., 2001). The most important of all these factors is the crushing strength of ballast. Appropriate particle crushing strength values can be established by performing the Single Particle Crushing Test (SPCT) in the laboratory. The SPCT is an indirect tensile test that is conducted by compressing individual particles between two flat platens to induce tensile stresses in the particles (Lim, 2004). A typical result of this crushing test is a plot of force against deformation. The maximum peak load is the point at which major fracture occurs along the loading direction whereby the particle splits into two or more pieces.
Laboratory Crushing Test
A Universal Testing Machine (UTM) was used to perform the laboratory tests on the three ballast particles. Since the shapes of the particles were irregular and coarse, they were aligned on the bottom platen in such a way that each particle rested with its flattest portion on bottom platen of the machine. Figures 2A,B show the test set up for SPCT and B1 particle in the test setup for crushing, respectively. Load was then applied by moving the top platen downwards at 1.9 mm/s. Force and displacement data were continuously collected throughout the test. Figure 2C shows the force-displacement plot obtained for particles B1, B2, and B3. From the figure, the load-displacement plot went through several undulations owing to shifting and reorientation of the ballast particle during the loading process. These displacements were not included in the final force-displacement calculations. Similar results were obtained for ballast particles B2 and B3. Figures 2D–F show photographs of the ballast particles after they have been crushed in the laboratory. After the crushing strength for each ballast particle was established, the next step involved DE modeling and calibration of this crushing test.
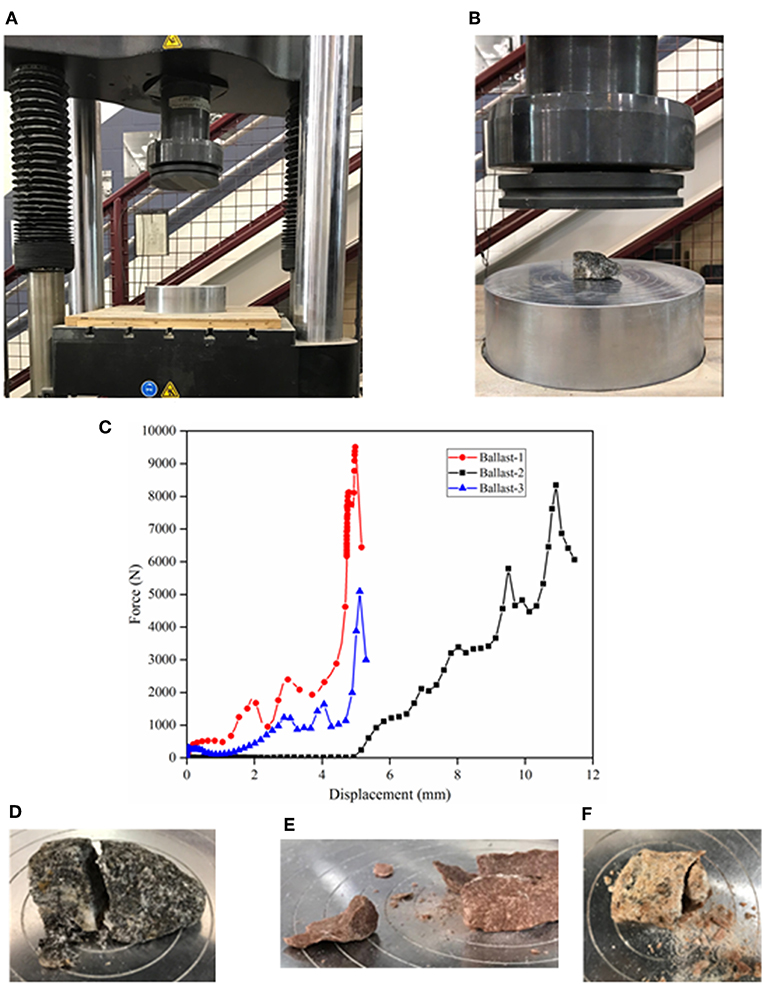
Figure 2. (A) Test setup for SPCT; (B) Ballast particle B1 in test setup; (C) Lab-obtained force vs. displacement data during SPCT on ballast particles B1, B2, and B3; photographs showing the ballast particles after laboratory crushing tests: (D) B1; (E) B2; (F) B3.
Discrete Element Simulation of the Particle Crushing Test
The material modeling support package of PFC was used to simulate the Single Particle Crushing Test (SPCT) of individual ballast particles (Itasca Consulting Group, Inc., 2018). This support package can be used to create an assembly of packed particles under a specified material pressure and porosity, and assign the contact model of one's choice, like the linear contact model, bonded particle model, etc. On these packed assemblies, different tests such as the tension test, compression test, and diametral compression test can be simulated. Detailed information about the material modeling support package can be found in the Itasca technical memorandum by Potyondy D. (2018). For simulating the SPCT on irregular ballasts shapes, the material modeling support package could not be used directly. Accordingly, some modifications were implemented, and new algorithms were developed to ensure the simulations accurately represented the particles tested in the laboratory.
Creation of Irregular Ballast Shapes
As already mentioned, individual particles in PFC3D (version 5) are represented as spheres. It should be noted that PFC3D version 6 does have the ability to model truly polyhedral-shaped particles; however, the research work reported in the current manuscript were carried out using PFC3D version 5. Therefore, to model non-spherical particles, special care needs to be taken to combine spheres of different sizes in certain fashions so that the resulting “agglomerate” represents the irregular shape being targeted. Once the three different ballast particles were digitized from the photographs, and their corresponding “.stl” files were imported into PFC3D, the next step involved recreating these particle shapes using agglomerates of spheres. This was accomplished through the following steps: First, cuboid boxes of dimensions larger than corresponding ballast particles were created, and filled with spheres of diameter 5–6 mm, and compacted to achieve a porosity value of 20% and a material pressure of 150 kPa. Note that to check whether the packing pressure affects the ultimate strength of the specimen, the pressure was reduced from 150 to 5 kPa; no change in the crushing strength was observed. Once the packed material was created, the spheres were bonded with linear parallel bonds with certain bond strength and modulus values. The detailed description of the linear parallel bond can be found elsewhere (Potyondy and Cundall, 2004; Potyondy D. O., 2018). The elastic modulus of the spheres was chosen such that the stiffness of the spheres matched the stiffness of respective ballast particles. The moduli and ratios of normal to shear stiffness values for spheres as well as cement (bond) of linear parallel bond were set equal to reduce the number of free parameters (Potyondy and Cundall, 2004; Potyondy D. O., 2018). The radius multiplier term, which refers to the radius of the parallel bond such that the bond radius equals the radius multiplier times the radius of the smaller sphere in contact, was set to one. Once the packed assembly was created, the geometry of the corresponding ballasts (see Figure 1) was imported into the model. An algorithm was developed to detect all spheres that had centroids within the geometry of corresponding shape being generated. All particles with centroids outside the imported geometry were deleted. Figure 3 shows clusters of bonded spheres that were within the geometry of corresponding particle being generated. This cluster of bonded spheres now represented the irregular ballast shapes B1, B2, and B3 which were composed of 650, 216, and 254 individual spheres, respectively. Note that due to its complex shape, particle B1 required significantly higher number of spheres to generate a representative shape.
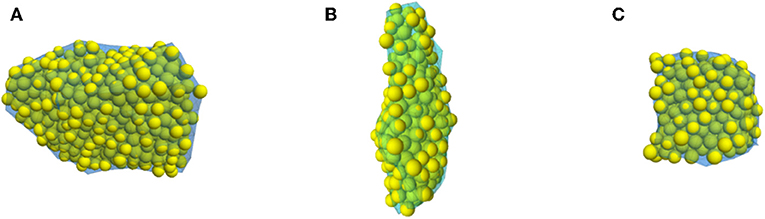
Figure 3. Cluster of bonded spheres to match the geometries of corresponding ballast particles: (A) B1; (B) B2; (C) B3.
Simulating the Diametral Compression (DC) Test
To subject the individual ballast particles to diametral compression test, the top and bottom walls or platens were created ensuring that they were placed exactly at the top- and bottom-most points of the representative particles. Each of the ballast particles were oriented such that they resembled their orientation in the lab test. Tilting of the loading platens as well as that of the ballast particle were not allowed during the simulated crushing tests. The system was brought to equilibrium, displacements of the spheres were set to zero, and the loading was applied by moving the top and bottom walls at a rate of 0.2 mm/s. Note that the simulated loading rate was intentionally set to a value significantly lower than that in the laboratory; this was necessary to ensure quasi-static conditions throughout the simulation. The frictionless top and bottom plates were moved toward the bonded assembly representation of ballasts to simulate the crushing. Microstructural monitoring to visualize the fragments caused during the test was performed whereby small red discs were created upon bond breakage at the breakage points. The test stopped when the load carrying ability of the ballast was compromised, and the axial force magnitude fell below a specified fraction of its peak value. The axial force was taken as the average force of the opposing top and bottom walls. The axial strain was calculated based on the change of distance between the opposing walls. Figures 4A–I represent, the PFC-generated irregular ballast particles, DC test setups for the individual particles, and the broken ballast particles under peak loading, respectively.
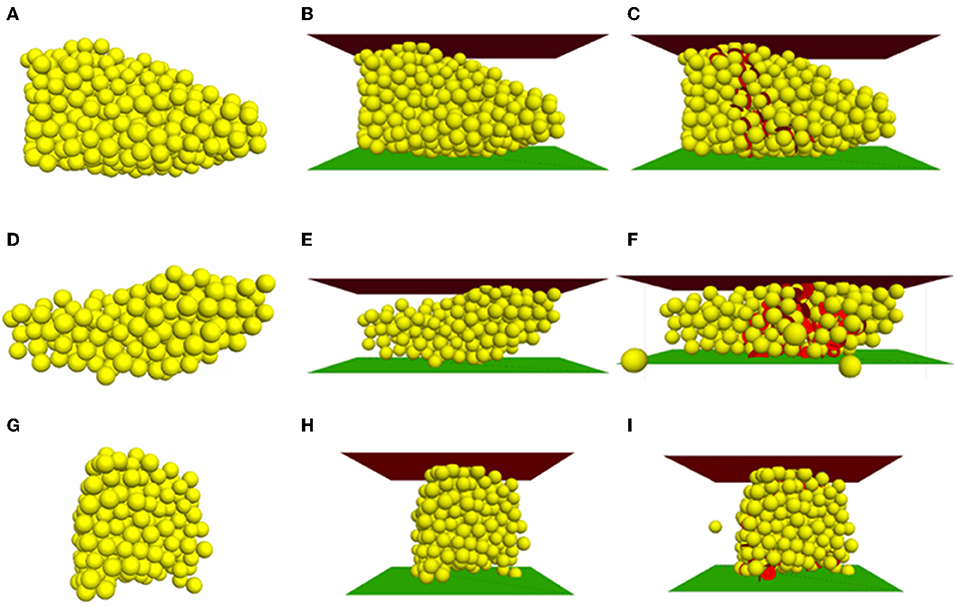
Figure 4. Representative irregular ballast shapes (A,D,G); DC test set-up with ballasts (B,E,H); broken ballasts at peak load (C,F,I) for B1, B2, and B3 respectively.
Table 1 lists the important parameters used for calibration of the DC tests. Table 2 lists the peak force and displacement values from the laboratory and the DC crushing tests for the three ballast particles. Even though the peak force and displacement values did not match exactly, the calibration was considered complete, as the primary intention of this research effort was to get representative ballast calibrated strength model parameters which could be used to study the effect of real polyhedral ballast layer response on ballast breakage and PD.
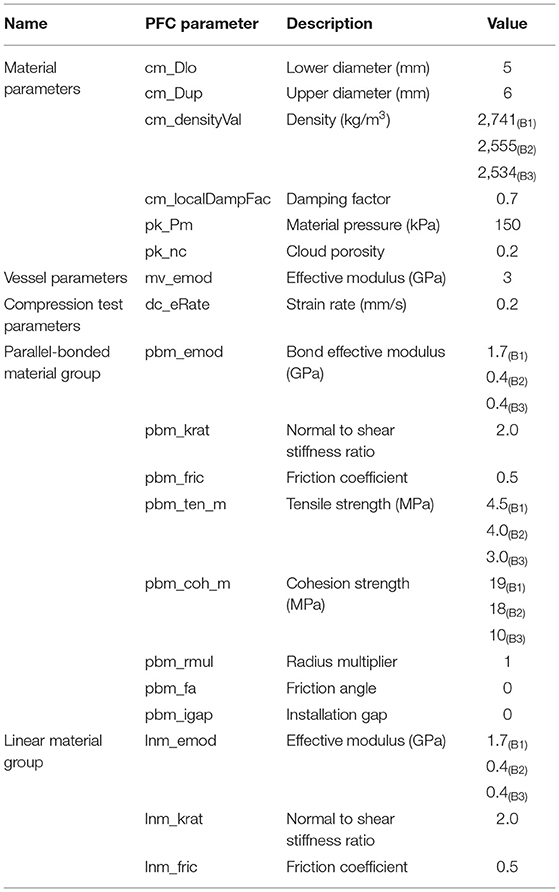
Table 1. Important parameters used for DC test calibration.
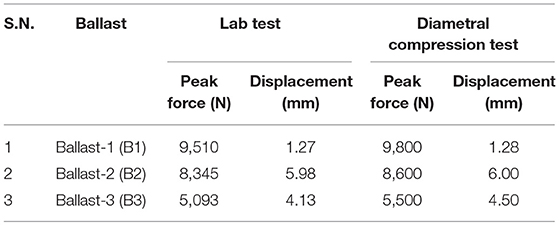
Table 2. Final calibrated results for single particle crushing test.
Cyclic Loading of Ballast Layer Comprising Breakable Complex-Shaped Particles
Specimen Preparation
First, a specimen box of size 600 × 600 × 300 mm was created using PFC3D. Targeting a porosity value of 38%, a total 3,235 ballast particles were then distributed in the specimen box using the particle size distribution shown in Figure 5A. Each size distribution range (varying from 15 to 50 mm) as shown in the inset table of Figure 5A, were composed of equal proportion of ballast particles conforming to the three different ballast shapes: B1, B2, and B3. The ballast particle templates used in the simulation are shown in Figure 5B. Each of the ballast particles B1, B2, and B3 comprised 12, 7, and 12 spheres, respectively. Note that each particle shape was represented by combining smaller number of spheres (12, 7, and 12, respectively) as the resulting reduction in computational times was necessary to complete all research tasks on time. For particles represented by agglomerates of larger number of spheres, the computational time requirements were unreasonably high (the simulation did not finish after running continuously for 75 days on a desktop computer with high processing power). While reducing the number of spheres in each agglomerate, special care was taken to retain the original shape of the ballast particles.
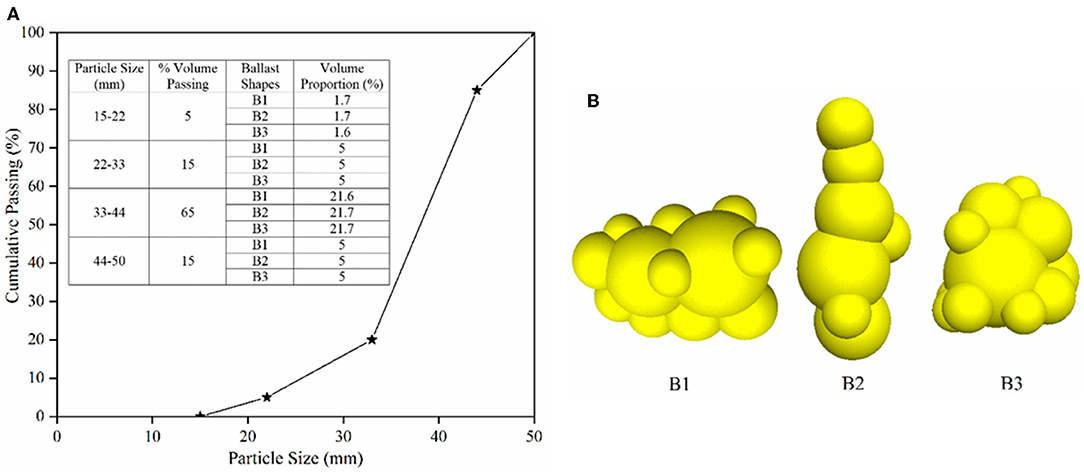
Figure 5. (A) Particle size distribution used in the simulations; (B) ballast templates used.
Once generated, the ballast particles were allowed to settle under gravity. After this step, a material pressure of 20 kPa was applied to the specimen by moving the surrounding walls via a servo mechanism to account for the confinement provided by the crossties, shoulder ballast, and crib ballasts. Note that researchers in the past have reported typical confining stress values in the range of 10–60 kPa (Indraratna et al., 2010a). Figure 6A shows the packed ballast assembly after this stage represented in the form of spheres of ballast templates shown in Figure 5B. Figure 6B, on the other hand, shows the packed assembly represented in the form of geometry of the corresponding particles in the simulation. The porosity at the end of this isotropic stress stage was 38.29%. All the model parameters used in the simulation have been listed in Table 3.
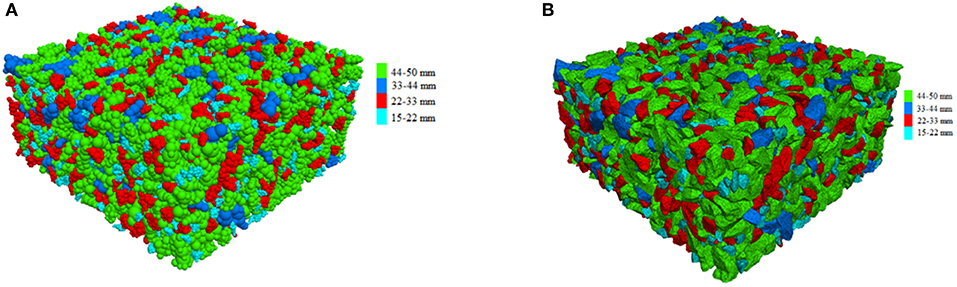
Figure 6. Initial packed ballast assembly represented by (A) agglomerates of spheres; and (B) exact geometry of the particles imported.
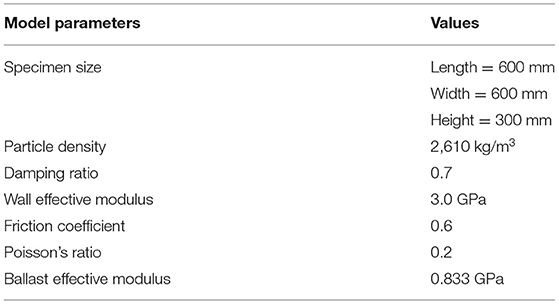
Table 3. Parameters used in the simulation.
The value of effective modulus used in the simulation was taken as the average of the modulus values for the three ballast particles tested in the laboratory. The friction coefficient for ballast-ballast interaction was taken as 0.6 (tan 31°) after Kwan (2006). The ballast layer was then applied with a cyclic loading around a mean stress of 232 kPa via the top wall of the specimen box.
Contact Model for Ballast-Ballast Interaction
Most of the researches conducted on the DE modeling of railroad ballast use the linear-elastic contact model to represent the inter-particle contacts. However, the linear-elastic approach can only give a crude estimate of the ballast layer response. The behavior of ballast under loading has been established to be non-linear (Lekarp et al., 2000). For this reason, in this research study, the ballast-ballast contact was modeled using a contact model recently introduced by Itasca: the Hill Contact Model (Potyondy, 2016). This contact model simulates the behavior of an infinitesimal, non-linear elastic (no tension) and frictional interface that carries a compressive surface interaction force and may carry a tensile moisture force. The surface interaction force model is based on the Hertz-Mindlin contact theory along with a damping mechanism and Coulomb sliding friction (Tsuji et al., 1992). The surface interaction force consists of Hertzian and dashpot components with Hertz-Mindlin springs providing the non-linear force-displacement response. The Hill Contact Model simulates the contact behavior between two locally elastic spheres that may have a liquid bridge and the material behaves like an unsaturated granular material. The liquid bridge is present if the moisture state is wet, and absent if the moisture state is dry. Detailed information on the Hill Contact Model can be found in the Itasca Technical Memorandum (Potyondy, 2016). In this simulation, the liquid bridge was not modeled, and hence the ballast-ballast contact model acted as a non-linear contact model; this can be said to be a better representation of the nature of interaction at inter-particle contacts compared to linear-elastic assumptions. For the ballast-specimen box interaction, the linear contact behavior was assumed.
Simulation of Breakable Ballast Particles
Once the mean stress of 232 kPa was applied to the system, the non-breakable ballast agglomerates were freed, and replaced with clusters of spheres with same radii at the same positions, and bonded together using linear-parallel bonds. For simplicity, the average of bond strengths and stiffness values obtained from the DC calibration tests were used in this simulation. Breakage of the bonds within the spheres in each cluster was considered as particle breakage. Upon breakage of the linear-parallel bonds under the load, the Hill contact model was assigned to each new ballast-ballast contact. Table 4 shows the bond strength parameter values for the linear parallel bonds used in this study.
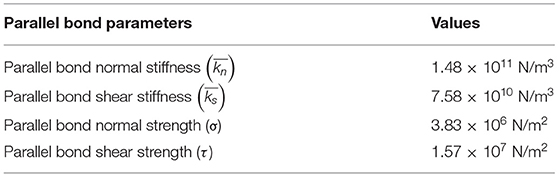
Table 4. Bond strength parameters for the linear-parallel bonds.
After this step, cyclic loading was applied to the ballast layer via the top wall of the specimen box. Detailed description of the cyclic load applied in this simulation can be found in Dahal et al. (2018).
Results and discussions
The ballast layer was subjected to 50 load cycles, and the stress-strain responses were recorded. Strain was calculated in terms of percentage, and was calculated from the distance between top and bottom wall before and after loading. Stress was calculated as the ratio of the load experienced by the top wall to the area of the top wall.
Study of Ballast Breakage
Figures 7A,B show plan views of the ballast box before and after application of the cyclic loading, respectively. The ballast particles can be seen to have undergone significant breakage, and the initial and final ballast particle orientations cannot be distinguished due to the rearrangement of the broken ballast particles. These broken ballast particles eventually move to the void space in the assembly, and result in permanent deformation accumulation. Therefore, particle breakage and subsequent rearrangement of the broken particles act as governing factors for cyclic densification of the assembly.
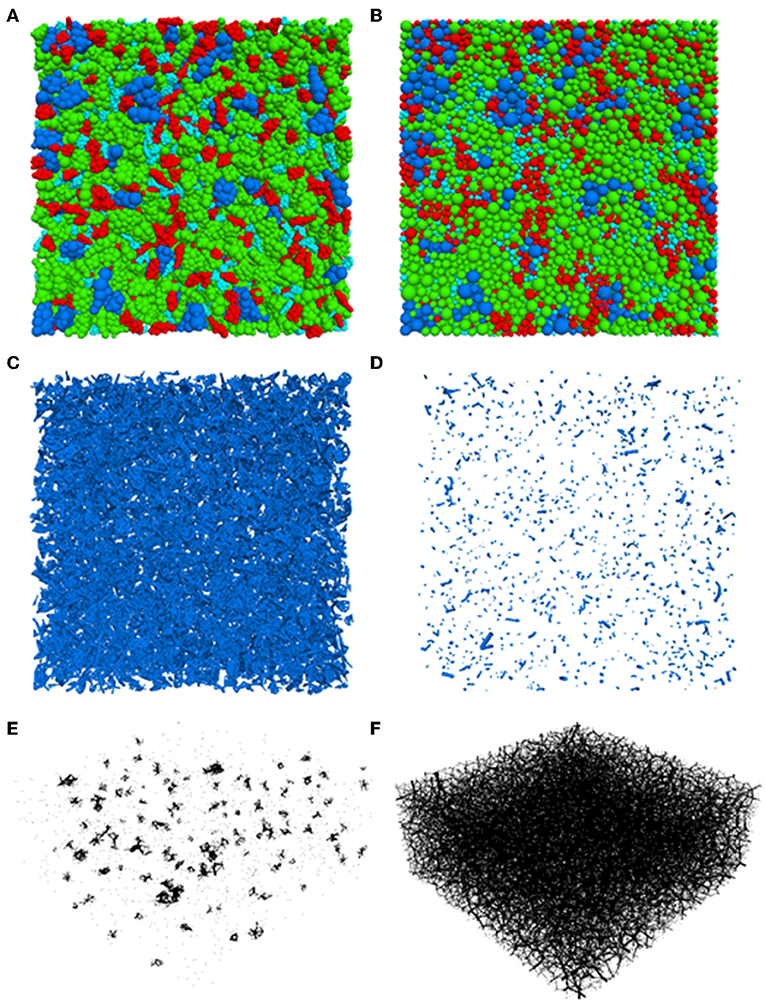
Figure 7. Plan view of the ballast particles (A) before and (B) after cyclic loading; linear-parallel bonds in the ballast assembly (C) before and (D) after cyclic loading; contact force chains in the ballast layer (E) before and (F) after cyclic loading.
To quantify the degree of particle degradation in terms of bond breakage in the cluster of spheres forming ballast particles, the number of linear parallel bonds before and after the cyclic load application were tracked, and were found to be 56,652 and 1,369, respectively; a total of 55,283 bonds were broken under cyclic loading. Most of these bonds were found to be broken during the initial load cycles leading to sudden increase in permanent deformation accumulation when loading was initiated. Once the bond breakage ceased, no significant increase in permanent deformation accumulation was observed. This clearly highlights the fact that particle breakage is the major source of permanent deformation accumulation under loading. Figures 7C,D show the linear parallel bonds in the model before and after cyclic load application, respectively. The extent of bond breakage is evident from the scarcity of intact bonds in Figure 7D.
The Contact Force (CF) chains between ballast particles before and after cyclic loading have been plotted in Figures 7E,F. As seen from these figures, the contact force chains are more uniform and widely distributed in the after-cyclic loading configuration, indicating good contacts between the ballast particles. This is because under loading the ballast particles undergo breakage resulting in the rearrangement of broken ballast particles in the void spaces present in the assembly. Note that the contact force chains in the plots are scaled by force, and the thickness of the lines correspond to the force magnitudes. Observing the contact force distribution after cyclic loading, it can be concluded that particle breakage plays a critical role in controlling the development of CF chains and governing the load distribution pattern in granular media under cyclic loading.
Study of Ballast Permanent Deformation
Figure 8A shows the evolution of vertical strain with the number of load cycles under cyclic loading. As seen from the figure, there was an initial bulging (dilation) of ~8.39% at the very beginning of the load application stage. This can be attributed to the phenomenon in DE modeling, where breakage of a bond between two overlapping spheres results in elastic rebound of the resulting two particles away from each other. Once this elastic energy has been released, there is a sudden increase in the vertical axial strain with the initial load cycles due to rearrangement and packing of the freshly generated broken particles. After the initial cycle, the axial strain is found to increase in a steady manner and toward the end of 50 load cycles, the cyclic part of the axial strain is constant, and the permanent deformation accumulation is found to have stabilized. This can be explained by the fact that after the initial breakage, the broken ballast particles rearrange themselves in the void spaces, thereby densifying the ballast. The total vertical permanent strain accumulation was calculated as 14.14 mm (5.09%) after 50 load cycles.
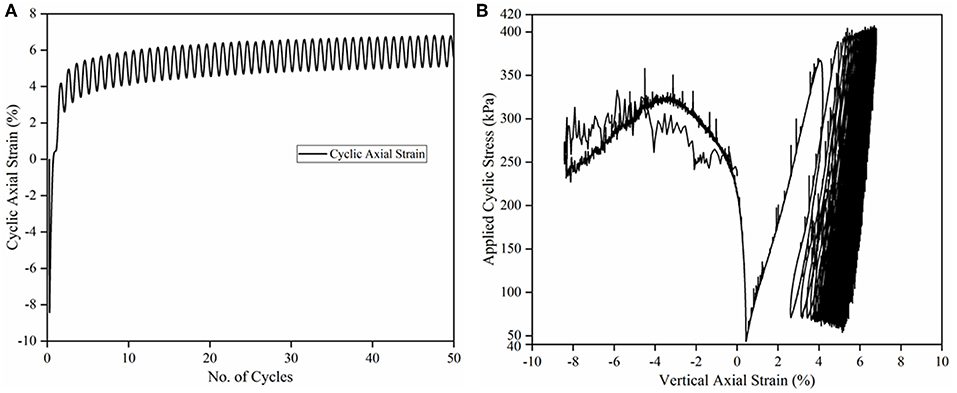
Figure 8. Plots showing: (A) vertical axial strain vs. no. of cycles; (B) applied cyclic stress vs. vertical axial strain.
Figure 8B shows the applied cyclic stress plotted against the vertical strain for 50 load cycles. Initially, the axial strain is negative in the figure which corresponds to bulging of the specimen. After the bulging is over, the axial strain accumulation after first few load cycles is significantly higher than under successive load cycles (about 5% permanent deformation accumulation). In this plot, the spikes in the stress-strain response during the first few load cycles can be attributed to particle breakages. However, once the initial load cycles have been completed, the ballast stress-strain response is more or less elastic showing a near-complete hysteretic behavior toward the end of 50 load cycles. This demonstrates the resilient behavior of ballast layer once it has been subjected to a large number of load cycles. Similar trends were reported by Indraratna et al. (2010b). The porosity at the end of 50 load cycles was found to be 33.44%, which was a reduction of 4.85% compared to the initial packing porosity. This can be attributed to the ballast breakage and the eventual rearrangement of the broken ballast particles under cyclic loading.
Comparison of Results for Ballast Layers Formed With Only Single Ballast Shapes (Only B1, Only B2, and Only B3)
All the simulations reported above were also repeated on ballast assemblies comprising one ballast shape (B1, B2, or B3) only; the objective was to study the effect of each ballast shape on permanent deformation and ballast breakage under cyclic loading. The same specimen size and particle size distribution curve as shown in Figure 1 was used for the study. The properties of the ballast layers were taken from the corresponding properties in Table 1. For direct comparison, the ballast layers were generated such that they had similar initial porosity (after application of the isotropic stress state). The initial porosities for ballast layers comprising only B1, only B2, and only B3 ballast particles were 38.30, 37.38, and 38.35%, respectively; it should be noted that matching the porosities of two models comprising differently-shaped particles in DE modeling is virtually impractical.
Table 5 lists the final porosities, initial bulging, and permanent strain accumulation and change in no. of linear parallel bonds after the application of 50 load cycles for the four different models (one model with equal proportion of the three ballast shapes, and the three models comprising each of the different ballast shapes). Figure 9A shows the permanent strain accumulation with the number of load cycles for the four different ballast assemblies. As seen earlier, after the energy has dissipated from the release of overlaps between the spheres forming ballasts shapes, there is a sudden increase in the axial strain accumulation for all the ballast layers. The permanent strain (PS) curve has slowly stabilized and remained relatively constant toward the end of 50 load cycles.
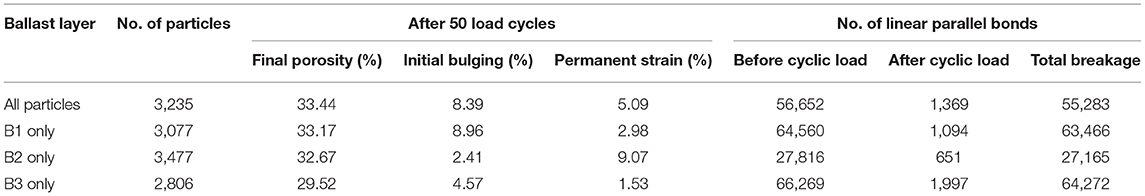
Table 5. Final porosity, initial bulging, permanent strain and no. of linear parallel bonds after 50 load cycles for different ballast layers.
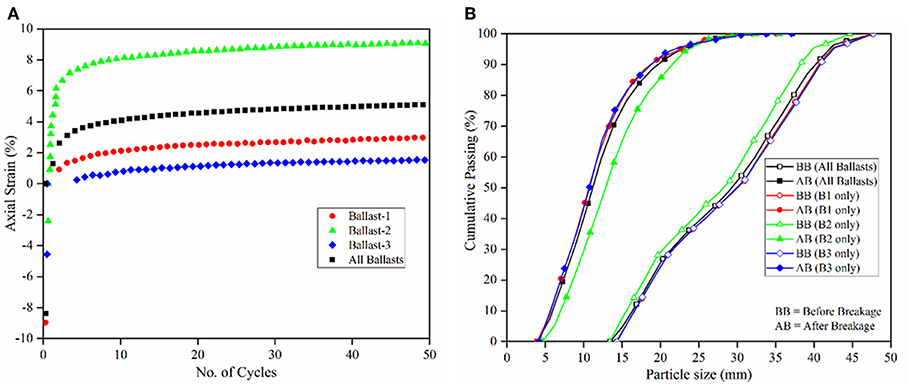
Figure 9. (A) Ballast permanent axial strain accumulation with number of cycles for all ballast layers; (B) change in particle size distribution before and after cyclic load application for different ballast layers.
From Figure 9A and Table 5, the ballast layer formed by only B2 shapes has undergone the highest PS, even though the peak force taken by B2 ballast is intermediate to B1 (highest) and B3 (lowest) (based on laboratory crushing test). This could be because of the improper packing of the B2 ballast particles owing to its more irregular and angular shape. Besides, the PS for B3 particles is less than that for the B1 particles, which could be attributed to more rounded shape of the B3 ballast compared to B1 ballast. B3 ballast is also shown to have the maximum densification toward the end of 50 load cycles, as the porosity is the lowest of all three single ballast layers. Moreover, comparing the PS for ballast layers comprising single ballast shapes with that of the ballast layer comprising equally proportioned B1, B2, and B3 ballast shapes; the PS is observed to be in between lower (B1, B3) and higher (B2) range. This could be attributed to the dense packing created by the mixture of the elongated (B2) and more rounded (B1 and B3) ballast shapes.
Figure 9B and right-most three columns of Table 5 show the shift in particle size distribution curve and no. of linear parallel bonds before and after cyclic loading for ballast layers formed with all ballast shapes (equally distributed B1, B2, and B3), only B1, only B2, and only B3, respectively. The area of particle breakage (area between the particle size distribution curves before and after cyclic loading) as found from Figure 9B are 1,643.31, 1,740.99, 1,368.66, and 1,748.27 mm2 for all ballast shapes (B1, B2, B3), only B1, only B2, and only B3 ballasts layers, respectively. From these numbers and also from Table 5 it can be seen that the model with B3 particles underwent the highest breakage (indicated by shift in the gradation curve after loading), which is consistent with the data presented in Table 2 (B3 exhibited the lowest particle crushing strength). It is important to note that even though the model with B3 particles exhibited the highest particle breakage, the particles were immediately able to attain a “dense” configuration, thereby resulting in low permanent deformation accumulations.
Importance of Accurate Representation of Ballast Particle Shape During DE Simulation
To assess the importance of accurate representation of ballast particle shapes during DEM simulations, the exact same simulations steps described above, were repeated for ellipsoid ballast particles. Figures 10A,B show the plots for permanent strain accumulation with number of load cycles and change in particle size distribution before and after cyclic load for the complex-shaped as well as ellipsoid ballast particles. Note that in the following discussion, the particles B1, B2, and B3, have been referred to as complex-shaped particles. It is important to note that this research effort did not use actual polyhedral particles in the simulation; rather, agglomerates of spheres were used to represent different particle shapes.
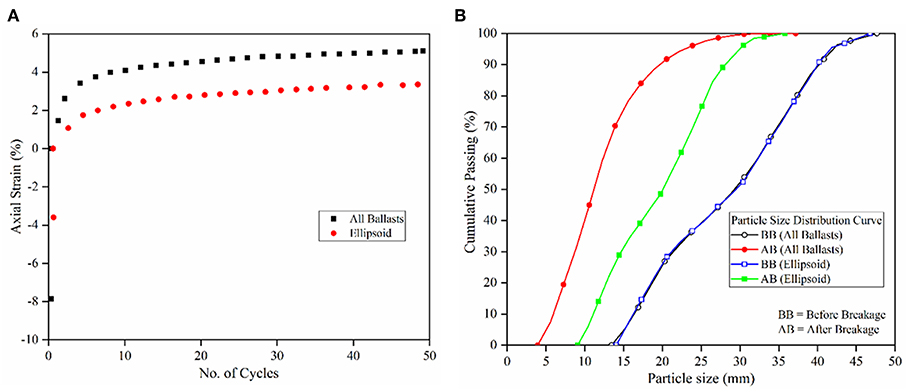
Figure 10. (A) Permanent strain or PD accumulation vs. no. of cycles for polyhedral and ellipsoid ballast layers; (B) change in particle size distribution before and after cyclic load application for ballast layers comprising polyhedral and ellipsoid particles.
The initial bulging of the specimen for the model with complex-shaped particles was 8.39%, while the same for the model with ellipsoid particles was 3.59%. The accumulated permanent strain at the end of 50 load cycles was 5.09% for the model with complex-shaped particles, and 3.36% for the ellipsoid particles. The accumulated permanent strain for the model with the complex-shaped particles was approximately 51.5% higher than that with ellipsoid particles. Moreover, comparing the shift in particle size distribution before and after the cyclic loading for the two different particles shapes, the complex-shaped particles undergo significantly higher degree of breakage compared to ellipsoid particles. The areas between the particle size distribution curves before and after cyclic loading were calculated to be 884.75 and 1,643.31 mm2 for ellipsoid and complex-shaped particles, respectively. This shows that complex-shaped ballast particles underwent significantly higher breakage (about 85% more) compared to the ellipsoid particles under cyclic loading. From these results it can be concluded that accurate representation of ballast particles shapes is of utmost importance during DEM simulations to accurately capture particle breakage and permanent strain accumulation trends under cyclic train loading. At this point, it should be noted that differences in particle shape did not have a significant effect in the total permanent deformation accumulation for non-breakable particles, as reported in Dahal et al. (2018). However, when particle breakage is taken into consideration, particle shape plays a significant role in governing the total permanent deformation accumulation under loading.
Summary and conclusion
1. A novel approach was used to generate and model complex-shaped ballast particles for DEM simulations. Single Particle Crushing Tests were performed in the laboratory, and DE models simulating these tests were calibrated to establish relevant model parameters.
2. Using the calibrated model parameters, the permanent deformation and breakage response of ballast layers were studied under repeated loading.
3. Based on the simulation results, it was observed that particle breakage plays a significant role in governing the overall permanent deformation accumulation in ballast layers under repeated loading.
4. A major portion of ballast breakage occurred during the initial load cycles, which also corresponded to high rates of permanent deformation accumulation. As the breakage ceased under subsequent load cycles, the rate of permanent deformation accumulation also reduced.
5. Importance of the use of polyhedral ballast shapes was assessed by comparing the permanent deformation and shift in particle size distribution curves for complex-shaped and ellipsoid ballast particles.
6. Significant changes in the extent of particle breakage and associated permanent deformation accumulation were observed when the ballast particle shapes were changed from complex-shaped (polyhedral) to ellipsoid.
Limitations and Scope of Further Research
The modeling reported in this manuscript has the following limitations. Current and future research tasks by the authors aim to address some of these limitations.
1. The exact complex-shaped particles created and used in the crushing test simulations were not used while studying the ballast layer response under repeated loading. Using the exact same particle shapes would be ideal as the calibration parameters would then be directly validated. However, simplified shapes were used in the ballast assembly during the current study because the high number of spheres required to exactly represent the complex-shaped ballast particles led to unreasonably long computational times.
2. The next step of this research would be to calibrate or verify the ballast response obtained from this research by comparing with the full-scale cyclic plate load box tests.
3. The complex-shaped as well as ellipsoid particles used in this research effort were approximated using the agglomerates of bonded spheres. As an extension to this research, the model is currently being recreated using actual polyhedral particles (PFC Version 6.0). Findings from this modeling effort will be published in future manuscripts.
Data Availability Statement
The datasets generated for this study are available on request to the corresponding author.
Author Contributions
DM and BD: study concept. BD: numerical modeling and manuscript draft. DM: manuscript review and finalization.
Conflict of Interest
BD is currently employed by the company Bailey Engineering, Inc. She was a graduate research assistant at Boise State University during the performance period of this research work. No part of the research work was performed when BD was an employee of Bailey Engineering, Inc.
The remaining author declares that the research was conducted in the absence of any commercial or financial relationships that could be construed as a potential conflict of interest.
Acknowledgments
The authors greatly acknowledge all the guidance and help provided by Dr. David Potyondy of Itasca Consulting Group. Mr. S. M. Naziur Mahmud, former graduate student at Boise State University helped with the initial modeling tasks.
References
Alshibli, K. A., and Cil, M. B. (2014). 3D evolution of sand fracture under 1D compression. Géotechnique 64, 351–364. doi: 10.1680/geot.13.P.119
Anderson, W. F., and Key, A. J. (2000). Model testing of two-layer railway track ballast. J. Geotech. Geoenv. Eng. 126, 317–323. doi: 10.1061/(ASCE)1090-0241(2000)126:4(317)
Aursudkij, B., McDowell, G. R., and Collop, A. C. (2009). Cyclic loading of railway ballast under triaxial conditions and in a railway test facility. Granular Matter 11, 391–401. doi: 10.1007/s10035-009-0144-4
Autodesk Inc. (2018). Available online at: https://www.autodesk.com/products/recap/overview. (accessed June 1, 2018).
Azéma, E., Radjai, F., and Dubois, F. (2013). Packings of irregular polyhedral particles: strength, structure, and effects of angularity. Phys. Rev. E 87:062203. doi: 10.1103/PhysRevE.87.062203
Bohac, J., Feda, J., and Kuthan, B. (2001). “Modelling of grain crushing and debonding,” in Proceedings of the 15th International Conference on Soil Mechanics and Geotechnical Engineering, Vol. 1 (Istanbul).
Dahal, B., Mahmud, S. M., and Mishra, D. (2018). “Simulating ballast breakage under repeated loading using the discrete element method,” in Joint Rail Conference 2018 (Pittsburgh, PA).
Di Maio, F. P., and Renzo, A. D. (2004). Analytical solution for the problem of frictional-elastic collisions of spherical particles using the linear model. Chem. Eng. Sci. 59, 3461–3475. doi: 10.1016/j.ces.2004.05.014
Ferellec, J. F., and McDowell, G. R. (2010). A method to model realistic particle shape and inertia in DEM. Granular Matter, 12, 459–467. doi: 10.1007/s10035-010-0205-8
Höhner, D., Wirtz, S., and Scherer, V. (2013). Experimental and numerical investigation on the influence of particle shape and shape approximation on hopper discharge using the discrete element method. Powder Technol. 235, 614–627. doi: 10.1016/j.powtec.2012.11.004
Indraratna, B., Ionescu, D., and Christie, H. (1998). Shear behavior of railway ballast based on large-scale triaxial tests. J. Geotech. Geoenv. Eng. 124, 439–449. doi: 10.1061/(ASCE)1090-0241(1998)124:5(439)
Indraratna, B., and Nimbalkar, S. (2011). “Implications of ballast breakage on ballasted railway track based on numerical modelling,” in 13th International Conference of International Association for Computer Methods and Advances in Geomechanics (Sydney), 1085–1092.
Indraratna, B., Nimbalkar, S., Christie, D., Rujikiatkamjorn, C., and Vinod, J. S. (2010a). Field assessment of the performance of a ballasted rail track with and without geosynthetics. J. Geotech. Geoenv. Eng. 136, 907–917. doi: 10.1061/(ASCE)GT.1943-5606.0000312
Indraratna, B., Thakur, P. K., and Vinod, J. S. (2010b). Experimental and numerical study of railway ballast behavior under cyclic loading. Int. J. Geomech. 10, 136–144. doi: 10.1061/(ASCE)GM.1943-5622.0000055
Itasca Consulting Group, Inc. (2018). “Particle Flow Code in 3 Dimensions. Ver. 6.0. Minneapolis, MN: Itasca.
Kruggel-Emden, H., Simsek, E., Rickelt, S., Wirtz, S., and Scherer, V. (2007). Review and extension of normal force models for the discrete element method. Powder Technol. 171, 157–173. doi: 10.1016/j.powtec.2006.10.004
Kruggel-Emden, H., Wirtz, S., and Scherer, V. (2009). Applicable contact force models for the discrete element method: the single particle perspective. J. Press. Vessel Technol. 131:024001. doi: 10.1115/1.3040682
Kwan, C. C. J. (2006). Geogrid reinforcement of railway ballast (Ph. D. thesis). University of Nottingham, Nottingham, United States.
Lackenby, J., Indraratna, B., McDowell, G. R., and Christie, D. (2007). Effect of confining pressure on ballast degradation and deformation under cyclic triaxial loading. Géotechnique 57, 527–536. doi: 10.1680/geot.2007.57.6.527
Latham, J. P., and Munjiza, A. (2004). The modelling of particle systems with real shapes. Philos. Trans. R. Soc. London A Math. Phys. Eng. Sci. 362, 1953–1972. doi: 10.1098/rsta.2004.1425
Le Pen, L. M., Powrie, W., Zervos, A., Ahmed, S., and Aingaran, S. (2013). Dependence of shape on particle size for a crushed rock railway ballast. Granular Matter 15, 849–861. doi: 10.1007/s10035-013-0437-5
Lekarp, F., Isacsson, U., and Dawson, A. R. (2000). State of the art. I. Resilient response of unbound aggregates. ASCE J. Transp. Eng. 126, 66–75. doi: 10.1061/(ASCE)0733-947X(2000)126:1(66)
Lim, W. L. (2004). Mechanics of railway ballast behavior (Ph. D thesis). University of Nottingham, Nottingham, United States.
Lim, W. L., and McDowell, G. R. (2005). Discrete element modelling of railway ballast. Granular Matter 7, 19–29. doi: 10.1007/s10035-004-0189-3
LoboGuerrero, S., and Vallejo, L. E. (2006). Discrete element method analysis of railtrack ballast degradation during cyclic loading. Granular Matter 8, 195–204. doi: 10.1007/s10035-006-0006-2
Lu, M., and McDowell, G. R. (2010). Discrete element modelling of railway ballast under monotonic and cyclic triaxial loading. Geotechnique 60, 459–467. doi: 10.1680/geot.2010.60.6.459
Markauskas, D., Kacianauskas, R., Dziugys, A., and Navakas, R. (2010). Investigations of adequacy of multi-sphere approximation of elliptical particles for DEM simulations. Granular Matter 12, 107–123. doi: 10.1007/s10035-009-0158-y
McDowell, G. R., and Harireche, O. (2002). Discrete element modelling of yielding and normal compression of sand. Géotechnique 52, 299–304. doi: 10.1680/geot.2002.52.4.299
Nimbalkar, S., and Indraratna, B. (2015). “Implications of ballast degradation under cyclic loading,” in 12th ANZ Conference on Geomechanics (ANZ 2015). The Conference Company Ltd.
Paixão, A., Resende, R., and Fortunato, E. (2001). Photogrammetry for digital reconstruction of railway ballast particles – A cost-efficient method. Const. Build. Mater. 191, 963–976. doi: 10.1016/j.conbuildmat.2018.10.048
Potyondy, D. (2016). “Hill Contact Model [version 4],” in Technical Memorandum ICG7795-L (Minneapolis, MN: Itasca Consulting Group, Inc.).
Potyondy, D. (2018). “Material-modeling support in PFC [fistPkg26],” in Technical Memorandum ICG7766-L (Minneapolis, MN: Itasca Consulting Group, Inc.).
Potyondy, D. O. (2018). The bonded-particle model as a tool for rock mechanics research and application: current trends and future directions. Geosyst. Eng. 18, 1–28. doi: 10.1080/12269328.2014.998346
Potyondy, D. O., and Cundall, P. A. (2004). A bonded-particle model for rock. Int. J. Rock Mech. Mining Sci. 41, 1329–1364. doi: 10.1016/j.ijrmms.2004.09.011
Qian, Y., Lee, S., Tutumluer, E., Hashash, Y., Mishra, D., and Ghaboussi, J. (2013). Simulating ballast shear strength from large-scale triaxial tests. Transp. Rese. Rec. 2374, 126–135. doi: 10.3141/2374-15
Qian, Y., Tutumluer, E. Y., Hashash, M. A., and Ghaboussi, J. (2014). “Effect of ballast degradation on permanent deformation behavior from large scale triaxial tests,” in Joint Rail Conference, April 2–4, 2014 (Colorado Springs).
Selig, E. T., Collingwood, B. I., and Field, S. W. (1988). “Causes of ballast fouling in track,” in Bulletin of the American Railway Engineering Association, Bulletin 717, Vol. 89 (Chicago, IL).
Selig, E. T., Dello Russo, V., and Laine, K. J. (1992). Sources and Causes of Ballast Fouling. Report No. R-805, Association of American Railroads, Technical Center, Chicago, IL.
Selig, E. T., and Waters, J. M. (1994). Track Geotechnology and Substructure Management. London: Thomas Telford Publications.
Shenton, M. J. (1975). “Deformation of railway ballast under repeated loading conditions,” in Railroad Track Mechanics and Technology, ed H. T. Kerr (Princeton, NJ: Princeton University), 387–404.
Sun, Y., Indraratna, B., and Nimbalkar, S. (2014). Three-dimensional characterisation of particle size and shape for ballast. Géotech. Lett. 4, 197–202. doi: 10.1680/geolett.14.00036
Thornton, C., and Liu, L. (2004). How do particles break? Powder Technol. 143, 110–116. doi: 10.1016/j.powtec.2004.04.035
Tsuji, Y., Tanaka, T., and Ishida, T. (1992). Lagrangian numerical simulation of plug flow of cohesionless particles in a horizontal pipe. Powder Tech. 71, 239–250. doi: 10.1016/0032-5910(92)88030-L
Keywords: discrete element method, railroad ballast, ballast shape, ballast breakage, permanent deformation, particle crushing test
Citation: Dahal B and Mishra D (2020) Discrete Element Modeling of Permanent Deformation Accumulation in Railroad Ballast Considering Particle Breakage. Front. Built Environ. 5:145. doi: 10.3389/fbuil.2019.00145
Received: 16 October 2019; Accepted: 09 December 2019;
Published: 14 January 2020.
Edited by:
Sanjay Shrawan Nimbalkar, University of Technology Sydney, AustraliaReviewed by:
Yang Gui, Hohai University, ChinaQideng Peter Sun, Coffey International Australia, Australia
Copyright © 2020 Dahal and Mishra. This is an open-access article distributed under the terms of the Creative Commons Attribution License (CC BY). The use, distribution or reproduction in other forums is permitted, provided the original author(s) and the copyright owner(s) are credited and that the original publication in this journal is cited, in accordance with accepted academic practice. No use, distribution or reproduction is permitted which does not comply with these terms.
*Correspondence: Debakanta Mishra, ZGViLm1pc2hyYUBva3N0YXRlLmVkdQ==
†Present address: Beema Dahal, Bailey Engineering Inc., Eagle, ID, United States