 David Brett Roueche
 David O. Prevatt
 Frederick L. Haan
- 1Department of Civil Engineering, Auburn University, Auburn, AL, United States
- 2Department of Civil and Coastal Engineering, University of Florida, Gainesville, FL, United States
- 3Department of Engineering, Calvin University, Grand Rapids, MI, United States
Tornado and straight-line wind events are often discussed and compared in terms of their intensity, e.g., maximum wind speed, however, it is unclear to what extent tornado-induced and straight-line wind-induced wind loads are equivalent even for the same nominal intensity. This lack of understanding inhibits both tornado design philosophies and policies, and communication of tornado risk to the public. This study directly compares existing wind tunnel databases of tornado-induced and straight-line wind-induced pressures, for a similar building model, to evaluate to what extent the induced surface pressures on a typical building differ. The existing datasets used in the study are enhanced with a numerical internal pressure model to facilitate the comparison across a range of opening configurations that would be common in typical buildings. The analysis finds that differences are most pronounced in the overall distribution of pressures across the building surface, and in the magnitudes of pressures in regions of strong flow separation. However, overall the magnitudes of the peak tornado-induced pressures are reasonably similar to straight-line wind-induced pressures, with tornado-induced pressures on average 13% higher than equivalent straight-line wind-induced pressures. Ultimately, this study demonstrates a framework for such comparisons, while recognizing key sources of uncertainty and further research needs.
Introduction
Tornado-induced pressures acting on the surface of a building are a combination of three primary components – (1) the atmospheric pressure drop that occurs due to the conservation of angular momentum in a vortex; (2) the aerodynamic pressures acting on exterior surfaces due to the interaction between the structure and the flow; and (3) the internal pressure acting on interior surfaces of the building. Wind loads derived on the basis of synoptically driven wind flow, which form the basis of wind design standards such as ASCE 7 (ASCE, 2017), only account for the aerodynamic pressures and any corresponding internal pressure response, neglecting any changes in atmospheric pressure. Further, the aerodynamic wind pressures (typically represented as non-dimensional pressure or force coefficients) are derived from straight-line winds, i.e., stationary flow, while tornadic flow is strongly non-stationary both spatially and temporally. Questions arise then concerning the validity of tornado wind load models that are based on stationary and straight-line winds, yet applied to tornadoes (e.g., Peng et al., 2016). Fundamental differences between tornado-induced and straight-line wind induced loads are also important in risk analysis of existing buildings designed for straight-line winds but exposed to tornado-induced wind loads. They are also important for developing appropriate design loads considering tornadoes, such as in ASCE 7-16 (ASCE, 2017), where tornado amplification factors are used to adjust straight-line wind loads to account for tornado effects. The practical nature of this problem is evident in the adoption of tornado-resistant buildings codes in Moore, OK after the 2013 tornado (Simmons et al., 2015). The code provisions were adopted based on a targeted design wind speed of 60 m/s, but it is unclear whether a tornado of that intensity would induce enhanced wind loads above those expected for a straight-line wind event of the same intensity, and thus still cause significant structural damage.
Several studies have compared tornado-induced and straight-line wind loads. Jischke and Light (1983) and Bienkiewicz and Dudhia (1993) used laboratory tornado simulators to conclude that tornado-induced wind load coefficients were greater than those for straight-line winds by factors of 3–5. Haan et al. (2010) using a laboratory tornado simulator and a single gable building model with no openings, reported that vertical and lateral tornado-induced wind loads exceeded ASCE 7 wind loads by factors as high as 3 and 1.6, respectively, when atmospheric pressure was included. Haan (2017) using the same experimental data from Haan et al. (2010), subsequently found that analytically removing the atmospheric pressure component brought tornado-induced wind loads closer to ASCE 7 wind loads, but the aerodynamic loading still differed significantly from that expected under straight-line winds, with local tornado-induced wind pressures in some zones exceeding ASCE 7 pressures by as much as 89%. Yousef and Panneer Selvam (2018) compared wind pressures in tornado-like winds against those generated in straight-line winds on dome-shaped and prismatic buildings using large eddy simulation, finding that tornado forces exceeded the straight-line wind induced forces by factors of 1.5 laterally and 1.3 vertically, with tornado-induced wind pressures greater by factors as high as 2. A common theme in each of these studies is the role of the atmospheric pressure deficit (APD) in enhancing tornado-induced wind loads, although its exact role is not well understood, particularly in full-scale structures with complex opening configurations and interior compartments.
Both in situ observations (Lee and Samaras, 2004; Samaras and Lee, 2004; Karstens et al., 2010) and laboratory studies (Haan et al., 2008; Mishra et al., 2008; Sabareesh, 2012; Refan et al., 2014) have confirmed the presence of the APD. Simiu and Scanlan (1996) showed that the APD can be theoretically estimated as twice the velocity pressure of the rotating winds. The contribution of the APD to structural loading on typical buildings is less clear, as it relies upon the rate of pressure equalization across the building envelope through distributed leakage or large openings, which can be assessed through internal pressure measurements. Table 1 summarizes a selection of experimental studies that have investigated internal pressure under tornado-like loading. Using a combination of translating and stationary tornado simulators, and a variety of footprint area ratios (ratio of building footprint area to vortex core area), swirl ratios, and other parameters, several key themes emerge from the results of these studies. Specifically, (1) internal pressure increases relative to the APD when a dominant openings is located on the windward wall (i.e., exposed to the tangential component of the vortex) (Kikitsu et al., 2011; Letchford et al., 2015; Wang et al., 2018; Sabareesh et al., 2019); (2) internal pressure becomes more negative relative to the APD when dominant openings exist on the leeward wall (Letchford et al., 2015; Wang et al., 2018); (3) internal pressure is highly correlated with the external pressure at the opening (Sabareesh et al., 2013; Letchford et al., 2015); (4) APD equalization across the building envelope is a function of the opening ratio (i.e., area of the openings through the envelope to the surface area) (Kikitsu et al., 2011; Wang et al., 2018); and (5) internal pressure is uniform within a single building volume (Rajasekharan et al., 2013; Wang et al., 2018). These broad results fall in line with expectations from fundamental fluid–structure interaction theory. However, to date no study has taken these findings further and directly compared tornado-induced and straight-line induced wind loads with consideration of internal pressure resulting from typical opening conditions. Subsequently, there is a lack of understanding as to how the magnitude of tornado-induced pressures on buildings with realistic opening conditions compares to those induced by straight-line winds, for which there exists a large body of literature and established wind design standards.
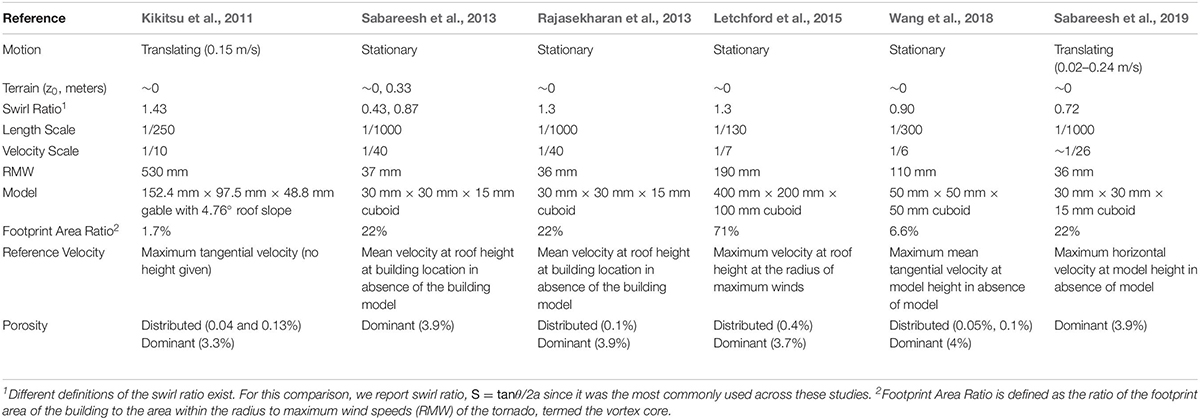
Table 1. Summary of recent experimental studies on tornado-induced internal pressure response.
The objective of this study is to evaluate the relative magnitude of tornado-induced and straight-line wind loads on a low-rise building with openings. The comparison will be made by coupling a numerical internal pressure model with existing external pressure distributions from two sources – (1) the Haan et al. (2010) study, and (2) the Tokyo Polytechnic University aerodynamic database (Tamura, 2012). Section “External Pressure Databases” describes the external pressure databases. Section “Internal Pressure” describes the internal pressure model. Section “Results” compares the resulting net pressure distributions and adds context to the results. Section “Conclusions and Discussion” concludes with discussion of the results and a summary of major findings.
External Pressure Databases
External Tornado Pressures
Haan et al. (2010) measured external tornado pressures on a gable building model using a translating vortex simulator at Iowa State University. The building model contained 89 pressure taps (46 wall and 43 roof taps), and had plan dimensions of 91 mm by 91 mm, an eave height of 36 mm and a roof angle of 35°. One hundred forty test cases were considered, consisting of different building orientations with respect to the vortex translation path, different tornado vortex structures and tornado vortex translation speeds. For each case, a tornado-like vortex was translated directly over the building model ten times to capture the variability in the measured tornado pressures. External pressures were sampled at 430 Hz, and were corrected for the dynamic tubing response. Of the 140 cases conducted by Haan et al. (2010), results from six are selected for the current study, corresponding to Cases 4, 16, 28, 116, 128, and 140. These six cases are chosen to capture the effects of swirl ratio and building orientation. Table 2 summarizes the parameters of each case, which include the vortex translation speed, building orientation, radius to maximum winds, Reynolds number (which is based on maximum mean horizontal velocity at the building height and the height of the building as the characteristic length), and swirl ratio reported for each in the original study. The swirl ratio is a measure of the relative magnitude of the angular and radial momentum in the vortex, and can be defined as given in Eq. (1),
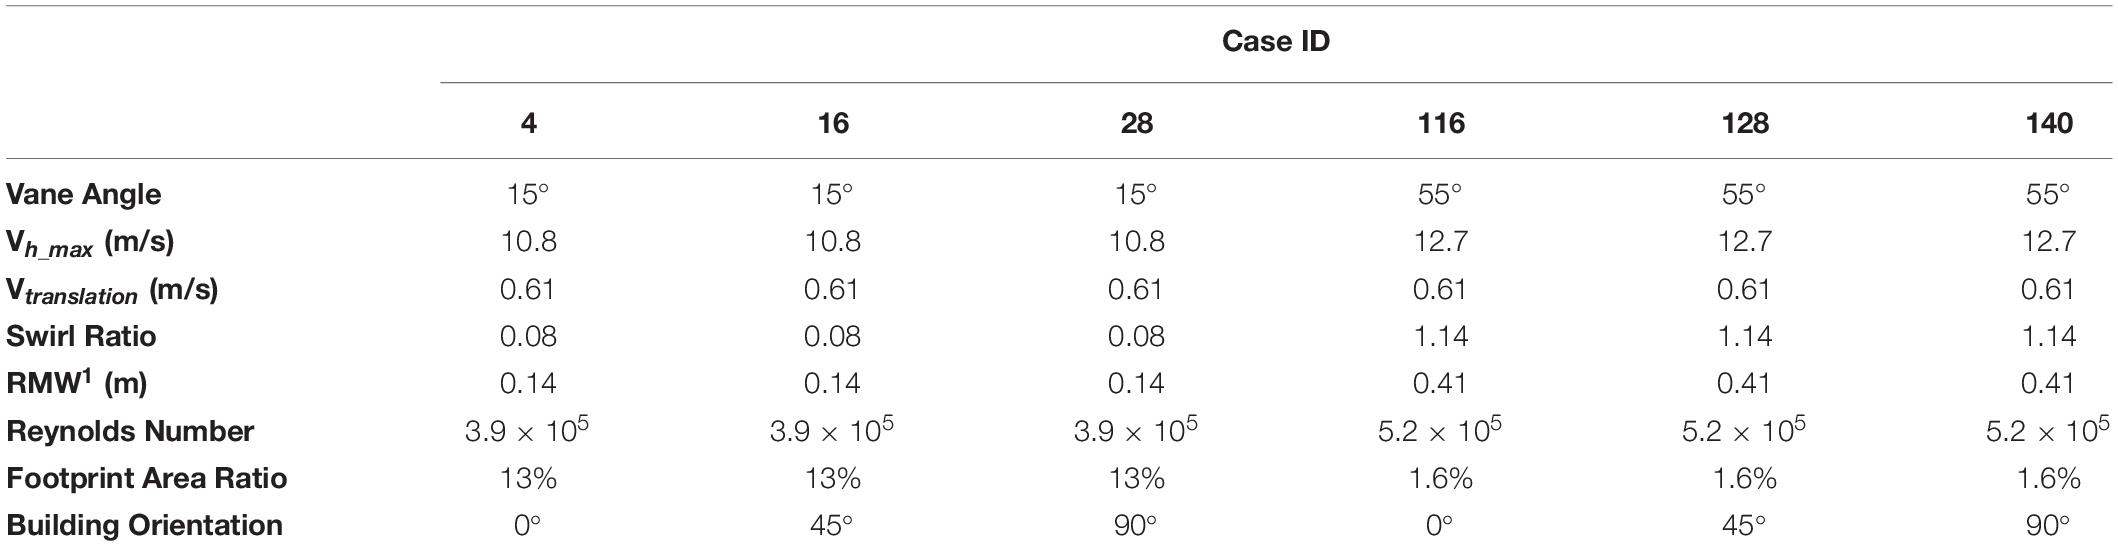
Table 2. Parameters of experimental cases from Haan et al. (2010) used in this study.
where Γ is the circulation [defined in Haan et al. (2008) as Γ = 2πr1Vθmax, a is the aspect ratio defined as a = h/r1, h is the inflow height, r1 is the core radius, Q′ is the flow rate through the fan and Vθ_max is the mean tangential velocity at the core radius at building height. The tornado vortex parameters used in this study are provided in Table 2.
The Footprint Area Ratios given in Table 2 represent the area of the building footprint relative to the area of the vortex core and have values of 13 and 1.6% respectively for the Vane 15 and Vane 55 cases. Assuming the building has full-scale footprint dimensions of 9.1 m by 9.1 m, this would equate to a tornado with core radius of 14 m for the low swirl ratio case (Vane 15) and 41 m for the high swirl ratio case (Vane 55). The core radii of tornadoes are difficult to measure in the field, and so the width of damaging winds is typically recorded instead. Strader et al. (2015) report that EF2 (maximum wind speeds between 50 m/s and 60 m/s) tornadoes in the US between 1995 and 2013 on average have a maximum path width of 288 m. Fan and Pang (2019) report the following relationship between core radius and path width assuming a Rankine vortex and the edge of the tornado being equivalent to a tangential wind speed of 30 m/s:
Using a path width of 288 m and 60 m/s for Vtan, max and solving gives RMW = 39 m. This indicates that the Footprint Area Ratios used in the current study are reasonable given the assumptions, with the low swirl ratio case representing a relatively small EF2 tornado, and the high swirl ratio case representing a more typical EF2 tornado.
Measured pressures were non-dimensionalized using pressure coefficients, defined as follows in Eq. (3):
where p is the measured pressure on the building model surface, pᥗ is the ambient pressure far from the influence of the vortex, ρ is the density of air, and Vref is the reference wind velocity, defined in Eq. (4):
where z is the height above floor level, H is the roof height of the building, n is the number of ensemble runs, r is the radial distance between the center of the building model and the center of the vortex, R defines the domain of the vortex translation path relative to the building model, and  is the 3-s gust (in full-scale, based on a full-scale velocity of 60 m/s, representing the upper limit of an EF2 tornado) wind speed measured at a specific distance, r, from the vortex center and height, z above the smooth floor. These wind speeds were captured by Fleming et al. (2013) by translating the tornado vortex past a stationary Cobra probe (2500 samples/second), in the absence of the building model, five times (i.e., number of ensemble, n = 5) for heights varying from 0.6 to 38 m in full-scale. The resulting horizontal velocity profile is shown in Figure 1A, normalized by Vref and the roof height of the building model, h. The velocity profile as shown represents the maximum horizontal wind speed at every height, independent of the time at which each maximum occurs, and therefore is different from the instantaneous profile present at any given time. The max-at-every-height velocity profiles for both swirl ratios show highest wind speeds at the lowest heights (no roughness elements were present), a general phenomenon that has been witnessed in field measurements as well (Kosiba and Wurman, 2013; Wurman et al., 2013; Kosiba et al., 2014). As a result, the maximum peak horizontal velocity anywhere below the height of the building is used as the reference velocity for evaluating tornado-induced pressure coefficients rather than restricting the reference velocity to a specific height as is common in boundary layer wind tunnel testing. Figure 1B shows a typical velocity time history for one ensemble run, both the raw instantaneous values and the 3-s (full-scale) moving average velocity. Here the time axis is converted to a non-dimensional distance from the center of the building model to the center of the approaching vortex, r, divided by the radius of maximum winds, Rmax. It is worth nothing that the velocities presented here should be treated with some caution as they were measured using a TFI Cobra probe, which has a ±45° cone of acceptance for a given orientation, which is not ideal for measuring velocities in complex, vortex-driven flows. More details concerning the challenges and resulting impacts on the experimental setup can be found in Fleming et al. (2013). Fleming et al. (2013) also provides more details of the laboratory tornado wind field, including the presence of a significant vertical velocity component that is not found in most straight-line winds.
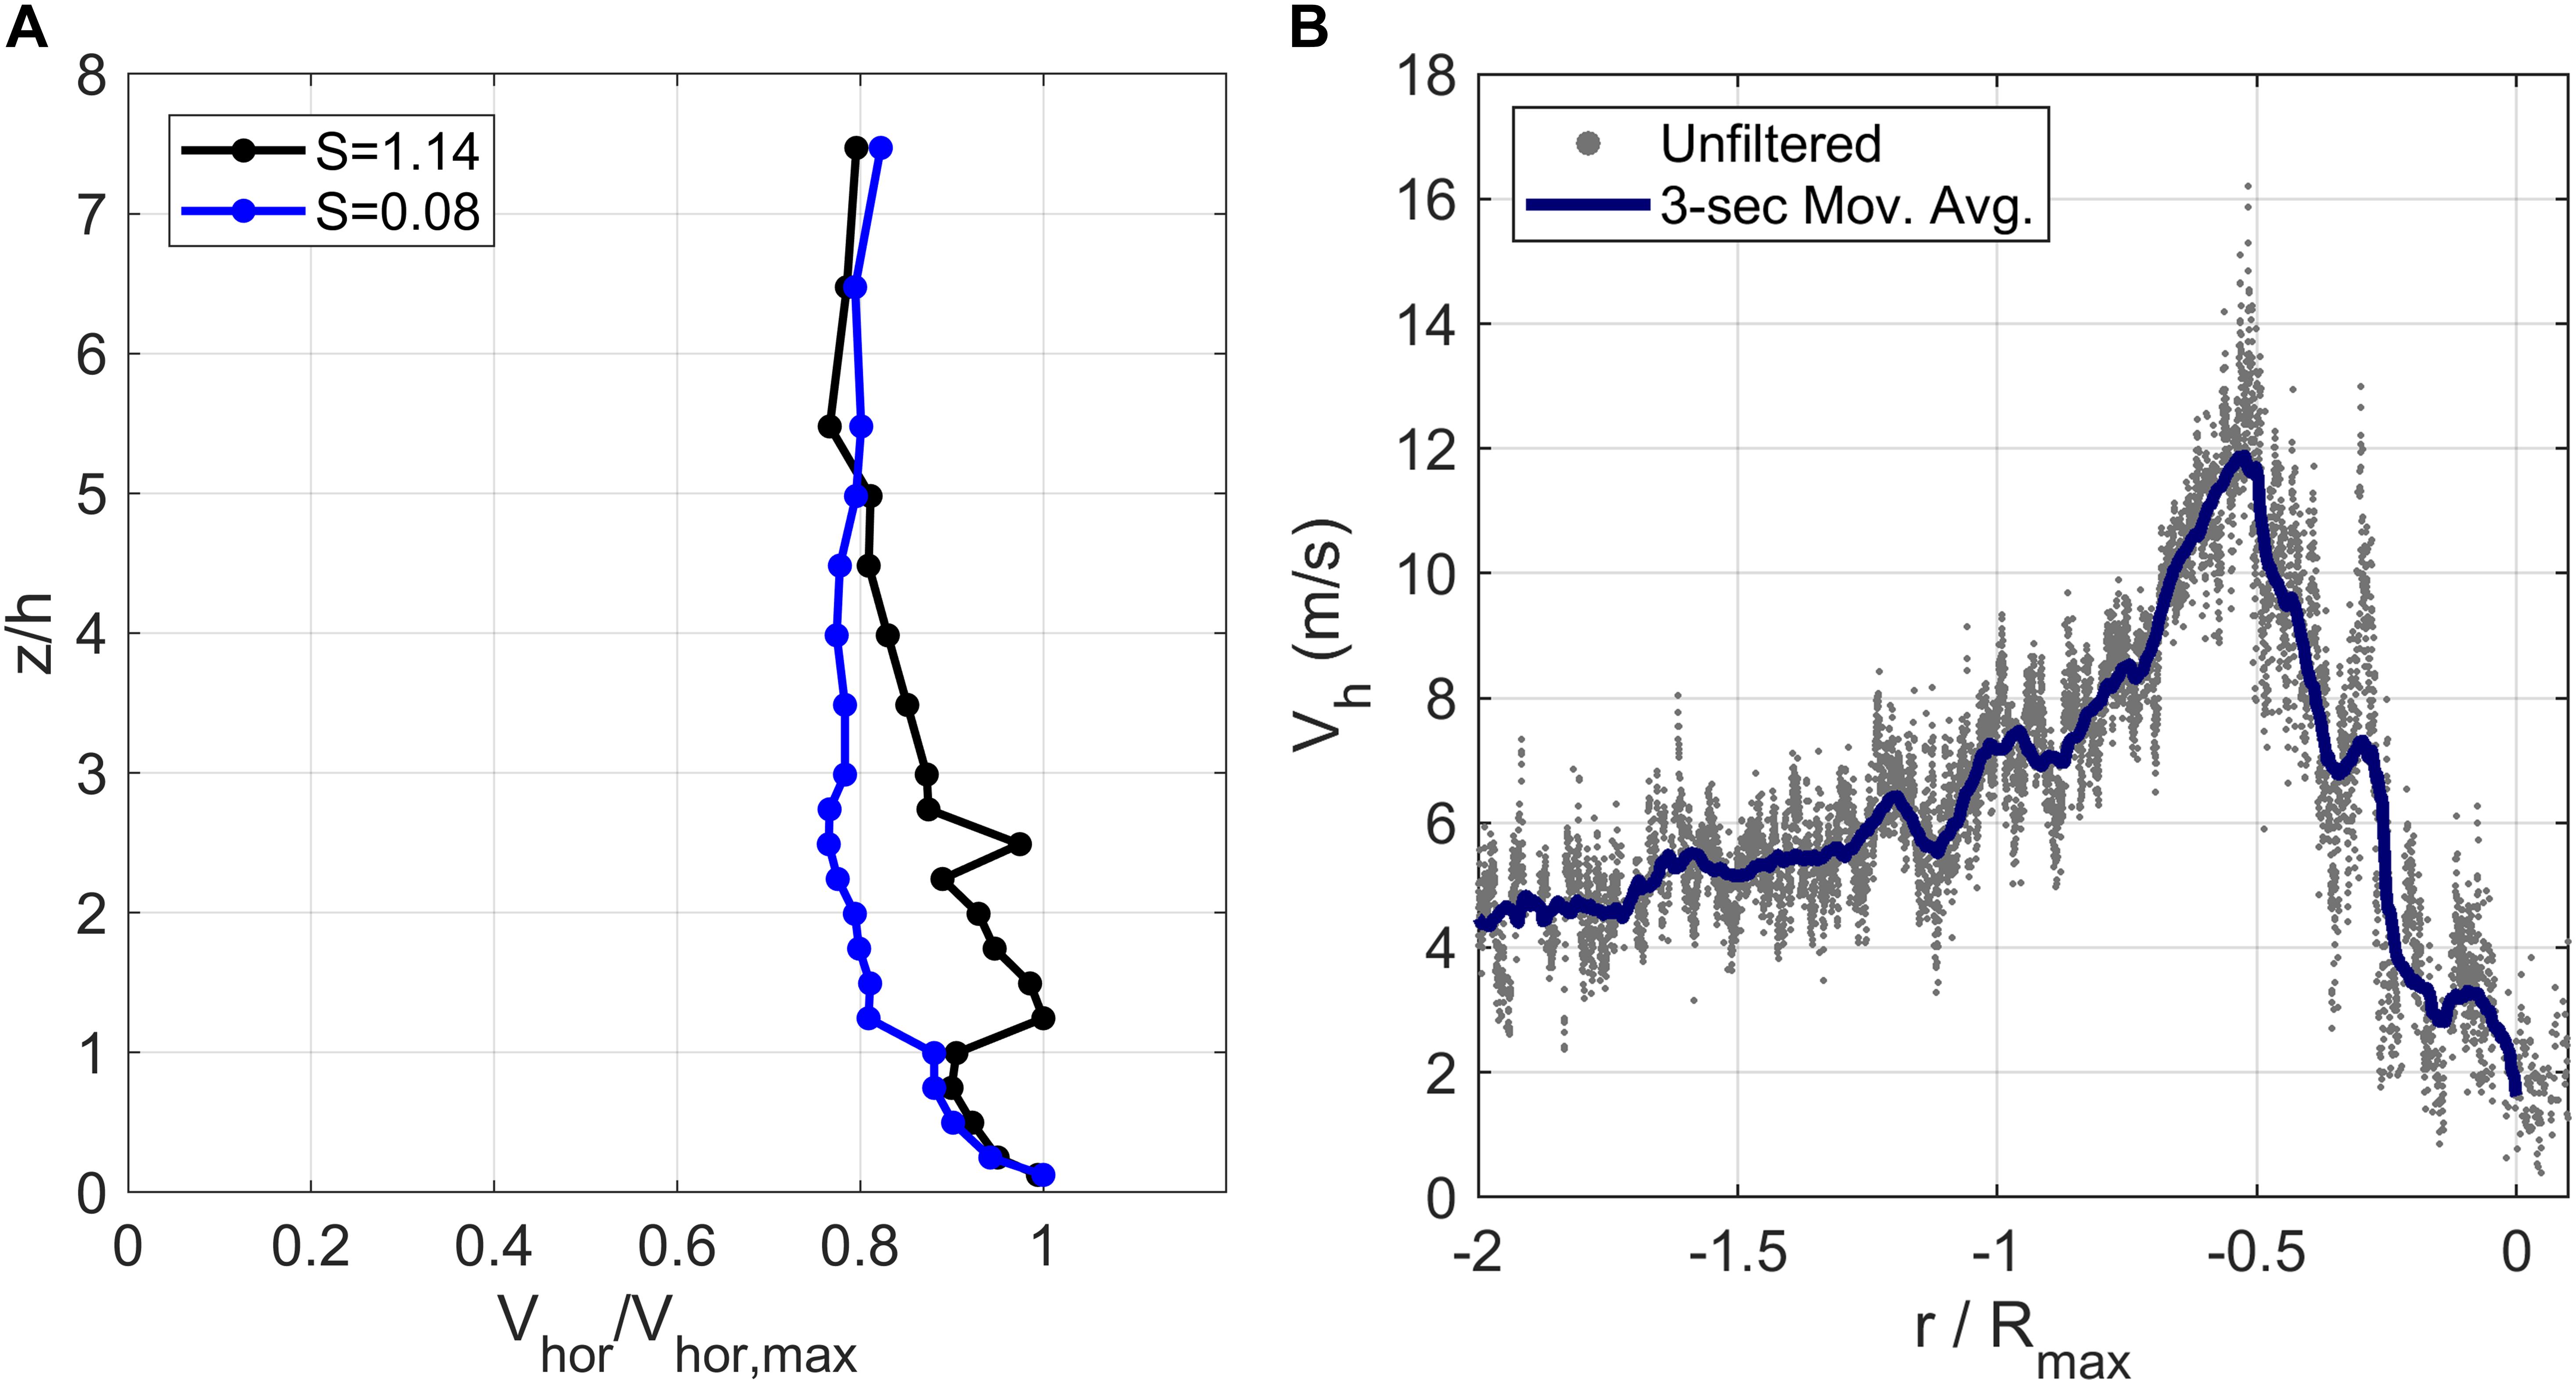
Figure 1. (A) Horizontal velocity profile for low and high swirl ratio tornado-like vortices, normalized to the mean roof height of the building model, h, and the peak horizontal velocity,Vhor,max.. (B) Sample velocity time history for one ensemble run of the Vane 55 vortex translating past a stationary Cobra probe measuring at the roof height of the building model.
External Straight-Line Wind Pressures
The Tokyo Polytechnic University aerodynamic database (Tamura, 2012) contains external wind pressure coefficients for 116 different models of gable, hip and flat roof, low rise structures. Data are available for wind angles between 0° and 90° in 15° increments, and the symmetry of the building model and pressure taps are used to simulate pressure data for wind angles between 90° and 360°. Tamura (2012) states that the full scale gradient height of the boundary layer was 450 m, with a turbulence intensity of 0.25 at 10 m full-scale height, and power law coefficient of 0.2, matching terrain category III in the Architectural Institute of Japan (AIJ) wind loads guide (AIJ, 2004). This corresponds to a roughness length of approximately 0.068 m using the relationship between α and z0 given in Holmes (2015). The pressures were originally referenced to the mean roof height velocity, reported as 7.4 m/s, in this terrain. Using the assumed 1/3 velocity scale from Tamura (2012), the full scale duration of the testing was 10 min. Hagos et al. (2014) confirmed the suitableness of this database for use in wind engineering applications.
A single building model that most closely matches the shape and aspect ratio of the Haan et al. (2010) building model was chosen from the TPU aerodynamic library. Relevant details of the TPU model are provided in Table 3 with comparison to equivalent details from the Haan et al. (2010) model. The building models are reasonably similar. While the actual dimensions of the TPU building model are larger than the Haan et al. (2010) model, the aspect ratios and roof slopes are similar.
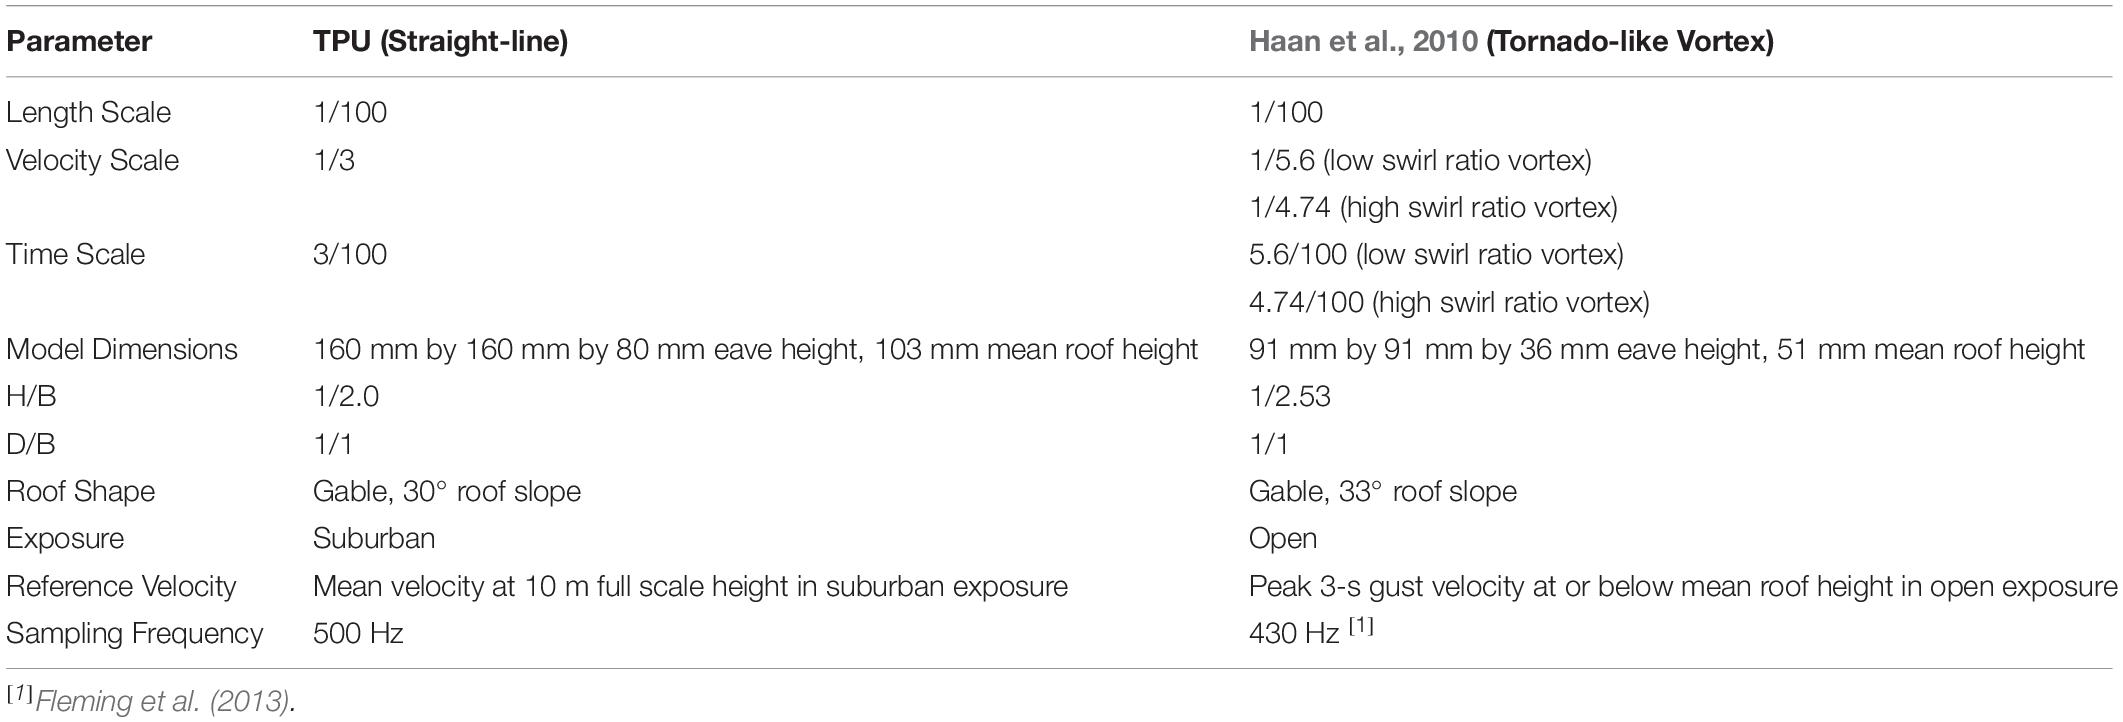
Table 3. Comparison of original wind tunnel parameters from TPU (Tamura, 2012) and Haan et al. (2010).
Compatibility Between Tornado-Induced and Straight-Line Wind-Induced Pressures
Before any comparisons can be made between the datasets, equivalency must be addressed, as described in the following sections.
Reference Velocity
The reference velocity depends on the assumed length and velocity scales. Length scales are problematic in vortex-driven fluid-structure interaction studies (Refan et al., 2014; Baker and Sterling, 2019; Gairola and Bitsuamlak, 2019), but some reasonable estimate must be made in order to obtain the model scale gust averaging time for the reference velocity. Here we use a length scale of 1/100 and a velocity scale of 1/5.6 and 1/4.74 for the low swirl and high swirl ratio vortices respectively (assuming full-scale wind speed of 60 m/s) to evaluate the maximum 3 s gust (in full scale) wind speed of the translating vortex at or below the roof height (in nominally open terrain since no roughness elements were present and a smooth floor was used), which is used as the reference velocity. The TPU pressures were originally referenced to the mean approach velocity at mean roof height in suburban exposure (Tamura, 2012). The TPU pressure coefficients are re-referenced in this study to the peak gust velocity at mean roof height based on the methods in St. Pierre et al. (2005), given as follows:
where Cpref is the TPU pressure coefficients, Cpeq is the TPU pressure coefficients re-referenced to be equivalent with the ISU pressure coefficients, and WTz,t,z0 is a wind tunnel factor to re-reference pressure coefficients for different heights (z), wind speed averaging times (τ), and surface roughness (z0). For this study, no adjustments are made for height as the pressure coefficients from the TPU and ISU databases are both referenced to the maximum wind speed at or below the mean roof height. No adjustments are also made for terrain, because the objective of this study is to compare the aerodynamic pressure coefficients, which, when referenced to the upstream velocity at mean roof height, are nominally independent of terrain. Indeed this is the foundation for the ASCE 7–10 design wind load standard, based on quasi-steady theory, and is appropriate for most flow regimes (Banks and Meroney, 2001).
While adjustments for height and terrain are not applied, the TPU pressure coefficients are re-referenced from the mean wind speed to a peak 3-second gust to match the ISU pressures, using the wind speed conversion approach in Simiu and Scanlan (1996), given in Eq. (6):
where  (z) and
  (z) are the gust velocity and mean velocity at height z respectively, β and c are coefficients, the former a function of height and surface roughness, z0, and the latter a function of gust averaging time, τ. For this study, z is taken as the mean roof height, and z0 is taken as 0.068 m, equivalent to a power law profile with alpha equal to 0.2 and a gradient height of 450 m, as provided in AIJ (2004) and Tamura (2012). β is taken as 6.01, and c(τ) is taken as 0.526, both values interpolated from Simiu and Scanlan (1996). c is interpolated using a gust averaging time, τ, of 3 s. Eq. (5) thus results in a wind tunnel factor equal to 0.47. Using the Durst curve (Durst, 1960) would give a wind tunnel factor approximately equal to 0.52.
Moving Average
The TPU time series data as provided in the TPU aerodynamic database was archived with a 0.006 second moving average in measurement time already applied (Tamura, 2012). With the velocity scale, this represents a 0.1 second moving average in full scale. For consistency, the tornado simulator data is also smoothed with a 0.1 s moving average, which equates to a moving average over two samples for the high swirl ratio (Vane 55) vortex and three samples for the low swirl ratio vortex (Vane 15).
Number and Location of Pressure Taps
The TPU building model contains 144 pressure taps distributed over the roof and four walls. The ISU building model contains 89 pressure taps, with a denser pattern in one corner of the roof and limited taps on one side of the roof. The tap layouts for both models are shown in Figure 2. Since the TPU model has a denser tap layout, the pressures are interpolated and resampled to match the number and locations of the ISU model taps. Interpolation used the Natural (i.e., Nearest) Neighbor interpolation method described in Amidror (2002) and implemented in Matlab (Mathworks, 2018). After interpolation, the pressure distributions still match well as shown in Figure 3, although some loss of resolution is apparent. This is deemed acceptable since the objective is for direct comparison against the ISU pressures, and not development of design wind loads or comparison against design standards.
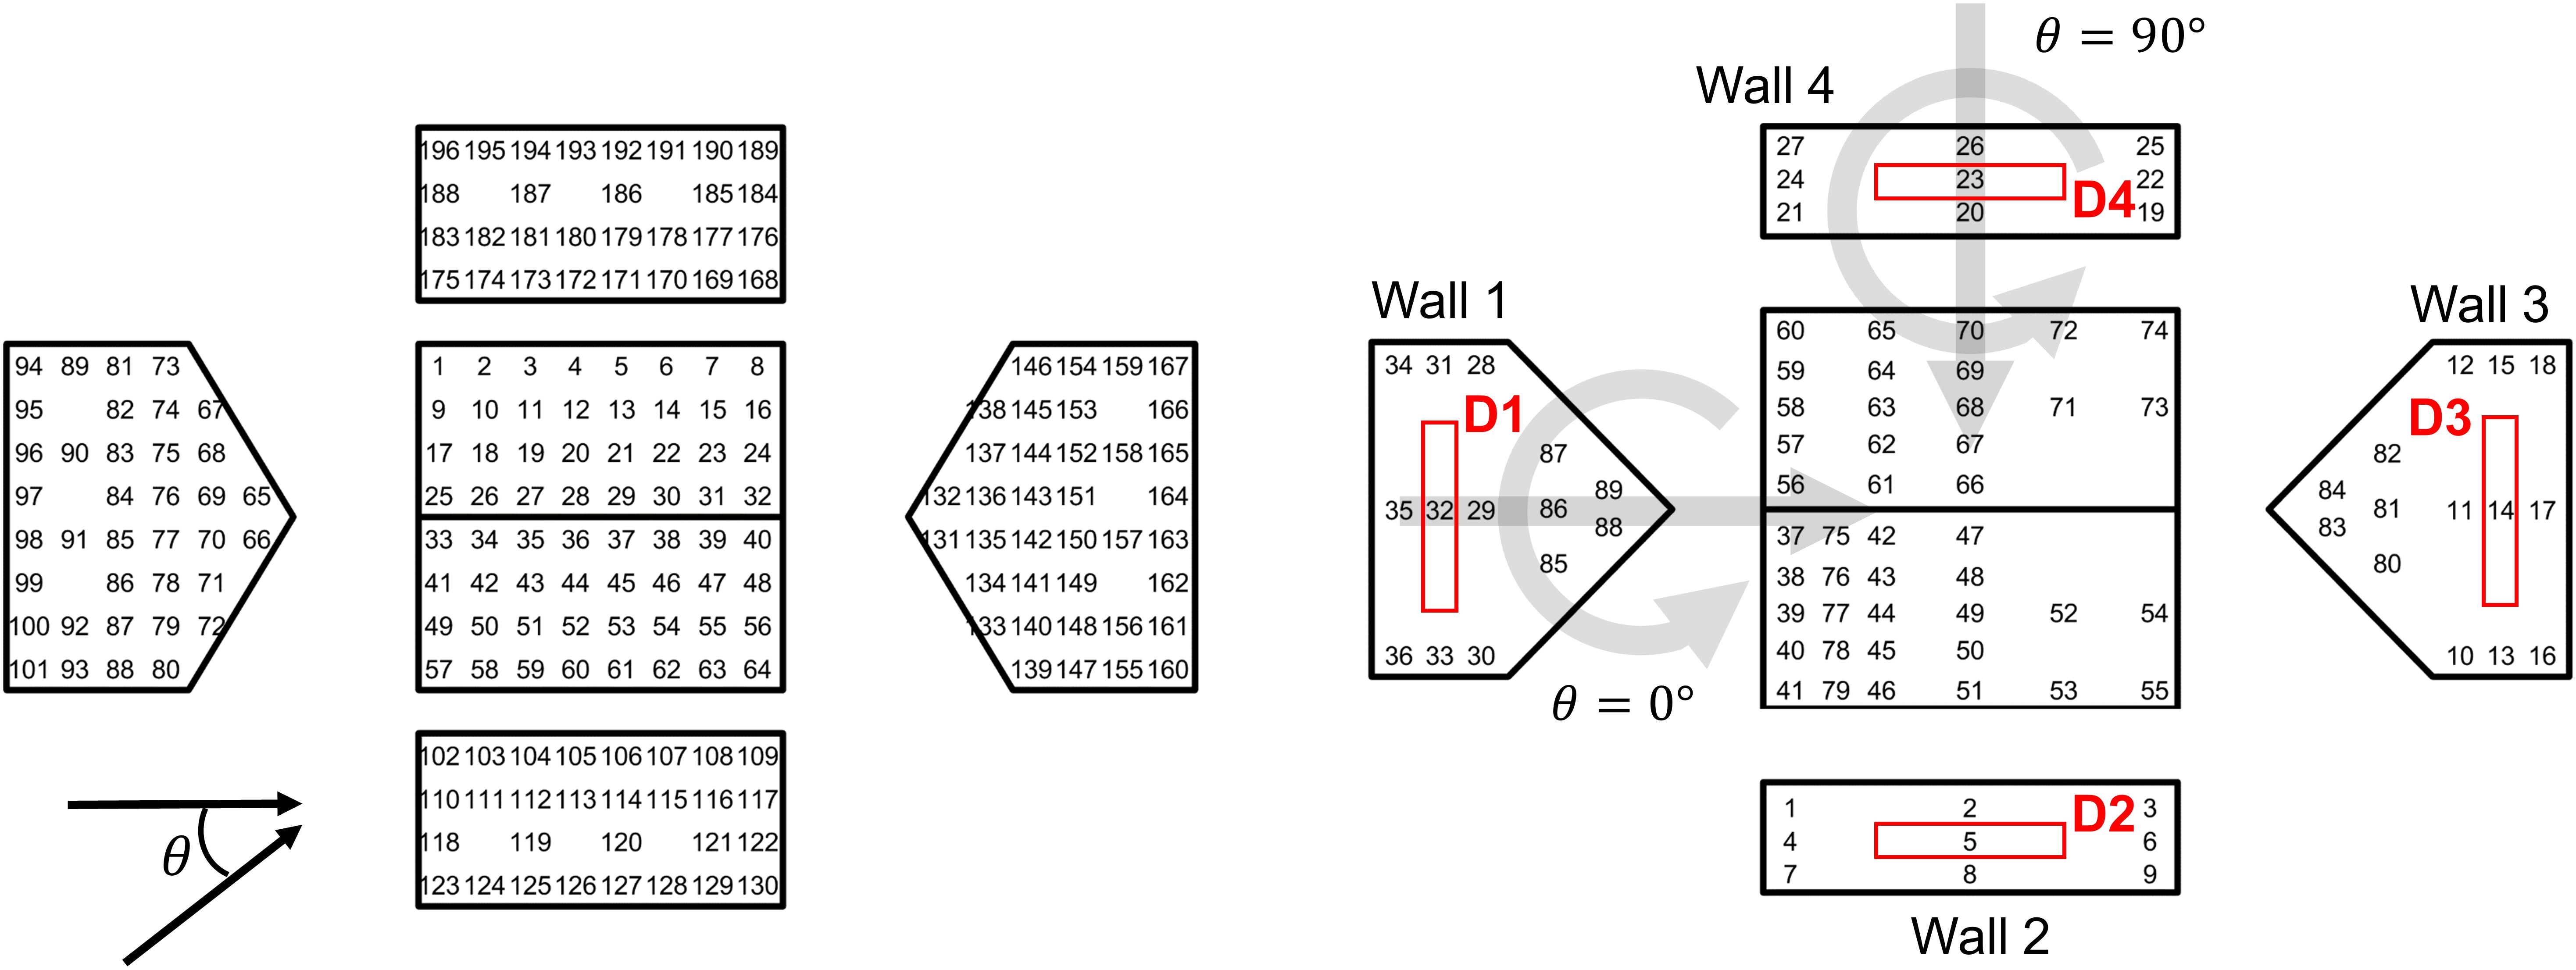
Figure 2. Tap layouts and wind angles of attack for the (left) TPU and (right) ISU building models. The translation and rotation of the tornado relative to the ISU building model is illustrated by the gray arrows for the 0° and 90° cases. Individual walls and openings (indicated by red rectangles) are also defined for the ISU building model.
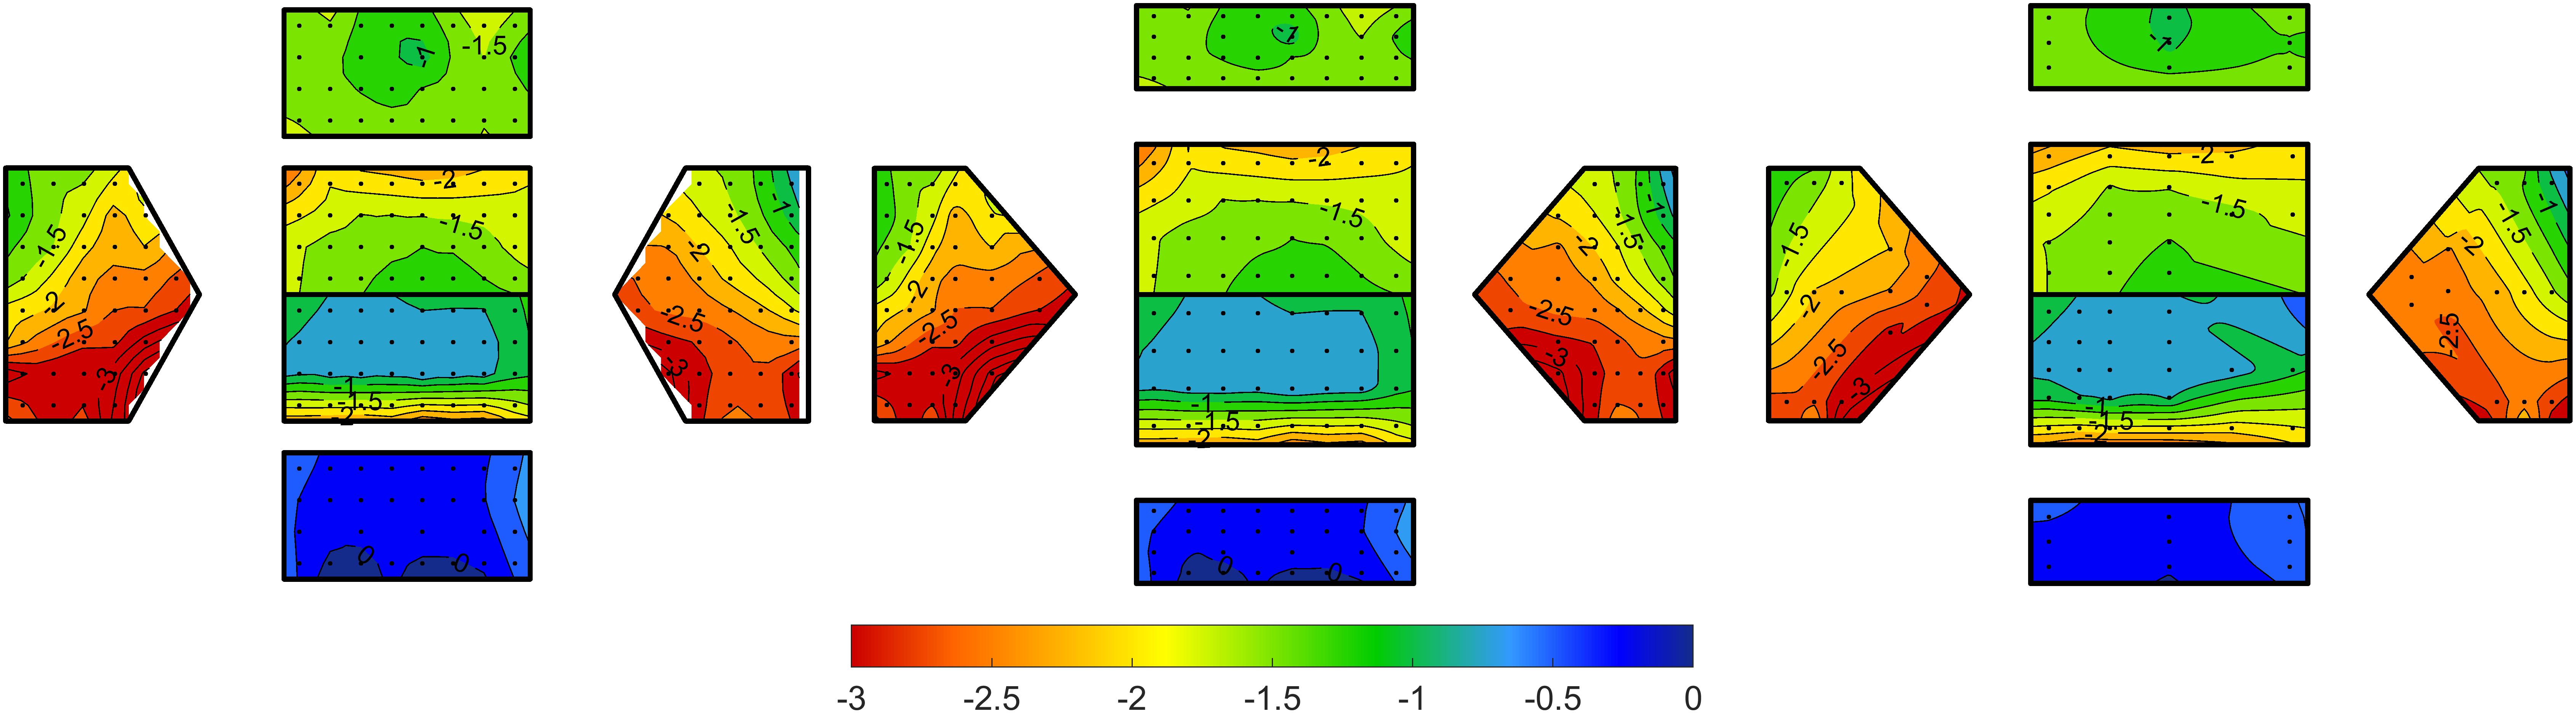
Figure 3. Effects of projecting and interpolating the TPU external pressure distributions to match the ISU building model geometry, illustrated using peak negative pressure coefficients with 78% probability of non-exceedance for a wind angle of attack, θ = 90°– (left) original data with 144 pressure taps; (middle) with 144 tap locations projected onto ISU building model; (right) projected pressures interpolated to match 89 tap locations on the ISU building model.
The tap locations on the TPU model are also projected to match the exact geometry of the ISU building model, which has a slightly lower h/B aspect ratio and slightly lower roof slope. The results of the projection are also shown in Figure 3.
Wind Angles of Attack
The TPU database contains stationary time histories of pressure coefficients for wind angles of attack from 0 to 90° in 15° increments, which can be used to represent pressures for angles up to 360° using the symmetry of the building model. The wind angle of attack in a tornado is less obvious, as it depends on where the structure is located with respect to the tornado and on the structure of the wind velocity components in the tornado (e.g., ratio of tangential to radial flow). The low swirl (V15) and high swirl (V55) ratio vortices simulated in the Iowa State tornado simulator are both dominated by tangential flow (Haan et al., 2009; Fleming et al., 2013), meaning that when the building model is located one radius in advance of and one radius behind the tornado and is oriented with θ = 0° as shown in Figure 2, it could reasonably be compared to the 90 or 270°case for straight-line winds. At other points, the pressures are similar to cornering wind angles given the vector addition of the radial and tangential velocity components. Thus when the translation of the vortex over the model is combined with altering the orientation of the building itself from 0 to 90°, all possible orientations between 0 and 360° are potentially covered. In this study then, peak pressures during the passage of the vortex over building models oriented at 0, 45, and 90° are compared to envelope peak pressures for wind angles of 0–345° in 15° increments from the TPU database. Only cases where the tornado-like vortex passes directly over the building model are considered. It is possible that this limitation does not capture the worst-case pressures in a tornado, as indicated in Razavi and Sarkar (2018), but this possibility is not addressed within this study.
Peak Pressure Coefficients
Peak pressure coefficients can be more reliably compared using expected peak values rather than observed peaks. Expected peak values are obtained by fitting an extreme value distribution to multiple samples of the peak. This can be accomplished by splitting a stationary time series into multiple individual segments, or performing multiple experimental runs, deemed ensembles. The former approach is used for the straight-line wind pressures, while the latter was used for the tornado-induced pressures as described in Haan et al. (2010). Each approach produces ten samples of the peak minimum and maximum pressure coefficients for each tap for a given experimental configuration. The Type I extreme value distribution, or Gumbel distribution, is fit to these peaks, given as follows in Eq. (7):
where μ is the location parameter, and β is the scale parameter. These parameters are obtained using the Best Linear Unbiased Estimator (BLUE) method (Lieblein, 1974). Peaks associated with the 50% probability of non-exceedance are used for both the tornado and straight-line wind pressures.
Internal Pressure
Internal pressures were not directly measured in either the Haan et al. (2010) or Tamura (2012) datasets. Instead, internal pressures are modeled in this study using the external pressure distributions and assumptions of opening locations and sizes for two opening cases: (1) enclosed, representing the inherent leakage present in most buildings in the absence of any large openings; and (2) partially enclosed, representing the condition where the building has a large opening in one wall of the building (deemed the dominant opening), such as a failed window or garage door, that is at least 10% larger than the remaining balance of openings in the building, following the criteria and definitions as defined in ASCE 7-16 (ASCE, 2017). This opening condition typically represents the worst-case design scenario if the wind angle of attack is aligned with the dominant opening.
The Multiple Discharge Equations (MDE) for unsteady, incompressible flow (Vickery, 1986; Oh et al., 2007), are used to simulate the internal pressure given assumptions of opening sizes and locations. The multiple discharge equations have the form given in Eq. (8):
where m is the number of openings, ρ is air density, le,m is the effective length of the air slug at opening m, x is the position of the air slug moving through opening m, k is the discharge coefficient, n is the flow coefficient, μ is the dynamic viscosity of air, l0 is the opening length, d is the opening diameter, pe,m the external pressure at openingm, and pi the internal pressure, which is assumed to be constant throughout the internal volume at each time step. Since each equation has two unknowns, xm and pi, the continuity equation is used to provide the additional equation needed to solve for the internal pressure. The continuity equation is taken as follows in Eq. (8), which assumes the pressure-density relationship is governed by an isentropic process:
where A is the area of the opening, V0 is the internal volume, γ is the ratio of the specific heats of air, P0 is the ambient atmospheric pressure, and all other terms are defined as previously. For a single dominant opening, the flow coefficient is typically taken as n = 0.5 and, solving for x in Eq. (9) and substituting into Eq. (8), results in a single equation, given in Eq. (10):
Other coefficients and terms were taken following the recommendations of Oh et al. (2007), including k = 0.38 for distributed, small leakage gaps and k = 0.63 for dominant openings cases. The effective length, le was taken as after Vickery (1986). The opening length, l0 is taken as the thickness of the wall of a typical building, assumed in full-scale to be 0.114 m. in this study.
For the enclosed case, an opening was assumed to be located at each wall tap location with an area of 0.0143 m2 in full-scale dimensions, giving an opening ratio of 0.2% (area of openings to surface area of the building). With an opening ratio of 0.13%, Kikitsu et al. (2011) found that 80% of the APD was equilibrated across the building envelope. Extrapolating the results of their study, we assume that a building with 0.2% opening ratio will fully and instantaneously equilibrate the APD, meaning the enclosed case nominally equalizes the effects of the APD. The results of this study show this to be true, so long as the MDE methodology is viable for simulating tornado-induced internal pressure. The role of the APD in tornado-induced loading for different leakage levels deserves further research, but is beyond the scope of this current study.
Four different dominant opening cases are considered separately, as shown in Figure 2. In each case, the opening is modeled as having an area of 3 m2, and located at the center of the wall. The opening area is more than 5% of the wall area in each case. Internal pressures for a single dominant opening have been shown to be independent of opening areas greater than approximately 5% (Stathopoulos and Kozutsky, 1986). The external pressure time history used in the MDE model to simulate the internal pressure is taken to be that measured at the center wall tap, e.g., Tap 32 for a dominant opening on Wall 1, Tap 5 for a dominant opening on Wall 2.
For a given opening configuration, the MDE are solved using the backward difference approximation method (Thomas, 2013) to provide a time history of the internal pressure.
Internal Pressure Considering Tornado-Like Flow
Internal pressures induced by the tornado-like flow are illustrated in Figure 4. The static pressure profiles in these plots represent the static pressures measured in absence of the building model, which were captured simultaneously with the velocity measurements described in preceding sections of this paper. For a given fan vane angle and vortex translation speed, the static pressure time histories are averaged across the five ensemble runs, and then across all heights up to the mean roof height of the building model. Internal pressures are simulated based on the external pressure distributions and the assumed opening conditions, as described previously. Figure 4A demonstrates how the distributed leakage in the enclosed opening case nominally equilibrates the static pressure, resulting in net internal pressures that are largely insignificant in magnitude. In contrast, with a dominant opening on Wall 1, and θ = 90° (Figure 4B), the tangential flow impinges on the wall with a dominant opening as the tornado approaches the building model, resulting in positive internal pressures relative to the static pressure profile (i.e., positive net pressure). As the tornado translates past the building model, the tangential flow would suggest that the dominant opening on Wall 1 is in a leeward flow regime, which is indeed the case as the internal pressure is negative relative to the static pressure. However, the magnitude of the net pressure in the leeward case is approximately 30% of the magnitude in the windward case (comparing r/Rmax = 1.0 to r/Rmax = −1.0 in Figure 4B). A similar trend is observed in both the Vane 15 (low swirl ratio) and Vane 55 (high swirl ratio) vortices, suggesting that some combination of the tangential, radial, and/or vertical velocity components are disrupting the aerodynamics that would be expected for purely tangential flow, potentially related to findings in Kopp and Wu (2017).
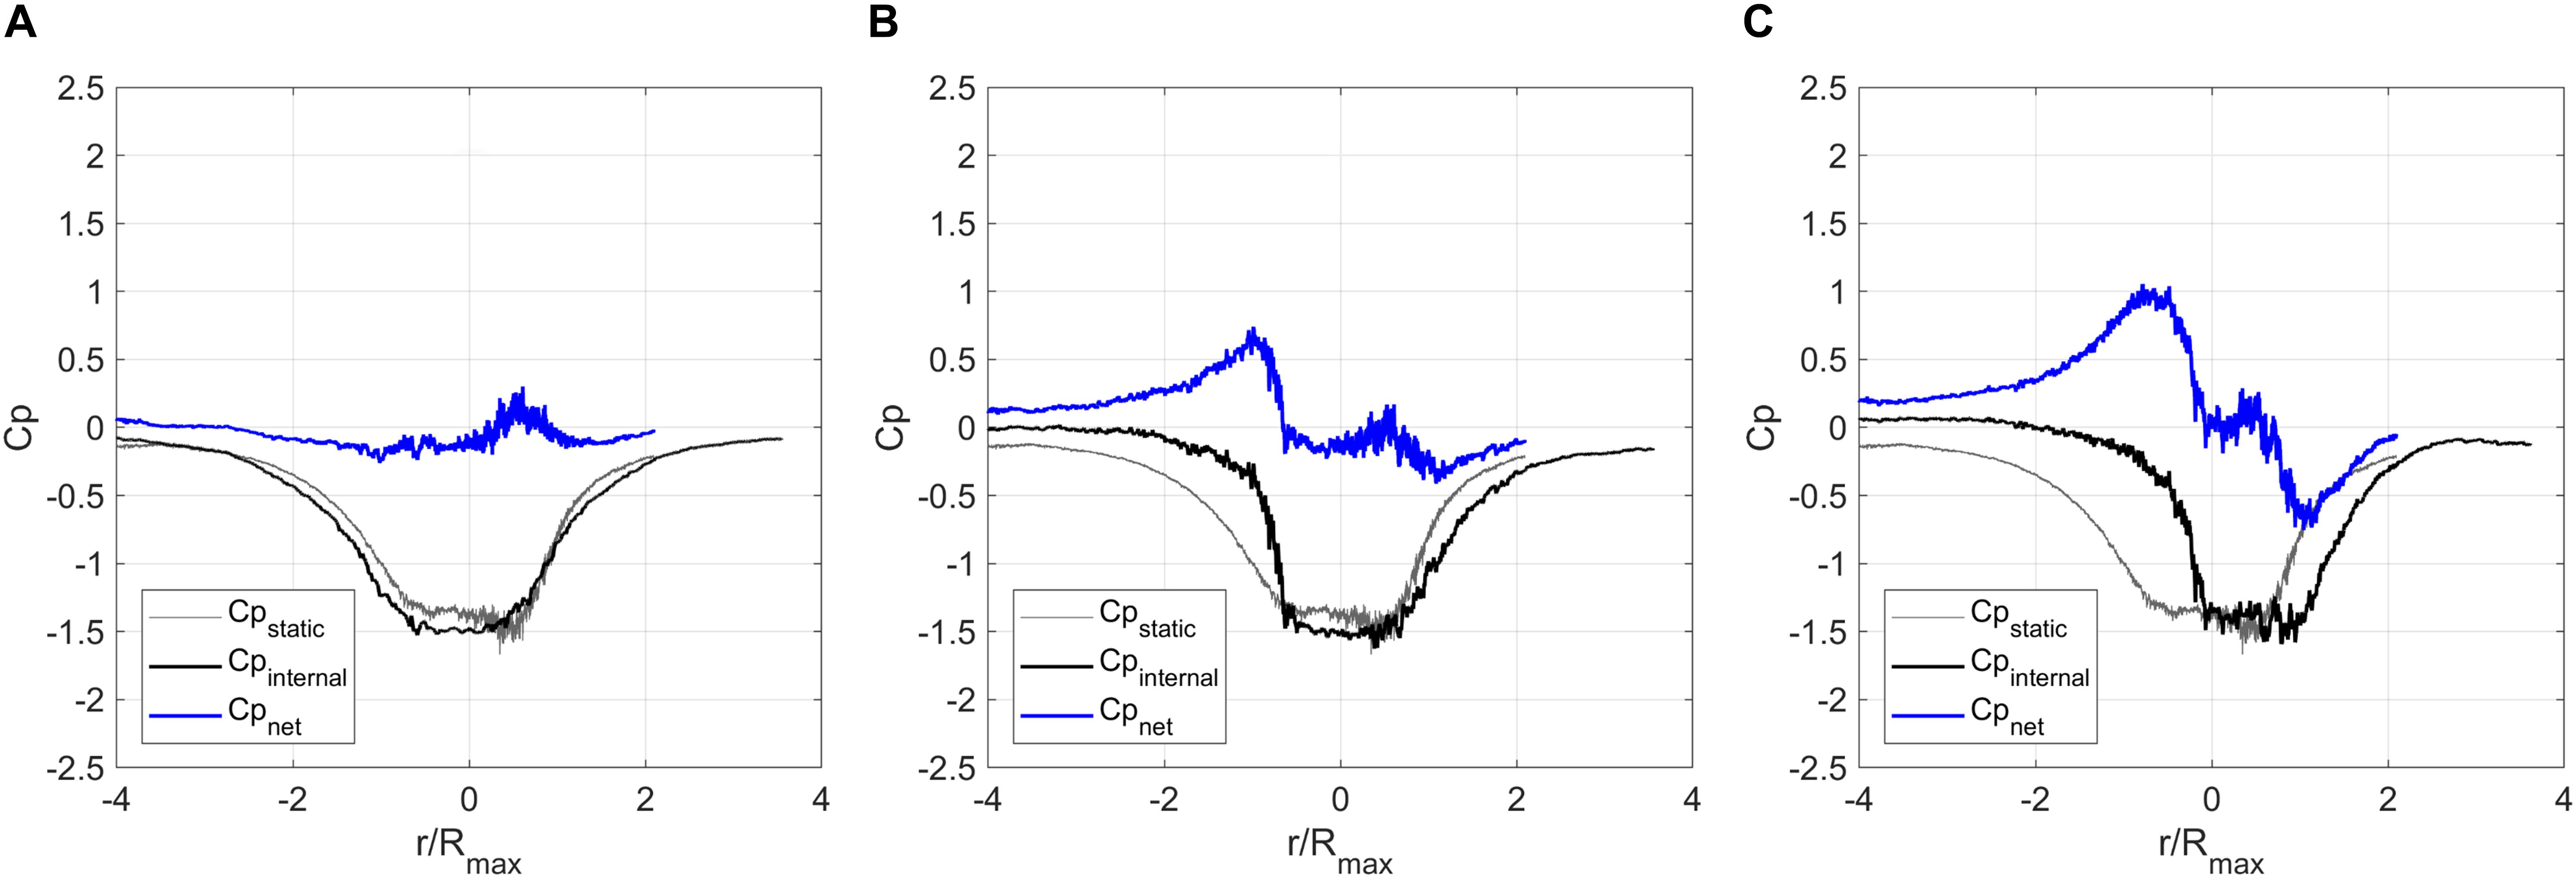
Figure 4. Estimated internal pressures under tornado-induced flow; (A) high swirl ratio, enclosed building,θ = 90°; (B) high swirl ratio, dominant opening on Wall 1 withθ = 90°; (C) high swirl ratio, dominant opening on Wall 2 with θ = 0°. Net pressures are taken as Cpnet=Cpinternal−Cpstatic.
Interestingly, the magnitude of the net pressures is greater, and the difference in net pressure magnitudes between the windward and leeward conditions is much less pronounced, when openings are present on the side walls, as compared to the gable end walls, as demonstrated in Figure 4C. More research is needed to understand what specifically is contributing to the different aerodynamics observed under tornado-like flow.
Internal Pressure Considering Straight-Line Wind Flow
The internal pressure response under straight-line wind flow, estimated analytically in this study, is shown in Figure 5. When the dominant opening is on the windward wall, internal pressure is strongly positive, with a mean pressure coefficient of about 0.4, and a peak positive pressure coefficient of around 1.0. When the dominant opening is located on a side wall, the internal pressure has a negative peak pressure coefficient of around −1, but when the opening is on the leeward wall, the negative peak pressure coefficient is significantly less, around −0.4. Recall that the internal pressure coefficients shown here are referenced to the full-scale equivalent peak 3-s gust wind speed at roof height.
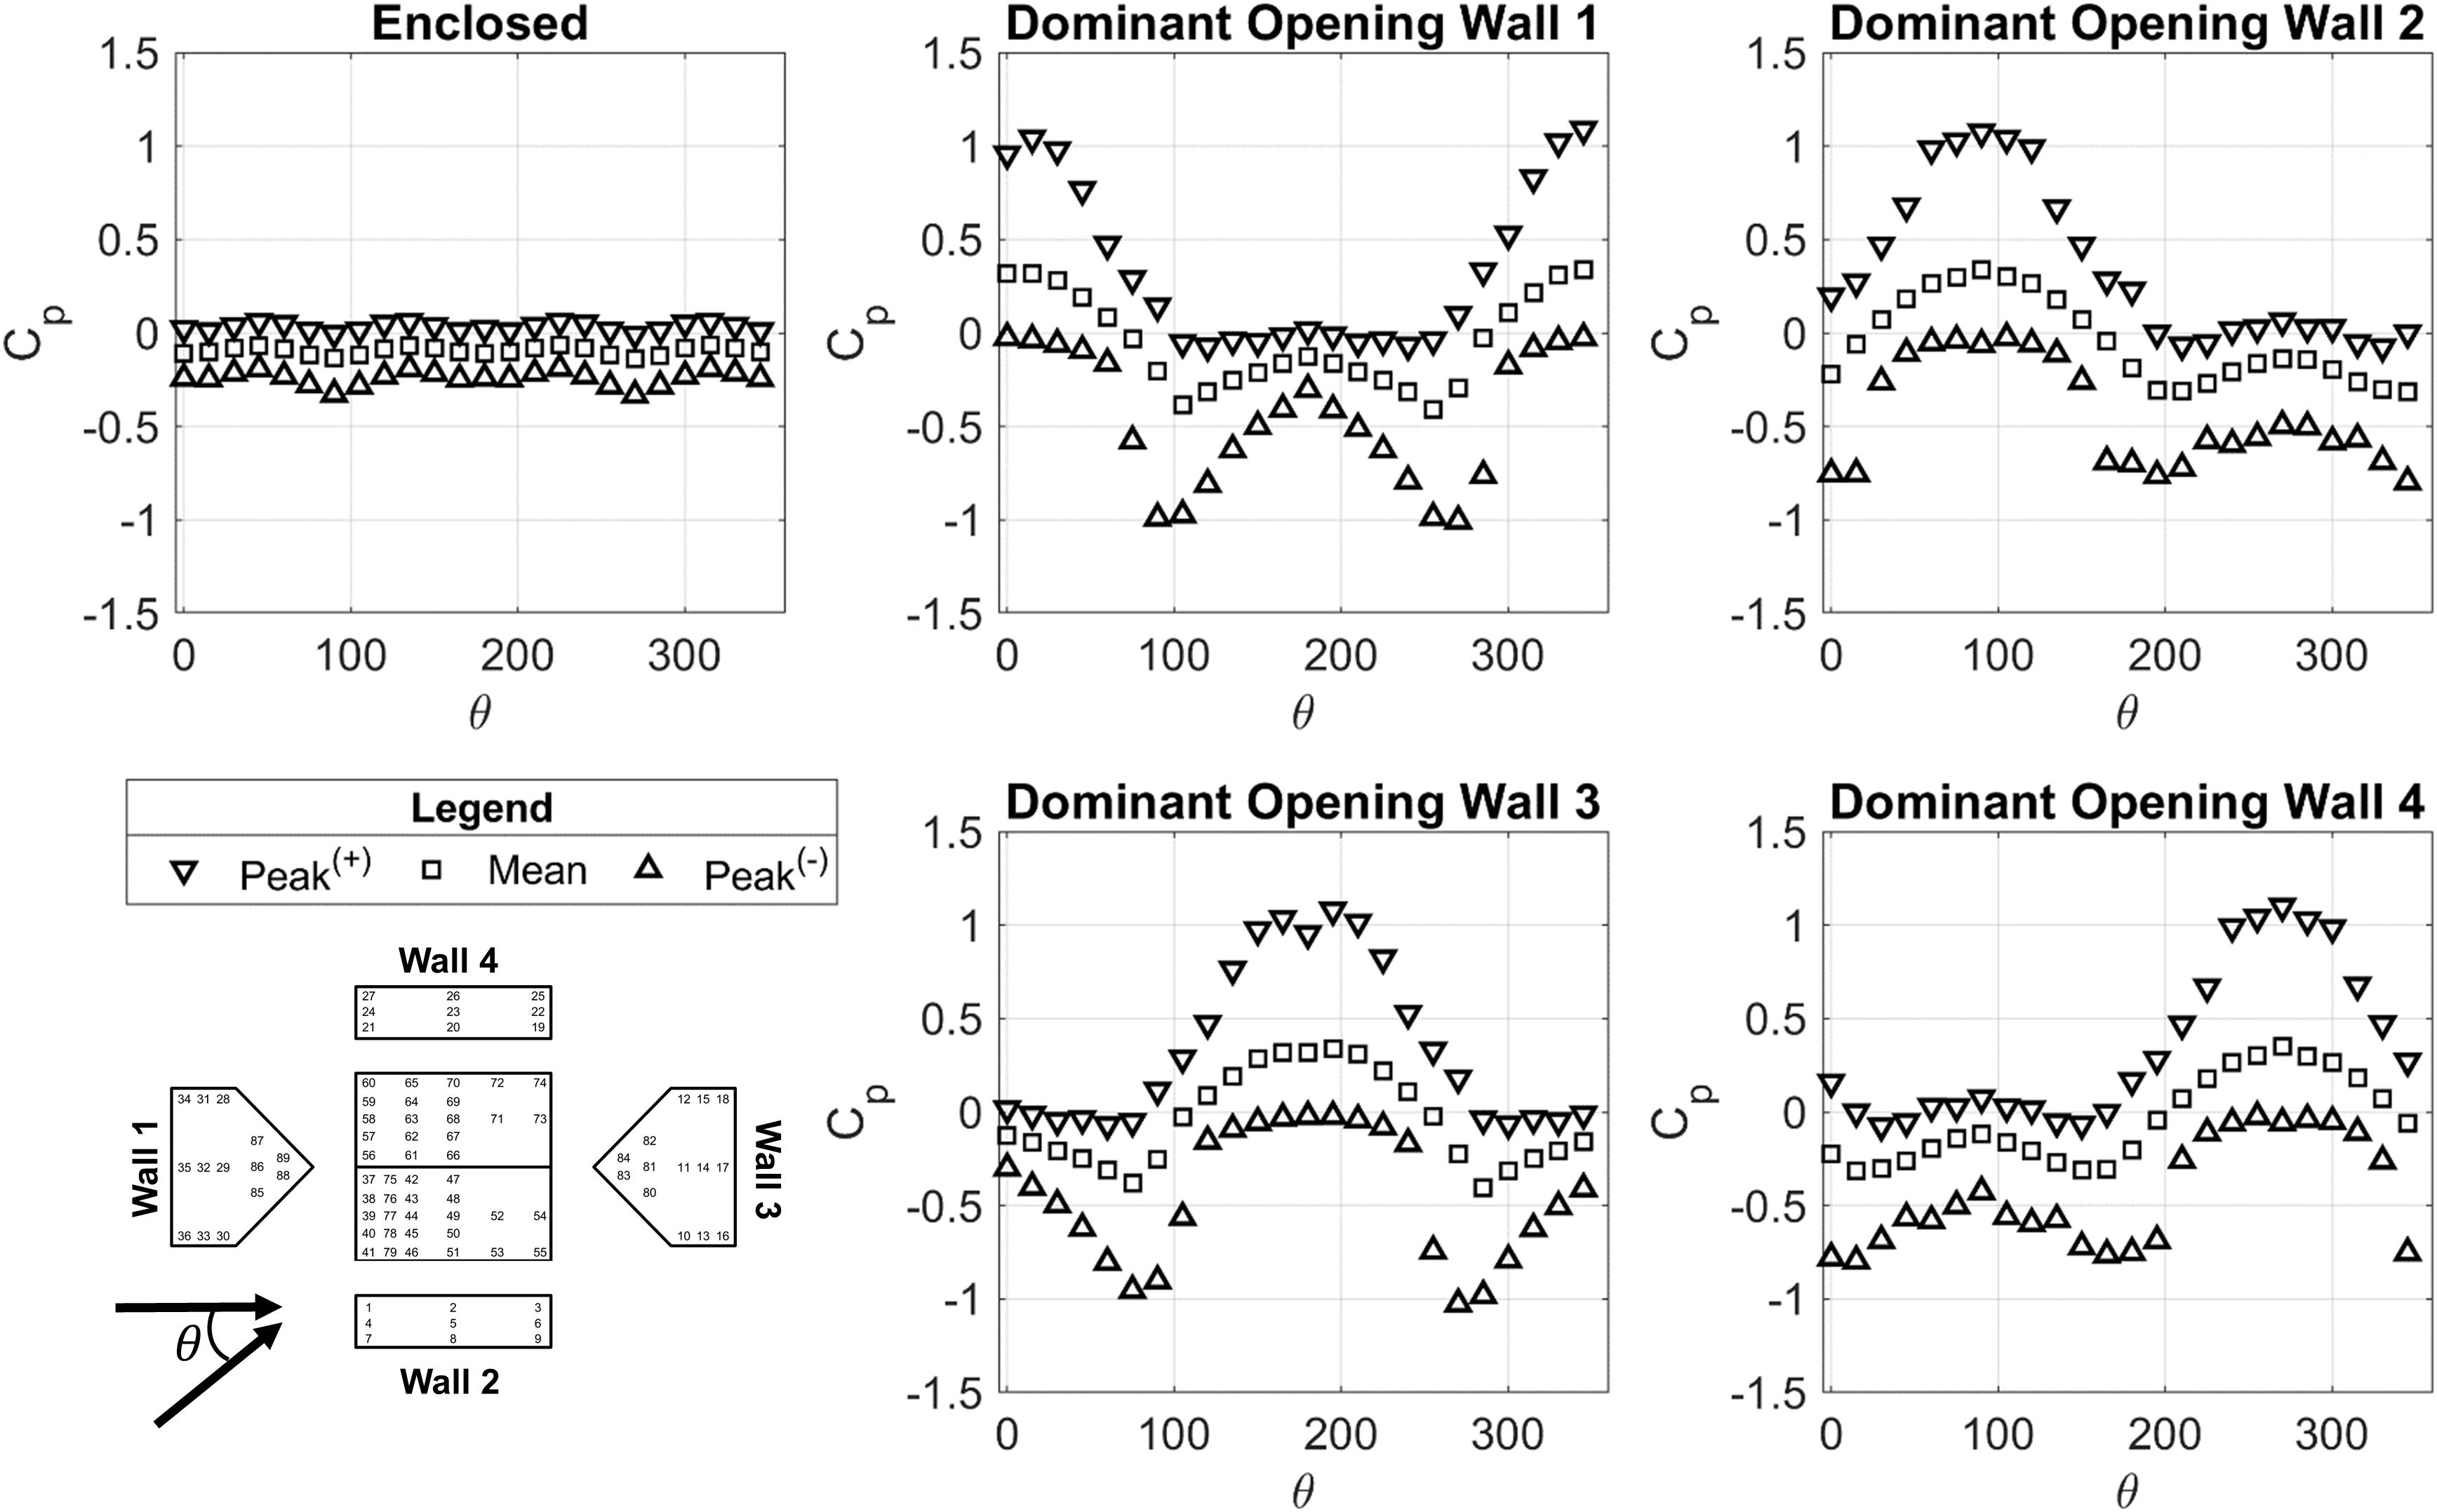
Figure 5. Peak and mean internal pressures under straight-line wind flow as a function of wind angle of attack, θ.
Internal pressure is markedly different under straight-line wind flow compared to tornado-like flow in a building with openings, primarily due to the presence of the APD, which induces negative internal pressures regardless of where the openings are located with respect to the path of the tornado (as discussed in Section “Internal Pressure Considering Tornado-Like Flow”). To make a comparison between tornado-induced and straight-line wind-induced internal pressure, it is necessary to evaluate the tornado-induced internal pressure relative to the static pressure. After subtracting out the static pressure, the peak positive internal pressure coefficient reaches approximately 1 when the tangential component of the tornado flow impinges on the wall with a dominant opening, which is similar to the peak positive internal pressure coefficients induced by straight-line winds when the angle of attack is aligned with a wall with a dominant opening. In contrast, the peak internal pressure coefficient under tornado-induced flow when the dominant opening is on an equivalent leeward wall is consistently about 50% less than that under straight-line flow, indicating a fundamental difference in the aerodynamics of the wake flow in tornado-structure interaction that needs further exploration.
Results
Two approaches are used to compare the tornado-induced wind loads and straight-line wind loads on a low-rise building with openings. Both approaches compare net pressures, which are defined as, Cpnet=Cpexternal−Cpinternal. The first attempts to compare an equivalent mean pressure distribution for specific wind angles of attack, and the second compares peak pressure distributions enveloped over all wind angles. Comparing non-stationary tornado-induced wind loads against stationary straight-line wind loads brings many challenges, and no standard methodologies or frameworks exist as yet for such comparisons. This study demonstrates one way to facilitate this comparison, with hopes that such studies are continued and standardized methods are developed to accommodate them.
Mean Pressure Distributions
Comparing mean pressure coefficients obtained from a translating vortex to stationary straight-line wind loads is problematic, but useful for understanding the similarities and differences in the pressure distributions. Here the mean of the translating vortex-induced pressures are obtained by averaging pressures between r−0.1Rmax and r + 0.1Rmax, where r is some position along the axis of the vortex translation measured from the center of the building model. For straight-line winds, the mean is taken as the time average for the entire time series of pressure coefficients.
Figure 6 presents the mean net pressure distributions for sealed and enclosed buildings for θ = 45° and r = −1 (i.e., for the tornado approaching from the top left corner of the building model and positioned one radius away from the building). These results illustrate the effect of the APD. With a sealed building, the pressures are more negative by a magnitude of approximately 1.0. With an enclosed building, and sufficient distributed leakage to equilibrate the APD, positive pressure is experienced on what is the equivalent windward wall (Wall 2) given the vector sum of the radial and tangential components of the tornado.
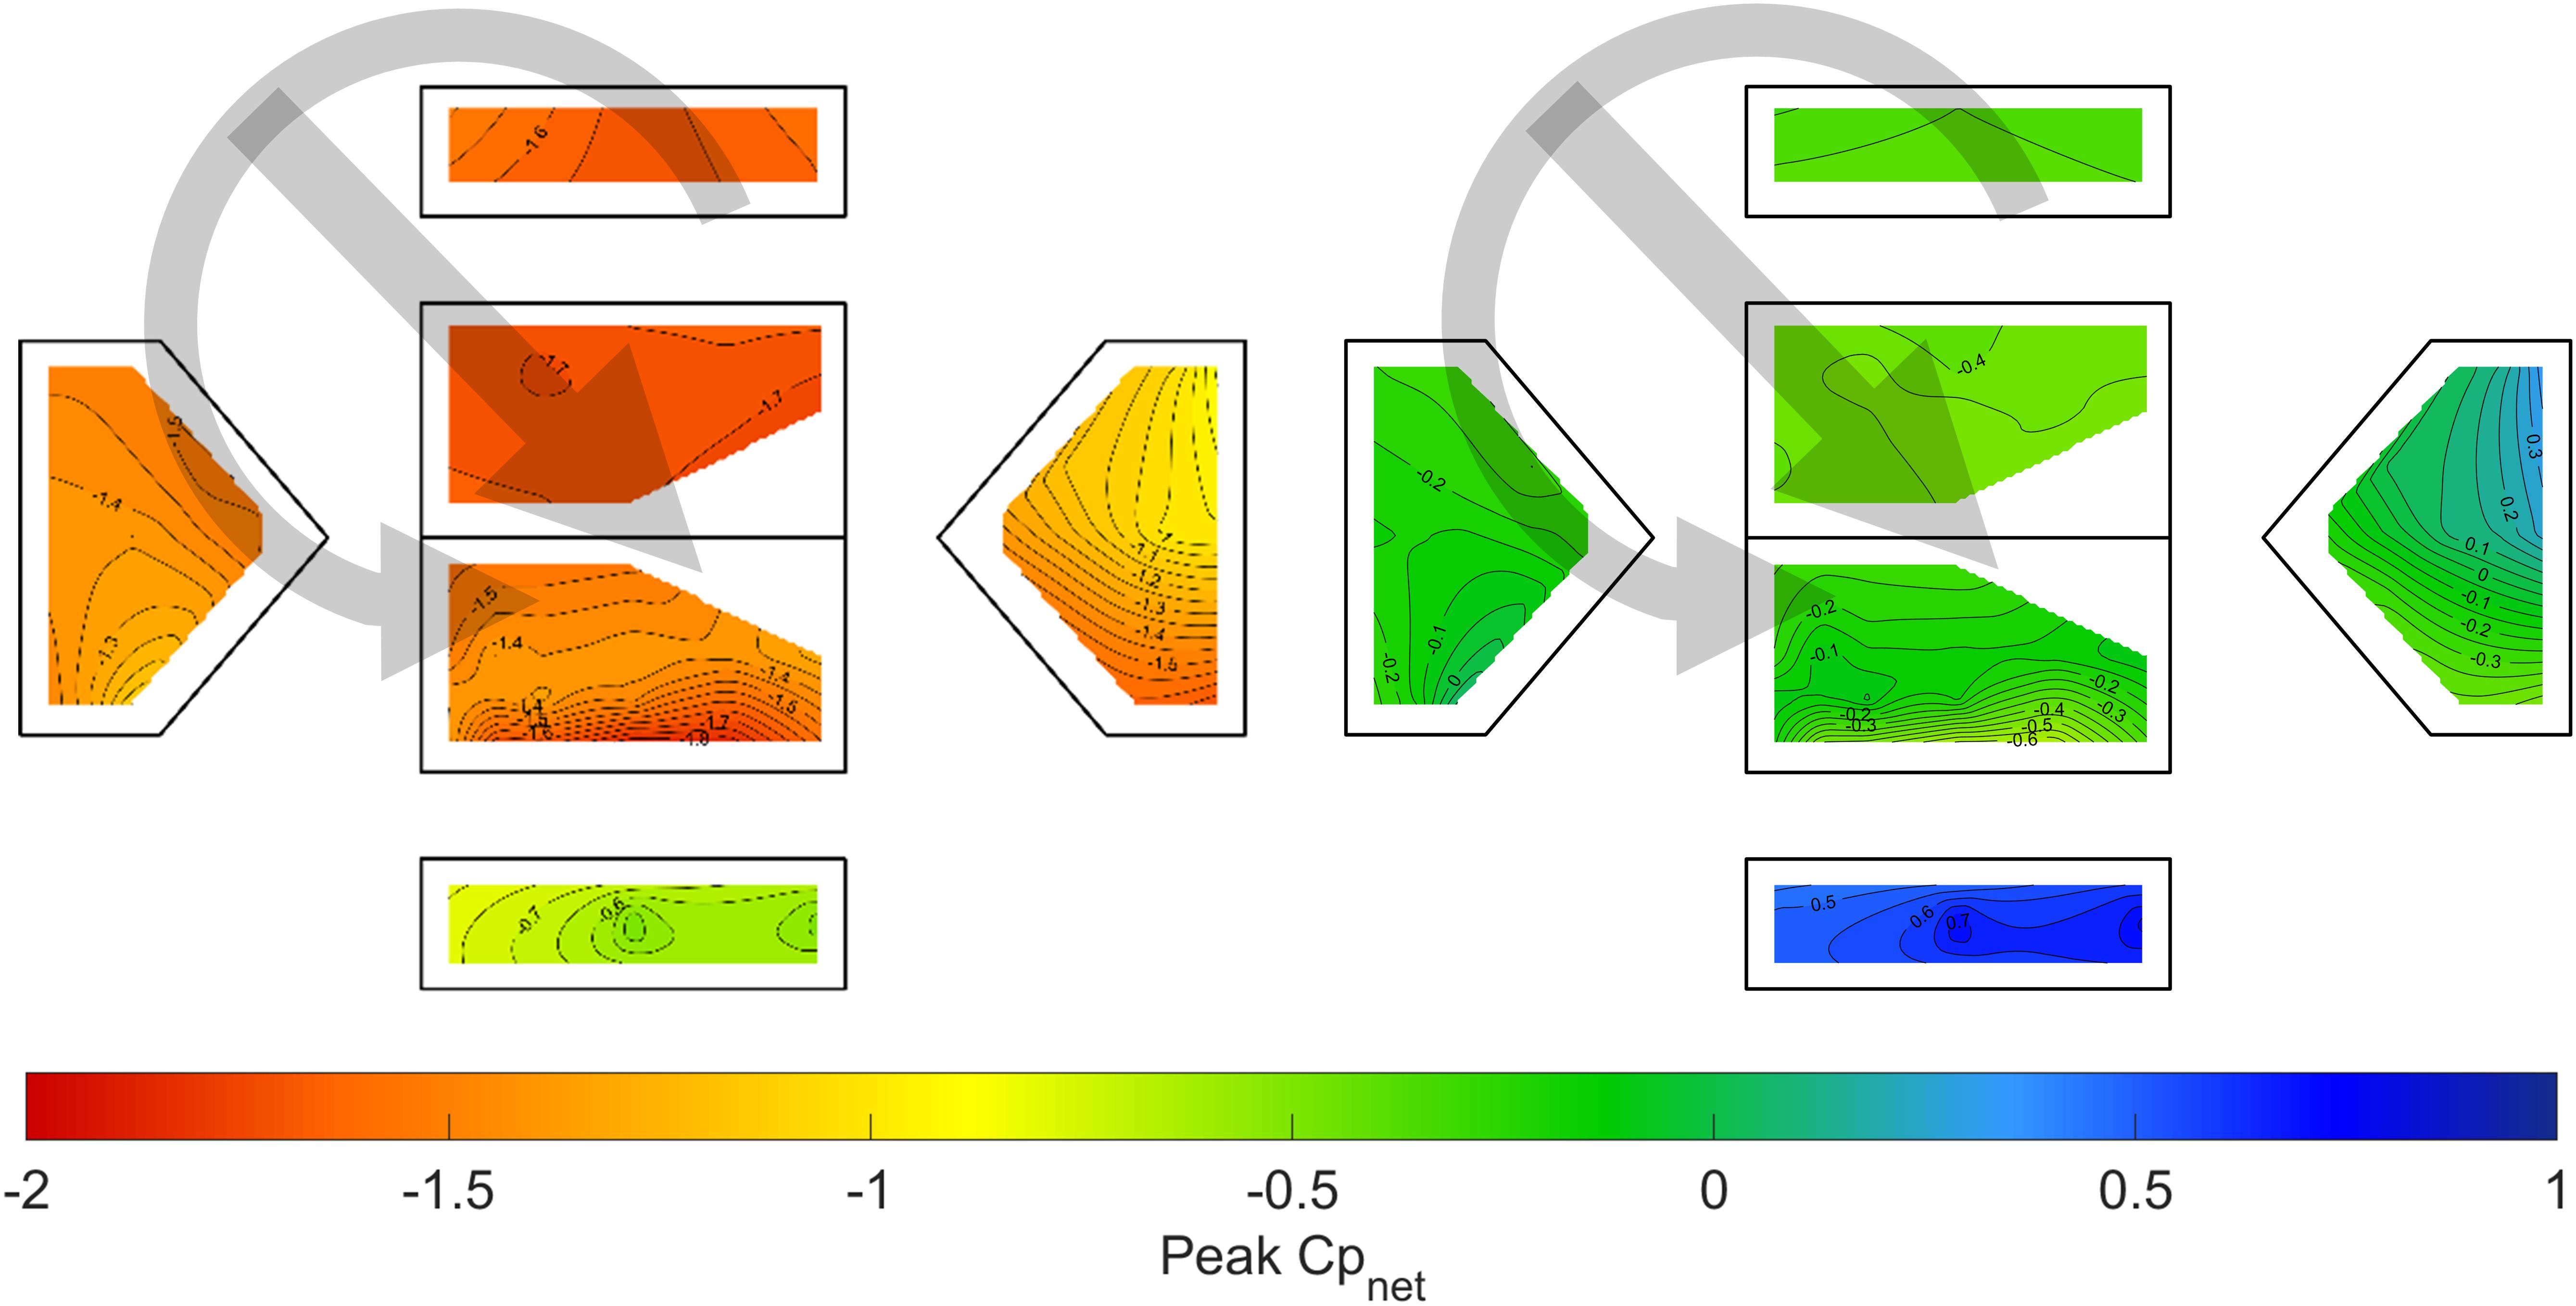
Figure 6. Time-averaged net pressure coefficients with the low swirl ratio vortex (Vane 15) and with θ = 45° for (left) a sealed building, and (right) an enclosed building with distributed leakage.
For comparison against straight-line wind loads, Figure 7 compares the mean pressure coefficients under tornado-induced loading, with r = −1, to those obtained under straight-line wind flow with an angle of attack that approximates the vector sum of the radial and tangential components from the tornado-induced flow. Pressure coefficients are shown for the enclosed case. The comparison demonstrates some similarities between the tornado-like vortex and the straight-line wind pressure distributions, as well as some noticeable differences. For both the low and high swirl vortices, located at r = −1 and with θ = 90°, the resulting pressure distributions are most equivalent to approximately θ = 15°–30°, but the straight-line wind pressure distributions never have the phenomenon of positive pressures acting on two wall surfaces simultaneously, as occurs noticeably so in the low swirl ratio vortex, and to a lesser extent in the high swirl ratio vortex. This phenomenon would fundamentally alter the flow separation and resulting pressures at the roof level, which is illustrated in the windward corner (i.e., corner between Walls 1 and 2) where the tornado-induced wind pressures are higher in magnitude and display stronger pressure gradients than occurs in the straight-line wind pressures. The leeward pressures are more similar in both magnitude and distribution for the tornado-induced and straight-line winds. The results suggest that even if the pressure magnitudes under tornado-induced loading are reasonably similar to straight-line wind loads, the distribution of the pressures are likely different and may result in load cases (i.e., positive pressures acting simultaneously on two walls) that are not typically considered under straight-line wind loads. This particular effect would likely be most pronounced as the size of the building increases relative to the size of the tornado.
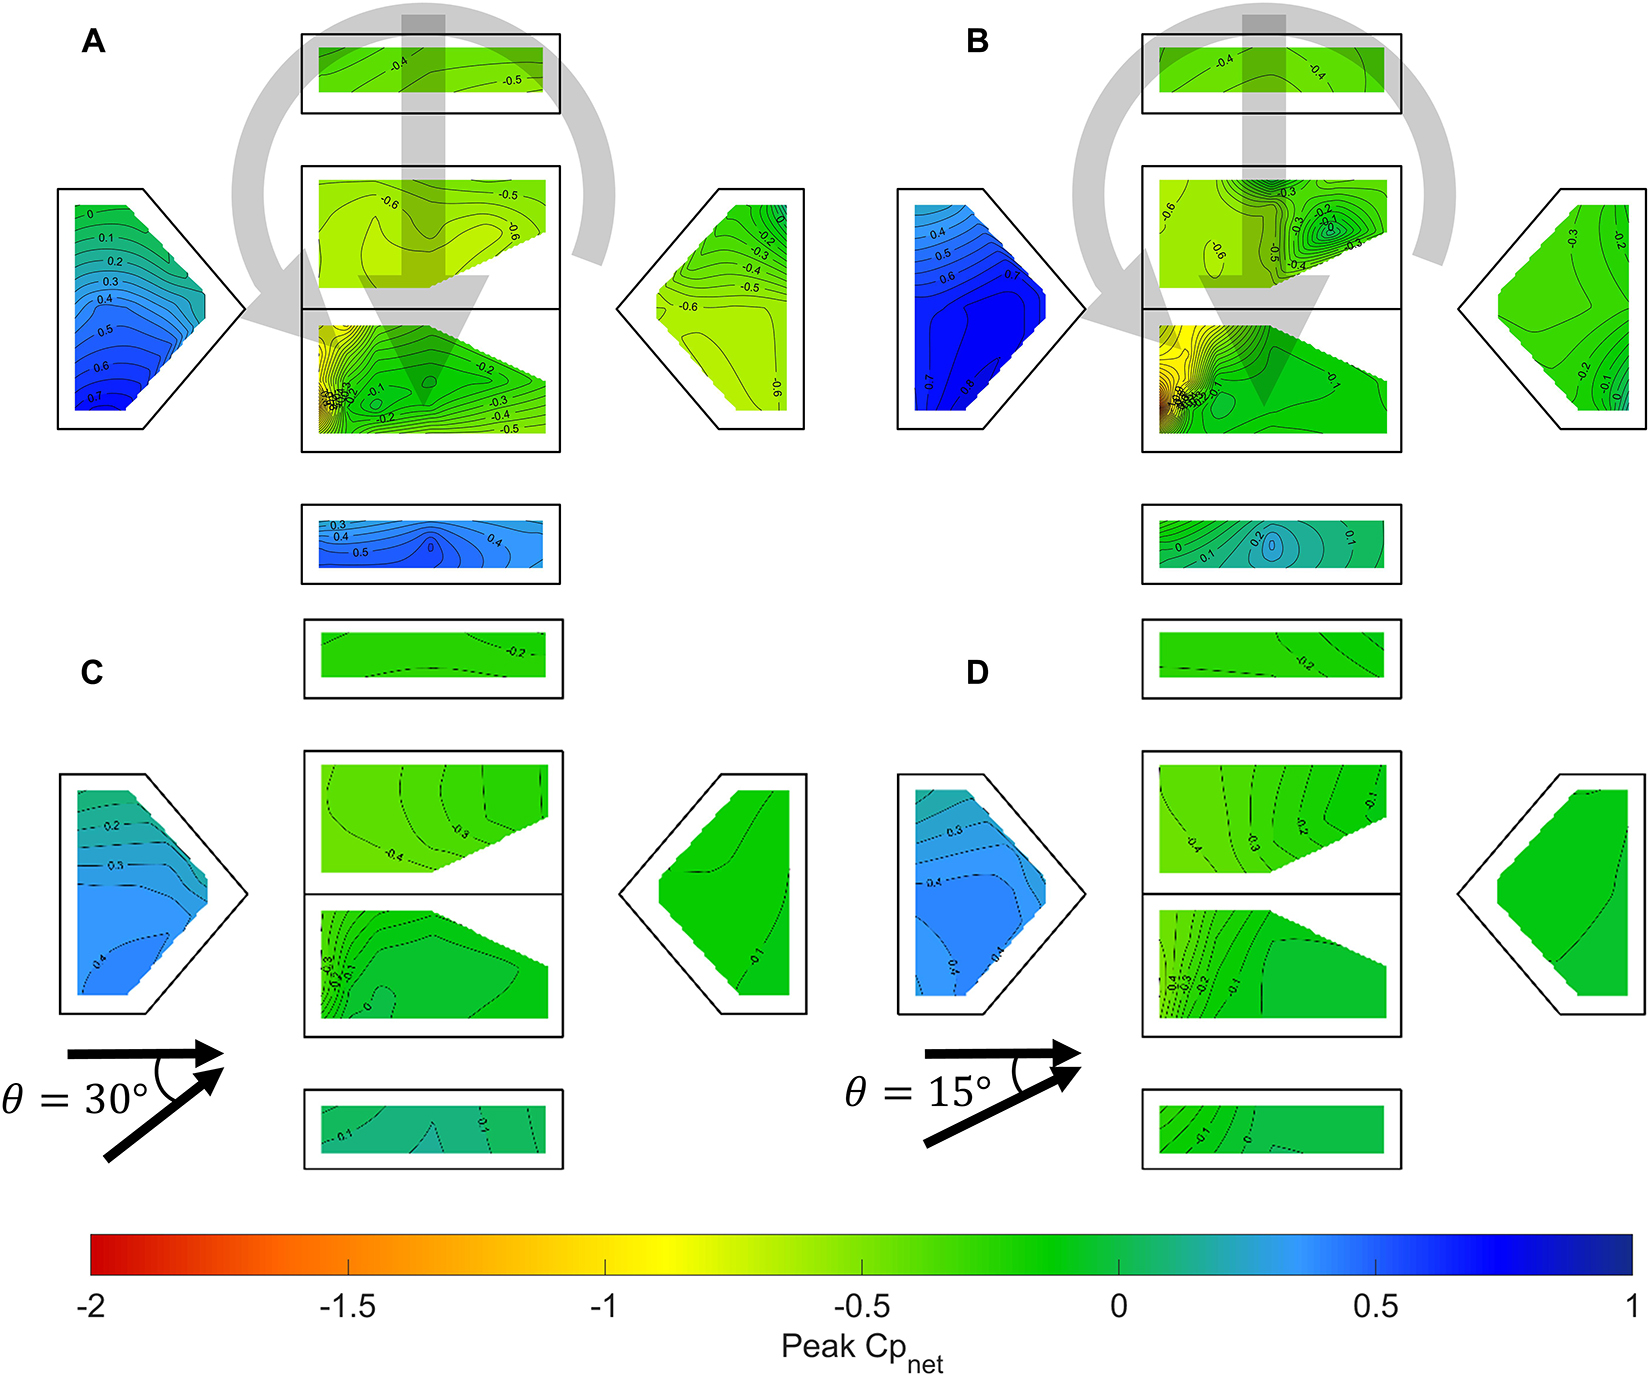
Figure 7. Time-averaged net pressure coefficients on an enclosed building for (A) low swirl ratio vortex (Vane 15) with θ = 90°, (B) high swirl ratio vortex (Vane 55) with θ = 90°, (C) straight-line winds with θ = 30°, and (D) straight-line winds with θ = 15°.
Figure 8 shows the same scenario as in Figure 7, except for a building with a dominant opening on Wall 1. With the dominant opening, net pressures on all surfaces increase by the magnitude of the mean internal pressure, resulting in very little net load on the windward wall (Wall 1, and for the low swirl ratio vortex, Wall 1 and Wall 2) and more negative net pressures elsewhere.
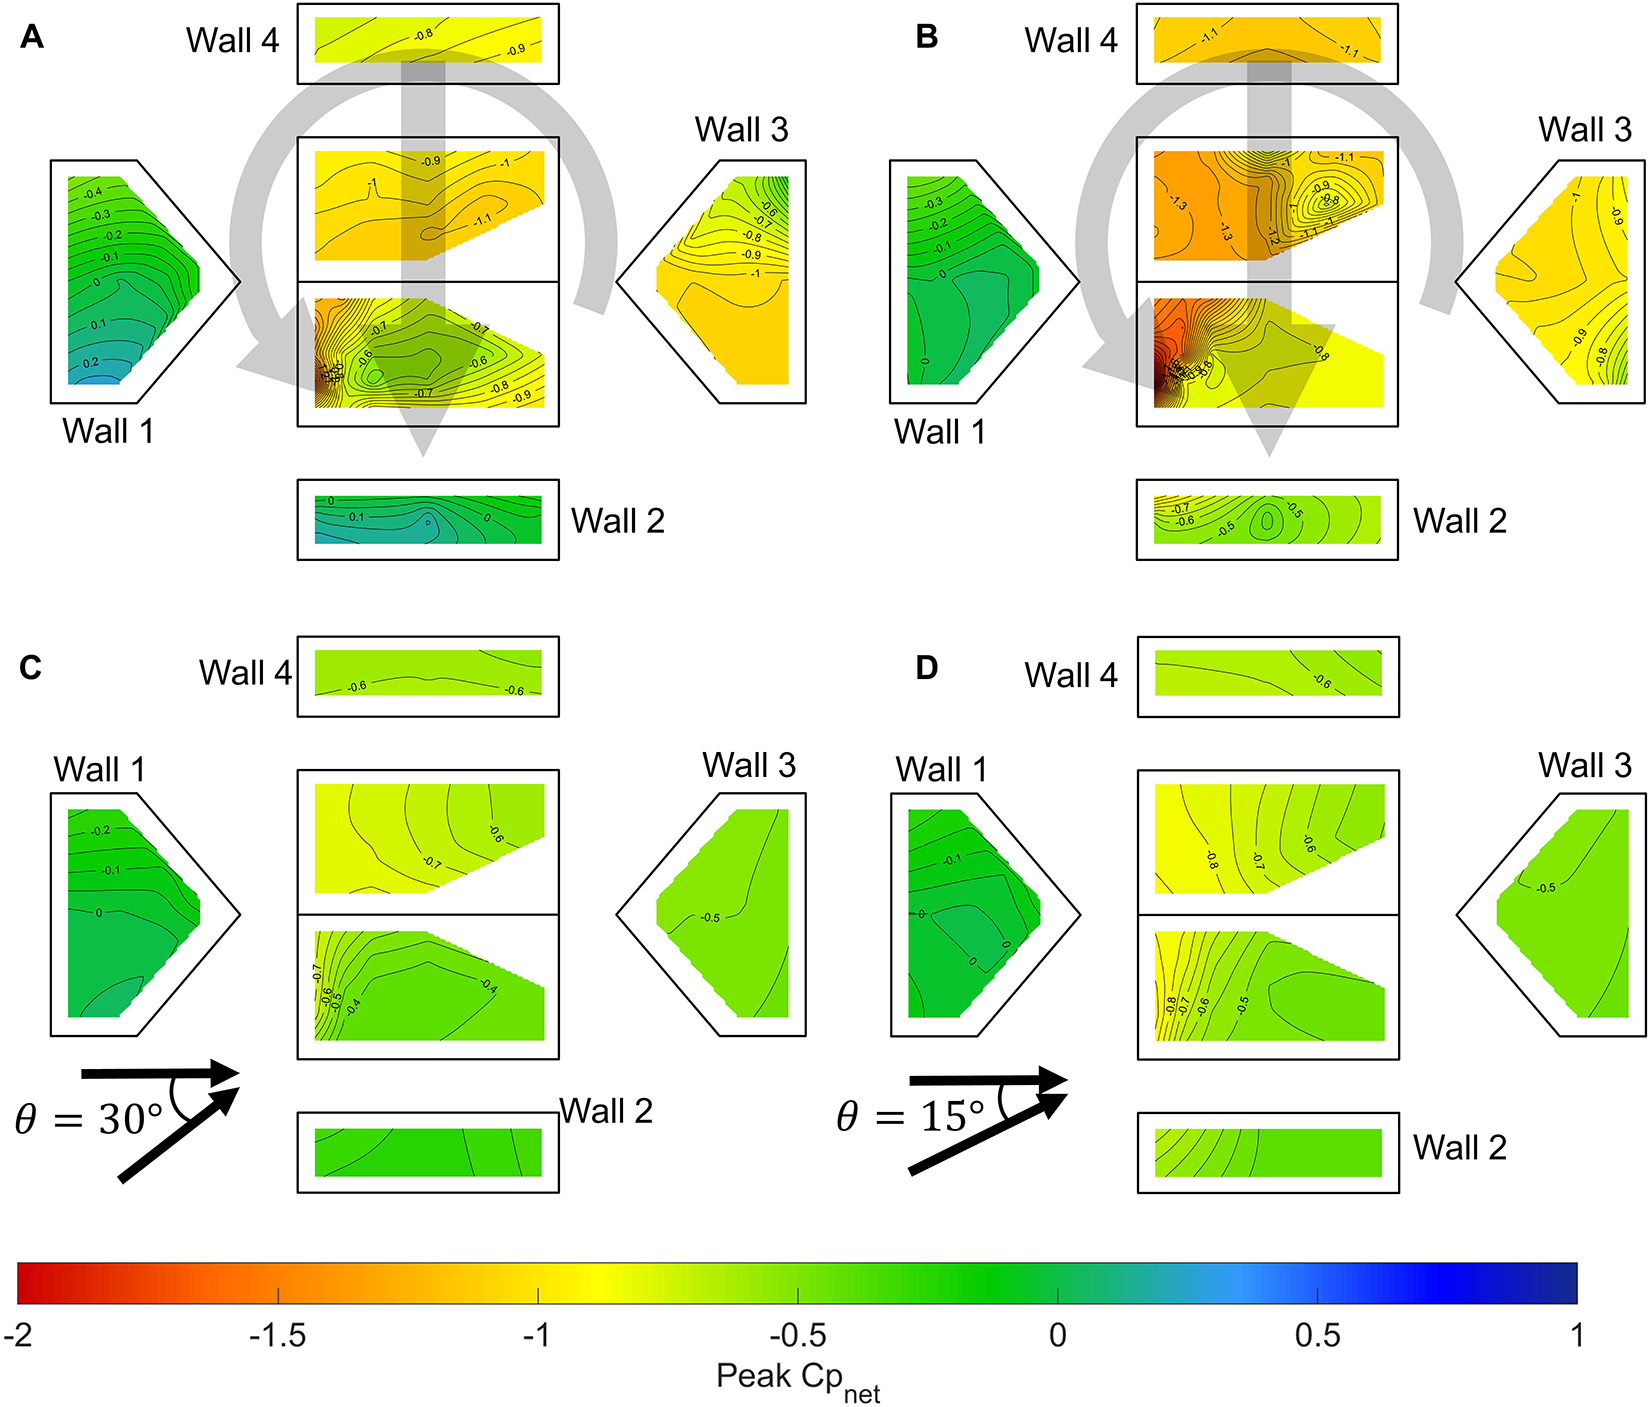
Figure 8. Time-averaged net pressure coefficients on a building with a dominant opening on Wall 1 for (A) low swirl ratio vortex (Vane 15) with θ = 90°, (B) high swirl ratio vortex (Vane 55) with θ = 90°, (C) straight-line winds with θ = 30°, and (D) straight-line winds with θ = 15°.
Enveloped Peak Pressures
Enveloping the tornado-induced wind pressures over all wind angles and the entire translation path, utilizing the extreme value approach described in Section “Compatibility Between Tornado-Induced and Straight-Line Wind-Induced Pressures,” provides a statistical measure of the maximum and minimum tornado-induced wind pressures at each tap, which are represented in Figure 9 for the enclosed opening case and the case of a dominant opening on Wall 1. Additional opening cases are provided in the Supplementary Files for this article. For comparison, the peak straight-line wind pressures, enveloped over all wind angles from 0° to 345° in 15° increments, are also shown. For each case, the plots show the net pressure coefficient, defined as Cpnet=Cpexternal−Cpinternal. The plots demonstrate some overall consistency between the straight-line and tornado-induced pressures in all opening conditions, albeit with a few significant differences. The most noticeable is the higher magnitude peak negative pressures that occur in corner roof taps under tornado-induced loading compared to straight-line wind loading. The four roof corner taps are 41, 55, 60 and 74, but the differences are most pronounced in taps 41 and 74, where the tornado-induced pressures as much as double the straight-line wind pressures. Outside of the corner taps, the magnitudes are more similar, with the high swirl ratio vortex generally producing the highest magnitude negative roof pressures, while the low swirl ratio vortex produces peak negative roof pressures that are generally similar in magnitude to the straight-line wind pressures, and for certain tap locations and opening conditions are actually lower in magnitude. Peak positive roof pressures are of similar magnitude for all cases and opening conditions, with no consistent trends. Peak enveloped wall pressures also demonstrate reasonable consistency under both vortex flow and straight-line winds. The high and low swirl ratio vortices tend to produce higher magnitude negative wall pressures, particularly at the corners under separated flow regimes.
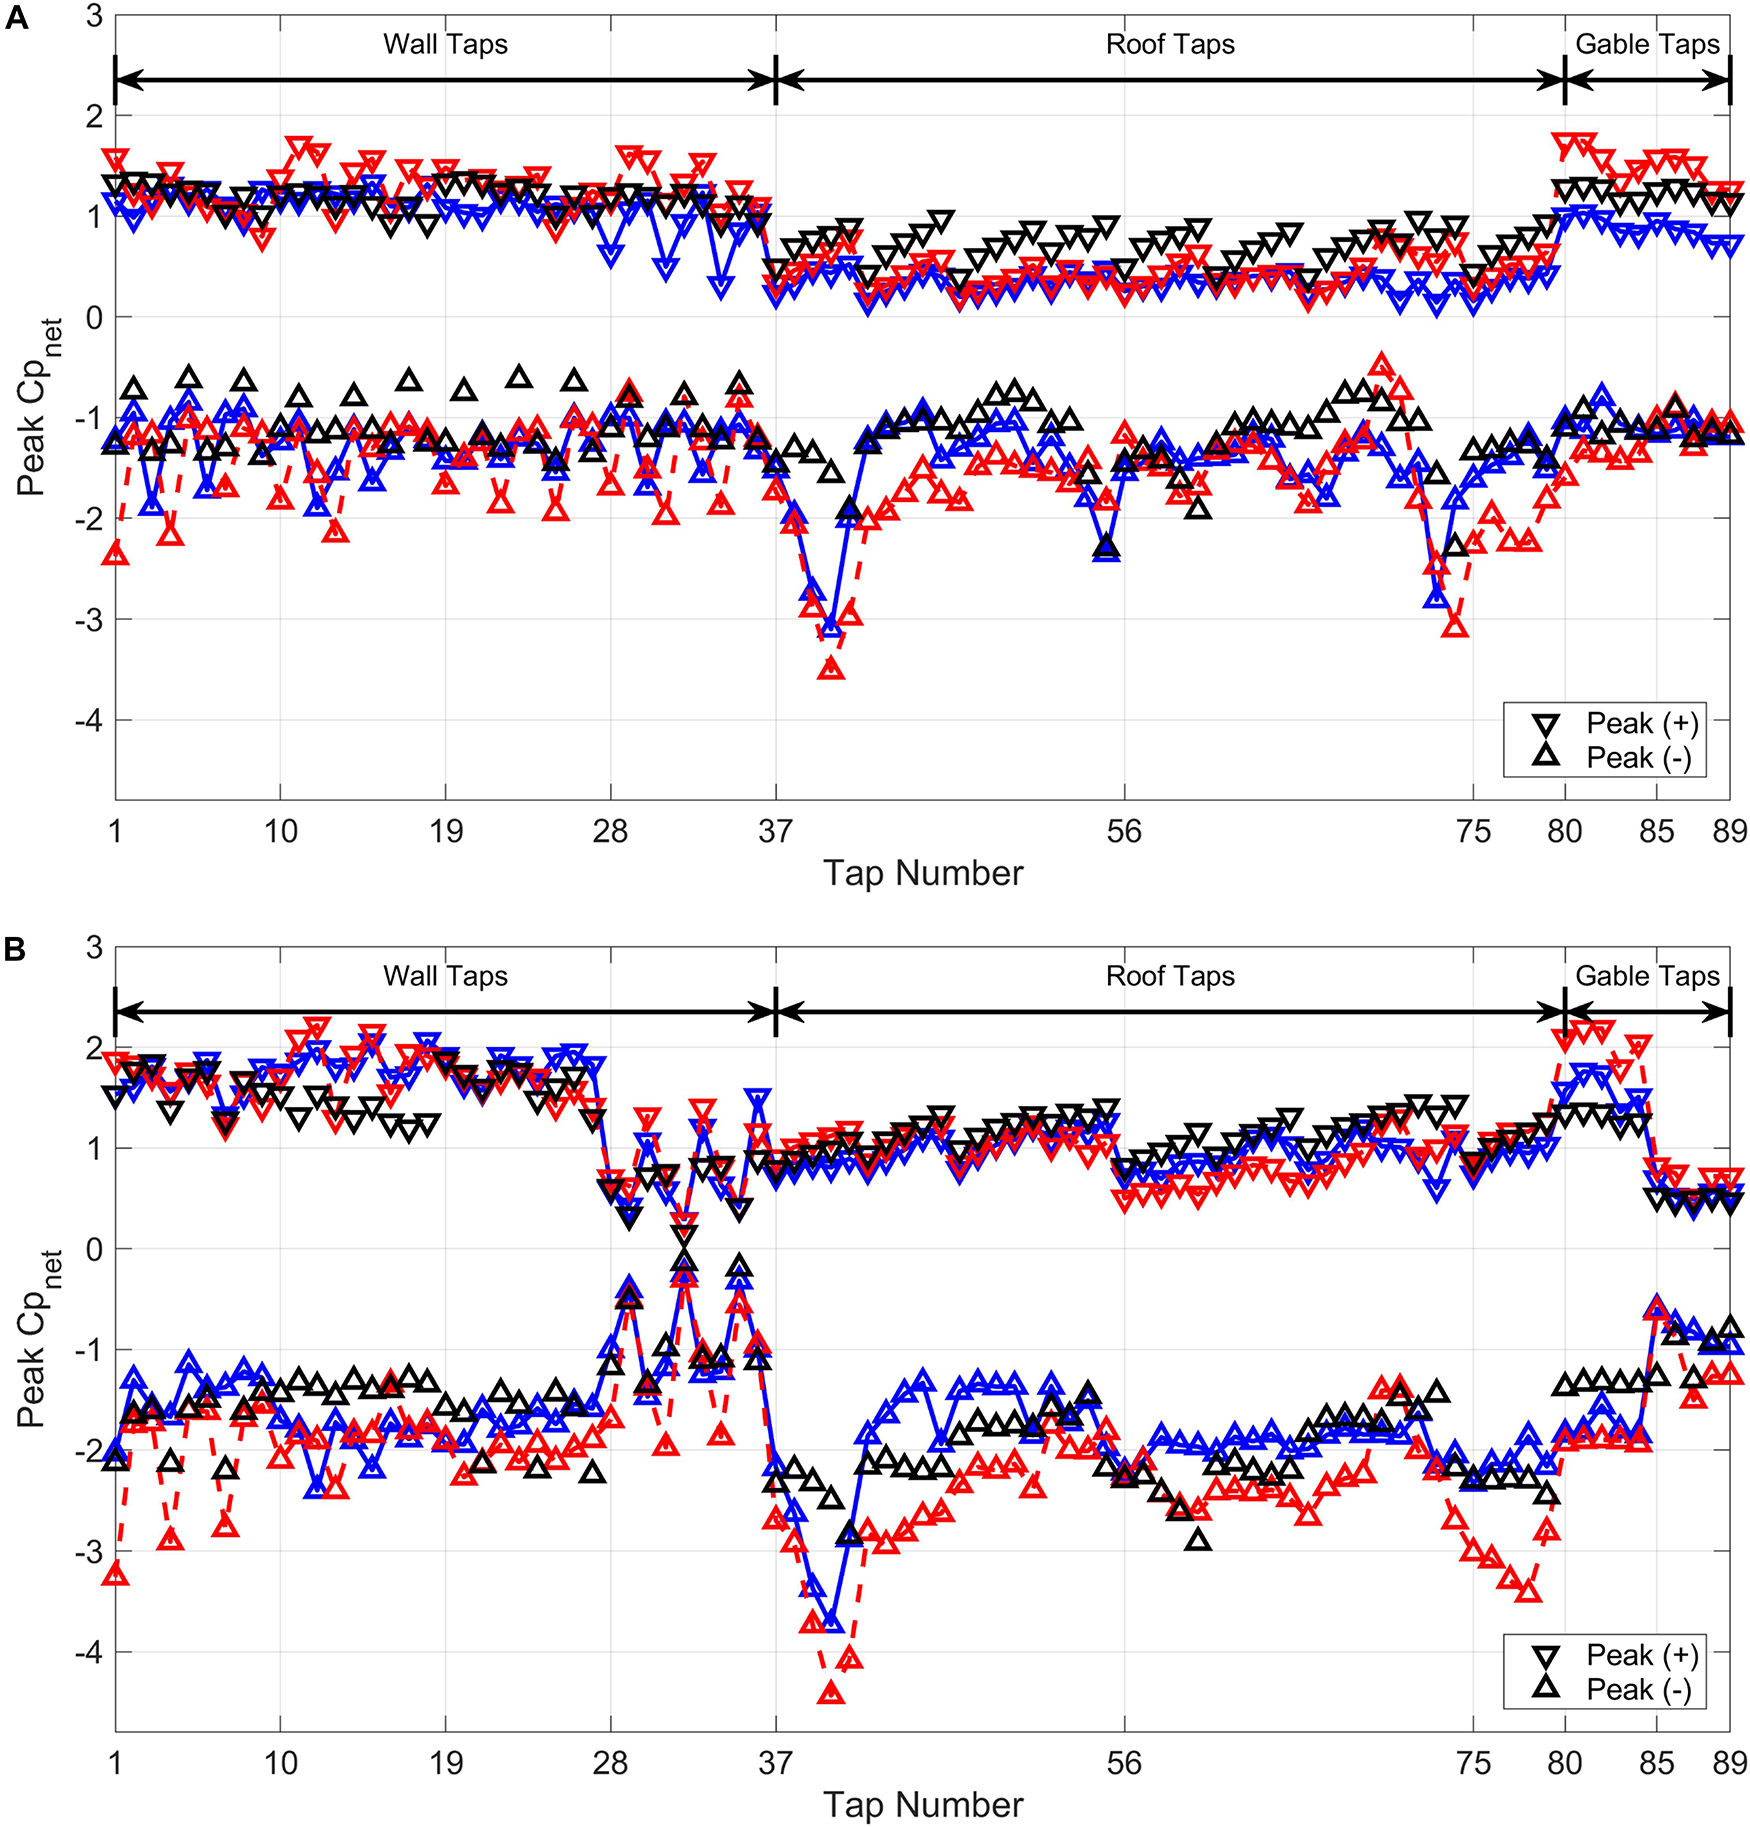
Figure 9. Peak positive and negative enveloped Cpnet at each tap for the low swirl ratio vortex (blue), high swirl ratio vortex (red) and straight-line winds (black) with (A) an enclosed building (opening ratio of 0.2%), and (B) a dominant opening on Wall 1.
A more quantitative perspective of the similarities and differences between the vortex-induced and straight-line wind induced pressures is provided in Figures 10, 11, which plot the magnitudes of the peak, enveloped vortex-induced pressures directly against the straight-line wind pressures for each tap for sealed, enclosed and dominant opening conditions. Plots for additional opening conditions are provided in the Supplementary Material for this article. A linear fit is provided to quantify the overall relationship between the pressures produced by the different flow regimes. The effect of the static pressure drop within the vortex is clearly illustrated in Figure 10 as a negative offset of the y-intercept with a magnitude of approximately one, which is nominally the value of the static pressure at a distance of in cyclostrophic flow (Simiu and Scanlan, 1996). Once openings in the building envelope are simulated and the resulting internal pressure is modeled, the y-intercept largely disappears, suggesting the static pressure deficit does not make a significant contribution to vortex-induced wind loads for buildings with sufficient leakage or large openings. The slopes indicate the magnitude of the vortex-induced peak enveloped pressure coefficients relative to the straight-line wind peaks. For the enclosed and dominant opening cases, the slopes range between 0.97 and 1.23 with an average of 1.13, indicating that peak enveloped pressure coefficients under vortex flow are on average 13% higher in magnitude than equivalent straight-line wind pressures. Localized pressures can exhibit more significant variability, but overall the data demonstrate some agreement between vortex and straight-line wind induced pressures for buildings with typical opening configurations.
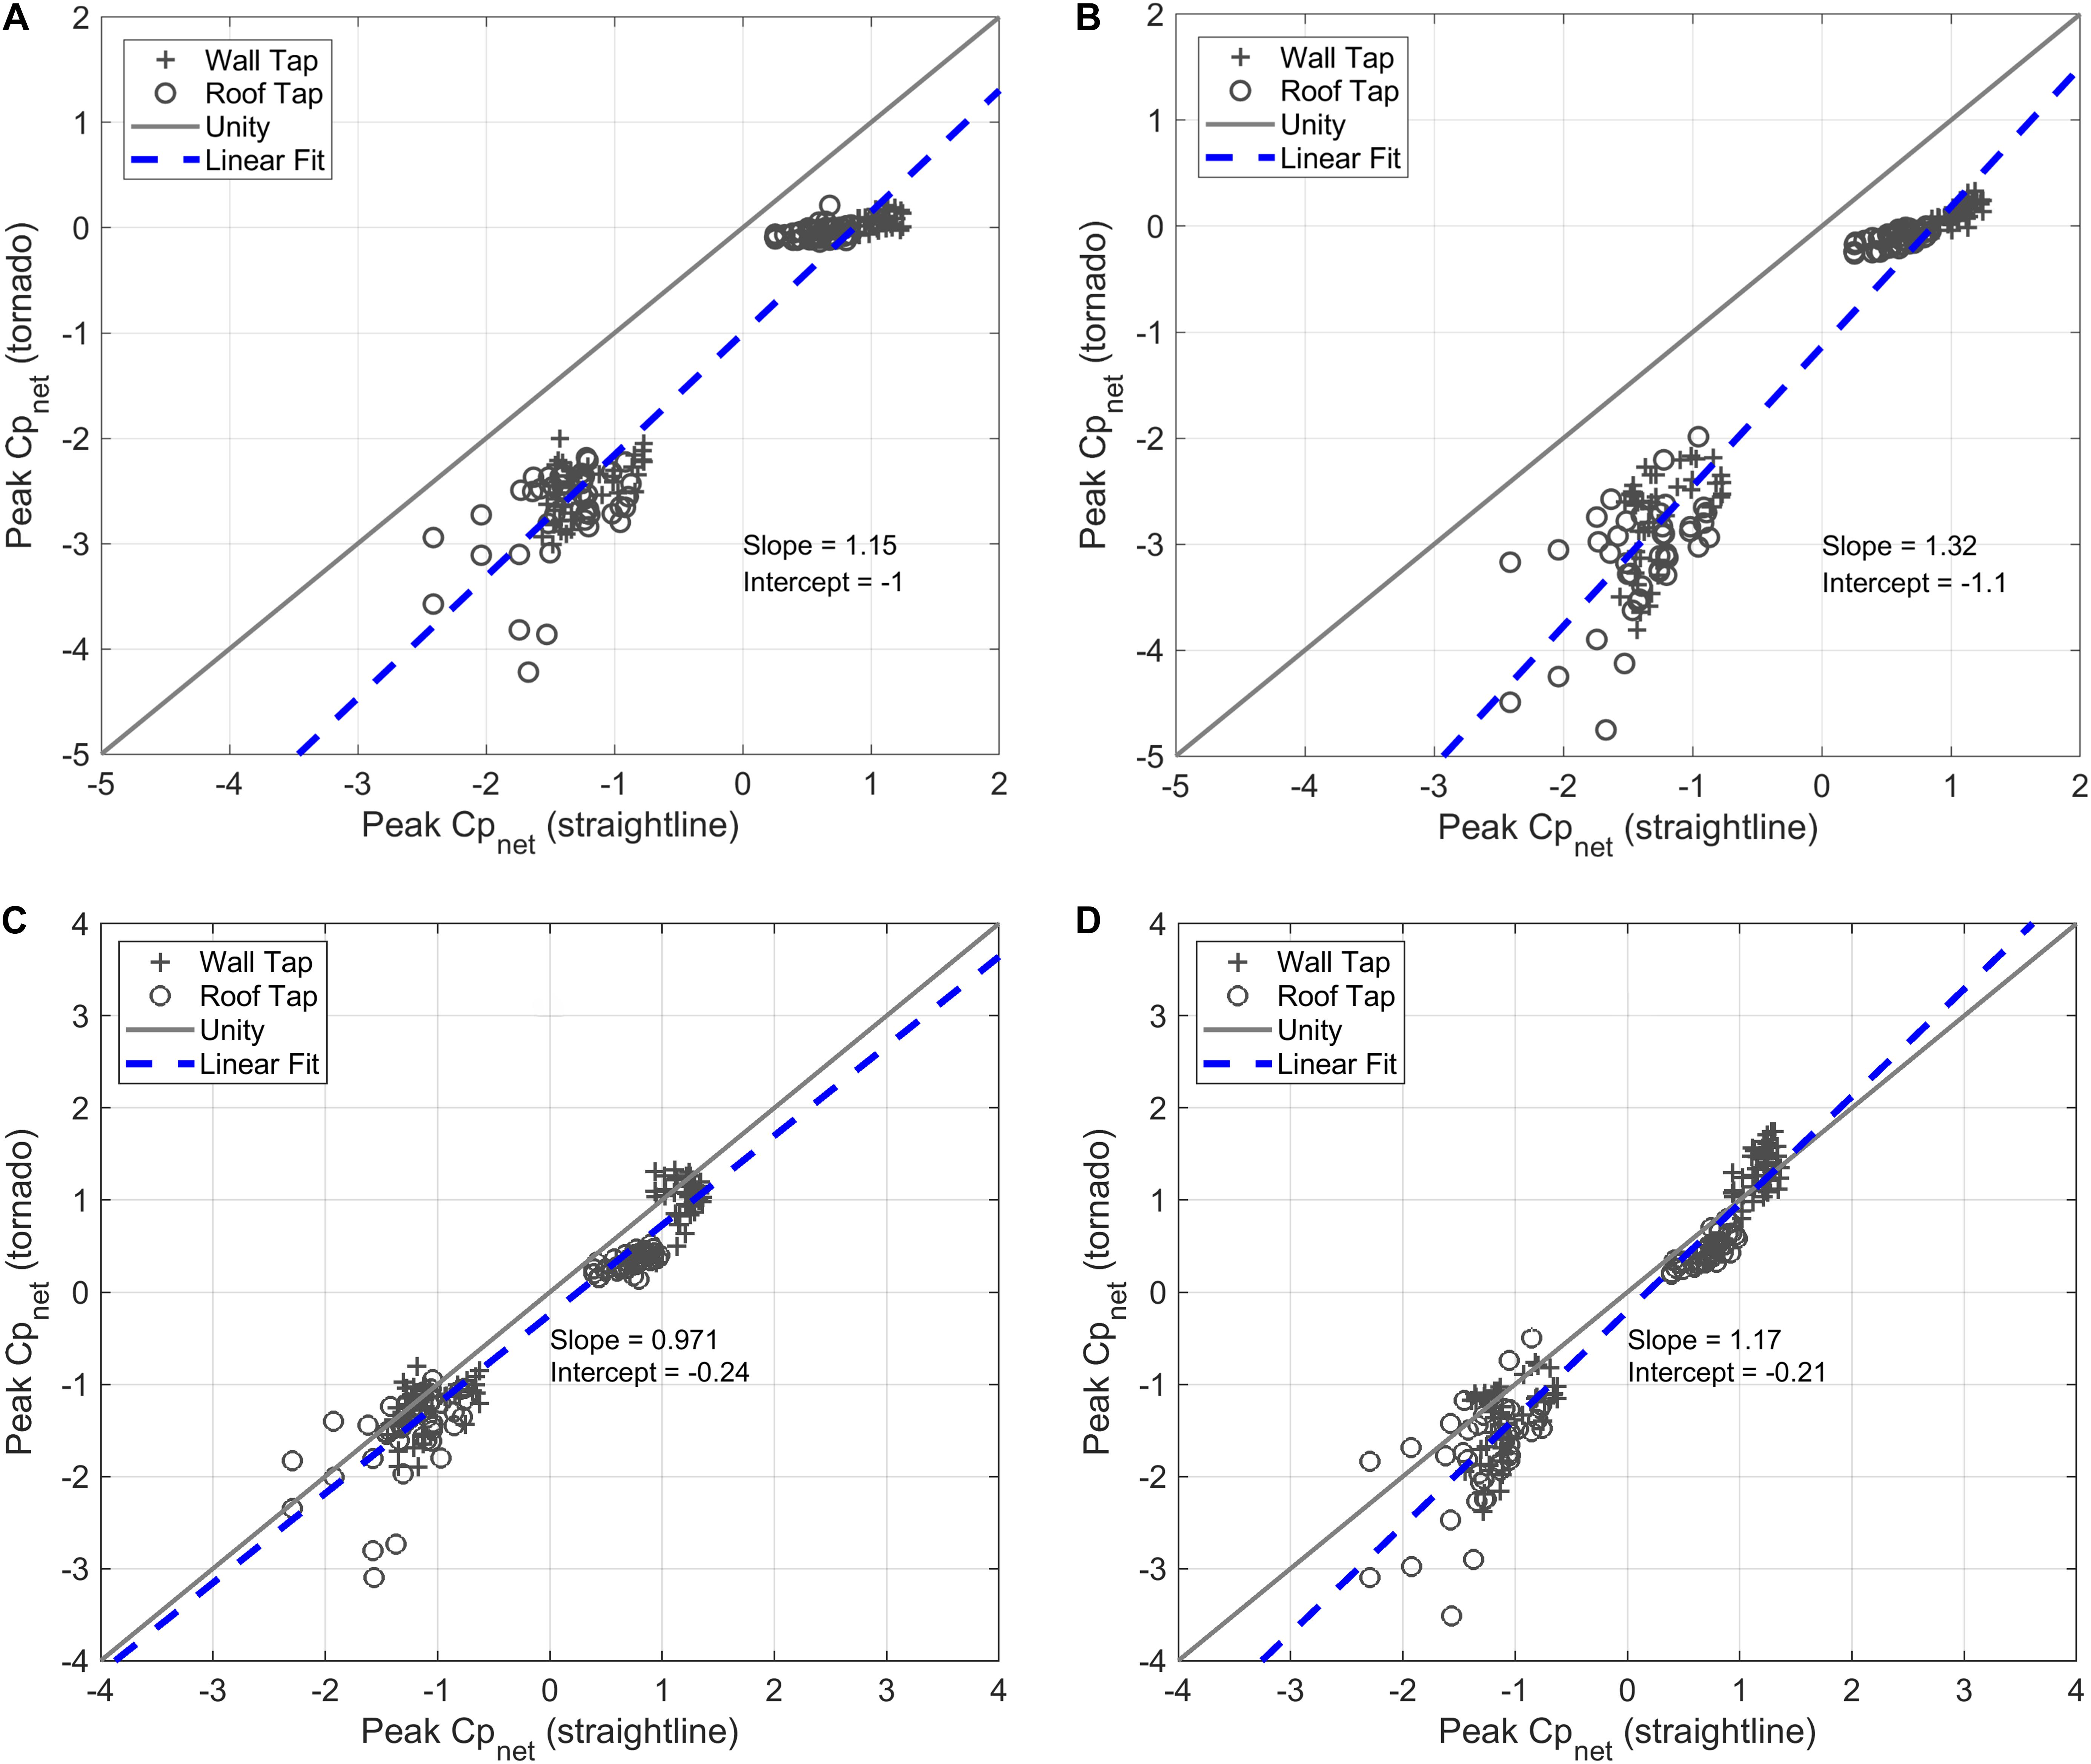
Figure 10. Comparison of peak positive and negative enveloped pressure coefficients for all vortex and straight-line wind flows and all incidence angles with (A) low swirl ratio vortex and perfectly sealed building, (B) high swirl ratio vortex and perfectly sealed building, (C) low swirl ratio vortex and enclosed building (0.2% opening ratio), and (D) high swirl ratio vortex and enclosed building (0.2% opening ratio).
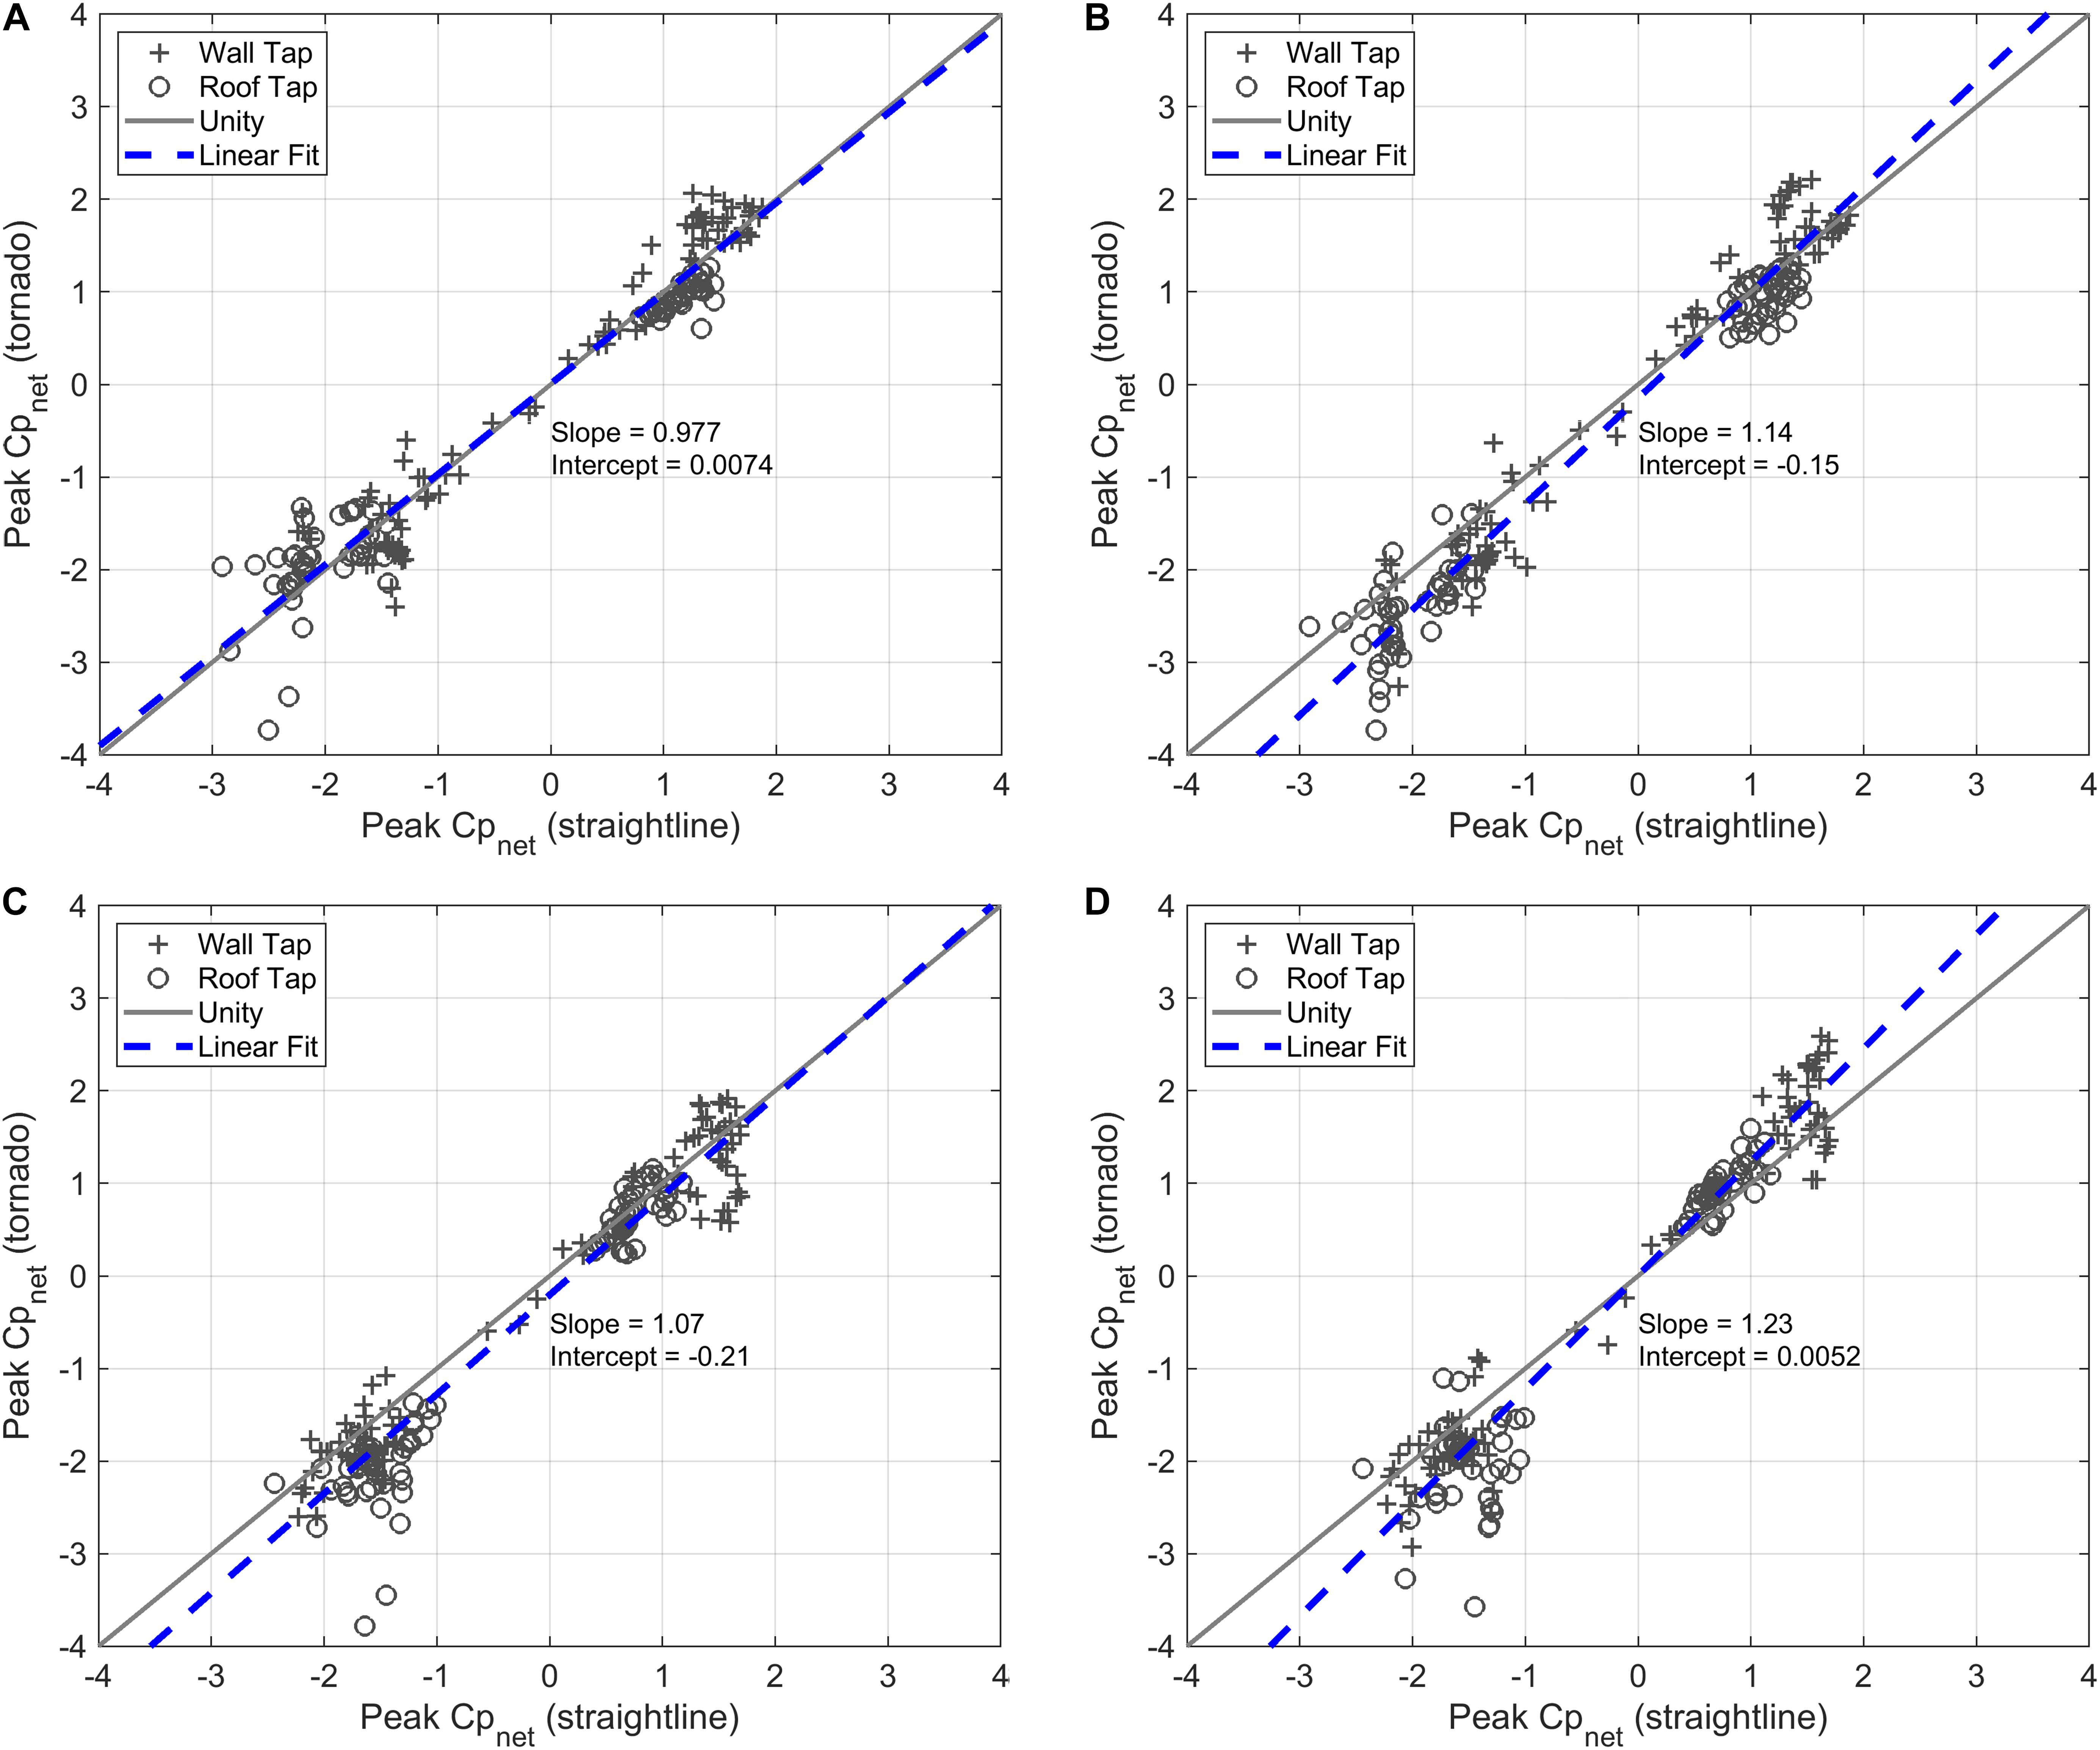
Figure 11. Comparison of peak positive and negative enveloped pressure coefficients for vortex and straight-line wind flows with (A) low swirl ratio vortex and dominant opening on Wall 1, (B) high swirl ratio vortex and dominant opening on Wall 1, (C) low swirl ratio vortex and dominant opening on Wall 2, (D) high swirl ratio vortex and dominant opening on Wall 2.
The findings presented here are necessarily conditioned upon the data from which they were derived, and caution should be employed before extrapolating the results too broadly. For example, the data presented in this study only considered a vortex passing directly over the building model, which as Razavi and Sarkar (2018) demonstrated, may underestimate the maximum vortex-induced wind loads. The data also represents a single translation speed and building geometry, and more work is needed to extend the analysis to explore the effects of these different parameters. This study does provide a framework, however, for more expansive research to follow, and a demonstration of the challenges entailed in a direct comparison of tornado-induced and straight-line wind pressures.
The analysis also demonstrates the need for improved methods for referencing aerodynamic coefficients in non-stationary flows. The traditional approach with tornado-like flows has been to reference pressures to the maximum gust wind speed within the spatial, near-surface domain of the vortex, which is reasonable when comparing against other tornado events. However, this approach becomes particularly problematic when comparing against stationary flows because it conflates potential differences in both the flow characteristics, static pressure changes, and aerodynamics between stationary and non-stationary flows. This adds an additional challenge to interpreting results from such comparisons, particularly when trying to attribute differences in aerodynamic coefficients to specific factors (e.g., vertical angle of attack, spectral content). Kopp and Wu (2017) recommend simultaneous measurement of both flow and aerodynamic pressure, and conditionally referencing surface pressures on both velocity pressure and wind angle of attack, which provides a promising solution, but requires a new approach to conducting the laboratory experiments that is not available for the data used in this study.
Conclusion and Discussion
External pressures on a gable roof building model obtained from the translating tornado simulator at Iowa State University, published in Haan et al. (2010), were used to estimate the internal pressures for simple opening conditions, including distributed leakage and dominant openings. The internal, external and net pressure coefficients under tornado-like loading were presented for three building orientations, and for specific points within the tornado path as well as enveloped over the entire tornado path. The results were compared to straight-line wind pressures from the Tokyo Polytechnic University aerodynamic database (Tamura, 2012) for a similar gable building model. The same numerical internal pressure model used to estimate the internal and net tornado pressures as also used to estimate the same under straight-line wind loading, i.e., the internal pressures were not measured, but were estimated using the external pressures and established theory. Some of the key observations of the study are summarized as follows:
• With distributed leakage, internal pressures under tornado-induced loading are slightly positive relative to the static pressure profile throughout the translation of the vortex over the building, as opposed to slightly negative under straight-line winds.
• With a dominant opening, the internal pressures relative to the static pressure respond similarly as would be expected for straight-line flow. When the dominant opening is on the windward wall as the vortex approaches, internal pressures are strongly positive. When on the leeward wall, internal pressure is negative relative to the static pressure, but lower in magnitude than the internal pressure when the opening is on the windward wall.
• The location of the windward wall is dependent upon the location of the building with respect to the vortex, the orientation of the building and the swirl ratio of the vortex. With the low swirl vortex, the radial component of the velocity noticeably contributes to the resultant velocity component, and the windward wall can be on the wall opposite the translating motion of the vortex as the vortex approaches the building. However, with the high swirl ratio vortex, the windward wall as the vortex approaches is predominately the wall on which the tangential flow impinges.
• Peak enveloped tornado-induced wind pressures at specific locations on the building model are on average 13% higher in magnitude than straight-line wind pressures at the same location but can be as much as 100% higher in magnitude at roof corners and edges even when effects of the APD are accounted for through the internal pressure model.
• Peak positive tornado-induced wind loads on roof surfaces tend to agree quite well with those for straight-line wind flow.
• The greatest differences between tornado-induced and straight-line wind loads tend to be in the separation zones, i.e., the corners and edges of the building, both for the walls and roof.
An important point to consider with regards to the results presented and discussed above is that the pressure coefficients are by definition tied to the reference velocity as discussed previously. Thus any changes in the reference velocity used will equally affect the magnitudes of the pressure coefficients. Standard methods for referencing stationary wind pressures are well defined in the literature, but there are no such broadly accepted standards as of yet for non-stationary winds such as tornadoes. And more importantly, there is limited knowledge as of yet how any standardized tornado reference wind speed would compare to that of a boundary layer wind tunnel flow. Further, the reference velocity for the simulated tornado data used in this study is assessed from the horizontal component of the velocity only, ignoring the significant vertical velocity component that is present in certain regions of the tornado flow (Fleming et al., 2013).
A key question to examine moving forward is what factors primarily contribute to the differences between tornado-induced and straight-line wind loads. A number of factors are likely at play, both systemic and mechanical. For example, the choice of reference velocity for tornadoes, the choice of gust factor for re-referencing the TPU pressure coefficients, and other experimental or analysis choices can contribute to the differences observed. But more importantly, the mechanics of tornado-induced wind loads, with significant vertical velocity components, accelerating flow, and more are fundamentally different than what is simulated by boundary layer wind tunnels, as evidenced in several recent studies (Haan, 2017; Kopp and Wu, 2017). As of yet however, it is unclear to what extent each of these factors contribute to potential differences in observed wind loads.
Finally, it should be recognized that the ability of model-scale tornado simulators to accurately model realistic tornado vortices has also been questioned (Baker and Sterling, 2019). Continued studies on the impacts of different methods of simulating tornadoes, (e.g., Gillmeier et al., 2016; Kopp and Wu, 2017; Gairola and Bitsuamlak, 2019), will be important to understanding the current study and others like it in the proper context. Efforts are also needed to continue developing new ways of incorporating full-scale field data or novel near-surface wind field characterization methods, (e.g., Roueche et al., 2017; Rhee and Lombardo, 2018; Wagner and Doe, 2018), more robustly into model-scale studies.
Data Availability Statement
The datasets and code used in this study are available through the National Science Foundation DesignSafe-Cyberinfrastructure Data Depot or upon request from the corresponding author.
Author Contributions
DR performed the numerical modeling and analysis during his Ph.D. dissertation under the guidance of DP at the University of Florida. FH performed the experimental work at Iowa State University.
Funding
This material is based upon work supported by the National Science Foundation under Grant Nos. 0220006 and 1150975. DR received additional support through the National Science Foundation Graduate Research Fellowship Program Grant No. GM02432.
Conflict of Interest
The authors declare that the research was conducted in the absence of any commercial or financial relationships that could be construed as a potential conflict of interest.
Supplementary Material
The Supplementary Material for this article can be found online at: https://www.frontiersin.org/articles/10.3389/fbuil..00018/full#supplementary-material
References
Amidror, I. (2002). Scattered data interpolation methods for electronic imaging systems: a survey. J. Electr. Imaging 11, 157–176.
ASCE (2017). Minimum Design Loads for Buildings and Other Structures. Reston, VA: American Society of Civil Engineers. doi: 10.1061/9780784414248
Baker, C., and Sterling, M. (2019). Are Tornado Vortex Generators fit for purpose? J. Wind Eng. Indus. Aerodyn. 190, 287–292. doi: 10.1016/j.jweia.2019.05.011
Banks, D., and Meroney, R. N. (2001). The applicability of quasi-steady theory to pressure statistics beneath roof-top vortices. J. Wind Eng. Indus. Aerodyn. 89, 569–598. doi: 10.1016/s0167-6105(00)00092-1
Bienkiewicz, B., and Dudhia, P. (1993). “Physical modeling of tornado-like vortex and tornado effects on building loading,” in Proceedings of the Seventh US Conference Wind Engineering, (Los Abgeles, CA: University of California), 27–30.
Fan, F., and Pang, W. (2019). Stochastic track Model for Tornado risk assessment in the U.S. Front. Built Environ. 5:37. doi: 10.3389/fbuil.2019.00037
Fleming, M. R., Haan, F. L., and Sarkar, P. P. (2013). “Turbulent structure of tornado boundary layers with translation and surface roughness,” in Proceedings of the 12th Americas Conference on Wind Engineering, Seattle, WA.
Gairola, A., and Bitsuamlak, G. (2019). Numerical tornado modeling for common interpretation of experimental simulators. J. Wind Eng. Indus. Aerodyn. 186, 32–48. doi: 10.1016/j.jweia.2018.12.013
Gillmeier, S., Sterling, M., and Hemida, H. (2016). “An analysis of the influence of a tornado generator’s geometry on the flow field,” in Proceedings of the The 8th International Colloquium on Bluff Body Aerodynamics and Applications, Boston, MA.
Haan, F. L. Jr., Sarkar, P. P., and Gallus, W. A. (2008). Design, construction and performance of a large tornado simulator for wind engineering applications. Eng. Struc. 30, 1146–1159. doi: 10.1016/j.engstruct.2007.07.010
Haan, F. L. (2017). An examination of static pressure and duration effects on tornado-induced peak pressures on a low-rise building. Front. Built Environ. 3:20. doi: 10.3389/fbuil.2017.00020
Haan, F. L., Balaramudu, V. K., and Sarkar, P. P. (2010). Tornado-induced wind loads on a low-rise building. J. Struc. Eng. 136, 106–116. doi: 10.1061/(asce)st.1943-541x.0000093
Haan, F. L., Ketchman, M., and Sarkar, P. P. (2009). “Turbulent boundary layer development in Tornado-Like Vortices,” in Proceedings of the Americas Conference on Wind Engineering, San Juan.
Hagos, A., Habte, F., Chowdhury, A., and Yeo, D. (2014). Comparisons of two wind tunnel pressure databases and partial validation against full-scale measurements. J. Struc. Eng. 140:04014065. doi: 10.1061/(asce)st.1943-541x.0001001
Jischke, M. C., and Light, B. D. (1983). Laboratory simulation of tornadic wind loads on a rectangular model structure. J. Wind Eng. Indus. Aerodyn. 13, 371–382. doi: 10.1016/b978-0-444-42340-5.50044-0
Karstens, C. D., Samaras, T. M., Lee, B. D., Gallus, W. A. Jr., and Finley, C. A. (2010). Near-Ground Pressure and Wind Measurements in Tornadoes. Monthly Weather Rev. 138, 2570–2588. doi: 10.1175/2010mwr3201.1
Kikitsu, H., Sarkar, P. P., and Haan, F. L. (2011). “Experimental study on tornado-induced loads of low-rise buildings using a large tornado simulator,” in Proceedings of the 13th International Conference on Wind Engineering, Amsterdam.
Kopp, G. A., and Wu, C. H. (2017). “A framework for the aerodynamics of low-rise buildings in tornadoes: Can boundary layer wind tunnels give us everything we need?,” in Proceedings of the Americas Conference on Wind Engineering, Gainesville, FL.
Kosiba, K. A., Robinson, P., Chan, P. W., and Wurman, J. (2014). Wind field of a nonmesocyclone anticyclonic Tornado crossing the Hong Kong International Airport. Adv. Meteorol. 2014, 1–7. doi: 10.1155/2014/597378
Kosiba, K. A., and Wurman, J. (2013). The three-dimensional structure and evolution of a tornado boundary layer. Weather Forecast. 28, 1552–1561. doi: 10.1175/waf-d-13-00070.1
Lee, J., and Samaras, T. (2004). “Pressure measurements at the ground in an F-4 tornado,” in Proceedings of the Conference on Severe Local Storms, Littleton, CO.
Letchford, C., Levitz, B., and James, D. (2015). Internal Pressure Dynamics in Simulated Tornadoes. Structures Congress 2015. Reston, VA: American Society of Civil Engineers, 2689–2701.
Lieblein, J. (1974). Efficient Methods of Extreme-Value Methodology. Gaithersburg, MA: National Bureau of Standards.
Mishra, A., James, D. L., and Letchford, C. W. (2008). Physical simulation of a single-celled tornado-like vortex, part A: flow field characterization. J. Wind Eng. Ind. Aerodyn. 96, 1258–1273. doi: 10.1016/j.jweia.2008.02.027
Oh, J. H., Kopp, G. A., and Inculet, D. R. (2007). The UWO contribution to the NIST aerodynamic database for wind loads on low buildings: Part 3. Internal pressures. J. Wind Eng. Indus. Aerodyn. 95, 755–779. doi: 10.1016/j.jweia.2007.01.007
Peng, X., Roueche, D. B., Prevatt, D. O., and Gurley, K. R. (2016). “An engineering-based approach to predict tornado-induced damage,” in Multi-hazard Approaches to Civil Infrastructure Engineering, eds P. Gardoni and J. M. LaFave, (Cham: Springer International Publishing), 311–335. doi: 10.1007/978-3-319-29713-2_15
Rajasekharan, S., Matsui, M., and Tamura, Y. (2013). Characteristics of internal pressures and net local roof wind forces on a building exposed to a tornado-like vortex. J. Wind Eng. Indus. Aerodyn. 112, 52–57. doi: 10.1016/j.jweia.2012.11.005
Razavi, A., and Sarkar, P. P. (2018). Tornado-induced wind loads on a low-rise building: Influence of swirl ratio, translation speed and building parameters. Eng. Struc. 167, 1–12. doi: 10.1016/j.engstruct.2018.03.020
Refan, M., Hangan, H., and Wurman, J. (2014). Reproducing tornadoes in laboratory using proper scaling. J. Wind Eng. Indus. Aerodyn. 135, 136–148. doi: 10.1016/j.jweia.2014.10.008
Rhee, D. M., and Lombardo, F. T. (2018). Improved near-surface wind speed characterization using damage patterns. J. Wind Eng. Indus. Aerodyn. 180, 288–297. doi: 10.1016/j.jweia.2018.07.017
Roueche, D. B., Lombardo, F. T., and Prevatt, D. O. (2017). Empirical Approach to Evaluating the Tornado Fragility of Residential Structures. J. Struc. Eng. 143, 04017123. doi: 10.1061/(asce)st.1943-541x.0001854
Sabareesh, G. R. (2012). Dependence of surface pressures on a cubic building in tornado like flow on building location and ground roughness. J. Wind Eng. Indus. Aerodyn. 103, 50–59. doi: 10.1016/j.jweia.2012.02.011
Sabareesh, G. R., Matsui, M., and Tamura, Y. (2013). Ground roughness effects on internal pressure characteristics for buildings exposed to tornado-like flow. J. Wind Eng. Indus. Aerodyn. 122, 113–117. doi: 10.1016/j.jweia.2013.07.010
Sabareesh, G. R., Matsui, M., and Tamura, Y. (2019). Vulnerability of roof and building walls under a translating Tornado like Vortex. Front. Built Environ. 5:53. doi: 10.3389/fbuil.2019.00053
Samaras, T. M., and Lee, J. J. (2004). “Pressure measurements within a large Tornado,” in Proceedings of the Combined Preprints: 84th American Meteorological Society (AMS) Annual Meeting, January 11, 2004 - January 15, 2004, (Massachusetts: American Meteorological Society), 6053–6061.
Simmons, K. M., Kovacs, P., and Kopp, G. A. (2015). Tornado damage Mitigation: benefit–cost analysis of enhanced building codes in Oklahoma. WeatherClimate Soc. 7, 169–178. doi: 10.1175/wcas-d-14-00032.1
St. Pierre, L. M., Kopp, G. A., Surry, D., and Ho, T. C. E. (2005). The UWO contribution to the NIST aerodynamic database for wind loads on low buildings: Part 2. Comparison of data with wind load provisions. J. Wind Eng. Indus. Aerodyn. 93, 31–59. doi: 10.1016/j.jweia.2004.07.007
Stathopoulos, T., and Kozutsky, R. (1986). Wind-induced internal pressures in buildings. J. Struc. Eng. 112, 2012–2026. doi: 10.1061/(asce)0733-9445(1986)112:9(2012)
Strader, S. M., Ashley, W., Irizarry, A., and Hall, S. (2015). A climatology of tornado intensity assessments. Meteorol. Appl. 22, 513–524. doi: 10.1002/met.1482
Tamura, Y. (2012). Aerodynamic Database for Low-Rise Buildings. Tokyo: Global Center of Excellence Program, Tokyo Polytechnic University. Available at: http://www.wind.arch.t-kougei.ac.jp/system/contents/code/tpu (accessed December 12, 2018).
Thomas, J. W. (2013). Numerical Partial Differential Equations: Finite Difference Methods. Berlin: Springer Science & Business Media.
Vickery, B. J. (1986). Gust-factors for internal-pressures in low rise buildings. J. Wind Eng. Indus. Aerodyn. 23, 259–271. doi: 10.1016/0167-6105(86)90047-4
Wagner, M., and Doe, R. (2018). “Tornadoes and Topography: an enhanced understanding of site dynamics using UASs,” in Proceedings of the AGU Fall Meeting Abstracts, Francisco, CA. doi: 10.1007/978-1-4020-9244-2_14
Wang, J., Cao, S., Pang, W., and Cao, J. (2018). Experimental study on Tornado-induced wind pressures on a cubic building with openings. J. Struc. Eng. 144:04017206. doi: 10.1061/(asce)st.1943-541x.0001952
Wurman, J., Kosiba, K., and Robinson, P. (2013). In Situ, Doppler Radar, and Video Observations of the Interior Structure of a Tornado and the Wind–Damage Relationship. Bull. Am. Meteorol. Society 94, 835–846. doi: 10.1175/bams-d-12-00114.1
Keywords: tornado, internal pressure, wind tunnel, low-rise, aerodynamics
Citation: Roueche DB, Prevatt DO and Haan FL (2020) Tornado-Induced and Straight-Line Wind Loads on a Low-Rise Building With Consideration of Internal Pressure. Front. Built Environ. 6:18. doi: 10.3389/fbuil.2020.00018
Received: 23 October 2019; Accepted: 10 February 2020;
Published: 28 February 2020.
Edited by:
Teng Wu, University at Buffalo, United StatesReviewed by:
Amal Elawady, Florida International University, United StatesIoannis Zisis, Florida International University, United States
Masahiro Matsui, Tokyo Polytechnic University, Japan
Copyright © 2020 Roueche, Prevatt and Haan. This is an open-access article distributed under the terms of the Creative Commons Attribution License (CC BY). The use, distribution or reproduction in other forums is permitted, provided the original author(s) and the copyright owner(s) are credited and that the original publication in this journal is cited, in accordance with accepted academic practice. No use, distribution or reproduction is permitted which does not comply with these terms.
*Correspondence: David Brett Roueche, ZGJyMDAxMUBhdWJ1cm4uZWR1