 Mourad Bentahar1,2
 Angelo Di Bella3Charfeddine Mechri1,4
 Silvio Montresor1
 Marco Scalerandi3*
 Xiaoyang Yu1
- 1LAUM UMR CNRS 6613, Le Mans Universite, Le Mans, France
- 2ENSIM, Le Mans Universite, Le Mans, France
- 3DISAT, Condensed Matter Physics and Complex Systems Institute, Politecnico di Torino, Turin, Italy
- 4CTTM, Le Mans, France
Nonlinear ultrasonic techniques have been developed over the last decades to detect the presence of damage in materials of interest in the field of civil engineering, such as concrete or mortar. The dependence on the strain amplitude of measurable quantities, such as wave velocity, damping factor, resonance frequency, etc. is normally considered a qualitative indicator of the presence of defects at the microstructural level. The experimental approaches proposed have the advantage of being sensitive to small variations in the sample microstructure and are therefore more adapted to detect the presence of small cracks or damaged areas with respect to traditional linear ultrasonic techniques. However, nonlinear methods are difficult to implement, since they usually require a calibrated experimental set-up which also behaves linearly at high amplitudes of excitation. The slow dynamics features, typical of the hysteresis generated by damage, have been given much less attention as a tool for damage detection even though their quantification is often less demanding in terms of an experimental set-up. Here, we provide the first evidence of how recovery, which is part of the slow dynamics process, is sensitive to the presence of damage in concrete samples and thus could be considered as an easy-to-measure nonlinear indicator for Structural Health Monitoring purposes.
1. Introduction
Elastic waves propagation in structures or components is strongly affected by the presence of damaged areas. Besides linear effects (such as wave speed variations and scattering), a distinguishing feature of cracks (which is e.g., not manifested by inclusions or porosity) is linked to their intrinsic nonlinear elastic properties. These microscopic nonlinear features are seen at a macroscopic (measurable) level by analyzing the strain dependence of some observable quantities. Nonlinearity in the wave propagation causes different effects which influence the temporal signals recorded after having excited the sample with an ultrasonic source. As a consequence, several approaches have been proposed to quantify the nonlinear signature present in observed signals, e.g., based on measuring amplitudes of generated higher order harmonics (i.e., the components of the signals at frequencies multiple times that of the source frequency) (van den Abeele and De Visscher, 2000; Shah and Ribakov, 2009). Other approaches aim to quantifying the increase of softening of viscoelastic properties with amplitude thorough e.g., the measurement of the resonance frequency shift (Johnson et al., 1996; Chen et al., 2011) or by defining nonlinear signals obtained by using the break of the superposition principle (Scalerandi et al., 2008; Ait Ouarabi et al., 2016) and by exploiting the local defect resonance (Solodov and Busse, 2013) and many others.
Several techniques for damage detection and localization have thus been developed based on the dynamics of the propagating wave to extract a nonlinear signature of the sample. Applications are reported for metals (Ohara et al., 2012; Hong et al., 2018; Li et al., 2019), composites (Amura and Meo, 2012; Genoves et al., 2015), rocks (Riviere et al., 2015), biological samples (Ulrich, 2007), etc. Damage related nonlinear elastic properties of materials of interest in civil engineering have also been widely studied: thermal induced damage (Payan et al., 2007; Scalerandi et al., 2013), corrosion cracks (Antonaci et al., 2013; Boukari et al., 2015), effects of carbonation (Bouchaala et al., 2011), or of static loads either external or shrinkage induced (Antonaci et al., 2010a,b; Kim et al., 2017), etc.
All these methods, which refer to what we call Fast Dynamics (FD) methods, however, require complex and expensive acquisition systems and procedures, since linearity of the set-up is a prerequisite which is often hard to obtain at large amplitudes of excitations. Thus, it could be desirable to combine the easiness of linear ultrasonic testing with the sensitivity to damage of nonlinear measurements. The goal here is to provide evidence that this goal could be achieved by taking advantage of slow dynamics.
Indeed, hysteretic elastic nonlinearity (Guyer and Johnson, 2009) is composed of two interlinked effects. Besides FD, i.e., the strain amplitude dependence of the material properties (modulus and damping) described above, Slow Dynamics (SD) is also present (see e.g., Guyer et al., 1999; Tencate et al., 2004; Scalerandi et al., 2010, 2018; Lott et al., 2017; Shokouhi et al., 2017). Such effect consists in the time dependence of modulus and damping when the sample is excited at constant strain. Note that the physical origin of slow dynamics effects is still debated. Hypotheses connecting it to fluids redistribution within the sample, sliding or frictional effects at the interface between grains, dislocations rearrangements, and others have been proposed. However, a definitive conclusion about the existence of a unique physical process responsible for conditioning and relaxation is not yet available. Research continues to allow for a better understanding of the links between SD and damage, such as to link SD effects to damage (Astorga et al., 2018; Scalerandi et al., 2019) or to damage related physical parameters (Bittner and Popovics, 2019).
In this article, an experimental analysis is presented to prove that relaxation effects in concrete and mortar samples, due to damage features, could be separated from analogous effects due to the intrinsic nonlinearity of the considered materials (e.g., naturally present within intact samples). The goal is to prove that slow dynamics indicators could potentially be introduced as an alternative to standard nonlinear indicators for NDT purposes. We also highlight potentialities and limitations of NDT approaches based on recovery measurements. In the next section, the typical features observed during SD will be discussed and then the application to two distinct cases will be presented in the following sections. Discussion of the results will be given in the conclusions, together with an outline of future perspectives.
2. Features of Hysteretic Nonlinearity in Fast and Slow Time Scales
Elastic nonlinearity generated by damaged areas or microcracks exhibits a peculiar hysteretic behavior, resulting from the combination of effects related to phenomena acting on very different time scales. Slow dynamics is the time dependence of the material elastic properties at a constant strain amplitude, while fast dynamics is the strain dependence of the material elastic properties.
2.1. Slow Dynamics
The observed phenomena linked to slow dynamics are shown in the left column of Figure 1. Here a mortar sample in the shape of a prism (4 × 4 × 16 cm3) was considered, produced using Portland cement (CEM I 42.5N) with a water cement ratio w/c of 0.35 by mass. The sample is excited with a monochromatic wave at a frequency close to its second longitudinal mode. The sample was continuously excited for a long time, varying amplitude of the source Asource as shown in the upper plot. First, a low amplitude excitation (preconditioning) was applied, followed by a large amplitude excitation (conditioning); finally, the excitation amplitude was reduced to its preconditioning value (relaxation).
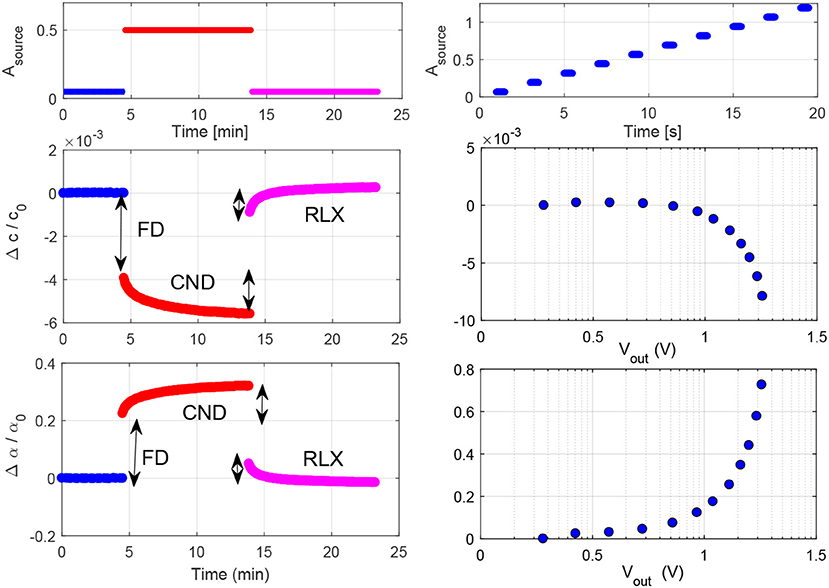
Figure 1. Illustration of slow (left) and fast (right) processes. The sample is excited by a monochromatic wave at varying amplitude of excitation Asource. The protocol of the choice of excitation level is shown in the upper row. The time/strain dependances of velocity and damping are shown in the second and third row, respectively. In the left column values, the instantaneous FD, the conditioning (CND) and the relaxation (RLX) phases are indicated. Here the symbol Vout denotes the amplitude of the output signal, generally expressed in mV, which is proportional to the strain amplitude in the sample.
The excitation was applied to one end of the sample using a waveform generator (Tektronix AFG 3022B) after amplification through a linear amplifier (CIPRIAN Model US-TXP-3, 200 x) (see Figure 2). The response temporal signal was detected at the other end using a digital oscilloscope (Lecroy 324A) for data acquisition. Signals were recorded in a short time window once stationary conditions were reached. For both generation and detection, ultrasonic transducers were used, specifically designed for concrete analysis (MATEST C370-02 transducers with diameter of 2.5 cm and a center frequency at 55 kHz). Transducers were acting in longitudinal mode, so that the excitation was mostly in the direction of the main axis of the sample.
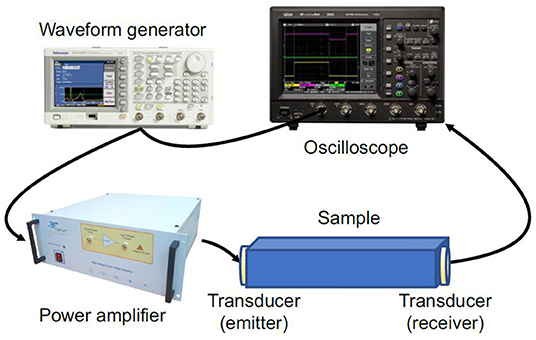
Figure 2. Experimental setup: waveform generator (Tektronix AFG 3022B), amplifier (CIPRIAN US-TXP-3, 200x), two ultrasonic transducers, digital oscilloscope (Lecroy 324A). The generator and oscilloscope were controlled by Labview.
Temporal signals were analyzed using the Modulus and Damping Nonlinearities Estimation approach (MoDaNE) (Mechri et al., 2019). In the case of 1-D samples, the standing wave solution for longitudinal waves could be analytically derived and the relation between phases ϕ and amplitudes A of the signal and velocity c on one hand and damping coefficient α on the other hand could be calculated, according to the following equations:
where the sign is plus if ϕ + ϕ0 > 0, n is the order of the closest mode to ω and
Here L is the sample length, ω is the angular frequency of the monochromatic wave and U0 and ϕ0 are the source amplitude and phase. Details of the calculations can be found in Di Bella et al. (2019).
Acquisitions were repeated in time and results are shown in the second and third row. During the preconditioning phase (blue) velocity and damping remains constant as a function of time: c = c0 and α = α0. As soon as the excitation amplitude is amplified, velocity drops down instantaneously (softening) and damping increases (due to fast dynamics mechanisms) and later they slowly evolve toward a new equilibrium state (red). This mechanism, which takes tens of seconds to a few minutes, is called conditioning (Scalerandi et al., 2010; Lott et al., 2017). The conditioning effect is completely reversible (relaxation, in magenta); when the source amplitude returns to its initial low value, the elastic properties slowly recover their original unperturbed values.
2.2. Fast Dynamics
The same sample and experimental set-up was also used to consider fast dynamics effects. In this case, the protocol for the source amplitude variation was different (as shown in the upper row of the right column of Figure 1). We started from a low amplitude of excitation and then we increased it up regularly to a maximum value. The change from one amplitude to the other was operated on a very short time scale. Thus, we are not capturing the conditioning part of the curves shown in the left column of Figure 1, but only the instantaneous jump part.
Data are again processed with the MoDaNE approach and velocity and damping variations are plotted vs. the output amplitude in the second and third row. The signal amplitude at the edge is proportional to the strain amplitude in the sample, since we are exciting compressional waves. Results show softening of the material and increase of attenuation with increasing strain, in agreement with observations in the literature for similar samples.
3. Damaged Polymer Concrete
3.1. Samples and Experimental Set-Up
The goal of this and the following section is to analyze the sensitivity of slow dynamics (or more specifically of relaxation) to the presence of damage. For this purpose, we have considered polymer concrete specimens in the shape of parallelepiped 200 × 40 × 40 mm3, manufactured using epoxy resin (40% volume fraction), sand (30%), and gravel (30%). One sample was tested in its intact state and a second sample was partially damaged with a three-point-bending protocol applying a maximum load corresponding to 50% of the samples rupture load (estimated in previous tests to be approximately 25 MPa). Damage was induced using an Instron universal testing machine with a 10kN capacity and 0.05mm/min crosshead velocity. Due to the protocol used to induce damage, it was mainly localized in the proximity of the notch, i.e., in the center of the sample, starting from the lateral surface and affecting a localized inner zone.
Vibration bending tests were performed exciting one edge of the sample using a shaker as the source, generating a sweep signal in the frequency range around the third bending mode: between 5, 300 and 5, 400Hz for the damaged sample and between 5, 800 and 5, 900Hz for the intact sample (see Figure 3). The sweep duration was set to ≈40 s and averaging over 10 acquisitions was conducted. Next, we will denote Asource as the amplitude of the sweep. Signals were detected at the other edge of the sample and analyzed with a spectrum analyzer, which automatically calculates phases and amplitudes for each frequency of the sweep source function.
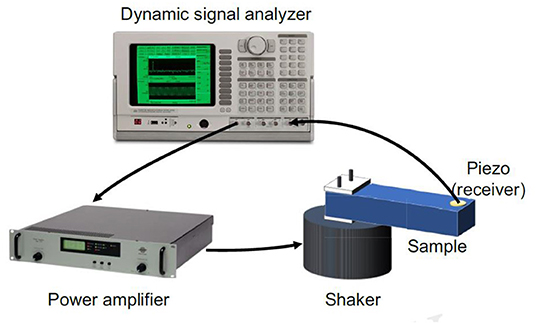
Figure 3. Experimental setup for the polymer concrete sample: dynamic signal analyzer (Stanford research system model SR785), power amplifier (BK type-2719), shaker (BK 4809), piezoelectric transducer (receiver). The dynamic signal analyzer was controlled by Octave.
3.1.1. Fast Dynamics
First, a fast dynamic experiment was conducted. Amplitude of the sweep was regularly increased in order to excite the material in the linear and nonlinear regimes, where detected signals were analyzed. In Figure 4, amplitudes and phases of the signal are plotted vs. frequency (frequencies within the sweep range and normalized to the linear resonance frequency) for increasing values of the source amplitude. Results for the intact and damaged samples are reported in the left and right columns, respectively. Such plots allow for the calculation of the resonance frequency and Q-factor of the sample at an increasing load. In particular, from the plot of phases (lower row) for each load level, it is possible to determine the frequency at which phase is zero (red circles in the damaged sample plot), which corresponds to the resonance frequency of the sample at a fixed amplitude of excitation. From amplitude curves (upper row), the material Q factor could be defined, approximately, as the half width at half height of the resonance curves.
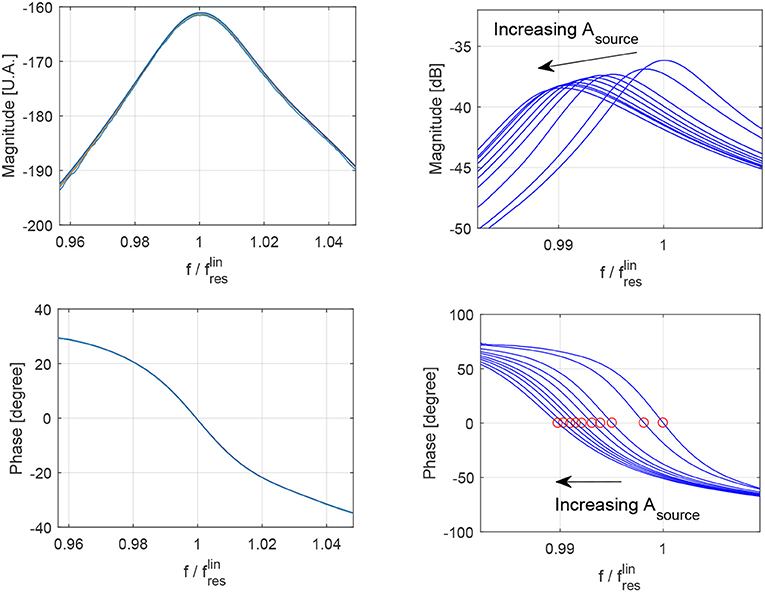
Figure 4. Fast dynamics analysis of polymer concrete samples: phases and amplitudes (normalized to input amplitude) vs. frequency (normalized to linear resonance frequency) of the detected signals at increasing values of Asource (input excitation). (Left) Intact sample. (Right) Damaged sample. Red circles in the phase subplot indicates the zero phase crossing, from which the resonance frequency could be derived at each amplitude of excitation. Note that the experiment is performed in order to minimize effects due to slow dynamics. Here, at each amplitude the sample is excited for a very short time. Thus, conditioning effects, which are time cumulative, could be considered as negligible.
Figure 4 allows us to conclude that, while for the intact state both Q factor and resonance frequency are strain independent (all curves at different values of Asource are superimposed), this is not the case for the damaged sample; indeed the resonance frequency and Q-factor drop with increasing Asource. This is a well-known result, which we quantify in Figure 5, where the decrease in velocity and Q factor with increasing excitation amplitude is observed only for the damaged sample. This observation has been widely used in the literature to highlight the sensitivity of nonlinear effects to the presence of damage.
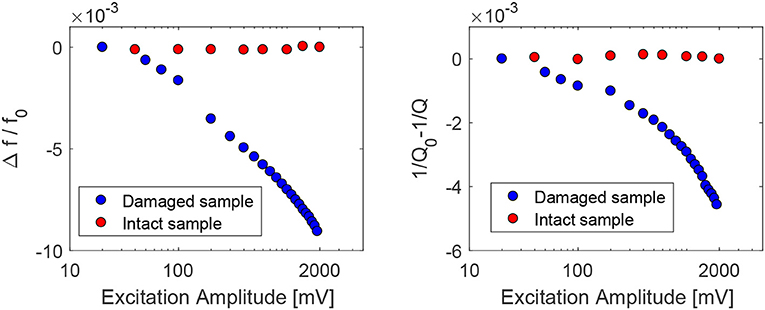
Figure 5. Relative resonance frequency and inverse of quality factor variations as a function of the source amplitude for damaged and intact polymer concrete samples.
However, the experimental protocol needed to obtain these results was simple but not easy to implement. Measurements require a careful control of the linearity of the acquisition system, which is not always straightforward since large source amplitudes are needed in the experiment. This is why in the next subsection we will propose an alternative measurement, equally sensitive to damage, and performed only in a low amplitude excitation range.
3.1.2. Slow Dynamics
The same samples were analyzed, using the very same experimental set-up, to highlight their slow dynamics properties. Rather than repeating the sweep excitation at increasing amplitudes of excitation, here a different amplitude protocol was adopted. Results of the analysis for the damaged polymer concrete sample are shown in Figure 6.
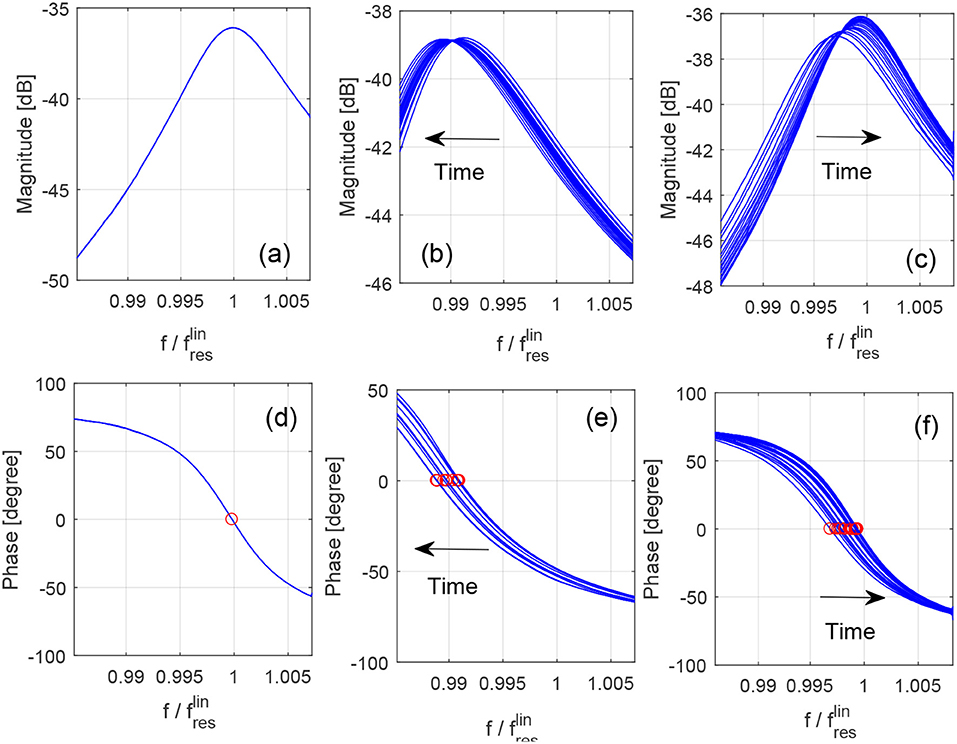
Figure 6. Protocol for slow dynamics measurements for the damaged polymer concrete sample. Preconditioning (a,d); Conditioning (b,e); relaxation (c,f). Curves are obtained at successive times.
In the experiment we have considered three steps:
• The sample is repeatedly excited at a low amplitude of excitation (preconditioning). The resonance curves (both amplitudes and phases) are perfectly superimposed, denoting that we have an initial linear equilibrium state: preconditioning (Figures 6A,D).
• The sample is conditioned, exciting it with a higher amplitude source (Figures 6B,E). After the initial sudden variation of the resonance frequency and damping (fast dynamics) with respect to the preconditioning case, increasing the conditioning time (see arrow), the attenuation increases (curves become wider) and the modulus decreases (resonance frequency shifts to the left as indicated by red circles in Figure 6E).
• Finally the sample is excited again at the lowest amplitude of excitation (Figures 6C,F): recovery. We have an initial metastable state, different from that during preconditioning, followed by a short relaxation in time. At late times, the system relaxes back to the preconditioning state.
Here we focus only on the relaxation process. From the curves reported in Figure 6, the resonance frequency variation and Q factor could be extracted and plotted vs. time, as shown in Figure 7. While the intact sample is not subject to relaxation, the slow recovery of the elastic properties as a function of time is evident for the damaged sample case.
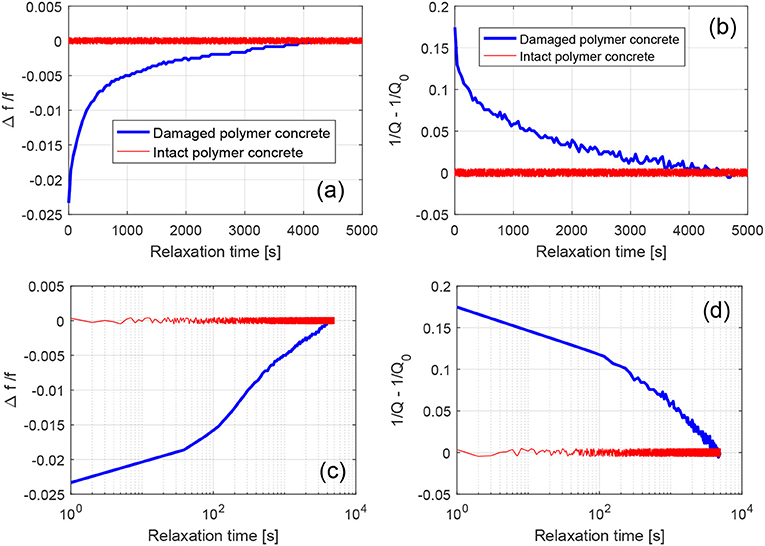
Figure 7. (a–d) Variation of resonance frequency and Q-factor vs. time for damaged and intact polymer concrete samples. The same data are shown in the lower row in semilog scale.
The presence of recovery as a signature of the presence of damage is of interest for applications to damage detection. Indeed, the experiment could be very easy, both conceptually and in its experimental realization. Given a sample, conditioning is applied (and not necessarily monitored), by exciting it with an ultrasonic wave or even with a small impact or thermal gradient (Nobili and Scalerandi, 2004). Immediately after, sensors are used to detect the response to a low amplitude excitation (thus the measurement is linear). If the waveform detected is constant in amplitude, there is no relaxation and the sample is intact; on the contrary any evolution in amplitude could be considered as an indication of the presence of damage. Notice that, since amplitude changes rapidly in the first instants of the evolution, it is not necessary to monitor the full relaxation process, thus the measurement could be performed rapidly (real time).
4. Civil Engineering Concrete
4.1. Samples and Experimental Set-Up
A second set of samples was tested to verify the differences in the relaxation process between intact and damaged samples. We used two concrete samples produced with proportions of two cement volumes, four sand volumes, and six gravel volumes for every water volume (average gravel size is 7±2 mm and sand particles size are predominantly around 2 mm). One of the samples was intact, although several microcracks were expected due to the poor quality of the mixture and the curing protocol performed in uncontrolled conditions. The second sample, in addition to the naturally existing distributed microdamage, was further damaged by a quasi-static three point bending test performed at 75% of its rupture load (estimated to be 10 MPa). The three point bending test was performed inducing localized damage in the center of the sample (along its main axis) and close to the surface in which a notch was applied to facilitate the damage formation.
The experimental set up used was the same as that described in section 2.
4.1.1. Slow Dynamics
The samples were excited with a monochromatic wave (fixed frequency) and given amplitude over a long time. In Figure 8A, the protocol of excitation is shown, with a preconditioning, a conditioning, and a relaxation phase. The input signal is drawn in the plot. The full temporal signal (over minutes or hours) could not be detected. Therefore, successive acquisitions of the output signals are considered (very close in time to each other) corresponding to acquisitions of the signal generated at different input conditions. As a clarification, black portions highlighted in the input signal identify time windows over which acquisition is done (of course they are much denser in practice). Each of the recorded signals is a sinusoidal function, as shown in Figure 8B, where an example of an experimental signal is shown. From the temporal evolution, for each time of acquisition, amplitude and phases could be derived. Their relative variations with respect to their value at time t = 0 are plotted in Figures 8C,D. As discussed in section 2, we can easily observe the preconditioning, conditioning, and relaxation steps. Finally, velocity and damping coefficient could also be derived as a function of time using the MoDaNE approach (Mechri et al., 2019).
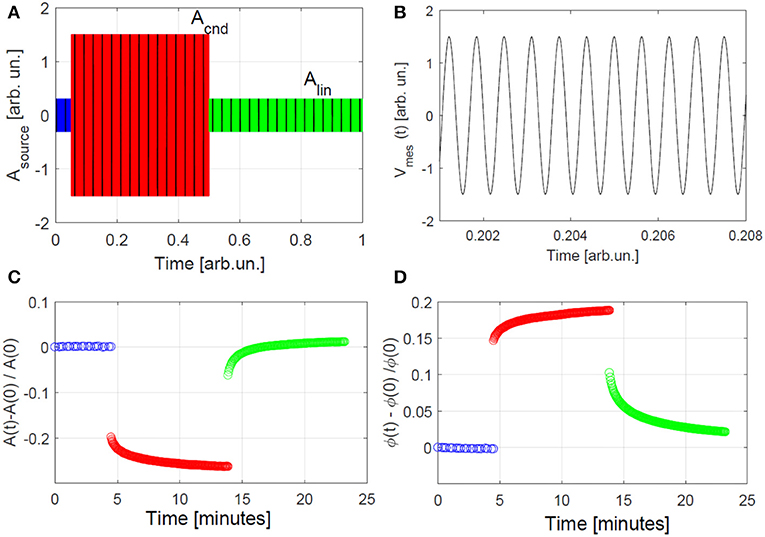
Figure 8. MoDaNE protocol to extract slow dynamics on the damaged concrete sample. (A) Schematic representation of the source function: a sinusoidal wave is applied at low, large, and low amplitude again. Black lines highlight the times at which the output signal is detected (B). Example of one temporal signal recorded in one of the windows shown in (A). The temporal signal is a sinusoidal function from which amplitude and phase at the given time could be derived. (C,D) Plots of the amplitude and phase variations with respect to those detected at time t = 0.
Although all the preconditioning, conditioning and relaxation phases could be analyzed separately, we focused our discussion here on comparing results during relaxation for the intact and damaged samples (see Figure 9). Here velocity (Figure 9A) and damping (Figure 9B) are shown vs. time during the preconditioning and relaxation phases. As expected, during preconditioning (blue) the sample is in a fully relaxed and stable state (with velocity c = c0 and damping α = α0). After having conditioned the sample at a large amplitude of excitation, when the sample is excited again at a low source amplitude the system at time t = 0 is in a metastable state, for both damaged (red) and intact (yellow) samples. Slowly, over time, both samples relax back to their equilibrium/relaxed states, respectively.
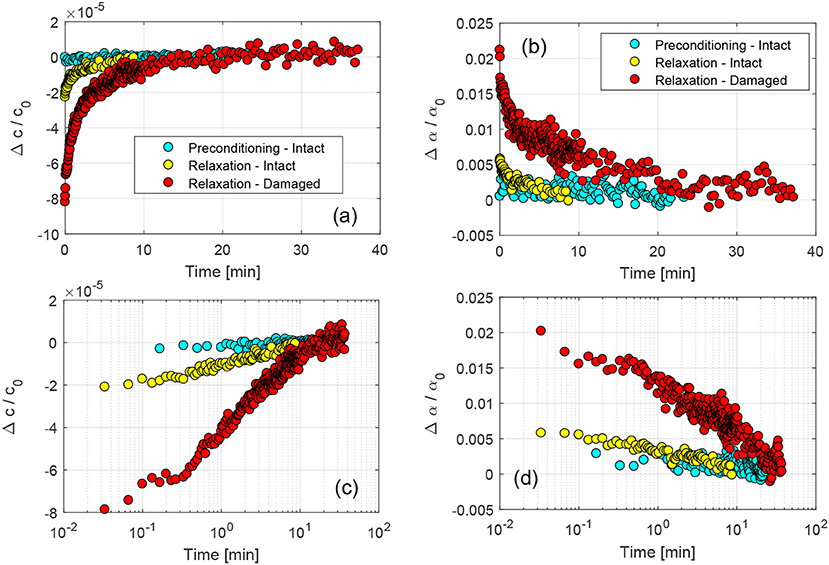
Figure 9. (a,b) Comparison of the temporal evolution of velocity and damping as a function of time between intact and damaged samples. In (c,d) a semilog plot is shown.
The same data are shown in a semilog plot in Figures 9C,D. As in the case of the polymer concrete samples, we observed a log time behavior in the intermediate time range for both damaged and intact samples. We noticed that slow dynamics effects are amplified by the presence of damage, but, contrary to the case of the polymer concrete samples, here the presence of relaxation is not a well-defined indicator of the presence of damage, since, as remarked, the intact sample contains naturally diffused microcracks within the cement matrix and at the matrix/reinforcement interface, as well.
5. Conclusions
In this article we analyzed relaxation effects in civil engineering samples, taken at initial and damaged states. We have shown that conditioning damaged components with a large amplitude of excitation causes a transition to a metastable state, in which velocity is smaller and damping is higher with respect to their values at the linear elastic state of the material. As shown also elsewhere, the system slowly relaxes back from the metastable state to the original relaxed state, on a time scale of the order of minutes.
Preliminary results shown here indicate that relaxation could provide an easy to measure nonlinear indicator for damage detection. In the case of samples which are perfectly linear in the intact state (e.g., polymer concrete), the emergence of relaxation phenomena is characteristic of the presence of damage and thus could be directly used as a SHM tool. On the contrary, in civil engineering concrete samples, relaxation is a phenomenon occurring already at the initial undamaged state. Thus, it is more difficult to extract information about the presence of damage from one single measurement. While it is true that localized cracks induce an increase of slow dynamics effects, quantitative measurement and a comparison between measurements on different samples are difficult to perform, e.g., due to differences in coupling between sensors and samples, different resonance frequency structures and/or different humidity/temperature conditions. The use of relaxation as a damage indicator in this case is thus less evident, but we believe applications could be envisaged e.g., for monitoring damage evolution in these structures.
In this contribution we also showed that slow dynamics can be probed using either compressional or flexural waves, where the effect of conditioning (fast dynamics) was revealed to be sensitive to the micro-cracking of concrete through the instantaneous frequency drop. Since concrete structures are often submitted to different vibration modes (created by truck and/or car traffic in civil engineering structures, for instance), we believe that a reliable structural health monitoring SHM application should be based on different resonance modes and/or mixed modes as well.
Further studies are fundamental in providing robustness to our findings. Repeatability of the measurements, generality for different cases, statistics over different samples are also needed before conclusive claims could be drawn in view of applications in Non Destructive Testing (NDT). A quantitative analysis of the results, such as the analysis of the dependence of relaxation times on the conditioning amplitude, could also provide further indications of differences between damaged and intact states in civil engineering concrete, which could allow the definition of better indicators linked to slow dynamics, to be used for NDT purposes (work in progress). Of course, progress along these directions is crucial to obtain an NDT approach which, besides allowing for damage detection, could also be used for damage identification and/or quantification. Some attempts to relate crack density to nonlinear indicators (fast dynamics) in rocks have recently been proposed (Kim et al., 2020) and perhaps the reported conclusions could also be exploited to strengthen the slow nonlinear dynamics analysis.
The dimension of the samples investigated in this work, were very small when compared with large structures of interest in civil engineering problems. Furthermore, our samples do not contain features such as reinforcing bars, which are normally used in civil engineering. It follows that monitoring slow dynamic effects with sinusoidal low amplitude waves, as proposed here, might not be the optimal procedure in view of applications. Nevertheless, if the possibility to detect the presence of damage in concrete through the relaxation of elastic properties (after the conditioning phase) was confirmed, other ways to monitor relaxation and to induce conditioning could be easily proposed and adapted to various situations: for instance, localized conditioning may be obtained with impacts; monitoring of the modulus evolution could instead be achieved by tracking the temporal evolution of wave speed, measured locally using pulses.
Data Availability Statement
The datasets generated for this study are available on request to the corresponding author.
Author Contributions
MB, CM, and MS conceived the study idea, designed and set-up the experiment, and contributed to data analysis. XY and AD performed the experiments and contributed to data analysis. SM contributed to the development of signal processing codes and to the sample's characterization during the damage process. All authors contributed to the writing of the paper.
Conflict of Interest
CM was employed by company CTTM.
The remaining authors declare that the research was conducted in the absence of any commercial or financial relationships that could be construed as a potential conflict of interest.
References
Ait Ouarabi, M., Gliozzi, A., Scalerandi, M., and Boubenider, F. (2016). Nonlinear coda wave analysis of hysteresis in strongly scattering elastic media. Phys. Rev. B 94:134103. doi: 10.1103/PhysRevB.94.134103
Amura, M., and Meo, M. (2012). Prediction of residual fatigue life using nonlinear ultrasound. Smart Mater. Struct. 21:045001. doi: 10.1088/0964-1726/21/4/045001
Antonaci, P., Bruno, C., Bocca, P., Scalerandi, M., and Gliozzi, A. (2010a). Nonlinear ultrasonic evaluation of load effects on discontinuities in concrete. Cement Concr. Res. 40, 340–346. doi: 10.1016/j.cemconres.2009.09.014
Antonaci, P., Bruno, C., Gliozzi, A., and Scalerandi, M. (2010b). Evolution of damage-induced nonlinearity in proximity of discontinuities in concrete. Int. J. Solids Struct. 47, 1603–1610. doi: 10.1016/j.ijsolstr.2010.02.025
Antonaci, P., Bruno, C. L. E., Scalerandi, M., and Tondolo, F. (2013). Effects of corrosion on linear and nonlinear elastic properties of reinforced concrete. Cement Concr. Res. 51, 96–103. doi: 10.1016/j.cemconres.2013.04.006
Astorga, A., Guéguen, P., and Kashima, T. (2018). Nonlinear elasticity observed in buildings during a long sequence of earthquakes. Bull. Seism. Soc. Am. 108, 1185–1198. doi: 10.1785/0120170289
Bittner, J., and Popovics, J. (2019). Direct imaging of moisture effects during slow dynamic nonlinearity. Appl. Phys. Lett. 114:021901. doi: 10.1063/1.5063904
Bouchaala, F., Payan, C., Garnier, V., and Balayssac, J. (2011). Carbonation assessment in concrete by nonlinear ultrasound. Cement Concr. Res. 41, 557–559. doi: 10.1016/j.cemconres.2011.02.006
Boukari, Y., Bulteel, D., Rivard, P., and Abriak, N.-E. (2015). Combining nonlinear acoustics and physico-chemical analysis of aggregates to improve alkali-silica reaction monitoring. Cement Concr. Res. 67, 44–51. doi: 10.1016/j.cemconres.2014.08.005
Chen, J., Kim, J., Kurtis, K., and Jacobs, L. (2011). Theoretical and experimental study of the nonlinear resonance vibration of cementitious materials with an application to damage characterisation. J. Acoust. Soc. Am. 130:2728. doi: 10.1121/1.3647303
Di Bella, A., Gliozzi, A., Scalerandi, M., and Tortello, M. (2019). Analysis of elastic nonlinearity using continuous waves: validation and applications. Appl. Sci. 9:5332. doi: 10.3390/app9245332
Genoves, V., Riestra, C., Borrachero, M. V., Eiras, J., Kundu, T., and Paya, J. (2015). Multimodal analysis of grc ageing process using nonlinear impact resonance acoustic spectroscopy. Compos. Part B 76, 105–111. doi: 10.1016/j.compositesb.2015.02.020
Guyer, R., and Johnson, P. (2009). Nonlinear Mesoscopic Elasticity. Wiley-VCH. doi: 10.1002/9783527628261
Guyer, R., Tencate, J., and Johnson, P. (1999). Hysteresis and the dynamic elasticity of consolidated granular materials. Phys. Rev. Lett. 82, 3280–3283. doi: 10.1103/PhysRevLett.82.3280
Hong, X., Liu, Y., Xiaohui, L., Luo, Z., and He, Z. (2018). Nonlinear ultrasonic detection method for delamination damage of lined anti-corrosion pipes using PZT transducers. Appl. Sci. 8:2240. doi: 10.3390/app8112240
Johnson, P., Zinsner, B., and Rasolofosaon, P. (1996). Resonance and elastic properties in rock. J. Geoph. Res. Sol. Earth 101, 11553–11564. doi: 10.1029/96JB00647
Kim, B.-C., Chen, J., and Kim, J. (2020). Relation between crack density and acoustic nonlinearity in thermally damaged sandstone. Int. J. Rock Mech. Mining Sci. 125:104172. doi: 10.1016/j.ijrmms.2019.104171
Kim, G., Kim, J., Kurtis, K., and Jacobs, L. (2017). Drying shrinkage in concrete assessed by nonlinear ultrasound. Cement Concr. Res. 92:16. doi: 10.1016/j.cemconres.2016.11.010
Li, M., Lomonosov, A. M., Shen, Z., Seo, H., Jhang, K.-Y., Gusev, V. E., et al. (2019). Monitoring of thermal aging of aluminum alloy via nonlinear propagation of acoustic pulses generated and detected by lasers. Appl. Sci. 9:1191. doi: 10.3390/app9061191
Lott, M., Remillieux, M., Garnier, V., Le Bas, P.-Y., Ulrich, T., and Payan, C. (2017). Nonlinear elasticity in rocks: a comprehensive three-dimensional description. Phys. Rev. Mater. 1:023603. doi: 10.1103/PhysRevMaterials.1.023603
Mechri, C., Scalerandi, M., and Bentahar, M. (2019). Separation of damping and velocity strain dependencies using an ultrasonic monochromatic excitation. Phys. Rev. Appl. 11:054050. doi: 10.1103/PhysRevApplied.11.054050
Nobili, M., and Scalerandi, M. (2004). Temperature effects on the elastic properties of hysteretic elastic media: modeling and simulations. Phys. Rev. B 69:104105. doi: 10.1103/PhysRevB.69.104105
Ohara, Y., Shintaku, Y., Horinouchi, S., Ikeuchi, M., and Yamanaka, K. (2012). Enhancement of selectivity in nonlinear ultrasonic imaging of closed cracks using amplitude difference phased array. Jpn. J. Appl. Phys. 51:07GB18. doi: 10.1143/JJAP.51.07GB18
Payan, C., Garnier, V., and Moysan, J. (2007). Applying nonlinear resonant ultrasound spectroscopy to improving thermal damage assessment in concrete. J. Acoust. Soc. Am. 121:EL125. doi: 10.1121/1.2710745
Riviere, J., Shokouhi, P., Guyer, R., and Johnson, P. (2015). A set of measures for the systematic classification of the nonlinear elastic behavior of disparate rocks. J. Geophys. Res. 120, 1587–1604. doi: 10.1002/2014JB011718
Scalerandi, M., Bentahar, M., and Mechri, C. (2018). Conditioning and elastic nonlinearity in concrete: separation of damping and phase contributions. Construct. Build. Mater. 161, 208–220. doi: 10.1016/j.conbuildmat.2017.11.035
Scalerandi, M., Gliozzi, A., Bruno, C., and Antonaci, P. (2010). Nonequilibrium and hysteresis in solids: disentangling conditioning from nonlinear elasticity. Phys. Rev. B 81:104114. doi: 10.1103/PhysRevB.81.104114
Scalerandi, M., Gliozzi, A., Bruno, C., Masera, D., and Bocca, P. (2008). A scaling method to enhance detection of a nonlinear elastic response. Appl. Phys. Lett. 92:101912. doi: 10.1063/1.2890031
Scalerandi, M., Griffa, M., Antonaci, P., Wyrzykowski, M., and Lura, P. (2013). Nonlinear elastic response of thermally damaged consolidated granular media. J. Appl. Phys. 113:154902. doi: 10.1063/1.4801801
Scalerandi, M., Mechri, C., Bentahar, M., Di Bella, A., Gliozzi, A., and Tortello, M. (2019). Experimental evidence of correlations between conditioning and relaxation in hysteretic elastic media. Phys. Rev. Appl. 12:044002. doi: 10.1103/PhysRevApplied.12.044002
Shah, A. A., and Ribakov, J. (2009). Non-destructive evaluation of concrete in damaged and undamaged states. Mater. Des. 30, 3504–3511. doi: 10.1016/j.matdes.2009.03.008
Shokouhi, P., Riviére, J, Guyer, R., Tencate, J., and Johnson, P. (2017). Slow dynamics of consolidated granular systems: multi-scale relaxation. Appl. Phys. Lett. 111:251604. doi: 10.1063/1.5010043
Solodov, I., and Busse, G. (2013). Resonant ultrasound spectroscopy of defects: case study of flat-bottomed holes. J. Appl. Phys. 113:223512. doi: 10.1063/1.4810926
Tencate, J., Pasqualini, D., Habib, S., Heitmann, K., Higdon, D., and Johnson, P. (2004). Nonlinear and nonequilibrium dynamics in geomaterials. Phys. Rev. Lett. 93:065501. doi: 10.1103/PhysRevLett.93.065501
Ulrich, T. E. A. (2007). Application of nonlinear dynamics to monitoring progressive fatigue damage in human cortical bone. Appl. Phys. Lett. 91:213901. doi: 10.1063/1.2809565
Keywords: slow dynamics, damage detection, hysteresis, nonlinear, concrete
Citation: Bentahar M, Di Bella A, Mechri C, Montresor S, Scalerandi M and Yu X (2020) Exploiting Slow Dynamics Effects for Damage Detection in Concrete. Front. Built Environ. 6:64. doi: 10.3389/fbuil.2020.00064
Received: 05 December 2019; Accepted: 15 April 2020;
Published: 02 June 2020.
Edited by:
Gennaro Scarselli, University of Salento, ItalyReviewed by:
Gelacio Juárez-Luna, Autonomous Metropolitan University, MexicoJa Kim, Georgia Institute of Technology, United States
Igor Solodov, University of Stuttgart, Germany
Copyright © 2020 Bentahar, Di Bella, Mechri, Montresor, Scalerandi and Yu. This is an open-access article distributed under the terms of the Creative Commons Attribution License (CC BY). The use, distribution or reproduction in other forums is permitted, provided the original author(s) and the copyright owner(s) are credited and that the original publication in this journal is cited, in accordance with accepted academic practice. No use, distribution or reproduction is permitted which does not comply with these terms.
*Correspondence: Marco Scalerandi, bWFyY28uc2NhbGVyYW5kaUBpbmZtLnBvbGl0by5pdA==