 Yuichiro Kawabata
 Takuya Ryo1
 Margareta Friman
 Lars E. Olsson
 Katrin Lättman
- 1Travel Behavior Analysis, Department of Urban Management, Kyoto University, Kyoto, Japan
- 2Department of Social and Psychological Studies, CTF Service Research Center, Karlstad University, Karlstad, Sweden
How to drive modal shift is one of the primary issues in creating a sustainable society. By encouraging people to migrate from private car use to public transport, city planners can prepare for a super-aged society, reduce greenhouse gas emissions, and mitigate negative externalities of private car use such as congestion, accidents, and noise. To achieve these goals, city planners are required to understand whether public transport usage can be increased by improving the service quality and what roles user satisfaction and loyalty play in the process. The relations between service quality, user satisfaction, loyalty, and user frequency have been studied for a long time. However, most of the studies are based on cross-sectional analysis. Cross-sectional analysis is less powerful in detecting causality as it does not show pre–post relations or lagged effects between variables. To investigate causal and non-simultaneous relations among quality, satisfaction, loyalty, and user frequency of public transport, we used data of the Benchmarking in European Service of Public Transport survey from 2001 to 2015 in four European cities, and applied vector auto regressive (VAR) analysis. The result shows that improvement of service quality has positive effects on user’s satisfaction, loyalty, and user frequency and that better satisfaction leads to higher loyalty and user frequency. More importantly, the result also shows that behavioral modification (change in user frequency) occurs with time lag while psychological modifications (changes in satisfaction and loyalty) occur immediately after changes in service quality. The findings suggest that city/transport planners ought to keep improving the service quality of public transport and monitoring the achievement from a long-term perspective.
Introduction
Several previous studies have argued that public transport plays a significant role in building a sustainable society. According to Ieda et al. (2001), public transport is a vital element in creating sustainable cities with easy accessibility for the aged, which are environmentally friendly concerning energy consumption. Summarizing the functions of public transport for sustainability, van Lierop et al. (2018) stated, “Public transport is a service that many cities recognize as being an important aspect in the development of socially, environmentally, and economically sustainable communities.” Although their paper did not elaborate on the conception, the three-dimensional view is useful in emphasizing the diversity of sustainability.
Firstly, public transport is indispensable for creating socially sustainable communities. In particular, dealing with the current demographic changes is one of the key issues. Some developed countries have already become “super-aged societies.” Japan is at the head of this transition, and several European and Asian countries are following. Thus, as part of the preparation, convenient public transport systems are required in order to guarantee satisfactory daily living for people without driver’s licenses (Reisman, 2011) and other vulnerable groups in particular. Public transport is beneficial not only for individual living but also for vitalizing local communities. In a rapidly aging society, economic, social, and cultural activities of local communities tend to shrink over time. Advanced public transport networks can improve intra- and inter-regional accessibility, which offers the residents and visitors more opportunities of activities (Ministry of Land, Infrastructure, Transport and Tourism [MLIT], 2012), and can be a measure of keeping local communities vital and thriving.
Secondly, public transport also plays an important role from the perspective of environmental sustainability. Needless to say, global warming is one of the most serious problems for human beings and modal shift has been considered as a means of reducing greenhouse gas emissions. According to a report by the European Environment Agency, 27% of total greenhouse gas emissions in the member states of EU came from the transport sector. Road transport accounts for 71.1% of transport emissions, and 44.5% of the emissions from road transport is contributed by passenger cars (European Environment Agency [EEA], 2018). Rockström et al. (2009) builds the concept of “Planetary Boundary” and quantifies the limitations of atmospheric CO2 concentration and other environmental pollutions, concluding that the current value of CO2 concentration has been over the boundary. Based on this fact, Rockström and Klum (2015) suggest that encouraging public transport use is one solution to decrease it, a claim supported by recent life cycle estimations of environmental footprints related to personal transportation (Sinha et al., 2019).
Finally, public transport also contributes to creating an economically sustainable society. Uzawa (1974) tried to calculate the social cost of private car usage and argued that private car users were not taking enough responsibility on social costs caused by overdependence on cars, such as traffic accidents, congestions, noise, crimes, and environmental pollutions. According to Uzawa’s estimation, when these social costs are considered, transport systems that rely on private cars are not always economically efficient for the society. Other researchers have estimated external costs and discussed how to internalize or reduce them to make the whole economic system sustainable (Shefer and Rietveld, 1997; Nash et al., 2001; Parry et al., 2007; Tsai et al., 2015; Adler and van Ommeren, 2016). Encouraging modal shift by road pricing, fuel tax, and subsidy for public transport among other measures has been proposed.
Taking these dimensions into consideration, public transport management is a central issue for urban planners and researchers in order to address and nurture sustainable cities. Thus, it is crucial to understand what drives public transport usage effectively.
To promote the use of public transport, planners and operators can employ strategies such as regulation (e.g., road pricing or fuel taxation on private car use) and persuasive communication using marketing methodologies (Fujii and Taniguchi, 2005; Taniguchi and Fujii, 2007). However, if the service itself is not very attractive, regulations that force people to use public transport can cause complaints, and persuasion may not be effective. Beirão and Cabral (2006) emphasize that public transport managers should address meeting customers’ needs, as private car use has grown by its attractiveness compared to existing public transport. Thus, improving the service quality should be regarded as one of the core missions of the managers.
When trying to increase the use of public transport by improving its quality, the number of users and the user frequency are natural objectives to address. However, frequency of use itself is not necessarily a good indicator of whether the service is working well or not, as these figures usually include so-called captive users (Ingvardson and Nielsen, 2019) who are forced to use the service regardless of whether they are satisfied with its quality or not. For example, young students and other low-income groups with few commute alternatives may be compelled to use public transport, and if they are not satisfied, they may stop using it and switch to other alternatives when opportunities change (e.g., after graduation, rise in salary). This means that satisfaction of the users is also a key objective.
However, it may still not be sufficient to consider only satisfaction because a high user satisfaction does not assure a use of the service again (Transportation Research Board, 1999) as there may exist other attractive alternatives. Therefore, loyalty of customers should be considered as well. Loyalty is a post-travel attitude (Gärling et al., 2018) defined as a willingness to use the service in the future (continued use) and a commitment and a willingness to recommend it to others (van Lierop et al., 2018). In other words, loyalty is an important driver of customer retention and penetration of the services and products (Heskett et al., 1997; Woodruff, 1997; Zeithaml et al., 2001).
To create sustainable future societies through efficient use of public transport, transport managers, and researchers are required to understand the relationship between service quality, customer satisfaction, customer loyalty, and user frequency. Therefore, the first objective of the present study is to clarify whether improving the service quality of public transport increases the user satisfaction, loyalty, and user frequency.
This objective is not entirely new; however, existing work still have issues to be solved as previous studies performed cross-sectional analyses to examine the relationships between variables (e.g., Lai and Chen, 2011; Frank et al., 2014; Ingvardson and Nielsen, 2019). As cross-sectional analyses do not provide any proof of pre–post relationships between variables, and the causality between them usually remains unclear, the second objective of this study is thus to describe dynamic relationships and causality of subjective quality, satisfaction, loyalty, and user frequency by analyzing time-series data.
The third research objective is to investigate how psychological and behavioral modification of users occur in terms of timing. As implied by the Transtheoretical Model (Prochaska and DiClemente, 1984), it is expected that psychological modification precedes behavioral modification. In the context of the present study, changes in satisfaction and loyalty can be regarded as psychological modifications, and contrarily, a change in user frequency can be understood as a behavioral modification. If the theory is applicable to transport behaviors, as previous studies suggest (e.g., Friman et al., 2017), a service quality improvement may increase user frequency after causing increases in satisfaction and loyalty.
Literature Review
Subjective Quality as a Target to Monitor
Managers of public transport, governments, and transport companies have tried to increase customer satisfaction by improving their operations, offering new services, cutting prices, arranging more useful transit from/to other transport, and providing richer and more appropriate information. In order to make such efforts successful, transport managers ought to keep assessing their service qualities and monitoring passengers’ satisfaction for their daily decision making. To contribute to this process, researchers have proposed a wide variety of methodologies for assessing quality and satisfaction. In recent years, some of them have been successful in establishing the process of service and satisfaction monitoring based on passengers’ subjective evaluation (e.g., Friman, 2004; Eboli and Mazzulla, 2007; Cats et al., 2015; Shen et al., 2016; de Oña et al., 2016a; Abenoza et al., 2017; Ingvardson and Nielsen, 2019). These studies are based on the idea that passenger perceptions of the service quality can be a better target to monitor than objective indicators, at least when aiming to enhance service usage.
de Oña et al. (2016b) proposed a methodology to monitor the quality and the passengers’ satisfaction of public transport transit by using indices based on the index number theory in economics. One of their purposes was to establish a methodology to assess the quality of public transport from the passengers’ perspective, in contrast to traditional assessments from the managers’ perspective such as efficiency and effectiveness. By understanding the relationships between passengers’ subjective evaluation of the quality and their overall psychological satisfaction, the operators can detect useful indicators, which may directly lead to an increased use of their services.
Awareness of the Importance of Loyalty and Lack of Analysis of Frequency
In order to increase the use of public transport, it is obvious that customer’s satisfaction should be maximized. However, as mentioned in the previous section, satisfaction is not necessarily a sufficient index that leads to frequent use of transport. Even if a customer is satisfied with a service, it does not assure that he/she will use the service again in the future. The customer can easily switch to other services if it is more attractive or convenient, especially when public transport has been used out of necessity or habit. Therefore, customer loyalty is also an important target to improve for service providers.
Transportation Research Board (1999) proposes that transport managers need to measure their customers’ loyalty and provides a basic framework for capturing customer loyalty based on a theory from marketing studies. It describes a loyal customer as a person who is very satisfied with the service and who will continue to use the service in the future and would recommend the service to others. This is in line with van Lierop et al. (2018) who provide a comprehensive literature review on ridership retention in public transport. They derived the conclusion that customer loyalty should be defined as (1) users’ intention to continue using the service, (2) users’ willingness to recommend it to others, (3) users’ overall satisfaction and their image, and (4) their involvement with public transport.
van Lierop and El-Geneidy (2016) summarized previous works in the field of public transport that analyzed user loyalty. As they pointed out, some researchers have proposed unique definitions of loyalty including price tolerance and priority of a transport mode over the others (Chou and Kim, 2009; Shiftan et al., 2015). They noted that there have not been a consensus about how loyalty should be defined and measured; however, they employed (1) to (3) above as core parts of loyalty for their own empirical study. To discuss how to increase public transport ridership to make society more sustainable, the first two dimensions of loyalty, namely, “willingness to continue using” and “willingness to recommend to others” are particularly important because those indicate users’ concrete future behaviors.
Although many studies discuss the relationship between perceived service quality, customer satisfaction, and loyalty, the process in which service quality affects user satisfaction and loyalty, and subsequently alters frequency of use, is still not sufficiently understood in public transport. De Vos and Witlox (2017) provides a comprehensive framework to understand the relationship between travel satisfaction and other psychological and behavioral factors. According to their theory, travel satisfaction is not only an outcome of travel experience but also a cause of travel behavior. An analysis by De Vos et al. (2019) suggests that there is a feedback loop in which a particular mode choice affects the traveler’s satisfaction and the satisfaction leads to more/less choice of the mode. This can be a key to increasing the use of public transport.
However, only a few studies (e.g., Kaplan et al., 2014; Ingvardson and Nielsen, 2019) have analyzed the relationship between the psychological factors and “user frequency.” Ingvardson and Nielsen (2019) explored the key drivers of satisfaction, loyalty (willingness to recommend using public transport to others), and user frequency by structural equation modeling of the data from the BEST (Benchmarking in European Service of public Transport) survey from 2009 to 2015 in six European cities. From the analyses, they found that (1) some specific quality measures are related to overall satisfaction, (2) overall satisfaction in turn is related to loyalty, and (3) both overall satisfaction and loyalty are related to frequency of use.
Limitation of Cross-Sectional Analyses
Even though the suggestions by Ingvardson and Nielsen (2019) seem to be useful for public transport managers, it is not clear whether changes in quality measures cause changes in satisfaction, loyalty, and user frequency. This is because the analyses are based on cross-sectional comparison. Even if cross-sectional data show a positive correlation between quality and satisfaction, it is still not conclusive whether the correlation can be understood as a causal effect from quality to satisfaction or not. The direction of the relationship is unclear. It should be noted that all measures in the BEST survey are subjective. Subjective evaluations of quality may increase as a result of an increase in satisfaction. An alternative is that both measures in service quality and satisfaction increase as the result of the influence of some, additional, unmeasured factors. This can be said for any of the pairs measuring quality, satisfaction, loyalty, and frequency. For example, higher satisfaction can lead to more frequent use, but at the same time, higher frequency can also cause higher satisfaction when users become more familiar with the service.
Time-Series Analyses of Customers’ Evaluation of Public Transport Services
Some recent studies regarding quality and satisfaction of public transport have been exploring time-series characteristics in their relationships. For instance, de Oña et al. (2016a) suggest that the importance and satisfaction of different service attributes can change over years due to changes in the transport system or due to changes in expectations among the users. By using satisfaction surveys in Granada (Spain), de Oña et al. (2016a) composed an index indicating the importance and satisfaction of each service attribute by year (2007–2013). The analyses revealed significant changes in the index values over the years. Cats et al. (2015) showed how satisfaction with public transport evolved over time (2001–2013) in Sweden using data from a satisfaction survey. The result of a regression analysis with an ordered logit model showed that the importance of on-board conditions, information of unplanned changes, and general information significantly increased during the observed period. The findings were explained by changes in passengers’ needs and expectations due to innovation in information technologies. Abenoza et al. (2017) analyzed changes in satisfaction across market segments and over time based on a survey conducted in 21 Swedish regions between 2001 and 2014. They used ordered logit regression models to assess the importance of different service attributes. One main finding was that some of the attributes significantly changed in importance for overall customer satisfaction over the years.
Limitations of the Previous Studies and How This Study Addresses Them
Although previous time series-based studies have found chronological changes in the relationships between quality attributes and satisfaction, their focus has not been on causal relationships. Focus in previous research has been on comparing the importance of different service attributes. Thus, whether or not an increase in quality has causal effects on the users’ satisfaction and loyalty remains unclear. So, in this study, we will test the causal effects over time based on time-series modeling. In our analysis, we will use the same chronological information of variables as Ingvardson and Nielsen (2019), that is, quality, satisfaction, loyalty, and frequency of use, derived from the BEST survey. The aim is to confirm whether the causal model presented by Ingvardson and Nielsen (2019) can be supported in terms of chronological relationships. Since the BEST survey has time-series information, we can test the causalities by detecting lagged effects between variables. Our analysis will show whether time lags could be observed for each proposed causal relationship and how long the lags last.
Materials and Methods
Description of the Data Source
We use data from the Benchmarking in European Service of Public Transport (BEST) survey. This survey has currently been conducted for 18 years (from 2001 to 2018) in 13 European cities. Every year, answers from around 1000 respondents have been collected in each city. The participants of the survey include users and non-users of public transport. The core part of the questionnaire consists of 21 questions regarding different aspects of service quality of public transport as well as questions about satisfaction, loyalty, and user frequency (see Table 1). Except for user frequency, all questions are measured on a five-point Likert scale ranging from “totally disagree” to “fully agree.” For user frequency, participants choose between “daily,” “a few times per week,” “a few times per month,” “less than monthly,” or “never.” Furthermore, demographic attributes such as gender, occupation, and age of participants are also collected. More detailed descriptions of the survey design is provided in Friman and Fellesson (2009) and in Ingvardson and Nielsen (2019).
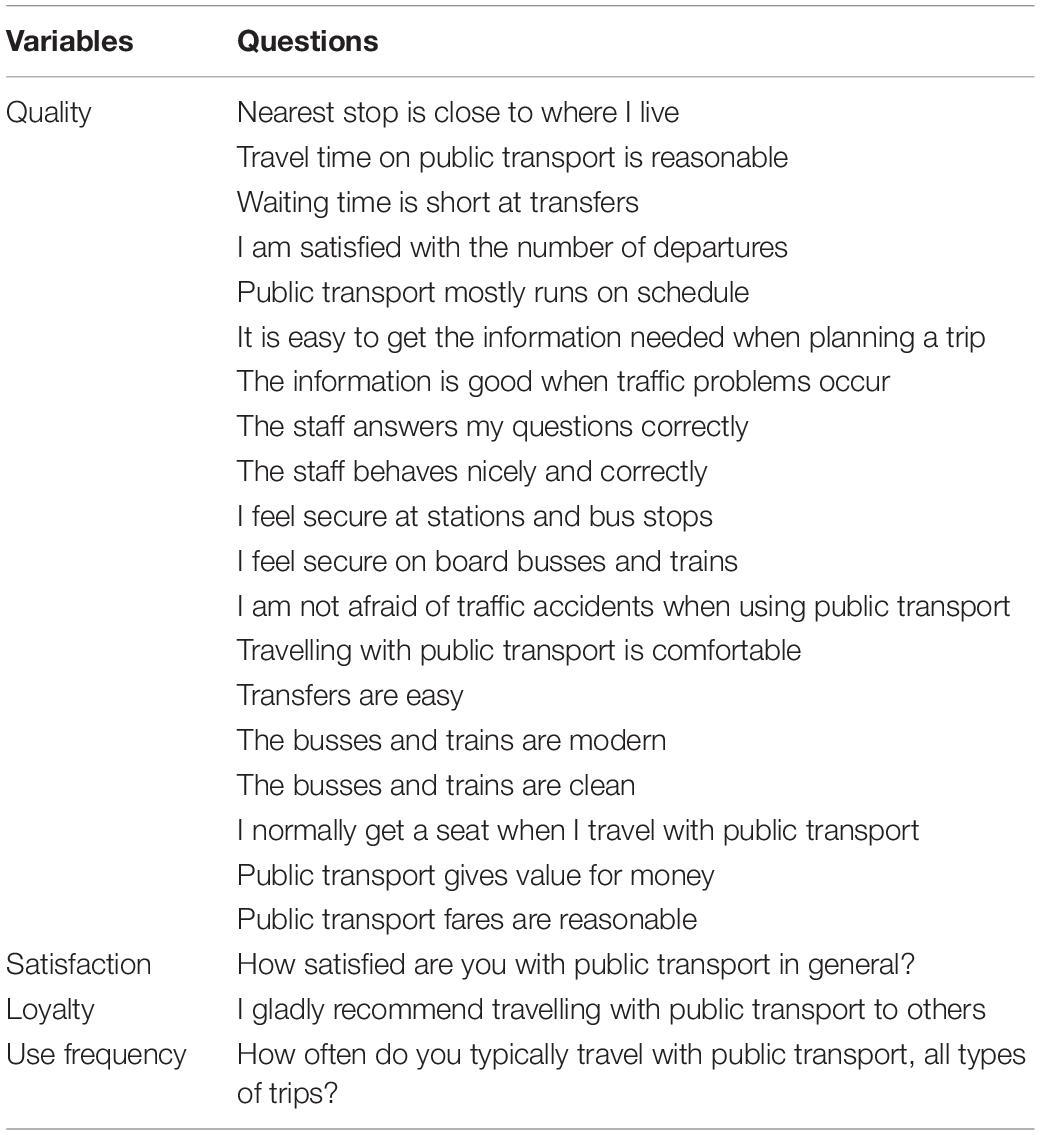
Table 1. The questions measuring quality, satisfaction, loyalty, and user frequency.
In the analysis performed by Ingvardson and Nielsen (2019), loyalty was defined as “willingness to recommend the service to others.” This is just one of the several dimensions of loyalty discussed above, and the limitation was partly due to the coverage of the BEST survey. However, it can be said that focusing on recommendation has a particular importance when we discuss how to increase public transport usage. While “continuing to use X” just means retention of usage, “recommending X to others” can be understood as diffusion of usage because a recommendation can propagate a positive evaluation in the community, and it can lead to an expansion of the service usage. The present study also follows the definition of loyalty by Ingvardson and Nielsen (2019).
The present study analyzes data collected in four cities (Stockholm, Oslo, Helsinki, and Copenhagen) during 15 years (from 2001 to 2015) as the data from the other cities include shorter time series. The total sample size is n = 66,874 (ranging from 4003 in 2004 to 6337 in 2013).
Data Handling and Pre-processing
We used 19 variables shown in Table 1 as the scores of service quality and composed a single quality variable by averaging the 19 scores. Ingvardson and Nielsen (2019) composed a multi-dimensional quality scale from the 19 items, but in this study, we will estimate a VAR (vector auto regressive) model in which the length of time series restricts the number of computable endogenous variables. Thus, the constraint did not allow for inclusion of several dimensions of service quality together with satisfaction, loyalty, and frequency of use. However, Cronbach’s alpha of the 19 quality items, a measure of internal correlations of multi-item scales, was high (0.876). The high alpha suggests a sufficient consistency across the 19 component variables, and therefore, we supposed that an averaged single variable of service quality can be used to analyze overall relations between quality and the other variables.
Frequency of use is measured by five categorical levels (Daily, A few times per week, A few times per month, Less than monthly, and Never). To use them in the quantitative analysis, a reinterpretation was made of those levels into expected numbers of usage per month (“Daily” as 28, “A few times per week” as 12, “A few times per month” as 3, “Less than monthly” as 0.5, and “Never” as 0).
We had answers from around 1000 respondents in each country and year (66,874 cases in total as mentioned above), but the cases that did not report frequency of use were omitted, and we took average by year. Thus, we now have four time-series variables (quality, satisfaction, loyalty, and frequency) that contain 15 time periods, respectively.
VAR Model
We applied VAR analysis to investigate the lagged causal relations among service quality, satisfaction, loyalty, and frequency of use. The general structure of an n-equation VAR(m) model can be written as
where Xt is the n×1 vector of endogenous variable at time t, A0 is an n×1 constant term or intercept vector, A1 through Am are n×n coefficient matrices, and vt is a corresponding n×1 disturbance vector. By estimating a VAR model, we can explore the causal effects among all variables with time lags and identify the direction of the effect in each pair of variables, which is hardly tested by cross-sectional analyses. Note that all variables in the VAR model were averaged over four cities.
Results
Dickey–Fuller Unit Root Test
Before estimating a VAR model, a unit root test for the original time series, which assesses the stationarity of each series, should be performed in order to avoid the spurious regression problem (Said and Dickey, 1984). The results from the Augmented Dickey–Fuller unit root test are shown in Table 2. Because null hypotheses (the series possess unit roots) were not rejected, we took first differences of each variable to secure stationarity. Table 3 shows means and standard deviations of all original and differenced series. The first differences are used as endogenous variables in VAR model estimation. Figure 1 shows the transition of values of quality, satisfaction, loyalty, and frequency of use (average of all valid observations in four cities).
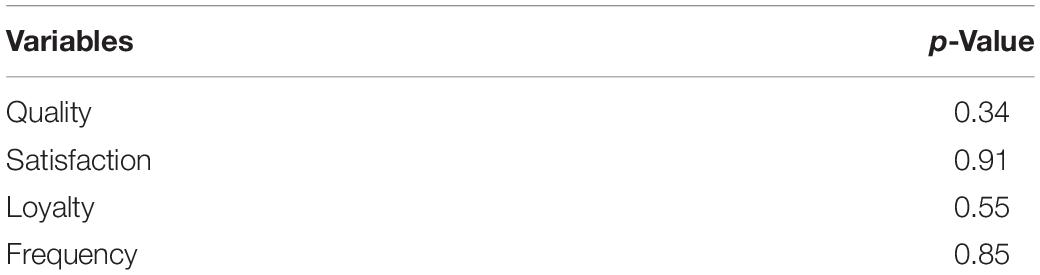
Table 2. The results of Augmented Dickey–Fuller unit root test for the variables.
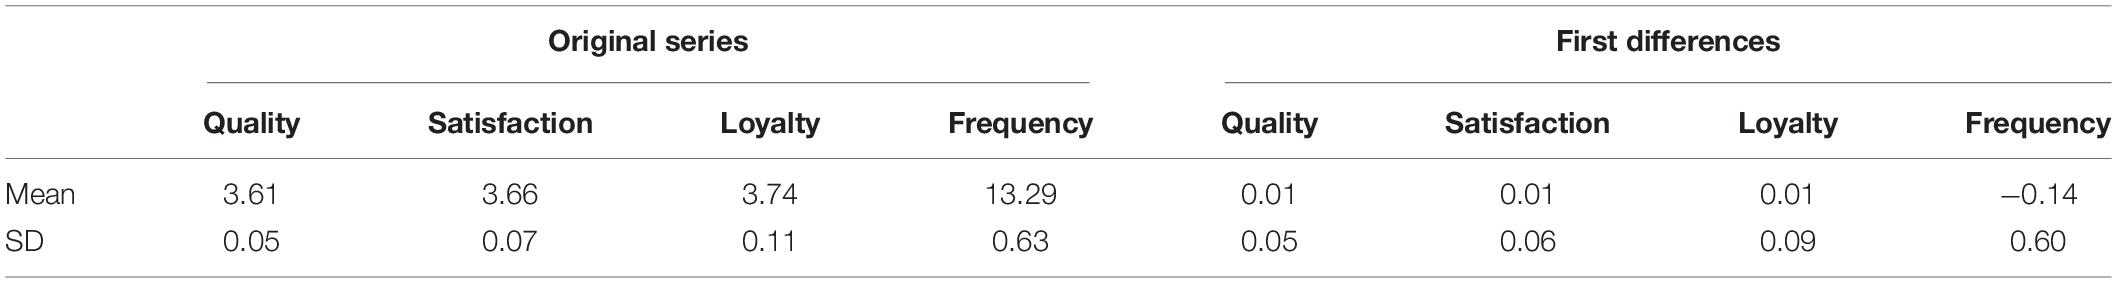
Table 3. Descriptive statistics for original series and first differences of quality, satisfaction, loyalty, and frequency.
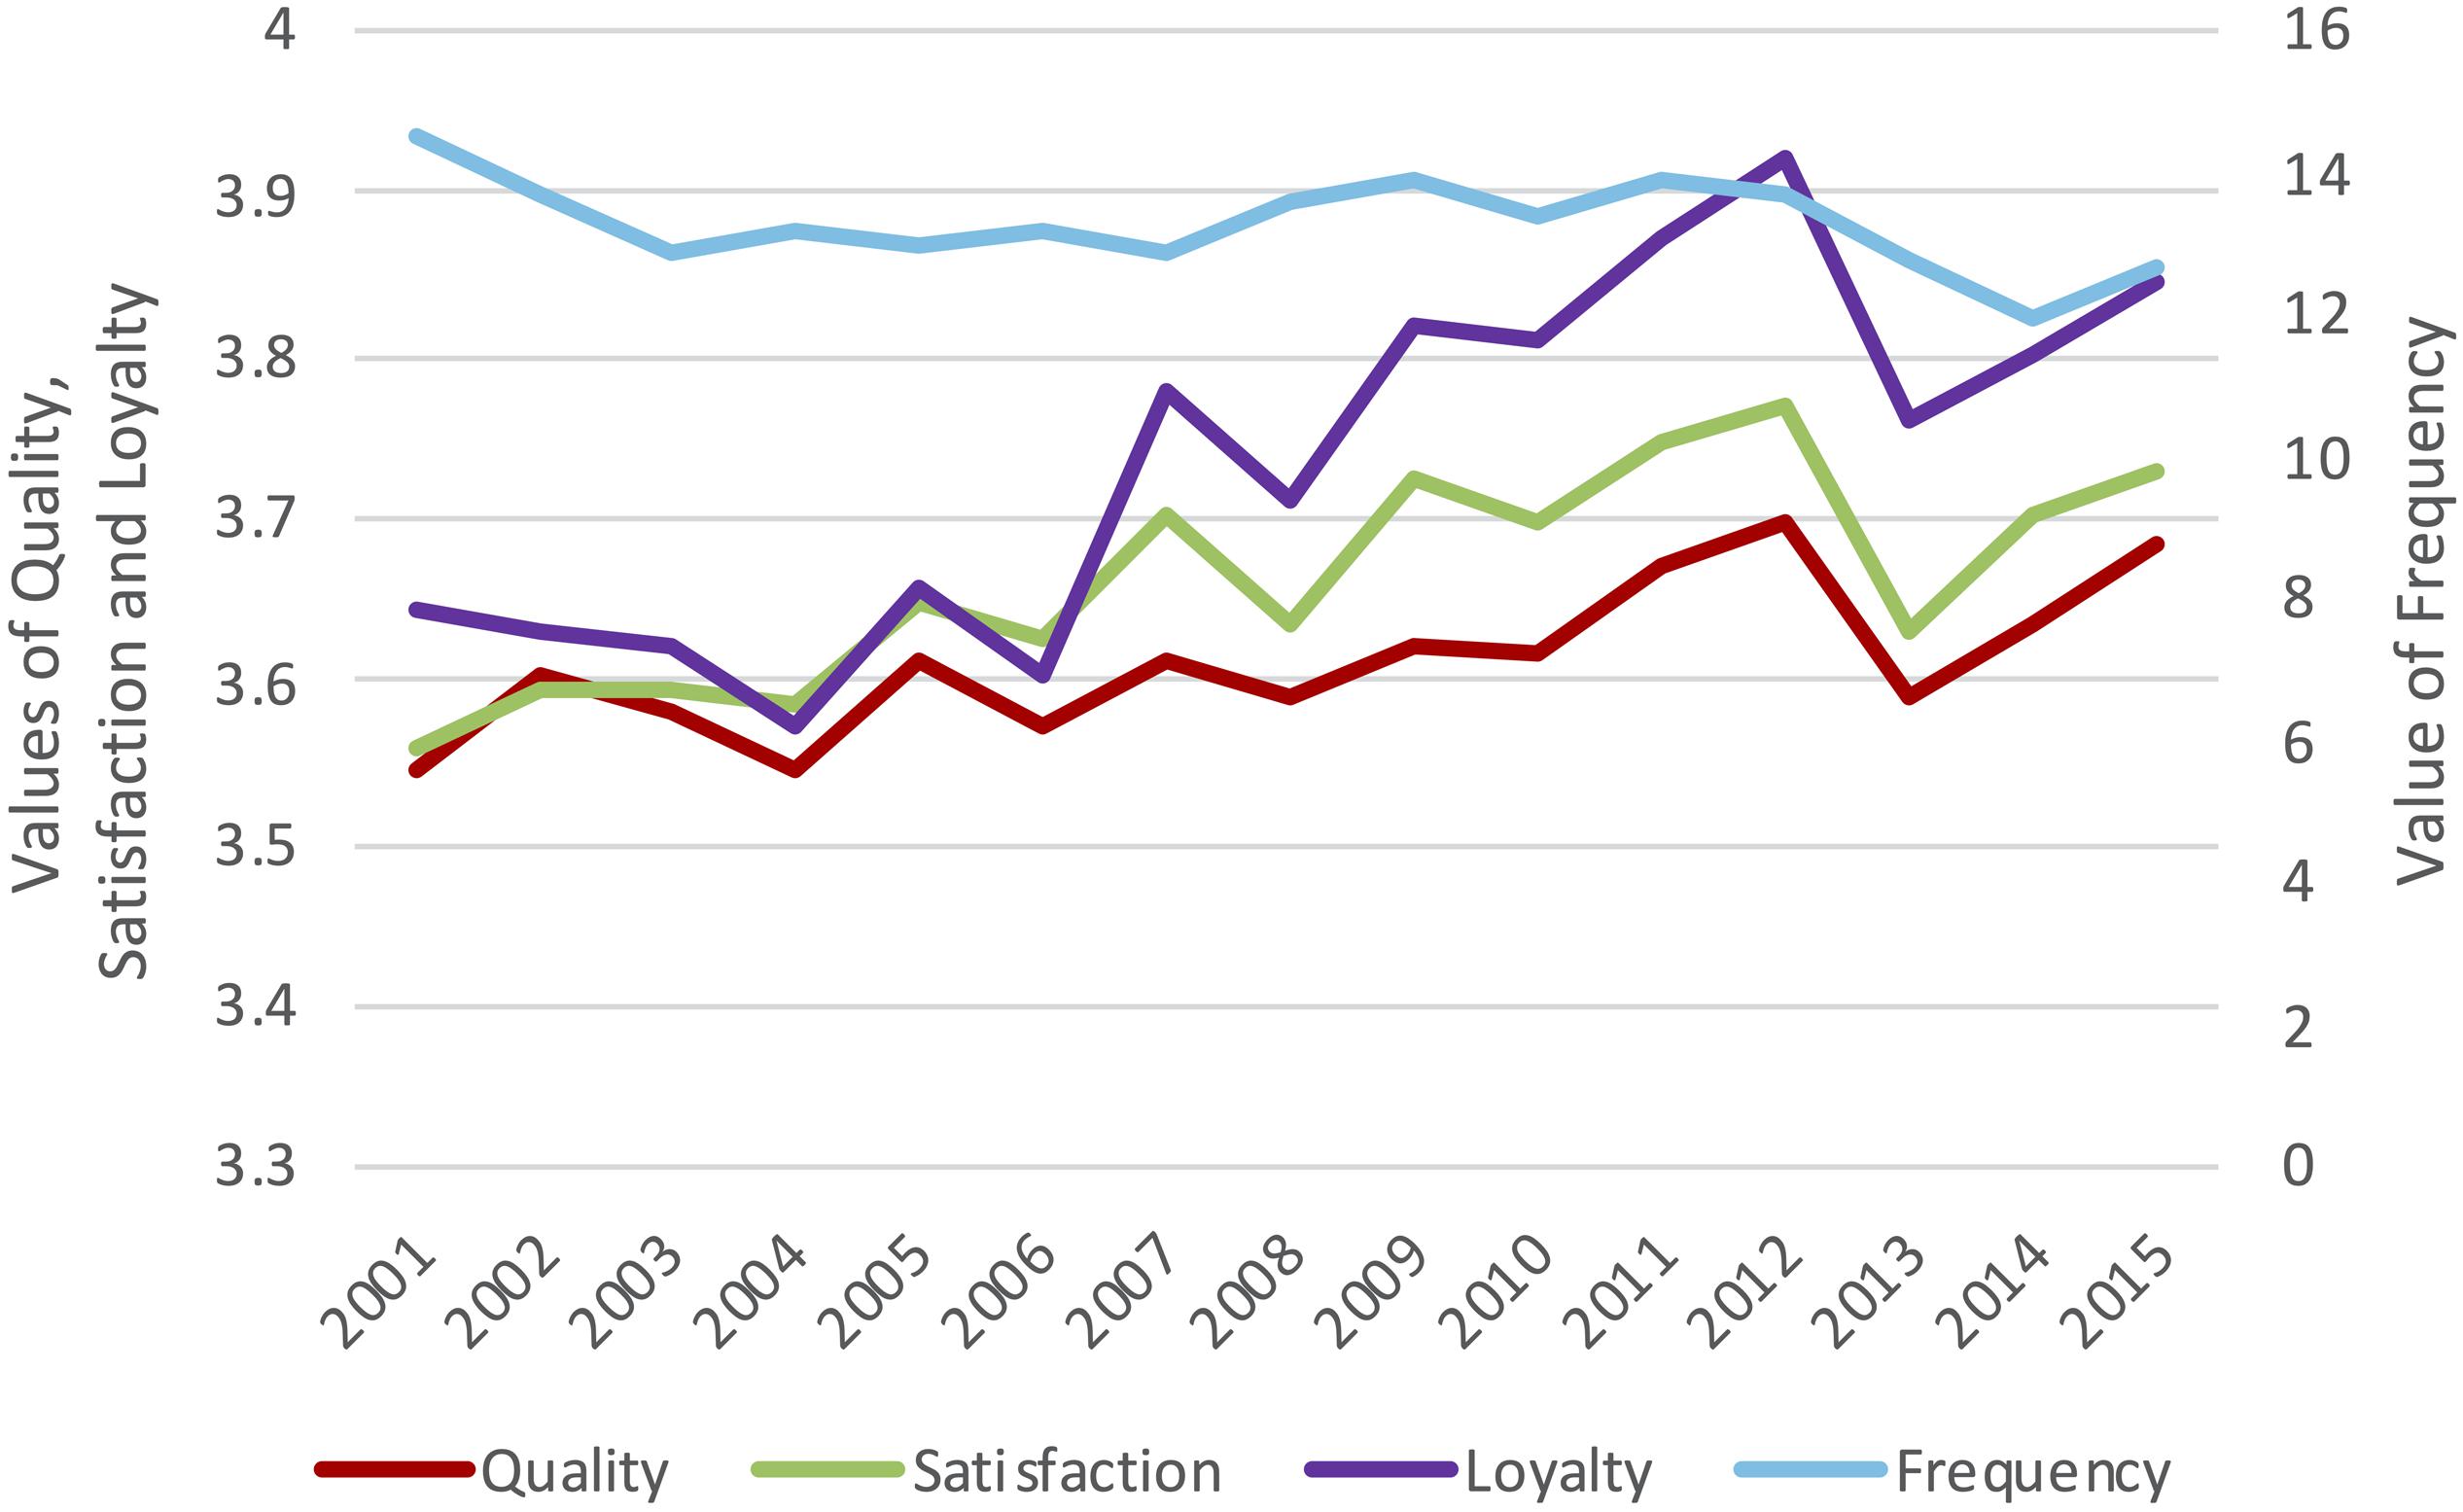
Figure 1. Transitions of average values of quality, satisfaction, loyalty, and frequency.
Estimated Coefficients
Before implementing VAR analysis, we also need to decide the lag order (the length of time lag to be considered) of the model (Hacker and Hatemi-J, 2008). According to AIC criteria, 1 is indicated to be the optimal order (HQ, SC, and FPE also indicated the same optimal order). Then, we estimated VAR (1) model for the dataset. The estimated coefficients are shown in Tables 4–7. Note that all explanatory variables are first-order lag terms.
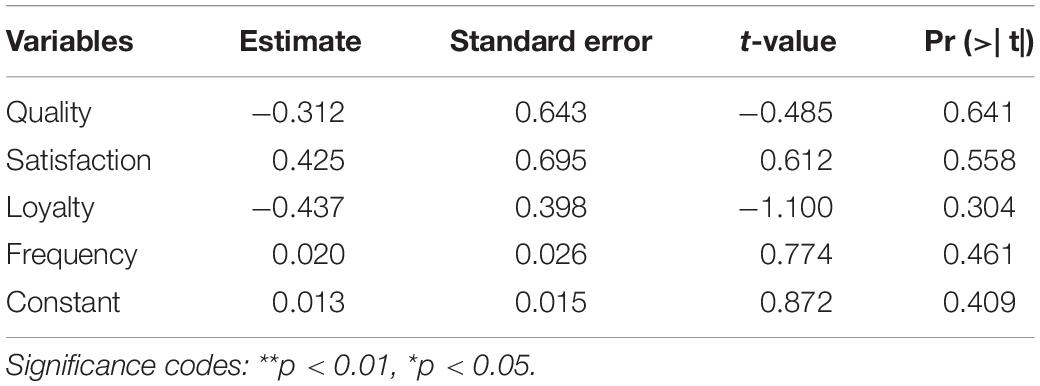
Table 4. Coefficients (response variable: quality).
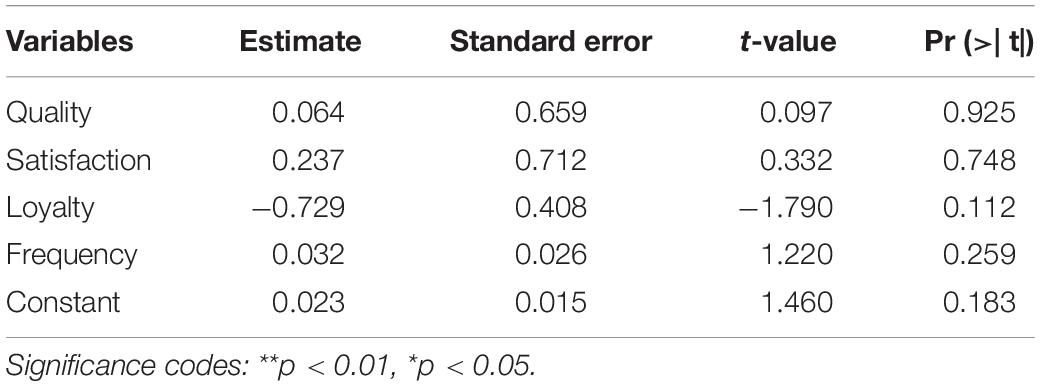
Table 5. Coefficients (response variable: satisfaction).
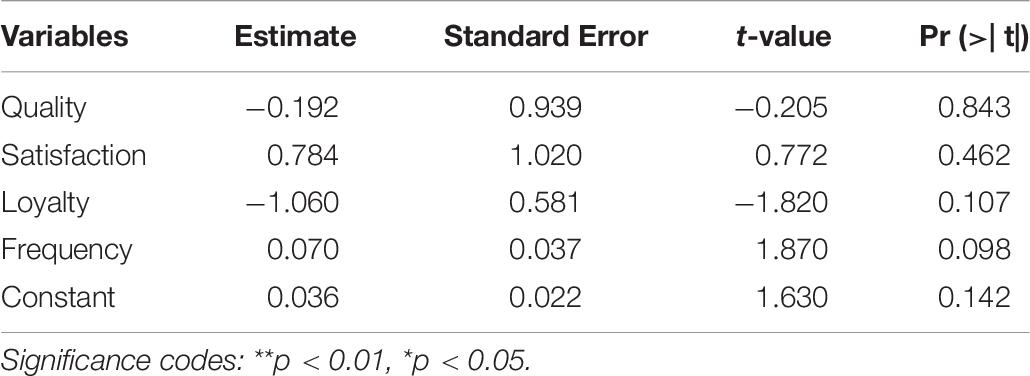
Table 6. Coefficients (response variable: loyalty).
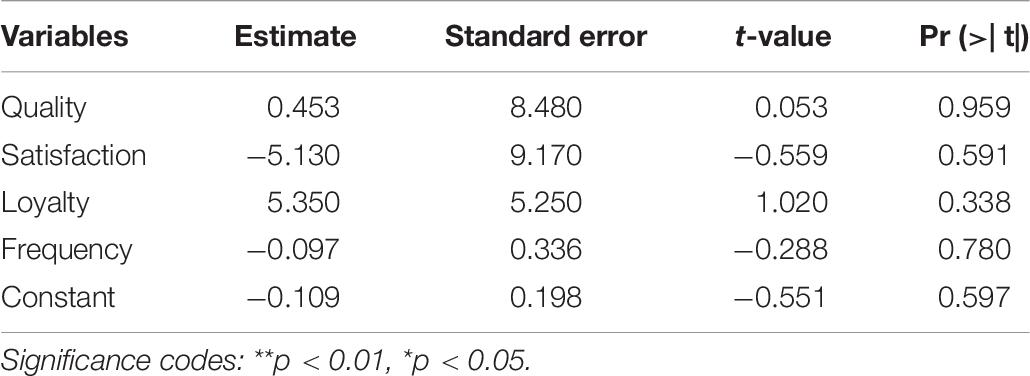
Table 7. Coefficients (response variable: frequency).
As shown in the tables, no significant coefficients were found at the 5% level. However, those figures mean “direct” effects. A VAR model is a system of interdependent variables, and it is hard to interpret direct effects, respectively. The total effects considering the dynamic interdependence can be described as impulse response functions. An impulse response function shows the effect of a shock in disturbance term of an impulse variable on a response variable evolving over time.
Impulse Response Function
The impulse response functions we calculated until the fifths period based on the estimated VAR are shown in Tables 8–11. In the tables, the stars attached to period numbers show that a significant effect from the impulse variable is observed at the time period (∗ for 90% and ∗∗ for 95% significance). The significance is judged by whether the lower bound of confidence interval exceeds zero.
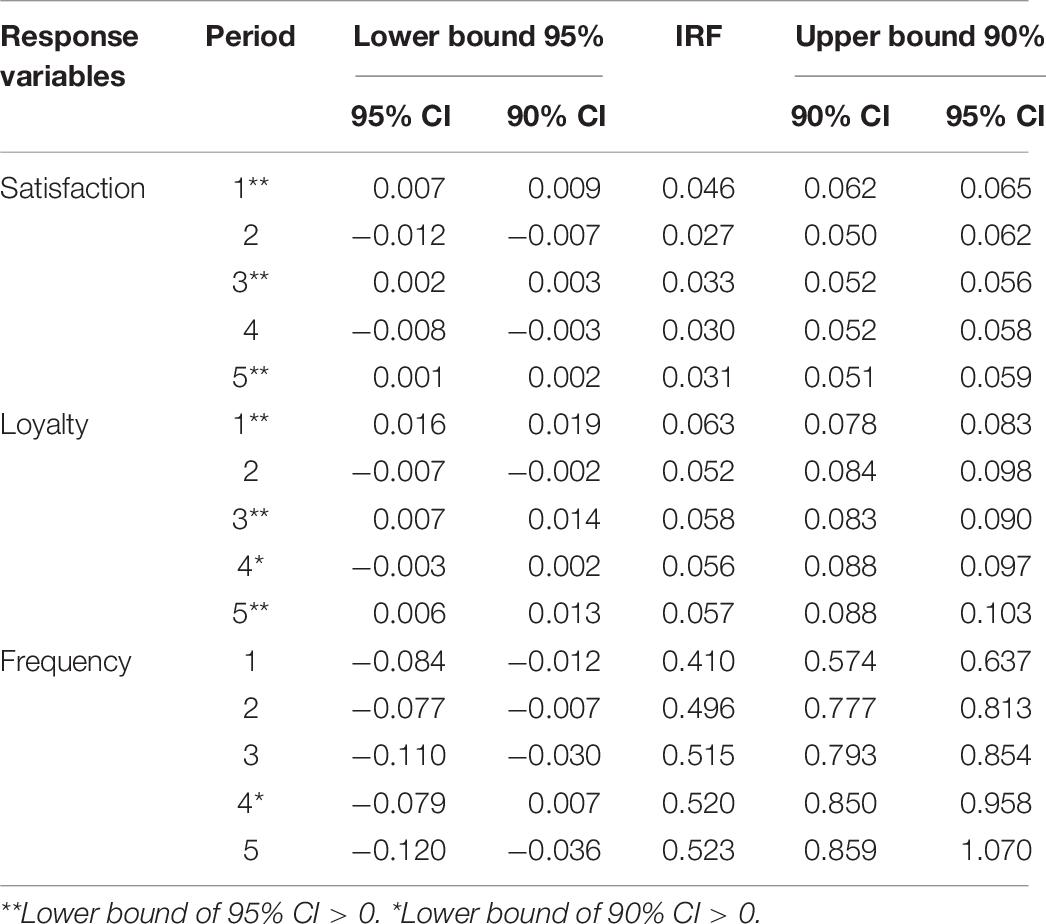
Table 8. Impulse response functions from quality and confidence intervals.
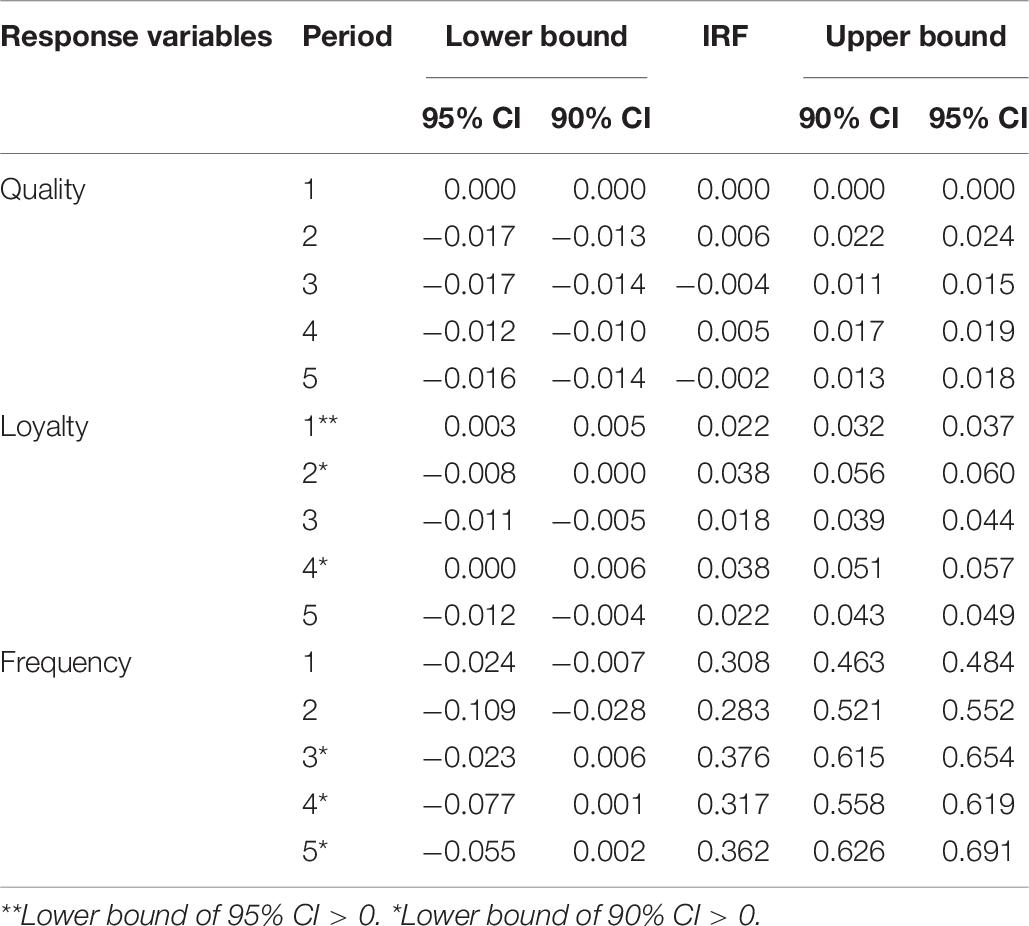
Table 9. Impulse response functions from satisfaction and confidence intervals.
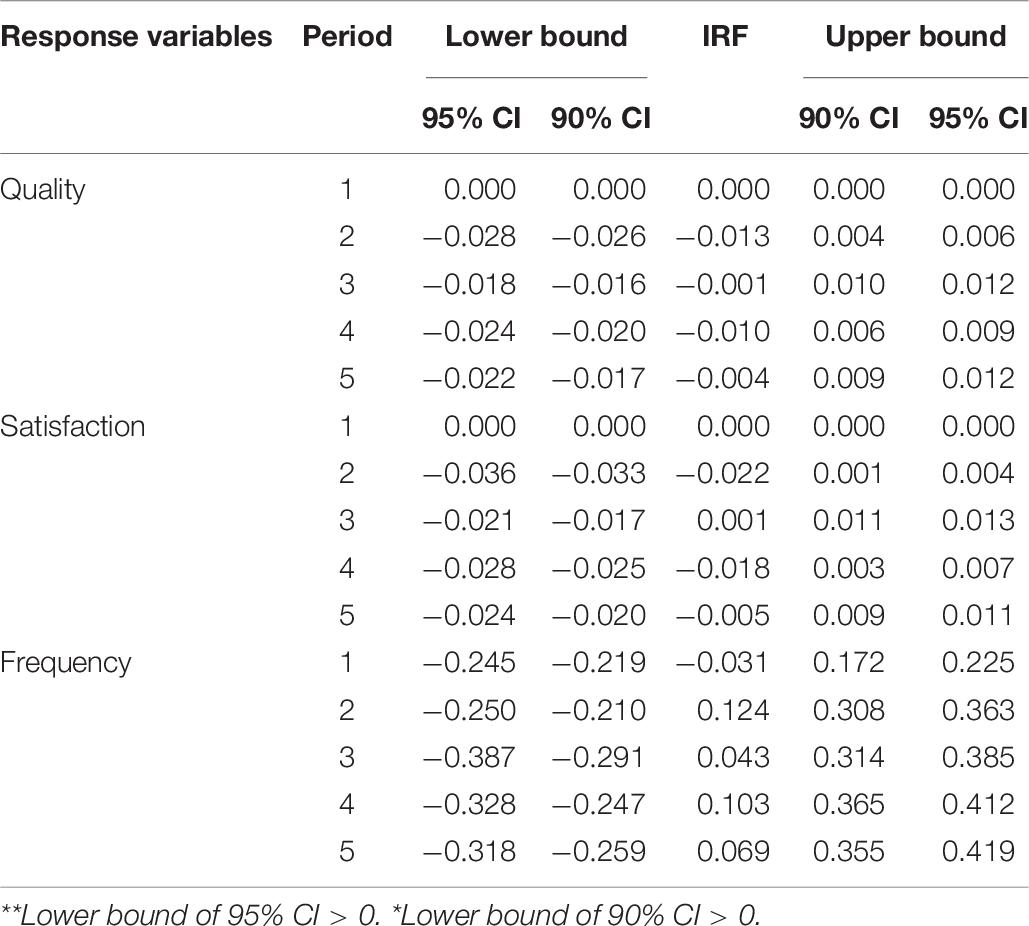
Table 10. Impulse response functions from loyalty and confidence intervals.
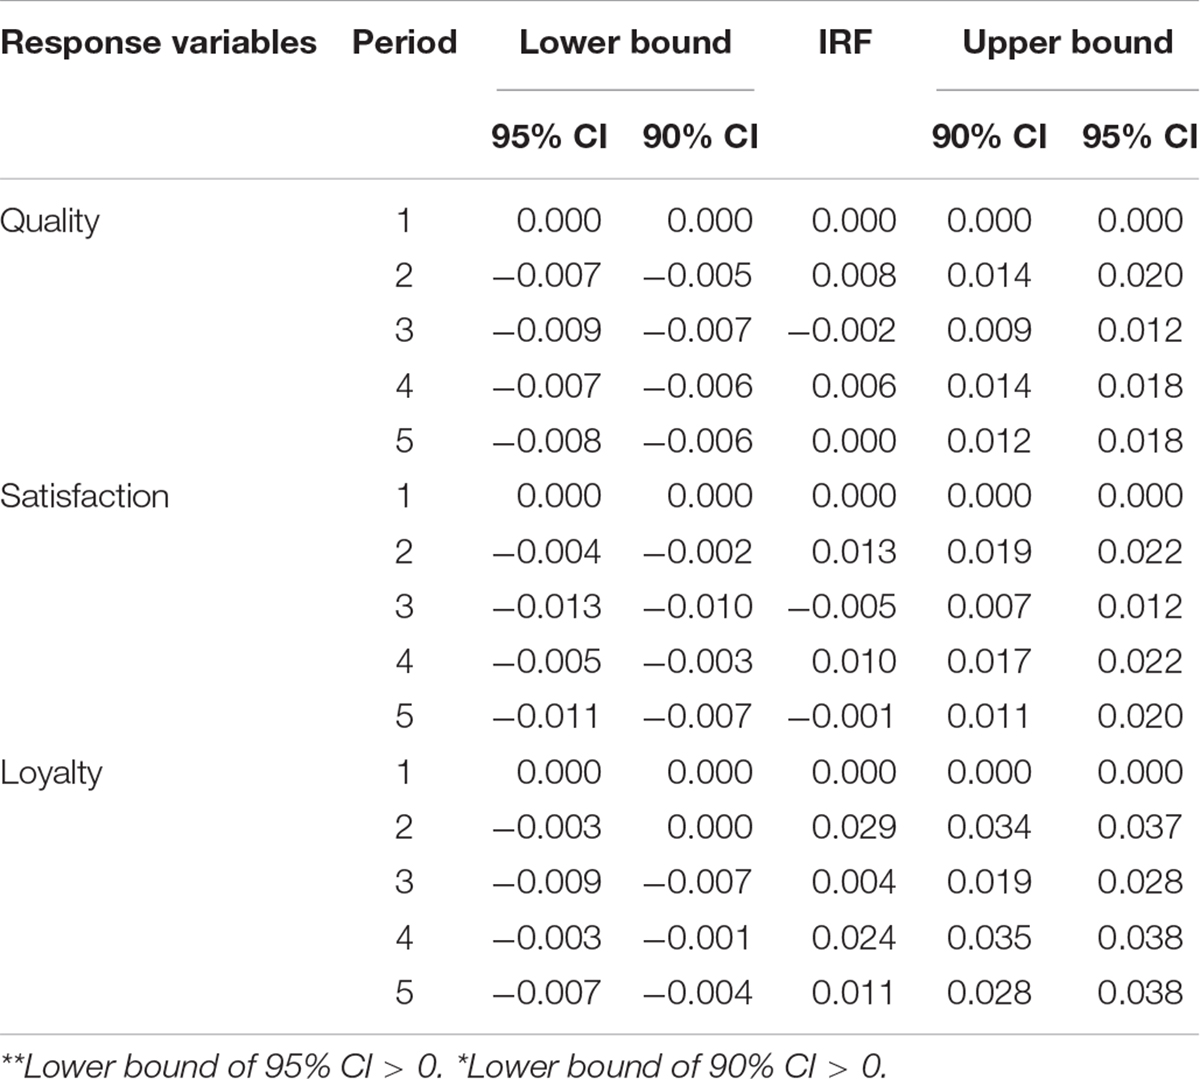
Table 11. Impulse response functions from frequency and confidence intervals.
An impulse response function provides the series of changes in response variable at the future periods when a shock occurred in the error term of impulse (explanatory) variable at the first period. If a change in response variable at a certain period is significant or marginally significant, we can conclude that there is a causal effect from the impulse variable to the response variable (Hahn and Park, 2012).
Path Diagram
Figure 2 shows a path diagram summarizing all the significant or marginally significant effects based on impulse responses obtained in the previous section. We tested all pairs and directions of causality but displayed only paths in which a significant or marginally significant effect is observed at one period at least.
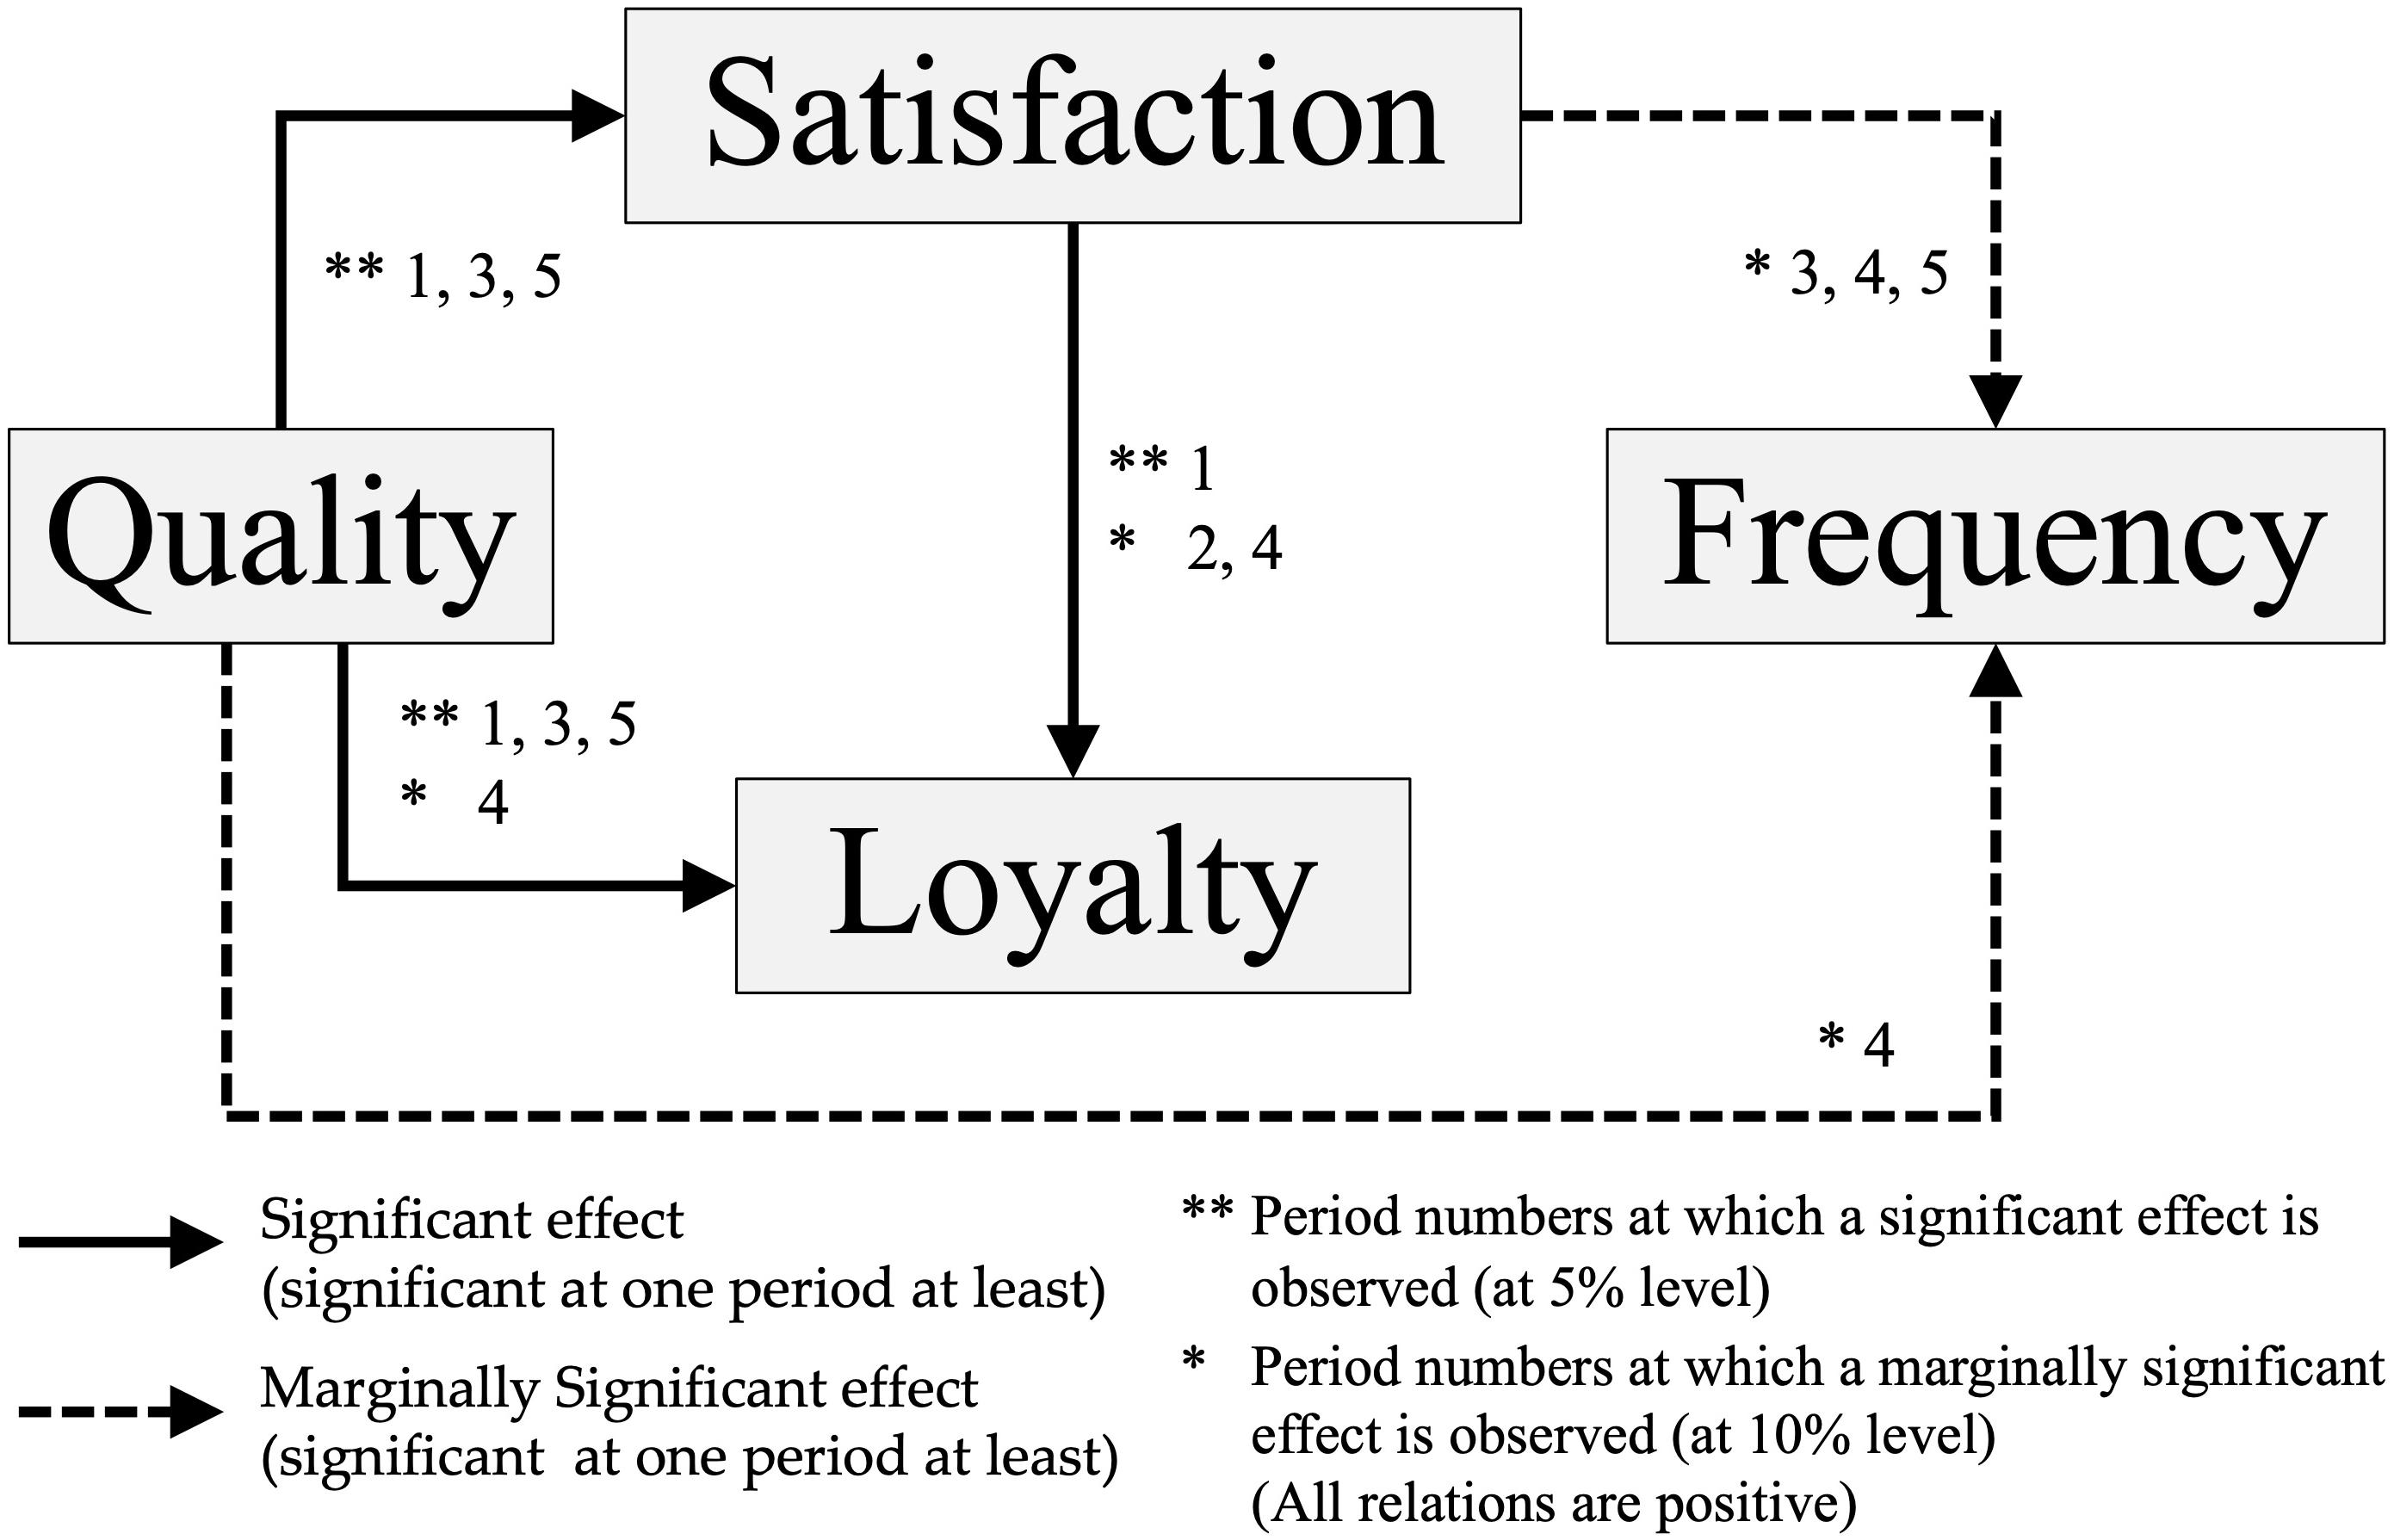
Figure 2. Path diagram form the results of impulse response function.
As shown in the diagram, if subjective quality increases, then satisfaction, loyalty, and user frequency significantly increase with 1-year and/or a-few-year lags. Furthermore, if satisfaction increases, then loyalty and user frequency significantly increases. It was also found that the shortest time lags of the effects on satisfaction and loyalty (i.e., psychological variables) were all 1, but those on frequency (i.e., behavioral variable) were longer than 1.
Discussion
Causal Effects Among Quality, Satisfaction, Loyalty, and Frequency of Use
Previous studies (Lai and Chen, 2011; Frank et al., 2014; Ingvardson and Nielsen, 2019) have investigated the relationships between subjective evaluations of quality, satisfaction, loyalty, and frequency of use based on cross-sectional analyses. However, as cross-sectional analyses usually do not identify the directions of causality, this study used the BEST survey as time series to identify the causal effects by testing the intertemporal relations among variables. The results show that the causal effects from quality to satisfaction, loyalty, and frequency of use, and those from satisfaction to loyalty and frequency are significant, and support the hypothesis suggested by previous studies (Bloemer and de Ruyter, 1998; Frank et al., 2014; De Vos et al., 2016). We can also note that no significant effects in the inverse directions were observed. For instance, Figure 2 clearly shows that there are no influences from satisfaction to quality. This suggests clear pre–post relations between quality and satisfaction, which means that impacts of quality modification will lead to changes in satisfaction over time. All the findings above considered, our hypotheses of causal directions are statistically supported. Thus, subjective evaluations of service quality in public transport can be seen as an important key when developing and creating plans for a sustainable society.
We also found that the time lag for behavioral modifications after quality changes take a longer time than psychological modifications, as observed in the impulse response functions. This result shows that behavioral modifications will occur a few years later, in contrast to psychological modifications that occur immediately after changes in causal variables. This is consistent with the implications from previous studies such as Prochaska and DiClemente (1984) and Friman et al. (2017).
Our VAR analysis did not show any significant effect from loyalty to frequency of use. A possible reason for this is that loyalty was measured as willingness to recommend public transport to others. It is noted that recommendations may not easily lead to an increased frequency of use. More extensive research is needed to interpret and understand these results; however, the result has an important implication. If loyalty defined as willingness to recommend (i.e., the psychological aspect of loyalty) truly has less impact on frequency of use than satisfaction, it may be better for public transport managers to pay more attention to the satisfaction of their customers, rather than focusing on whether they want to recommend it to their family, friends, and colleagues. Moreover, high expectations for customer-to-customer propagation of use may offer disappointing outcomes.
Policy Implications
The first policy implication from the present study is, as expected hypothetically, that increasing users’ subjective evaluation of service quality plays a significant role in improving user satisfaction, loyalty, and user frequency. To keep our society sustainable, city and transport planners are required to address how to improve the quality of public transport. This has been suggested by previous studies, although this study provides more certain evidence of the relationships by showing the causal relations based on a time-series analysis.
The second policy implication is that improving subjective quality can lead to behavioral change. Public transport managers are, of course, required to continue to improve the objective level of their service. However, the result that changes in perceived quality drive frequency of use suggests that the managers have wider options. Subjective evaluation of a service can change in various ways. For example, persuasive communication, advertisement, or relatively slight modifications of the service without changing speed, capacity, or fare could cause a significant growth in use of the services, as long as those interventions improve customers’ perceptions.
Finally, considering the results of this study, public transport managers must continue efforts of improving the service quality at least for several years, even if no immediate increase in demand is observed. Our time-series analysis implies that behavioral change will not occur immediately after the changes in psychological factors such as subjective quality and satisfaction. Therefore, managers must evaluate the results of the modifications of their services from a long-term perspective.
Remaining Issues
This study still has some limitations, and there are remaining issues to be addressed in the future.
Firstly, due to a constraint of VAR analysis, we did not consider service quality of public transport as a multi-dimensional factor. Thus, cost, comfort, safety, and other aspects of service can have different causal effects on user satisfaction, loyalty, and user frequency. This should be elaborated on in further research.
Secondly, this study analyzed only the impact of change in subjective quality. However, for transport managers, the relation and the difference between objective and subjective quality are also important. For example, analyses that combine the BEST data and time-series data of objective quality in the same cities are desirable works in the future.
Finally, loyalty in our analysis was defined as user’s willingness to recommend the service to other people, but loyalty as a willingness to use the service repeatedly is also an important factor to be monitored. The BEST data do not have any information on the latter, but further research using other data sources is required to gain deeper understanding of customer retention.
Data Availability Statement
The data analyzed in this study is subject to the following licenses/restrictions: The dataset is available under the approval of the BEST organization. Requests to access these datasets should be directed to http://benchmarkingpublictransport.org/.
Ethics Statement
Ethical review and approval was not required for the study on human participants in accordance with the local legislation and institutional requirements. Written informed consent from the participants was not required to participate in this study in accordance with the national legislation and the institutional requirements. However, participants were informed of the purpose of the survey and that they could refuse to answer any questions (or drop out of the survey) to secure their complete voluntariness.
Author Contributions
TR and YK performed statistical analysis and co-wrote the manuscript. SF decided the basic design of the research and directed data analysis. MF, LO, and KL provided the empirical data from the BEST organization, background information of the research topic, and conceptual ideas of analysis. SF, MF, LO, and KL reviewed and edited the manuscript. All authors contributed to the article and approved the submitted version.
Funding
This research was financed by the Anne-Marie and Gustaf Ander Foundation (visiting professor’s grant) and by the Swedish Energy Agency (Grant no. 46918-1).
Conflict of Interest
The authors declare that the research was conducted in the absence of any commercial or financial relationships that could be construed as a potential conflict of interest.
References
Abenoza, R. F., Cats, O., and Susilo, Y. O. (2017). Travel satisfaction with public transport: determinants, user classes, regional disparities and their evolution. Transport. Res. A Policy Pract. 95, 64–84. doi: 10.1016/j.tra.2016.11.011
Adler, M. W., and van Ommeren, J. N. (2016). Does public transit reduce car travel externalities? Quasi-natural experiments’ evidence from transit strikes. J. Urban Econ. 92, 106–119. doi: 10.1016/j.jue.2016.01.001
Beirão, G., and Cabral, J. S. (2006). Enhancing service quality in public transport systems. WIT Trans. Built Environ. 89, 837–845. doi: 10.2495/UT060811
Bloemer, J., and de Ruyter, K. (1998). On the relationship between store image, store satisfaction and store loyalty. Eur. J. Mark. 32, 499–513. doi: 10.1108/03090569810216118
Cats, O., Abenoza, R. F., Liu, C., and Susilo, Y. O. (2015). “Identifying priority areas based on a thirteen years evolution of satisfaction with public transport and its determinants,” in Proceedings of the 94th Annual Meeting of the Transportation Research Board, Washington, DC.
Chou, J. S., and Kim, C. (2009). A structural equation analysis of the QSL relationship with passenger riding experience on high speed rail: an empirical study of Taiwan and Korea. Expert Syst. Appl. 36, 6945–6955. doi: 10.1016/j.eswa.2008.08.056
de Oña, J., de Oña, R., Eboli, L., Forciniti, C., and Mazzulla, G. (2016a). Transit passengers’ behavioural intentions: the influence of service quality and customer satisfaction. Transportmetrica A Transport Sci. 12, 385–412. doi: 10.1080/23249935.2016.1146365
de Oña, J., de Oña, R., Eboli, L., and Mazzulla, G. (2016b). Index numbers for monitoring transit service quality. Transp. Res. Part A Policy Pract. 84, 18–30. doi: 10.1016/j.tra.2015.05.018
De Vos, J., Mokhtarian, P. L., Schwanen, T., Van Acker, V., and Witlox, F. (2016). Travel mode choice and travel satisfaction: bridging the gap between decision utility and experienced utility. Transportation 43, 771–796. doi: 10.1007/s11116-015-9619-9
De Vos, J., Schwanen, T., Van Acker, V., and Witlox, F. (2019). Do satisfying walking and cycling trips result in more future trips with active travel modes? An exploratory study. Int. J. Sustain. Transport. 13, 180–196. doi: 10.1080/15568318.2018.1456580
De Vos, J., and Witlox, F. (2017). Travel satisfaction revisited. On the pivotal role of travel satisfaction in conceptualising a travel behaviour process. Transportation Res. A Policy Pract. 106, 364–373. doi: 10.1016/j.tra.2017.10.009
Eboli, L., and Mazzulla, G. (2007). Service quality attributes affecting customer satisfaction for bus transit. J. Public Transport. 10, 21–34. doi: 10.5038/2375-0901.10.3.2
European Environment Agency [EEA] (2018). Greenhouse Gas Emissions from Transport in Europe. Environmental indicator report 2018. Copenhagen: European Environment Agency [EEA].
Frank, B., Herbas Torrico, B., Enkawa, T., and Schvaneveldt, S. J. (2014). Affect versus cognition in the chain from perceived quality to customer loyalty: the roles of product beliefs and experience. J. Retail. 90, 567–586. doi: 10.1016/j.jretai.2014.08.001
Friman, M. (2004). Implementing quality improvements in public transport. J. Public Transport. 7:3. doi: 10.5038/2375-0901.7.4.3
Friman, M., and Fellesson, M. (2009). Service supply and customer satisfaction in public transportation: the quality paradox. J. Public Transport. 12, 57–69.
Friman, M., Huck, J., and Olsson, L. E. (2017). Transtheoretical model of change during travel behavior interventions: an integrative review. Int. J. Environ. Res. Public Health 14:581. doi: 10.3390/ijerph14060581
Fujii, S., and Taniguchi, A. (2005). Reducing family car-use by providing travel advice or requesting behavioral plans: an experimental analysis of travel feedback programs. Transport. Res. D Transport Environ. 10, 385–393. doi: 10.1016/j.trd.2005.04.010
Gärling, T., Bamberg, S., and Friman, M. (2018). “The role of attitude in choice of travel, satisfaction with travel, and change to sustainable travel,” in The Handbook of Attitudes Volume 2: Applications, eds D. Albarracin, and B. T. Johnson, (New York: Routledge), 562–586.
Hacker, R. S., and Hatemi-J, A. (2008). Optimal lag-length choice in stable and unstable VAR models under situations of homoscedasticity and ARCH. J. Appl. Stat. 35, 601–615. doi: 10.1080/02664760801920473
Hahn, C. H., and Park, C. G. (2012). Direction of Causality in Innovation-Exporting Linkage: Evidence on Korean Manufacturing. Jakarta: ERIA.
Heskett, J. L., Sasser, W. E., and Schlesinger, L. A. (1997). The Service Profit Chain. New York: Simon and Schuster.
Ieda, H., Kanayama, Y., Ota, M., Yamazaki, T., and Okamura, T. (2001). How can the quality of rail services in Tokyo be further improved? Transport Policy 8, 97–106. doi: 10.1016/S0967-070X(01)00002-6
Ingvardson, J. B., and Nielsen, O. A. (2019). The relationship between norms, satisfaction and public transport use: a comparison across six European cities using structural equation modelling. Transport. Res. A Policy Pract. 126, 37–57. doi: 10.1016/j.tra.2019.05.016
Kaplan, S., e Silva, J. D. A., and Di Ciommo, F. (2014). The relationship between young people× s transit use and their perceptions of equity concepts in transit service provision. Transport Policy 36, 79–87. doi: 10.1016/j.tranpol.2014.08.004
Lai, W., and Chen, C. (2011). Behavioral intentions of public transit passengers: the roles of service quality, perceived value, satisfaction and involvement. Transport Policy 18, 318–325. doi: 10.1016/j.tranpol.2010.09.003
Ministry of Land, Infrastructure, Transport and Tourism [MLIT] (2012). The Handbook of Building, Maintaining and Improving Regional Public Transport. Tokyo: Ministry of Land, Infrastructure, Transport, and Tourism [MLIT].
Nash, C., Sansom, T., and Still, B. (2001). Modifying transport prices to internalise externalities: evidence from European case studies. Region. Sci. Urban Econ. 31, 413–431. doi: 10.1016/S0166-0462(01)00059-X
Parry, I. W., Walls, M., and Harrington, W. (2007). Automobile externalities and policies. J. Econ. Literat. 45, 373–399. doi: 10.1257/jel.45.2.373
Prochaska, J. O., and DiClemente, C. C. (1984). Self change processes, self efficacy and decisional balance across five stages of smoking cessation. Prog. Clin. Biol. Res. 156, 131–140.
Reisman, A. (2011). Surrendering the keys: a doctor tries to get an impaired elderly patient to stop driving. Health Aff. 30, 356–359. doi: 10.1377/hlthaff.2010.0261
Rockström, J., and Klum, M. (2015). Big World, Small Planet: Abundance within Planetary Boundaries. Stockholm: Max Ström.
Rockström, J., Steffen, W., Noone, K., Persson, Å, Chapin, F. S. III, Lambin, E., et al. (2009). Planetary boundaries: exploring the safe operating space for humanity. Ecol. Soc. 14:32.
Said, D. E., and Dickey, D. A. (1984). Testing for unit roots in autoregressive: moving average models of unknown order. Biometrika 71, 599–607. doi: 10.1093/biomet/71.3.599
Shefer, D., and Rietveld, P. (1997). Congestion and safety on highways: towards an analytical model. Urban Stud. 34, 679–692. doi: 10.1080/0042098975970
Shen, W., Xiao, W., and Wang, X. (2016). Passenger satisfaction evaluation model for Urban rail transit: a structural equation modeling based on partial least squares. Transport Policy 46, 20–31. doi: 10.1016/j.tranpol.2015.10.006
Shiftan, Y., Barlach, Y., and Shefer, D. (2015). Measuring passenger loyalty to public transport modes. J. Public Transport. 18, 1–16. doi: 10.5038/2375-0901.18.1.7
Sinha, R., Olsson, L. E., and Frostell, B. (2019). Sustainable personal transport modes in a life cycle perspective: public or private? Sustainability 11:7092. doi: 10.3390/su11247092
Taniguchi, A., and Fujii, S. (2007). Promoting public transport using marketing techniques in mobility management and verifying their quantitative effects. Transportation 34, 37–49. doi: 10.1007/s11116-006-0003-7
Transportation Research Board (1999). A Handbook for Measuring Customer Satisfaction and Service Quality, Vol. 47. Washington, DC: Transportation Research Board: United States Federal Transit Administration.
Tsai, J. F., Chu, C. P., and Hu, S. R. (2015). Road pricing for congestion and accident externalities for mixed traffic of motorcycles and automobiles. Transport. Res. A Policy Pract. 71, 153–166. doi: 10.1016/j.tra.2014.10.020
van Lierop, D., Badami, M. G., and El-Geneidy, A. M. (2018). What influences satisfaction and loyalty in public transport? A review of the literature. Transport Rev. 38, 52–72. doi: 10.1080/01441647.2017.1298683
van Lierop, D., and El-Geneidy, A. (2016). Enjoying loyalty: the relationship between service quality, customer satisfaction, and behavioral intentions in public transit. Res. Transp. Econ. 59, 50–59. doi: 10.1016/j.retrec.2016.04.001
Woodruff, R. B. (1997). Customer value: the next source for competitive advantage. J. Acad. Mark. Sci. 25, 139–153. doi: 10.1177/0092070397253006
Keywords: public transport satisfaction, public transport recommendation, public transport user frequency, vector auto regressive modeling, time-series analysis, psychological modification, behavioral modification
Citation: Kawabata Y, Ryo T, Friman M, Olsson LE, Lättman K and Fujii S (2020) Time-Series Analysis of the Causal Effects Among Perceived Quality, Satisfaction, Loyalty, and Frequency of Public Transportation Use. Front. Built Environ. 6:137. doi: 10.3389/fbuil.2020.00137
Received: 28 March 2020; Accepted: 27 July 2020;
Published: 17 September 2020.
Edited by:
Sabreena Anowar, University of Missouri, United StatesReviewed by:
Dea Van Lierop, Utrecht University, NetherlandsAhmed El-geneidy, McGill University, Canada
Copyright © 2020 Kawabata, Ryo, Friman, Olsson, Lättman and Fujii. This is an open-access article distributed under the terms of the Creative Commons Attribution License (CC BY). The use, distribution or reproduction in other forums is permitted, provided the original author(s) and the copyright owner(s) are credited and that the original publication in this journal is cited, in accordance with accepted academic practice. No use, distribution or reproduction is permitted which does not comply with these terms.
*Correspondence: Yuichiro Kawabata, a2F3YWJhdGEueXVpY2hpcm8uOHhAa3lvdG8tdS5hYy5qcA==