 Oliver D. Lamb
 Michael J. Shore1
- 1Department of Geological Sciences, University of North Carolina at Chapel Hill, Chapel Hill, NC, United States
- 2U.S. Army Research Laboratory, Army Research Office, Durham, NC, United States
- 3Adventures With Elephants, Bela Bela, South Africa
Acoustic sensors are increasingly being used in ecological and conservation research, but the choice of sensor can be fraught with trade-offs. In this work we assess the performance of the Raspberry Shake and Boom (RS&B) sensor package for detecting and monitoring African elephants (Loxodonta africana). This is the first documented test of this particular unit for recording animal behavior; the unit was originally designed for detecting tectonic earthquakes and low frequency (<50 Hz) atmospheric acoustics. During a four day deployment in South Africa we tested five RS&B units for recording acoustic and seismic vocalizations generated by a group of African elephants. Our results highlight a varied degree of success in detecting the signals of interest. The acoustic microphone recorded fundamental frequencies of low-frequency (<50 Hz) harmonic vocalizations that were not clearly recorded by more sensitive instruments, but was not able to record higher frequency harmonics due to the low sampling rate (100 Hz). The geophone was not able to consistently record clear seismic waves generated by vocalizations but was able to record higher harmonics. In addition, seismic signals were detected from footsteps of elephants at <50 m distance. We conclude that the RS&B unit currently shows limited potential as a monitoring tool for African elephants and we propose several future directions and deployment strategies to improve the sensitivity of the sensor package.
1. Introduction
Acoustics are an important component of many habitats and in-situ sound recordings offer potentially rich information about the abundance, distribution, and behavior of vocalizing animals in the target area. Cost-effective and scalable acoustic sensors are therefore being increasingly used in ecological research and conservation efforts for monitoring animals (Blumstein et al., 2011; Browning et al., 2017). Results from these studies are providing new insights into animal acoustic signal features (e.g., Stoeger and Baotic, 2016), communication processes within social groups (e.g., Poole et al., 1988), seasonal variability in acoustic behaviors, and spatio-temporal variability of acoustic habitats in which the animals reside (e.g., Thompson et al., 2010a). Acoustic techniques allow researchers to survey wild populations at ecologically meaningful scales without intruding on animal activity and causing unintended stress (Blumstein et al., 2011).
African elephants (Loxodonta africana and Loxodonta cyclotis) have been observed to make broad use of strong low-frequency acoustic vocalizations, or “rumbles” (Poole et al., 1988; Langbauer et al., 1991; Langbauer Jr., 2000; Soltis, 2009; Thompson et al., 2010a; Zeppelzauer et al., 2015; Keen et al., 2017). “Rumbles” are highly harmonic and modulated sounds with fundamental frequencies for adult male African elephants ranging from ~19 Hz (Stoeger et al., 2014) to as low as ~10 Hz (Narins et al., 2016; Stoeger and Baotic, 2016). Studies have suggested that “rumbles” are used to coordinate movement and spacing between social groups, help individuals locate each other, and prompt exploratory or defensive behavior (Poole et al., 1988; McComb et al., 2000, 2003; Narins et al., 2016). The frequency characteristics and structure of “rumbles” may also vary with age (e.g., formant frequencies, min/max frequencies; Stoeger et al., 2014), and changes in reproductive (Poole et al., 1988) and emotional states (Soltis, 2009). Elephants have also demonstrated an ability to respond to seismic waves generated by the acoustic waves from “rumbles” coupling with the ground as well as those generated by high-force locomotion behaviors such as stomping or rapid running (O'Connell-Rodwell, 2007; Mortimer et al., 2018). Wild elephant herds have been observed to respond to artificially transmitted seismic recordings of elephant alarm vocalizations (O'Connell-Rodwell et al., 2006). Responses include defensive “bunching” behavior, greater vigilance by individual animals, orientation toward the source of the signal, and expeditiously leaving the immediate area (O'Connell-Rodwell et al., 2006). This ability may provide elephants a means for long-range communication at distances up to and over 3 km (Garstang, 2004; Mortimer et al., 2018) while discriminating between calls from familiar and unfamiliar individuals (O'Connell-Rodwell et al., 2007). It has been demonstrated that the calling rate of “rumbles” is a useful index of L. africana abundance (Payne et al., 2003). Acoustic sensors can also be used for detecting other acoustically active species (e.g., L. cyclotis; Thompson et al., 2010b; Keen et al., 2017) as well as monitoring for anthropogenic noises from illegal activities such as poaching (Thompson et al., 2010a). Presently, elephants remain at risk due to poaching, habitat loss, and human-elephant conflict arising from damaged crops and buildings, along with infrequent human fatalities (Douglas-Hamilton, 2008; Zeppelzauer et al., 2015).
Acoustic and seismic recording devices offer a means for installing non-intrusive monitoring systems that can autonomously detect elephants and monitor their location, including real-time alarm systems for elephants approaching human settlements or sensitive food supplies (e.g., Zeppelzauer et al., 2015). The choice of which instrumentation to purchase and deploy is fraught with trade-offs. One must take into consideration all of the following: size and weight, power demands, data format and storage, ease of deployment, sensor performance, and costs (for purchase and deployment). Of these, performance of the sensor in recording acoustic and/or seismic waves from the source of interest may the most difficult to assess. In recent years, seismologists have begun exploring the use of low-cost (<$1,000), rapidly deployable stations (i.e., sensor, data recorder, and power source) in temporary seismic deployments (e.g., Anthony et al., 2019). This includes recently developed multi-sensor and data recorder packages such as the Raspberry Shake and Boom (RS&B) that are designed as a plug-and-play solution. The device, and similar variations of the device, are becoming increasingly popular, mainly for home use, educational purposes, and outreach. However, the potential for using the RS&B device for ecological purposes is still unexplored. Here we present the first results of a pilot test performed in South Africa to record African elephant vocalizations and locomotions using multiple RS&B devices. In the following sections we provide a more detailed technical description of the device, describe our data acquisition set-up, highlight key results in seismic and acoustic data, and discuss the overall performance of the RS&B.
2. Materials and Methods
2.1. The Raspberry Shake and Boom Sensor
The RS&B is an all-in-one plug-and-go sensor package designed for seismological and atmospheric acoustic applications developed by Raspberry Shake (Figure 1A). The unit integrates vertical geophone and omni-directional pressure sensors together with a 24-bit digitizer, period-extension circuits, and Raspberry Pi 3 Model B computer into a single enclosure with dimensions of 135 × 110 × 70 mm. The power supply is 5 V DC (2.5 A) and consumption is estimated as 3.1 W at start-up and 1.9 W during running time. Data is recorded at sampling rates of up to a maximum of 100 Hz and are saved on a local SD card (8 Gb, but larger cards can be installed if needed) with an estimated data amount per channel of ~15 Mb/day. By default, time synchronization is based on Network Time Protocol, but a USB GPS module can be connected for situations where an internet connection is not available. Further technical details on the RS&B sensor are detailed in Supplementary Tables S1 and S2 and at https://manual.raspberryshake.org/specifications.html#techspecs (last accessed November 2020). Other variations of the RS&B (but not assessed here) include that with a single vertical geophone (Raspberry Shake 1D), three orthogonal geophones (Raspberry Shake 3D), 1 vertical geophone with 3 orthogonal MEMs accelerometers (Raspberry Shake 4D), and a single pressure sensor (Raspberry Boom). So far, two studies have evaluated the performances of the above sensors for environmental seismology monitoring. Raspberry Shake 1Ds were successful in recording and discriminating rockfall activity above a glacier in the Swiss Alps, demonstrating their potential for use in scientific investigations (Manconi et al., 2018). Raspberry Shake sensors were also used to estimate local magnitudes for earthquakes recorded in Oklahoma, USA, and were found to be suitable for the characterization of local and regional seismicity (Anthony et al., 2019). Despite limitations in design (e.g., sampling rate, weather-proofing), both studies concluded that the relatively low cost of the units make them a realistic candidate for complementing existing seismic networks or for deployment in locations unfeasible for other sensors.
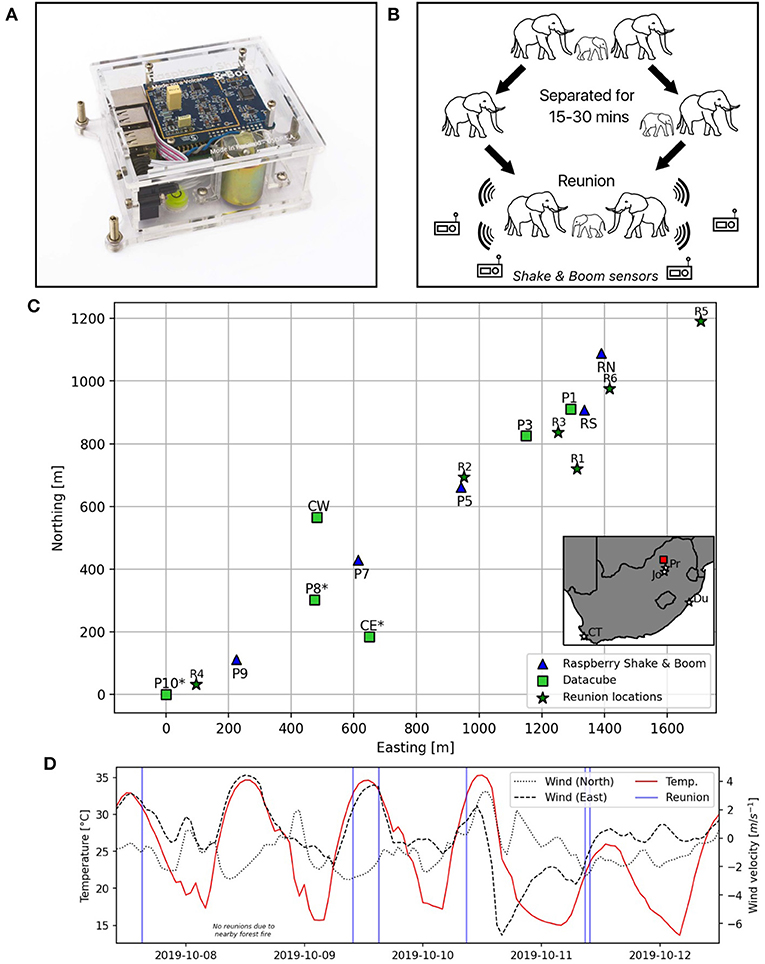
Figure 1. (A) Example of Raspberry Boom and Shake unit (image adapted with permission from https://raspberryshake.org/; last accessed November 2020). (B) Schematic of a reunion event recorded by the sensors. (C) Map showing layout of instrument deployment at Adventures with Elephants, Bela Bela, South Africa. Each station (blue triangles and green squares) is labeled with the assigned station name (note that data from stations marked with * are not used due to technical issues). Reunions (green stars) are labeled with the assigned reunion name. Inset shows location of experiment area (red square) within South Africa. Also marked are locations of Pretoria (Pr), Johannesburg (Jo), Durban (Du), and Cape Town (CT). (D) Temperature (red line) and wind velocities (black) in north (dotted) and eastern (dashed) directions at hourly intervals for the Adventures with Elephants reserve during the deployment of sensors; modified from ERA5-Land dataset via Copernicus Climate Change Service Information (2020). Blue vertical lines indicate times of each reunion during the deployment.
2.2. Experimental Set-Up
Seismic and acoustic recordings were collected from a group of seven African elephants (three female adults, two male adults, and two calfs; aged between 3 and 23 years) located at Adventures with Elephants, Bela Bela, South Africa. The elephants were fully habituated to human presence and free to roam around in a 300 ha savannah reserve. This location was chosen for our study as it allowed us to deploy our sensors with the confidence that we will capture vocalizations from African elephants within their natural habitat without forcing us to move sensors between locations. Vocalizations were recorded during a key social context: bonding after a short (<20–30 min) spatial separation (henceforth referred to as “reunions”; Figure 1B); each separation was implemented by their carers. Before the beginning of the experiment, all protocols and procedures were reviewed and approved by the reserve managers to ensure the safety of the elephants. Over the course of 4 days, six reunions were recorded during daylight hours (no reunions were conducted at nighttime as the herd is stabled in a secure building for their safety) at distances of <50 m to ~2 km to the installed RS&B sensors (Figures 1C,D). The movements of the elephant group(s) prior to and after each reunion was also noted in order to aid the interpretation of recorded data.
In this situation, we installed a local network composed of five stations, each with one RS&B sensor (Figure 1C) powered by a 60 W solar panel and battery to allow 24 h continuous recording; the stations remained in the same locations for the duration of the experiment. Internet was not available at the deployment locations so the sensors were configured to store data locally to be downloaded during their recovery at the end of the test. The standard RS&B enclosure is made of 5 mm thick plastic plates and not suitable for outdoor use, therefore each sensor was placed within a sealable plastic box that was itself buried up to 30 cm into the ground (determined by the height of the box). As the acoustic sensor relies on direct measurement of the atmosphere, we included a hollow rubber tube of up to 1 m length to allow the recording of acoustics outside the plastic box; the tube itself was capped with a porous plastic container designed to reduce wind noise. For comparison purposes, we also installed several stations with more sensitive sensors but, together with the data recorder, represent a more costly option. This includes a Lennartz vertical component seismometer (LE-1DV MkIII), RT Clark 4.5 Hz vertical geophones, InfraBSU infrasound sensor (V2; Marcillo et al., 2012), and Chaparral infrasound sensors (Model 60). Data from these sensors were recorded at sampling rates of 400 Hz on DiGOS DATA-CUBE3 data recorders (type 2); further details on all sensors used are detailed in Supplementary Tables S1 and S2. (Multiple Wildlife Acoustic Song Meter SM2+ acoustic monitoring sensors were also deployed, but are inappropriate for comparison with the RS&B unit due to non-overlapping sensitivity ranges and multiple technical issues, therefore are not discussed here.) Data recorded by all sensors were recorded as or converted to MiniSEED format and visualized using the ObsPy (Beyreuther et al., 2010) and SciPy (Virtanen et al., 2020) python packages. To assess if a station has recorded signals of interest during a reunion event, frequency spectrograms of seismic and acoustic data were analyzed visually for the distinctive harmonic, modulated signals that are characteristic of elephant “rumbles” (Stoeger et al., 2014; Narins et al., 2016). If a signal of interest is thought to be simultaneously recorded by two separate stations, we estimated the magnitude squared coherence between each station within 10 s sliding windows (with 90% overlap) over the total time window of interest. In addition, if the elephants were observed to have roamed within close range (<100 m) of a station location, waveforms, and spectrograms of seismic data from nearby stations were analyzed visually for the signatures of footfalls (Mortimer et al., 2018).
It has been demonstrated that local wind and temperature conditions can have a strong influence on the transmission of acoustic waves (Larom et al., 1997; Garstang, 2004). No regular in-situ measurements of the atmospheric conditions were made during the sensor deployment. Instead, we use ERA5 reanalysis data from the European Center for Medium-Range Weather Forecasts (ECMWF), available via the Copernicus Climate Change Service (https://climate.copernicus.eu/climate-reanalysis, last accessed November 2020). This data has been validated against in-situ observations to demonstrate highly accurate estimations of local temperatures and wind magnitudes (Tetzner et al., 2019). Temperature is calculated at an hourly interval at 2 m height, and wind magnitudes at 10 m above the ground, and results are shown in Figure 1D. The maximum temperature calculated during the sensor deployment was 35.3°C with maximum wind speeds of 7 ms-1. At these conditions, across the maximum distance between two sensors in the deployment (<2 km; Figure 1C), acoustic waves with frequencies of 30 Hz would be affected by up to −100 dB attenuation (Larom et al., 1997; Garstang, 2004). Humidity can also affect acoustic wave transmission, but at much smaller rates compared to temperature and wind (−0.1 to −1 dB km-1; Garstang, 2004), therefore is not considered any further. Variations in topography and vegetation can also have an effect on the propagation of acoustic waves (Garstang, 2004). As the deployment area was relatively flat (maximum vertical difference between stations P9 and P3 of 8 m; Figure 1C), we do not consider topography as having any significant effect on acoustic waves in this experiment. Similarly, as the wavelengths of the acoustic waves of interest are 6–10 m (for 10–50 Hz at 300 ms-1 wave velocity), then we do not expect vegetation density to have an effect.
3. Results
Five out of the six reunion events during the experiment were detected by at least one sensor across all stations in the deployment (Supplementary Tables S3 and S4). None of the reunions were detected by more than four stations, with distances to reunion locations ranging from 30 m up to 1.83 km (Figure 1A). Spectrograms of acoustic and seismic data recorded by all functioning stations are included in the Supplementary Materials (Supplementary Figures 2–13). In the following sections, we highlight details from the acoustic and seismic recordings and include example spectrograms to illustrate the key results (sections 3.1 and 3.2; Figures 2–4). We also include a section detailing examples of non-elephant related seismic and acoustic signals, and how these signals were used to assess the performance of the RS&B unit (section 3.3; Supplementary Figure 1).
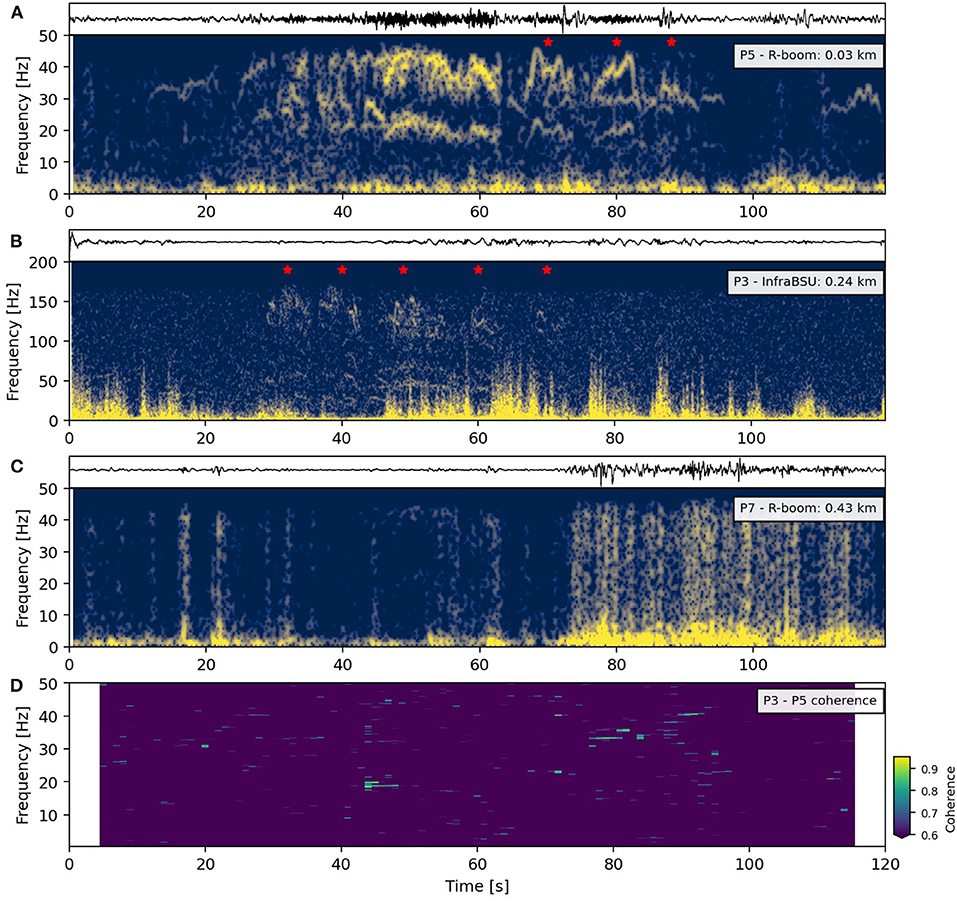
Figure 2. Acoustic waveforms (top panel) and their spectrograms (bottom panel) as recorded by acoustic sensors at three different stations during Reunion 2 for stations P5 (A), P3 (B), and P7 (C). The sensors and distances to the reunion of each station are indicated in the top right of each spectrograms. Note the differing y-axes for the spectrograms due to different sampling rates across sensors. Red stars in (A,B) indicate the timing of an individual elephant vocalization identified in the spectrogram. (C) Estimated magnitude squared coherence for 10 s sliding windows between acoustic signals at stations P5 and P3.
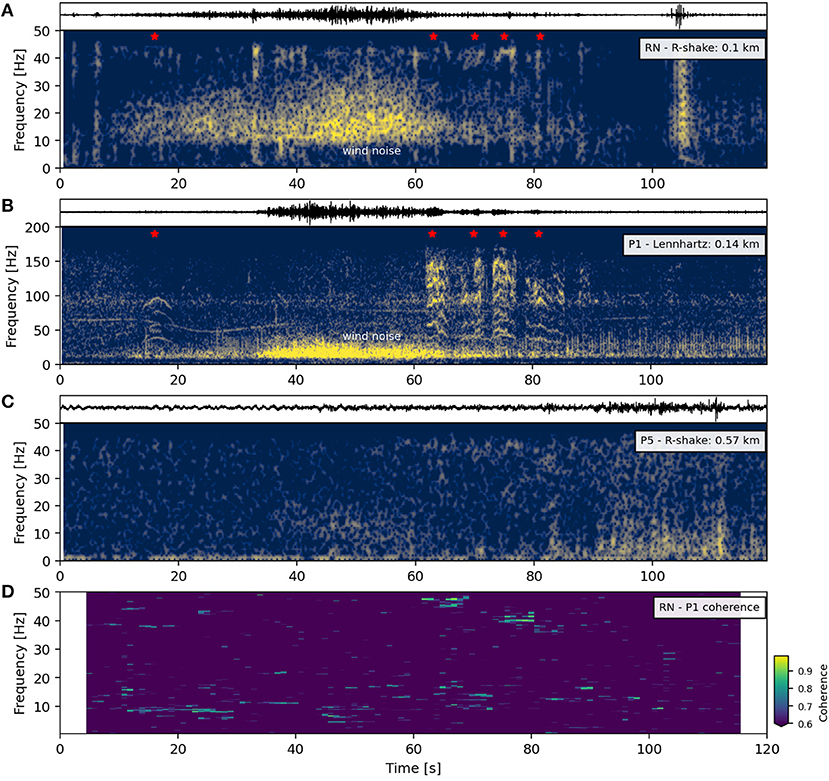
Figure 3. Seismic waveforms (top panel) and their spectrograms (bottom panel) as recorded by seismic sensors at three different stations during Reunion 6 for stations RN (A), P1 (B), and P5 (C). The sensors and distances to the reunion of each station are indicated in the top right of each spectrograms. Note the differing y-axes for the spectrograms due to different sampling rates across sensors. Red stars in (A,B) indicate the timing of an individual elephant vocalization identified in the spectrogram. Wind noise from 30 to 70 s is also indicated in (A,B). (C) Estimated magnitude squared coherence for 10 s sliding windows between acoustic signals at stations RN and P1.
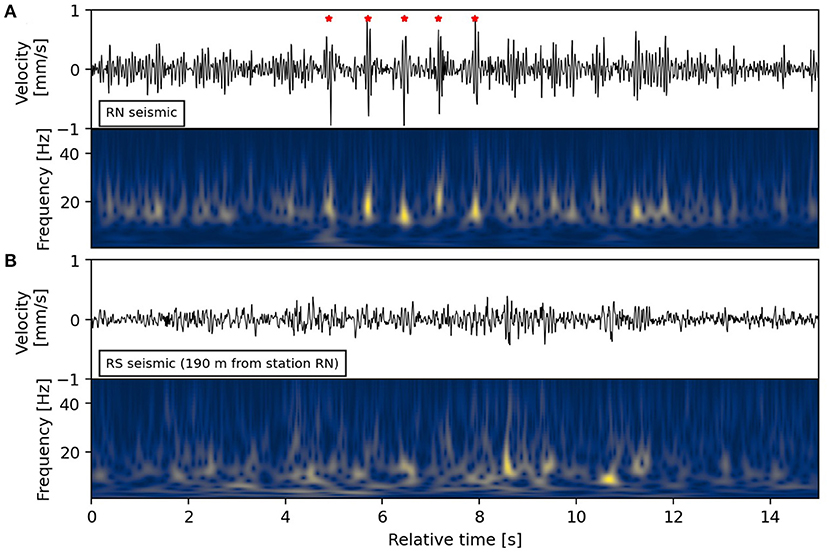
Figure 4. Seismic waveform (top panel) and spectrogram (bottom panel) of footfalls as recorded by Raspberry Shake and Boom geophone sensors at stations RN (A) and RS (B) several minutes prior to Reunion 5. The elephants moved to within 50 m of the location of station RN during this time window, and signals identified as likely footfalls are marked with red stars. The spectrograms were calculated using a continuous wavelet transform due to the small time window.
3.1. Acoustic
Elephant vocalizations were visible in spectrograms from acoustic data recorded at only one RS&B unit during Reunions 2 (Figure 2A) and 6 (Supplementary Figure 13), at a distance of 30 and 120 m, respectively. In comparison, “rumbles” were recorded by the Chaparral or InfraBSU microphones during Reunions 2 (Figure 2B), 3, 5, and 6 with a maximum distance of 1.02 km (Supplementary Figures 7, 11, 13). In the acoustic spectrogram recorded by the RS&B unit at station P5, multiple vocalizations can be seen in Reunion 2 (red stars in Figure 2A) from one or more individual elephants with fundamental frequencies modulated at 19–25 Hz. These particular calls cannot be clearly seen in the acoustic spectrogram recorded by the InfraBSU microphone at 0.24 km distance, but other calls with harmonics up to ~150 Hz can be seen earlier in the reunion event (30–70 s in Figure 2B). The fundamental frequencies of these earlier calls can be seen in the acoustic spectrogram of the RS&B unit at station P5 and modulated at ranges between 19 and 30 Hz (Figure 2A). No obvious “rumbles” can be seen in the acoustic data recorded at 0.43 km distance by a RS&B unit at station P7 (Figure 2C). Estimated coherence in acoustic data at stations P5 and P3 suggest coherent 20 Hz signals at ~45 s and 30–40 Hz signals at 75–95 s (Figure 2D).
3.2. Seismic
Seismic signals from elephant vocalizations were visible in seismic spectrograms recorded by three RS&B units in Reunions 2, 5, and 6 (Figure 3A, Supplementary Figures 4, 10, 12), at distances ranging from 30 m to 0.33 km. In comparison, seismic signals from “rumbles” were recorded by the Lennartz seismometer and RT Clark geophones during Reunions 1, 2, 3, and 6 (Figure 3B, Supplementary Figures 2, 4, 6, 12). Synchronous arrival times at stations >300 m suggests seismic waves are due to ground coupling of acoustic waves from elephant vocalizations (see station P3 in Supplementary Figures 12, 13). In the seismic spectrograms recorded during Reunion 6, at least 5 elephant vocalizations can be recognized by their harmonic and modulated characteristics (red stars in Figures 3A,B). The lowest frequency band seen at both stations is modulated between 36 and 41 Hz, and is interpreted as the second harmonic of the call; the fundamental frequency band is likely obscured by wind noise at 10–30 Hz (Figures 3A,B). The RS&B unit at station RN was only able to faintly record the second harmonic (Figure 3A) but the Lennhartz at station P1 was able to record up to the fourth harmonic at ~140 Hz for at least one call (Figure 3B). No obvious “rumbles” can be seen in the acoustic data recorded at 0.57 km distance by a RS&B unit at station P5 (Figure 3C). Estimated coherence between stations RN and P1 highlights coherent signals between 40 and 50 Hz at 60–80 s (Figure 3D). Other slightly less coherent signals are also seen at <20 Hz throughout, which we attribute to environmental noise (e.g., wind).
Inspection of the seismic spectrogram from station RN reveals that the RS&B unit was successful in recording seismicity generated by locomotion activity by individual animals at distances <50 m from the sensor (Figure 4A). The waveform characteristics (frequency content and waveform shape) resemble seismic data detailed in previous studies for locomotion activity (Mortimer et al., 2018). Sensors at distances >50 m from the elephants did not clearly record the footstep seismicity (Figure 4B).
3.3. Noise and Sensitivity Check
Noise from anthropogenic and natural sources were prevalent throughout the seismic and acoustic data recorded by the RS&B sensors during the 4 day test (Supplementary Figure 1). The three most common sources of noise observed during the sensor deployment were from regional mining activity, light aircraft flying over the site, and wind. Seismicity from blasting activity at mines in the region around the testing location can be clearly recognized in seismic record (Supplementary Figures 1A,B). As the distance from the deployment site to the nearest mining operation (>80 km) is far greater than the deployment length (~2 km; Figure 1C), then it is expected that differences in recorded seismicity caused by inter-station distances would be minimal. With visual inspection, there is little recognizable difference between seismic waves (see peak absolute amplitudes noted in each waveform panel) and their respective spectrograms as recorded by the RS&B unit at station P5 (Supplementary Figure 1A) and the Lennartz seismometer at station P1 (Supplementary Figure 1B). Therefore, any differences in seismic waves caused by the sensitivity of the RS&B geophone and the deployment set-up (i.e., within the plastic container) are minimal.
Acoustic noise from low-flying light aircraft and/or helicopters were also clearly seen in frequency spectrograms as distinguished by the apparent doppler effect (Supplementary Figures 1C,D). In the examples plotted here, the frequency change recorded by the RS&B unit at station RS is “sharper” (i.e., more rapid; Supplementary Figure 1C) compared to the change recorded by station InfraBSU (Supplementary Figure 1D). As all observed planes and helicopters during the experiment were relatively low-flying (<1 km), then this difference can be attributed to relative source-to-sensor distances; i.e., the plane or helicopter was closer to station RS than station P3.
Other sources of anthropogenic noise possibly seen in the seismic and acoustic record include those from land vehicles moving past the sensor plus their engines, and humans walking close to the sensor. The largest source of noise during the test was introduced by wind blowing across the site. Wind introduces broadband frequencies that can obscure signals of interest for periods of time lasting up to several hours (Supplementary Figures 1E,F), including fundamental frequencies of elephant vocalizations (Figures 3A,B). Differences in recorded wind between stations are likely due to variations in vegetation immediately surrounding each station, and also to noise-reducing measures in place at each RS&B unit.
4. Discussion
The overall goal of this test was to assess the viability of an off-the-shelf multi-sensor and data recorder package for detecting and monitoring African Elephants. The RS&B unit was designed for detecting tectonic earthquakes as well as recording atmospheric acoustics waves at infrasonic frequencies (<50 Hz). However, as we demonstrate here, there was mixed success with using the RS&B unit for recording acoustic vocalizations or “rumbles” (Figures 2, 3), and for detecting seismics generated by locomotion activity from nearby elephants (Figure 4). Here we discuss and draw conclusions from the performed test and summarize future directions in the context of African elephant detection and monitoring.
Comparisons between atmospheric acoustics recorded by the different sensors indicate that the RS&B unit has limited potential for detection elephant vocalizations (section 3.1). The low success rate of detection by RS&B unit compared to more sensitive instruments (Supplementary Tables S3 and S4), even with wind noise reduction measures attached, highlights the challenge of using off-the-shelf sensors for field experiments. We propose that high daytime temperatures and wind conditions during the 4 day experiment (Figure 1D) is a key factor in the low success rate of recording elephant vocalizations. For a 15 Hz signal with temperatures at 35°C at ground level, up to −50 dB of attenuation is expected at ranges <1 km (Larom et al., 1997; Garstang, 2004). Similarly, wind velocities of <5 ms−1 at <50 m height would impose −50 to −70 dB attenuation (downwind and upwind, respectively) on a 15 Hz acoustic signal up to 1 km from the source (Larom et al., 1997; Garstang, 2004). Future experiments with the RS&B unit will need to account for the strong attenuating effects of atmospheric conditions by, for example, different deployment strategies or focusing on recording acoustic signals during lower temperatures at nighttime (no reunions were conducted at nighttime during this experiment for safety reasons).
However, details of low-frequency harmonics and modulated nature of “rumble” vocalizations during a reunion event were clearly recorded by the RS&B sensor (Figure 2A). These low-frequency details may be advantageous as the characteristics (e.g., formant frequencies, min/max frequencies) of such vocalizations could be used to distinguish individual animals by age and size (Stoeger et al., 2014; Stoeger and Baotic, 2016). However, based on the results detailed here the sensors would likely have to be located relatively close to the individual animals (<150 m; Figure 2) in order to clearly capture clear and usable acoustic data. Therefore, the RS&B (or it's variation, the Raspberry Boom) would only be viable for deployment in locations where African elephants are known to congregate (e.g., waterholes, subsistence crops, high value tree species).
In contrast to the acoustic microphone, the geophone sensor inside the RS&B unit was able to record seismic activity generated by “rumbles” during more reunions (Supplementary Tables S3 and S4). However, the recordings were often faint and only able to record the second harmonic (Figures 3A,D). Inspection of seismic data recorded at higher sampling rates (Figure 3B) suggests that the geophone could have had greater success if the sampling rate was higher than 100 Hz; higher sampling rates are not currently available for RS&B units. Nevertheless, the RS&B unit was successful in recording seismicity generated by locomotion activity from elephants as they moved within <50 m of the unit deployment location (Figure 4A). Footsteps were not clearly seen in the seismic record at greater distances (>100 m; Figure 4B) which is contrary to previous studies that suggested detection ranges of up to 3.6 km (e.g., Mortimer et al., 2018). The apparent low seismic sensitivity may be due the design of the sensor deployment (i.e., the unit was placed inside the sealable plastic case, itself buried up to 30 cm depth) that may have reduced the geophone sensitivity. Tests on other derivations of this sensor unit ensured proper ground coupling by screwing the sensor unit directly to the rock face using bolt anchors (Manconi et al., 2018). This option was not feasible for our deployment area where the geology is dominated by soft sediment, and construction of concrete vaults was not viable for a 4 day experiment. For future, long-term (i.e., months to years) monitoring of elephants using the RS&B unit, it is recommended that a similar anchoring strategy is adopted, if possible. Nevertheless, despite the low sensitivity of the geophone in the unit, it was still successful in recording seismicity thought to be generated by blasting activity from mines in the region (Supplementary Figure 1A). Comparison with the seismic data recorded by the Lennartz seismometer suggested that the sensitivity of the RS&B geophone was not greatly affected by being deployed inside sealable plastic box. There has been some interest in the effects of anthropogenic activity on elephant behavior. For example, continuous acoustic and seismic monitoring in Gabon, Central Africa revealed that African forest elephants (L. cyclotis) became more nocturnal in areas with dynamite donation for oil prospecting (Wrege et al., 2010). Our observations here suggest that the RS&B unit would be useful for future studies on animal behavior in regions where they may be affected by mining or oil activity.
Future deployments with the RS&B unit must take into account that noise from wind or human activity is likely to be recorded and might interfere with recordings of African elephant vocalizations, even with an attachment on the RS&B unit designed to reduce environmental noise (Figures 3A,B, Supplementary Figures 1E,F). Effective strategies to reduce wind noise at low frequencies (<50 Hz) already exist but involve constructing large and non-portable structures around the microphone (section 1.5 in Marty, 2019). Therefore, efforts to lighten and improve the portability of wind noise reduction designs must be explored and incorporated into the deployment design. Furthermore, the power demands of the unit reduces the potential for using it in remote locations where power may not be readily provided. Our stations were powered by large car batteries that were themselves charged by 60 W solar panels; this design would not be feasible for studies of African forest elephants (L. cyclotis) as the forest habitat may not allow enough daily sunshine to keep the station powered. All the signals described in this study have been interpreted visually from data recorded at individual stations. Future work will be aimed at implementing an algorithm for automatically detecting and classifying seismic and acoustic events (e.g., Zeppelzauer et al., 2015), as well as developing a deployment strategy that would allow automatic location and tracking of animals. Such a system could form part of a future automated early warning network designed for reducing elephant-human conflict where, for example, the RS&B unit may be deployed in an “outer ring” of sensors.
To summarize, we test the off-the-shelf Raspberry Shake and Boom (RS&B) sensor package as an option for detecting and monitoring acoustic and seismic waves generated by African elephants (L. africana) during social vocalizations and locomotion. Our results highlight a low degree of success for the RS&B units in detecting the signals of interest. The acoustic microphone was able to record fundamental frequencies of vocalizations at <50 Hz, but was not able to record higher harmonic frequencies due to the low sampling rate (100 Hz). The geophone was not able to consistently record clear seismic waves generated by vocalizations, but was able to record locomotion activity within a 50 m range. Comparison with more sensitive instruments suggests the RS&B unit would have greater success with a higher sampling rate and an improved deployment strategy. Future work is aimed at reducing noise from wind, developing an improved deployment configuration to improve the geophone sensitivity, and implementing an automated system for detecting and classifying seismo-acoustic signals. Nevertheless, we conclude that once several drawbacks have been addressed, the RS&B unit has the potential to be used as a monitoring tool for African elephants, particularly while complementing an existing array of instruments.
Data Availability Statement
The raw data supporting the conclusions of this article will be made available by the authors, without undue reservation.
Ethics Statement
Ethical review and approval was not required for this animal study, in accordance with the local legislation and institutional requirements.
Author's Note
This research was performed while OL held an NRC Research Associateship with the U.S. Army Research Laboratory/Army Research Office while based at the University of North Carolina at Chapel Hill.
Author Contributions
OL, MS, SL, and SH helped design and conduct the sensor deployment at the Adventures with Elephants reserve. OL, MS, and JL processed and interpreted all the seismic and acoustic data. OL wrote the manuscript, to which all authors have contributed.
Funding
All authors acknowledge funding and support from the U.S. Army Research Laboratory/Army Research Office for this study.
Conflict of Interest
The authors declare that the research was conducted in the absence of any commercial or financial relationships that could be construed as a potential conflict of interest.
Acknowledgments
The authors wish to thank the staff (including the elephants!) at Adventures with Elephants for their support during the sensor deployment. We also wish to thank Branden Christensen and the staff at Raspberry Shake for their technical assistance and discussion on the RS&B sensors. Finally, we would like to thank the editor, William McShea, and the two reviewers for their comments which helped improve the manuscript.
Supplementary Material
The Supplementary Material for this article can be found online at: https://www.frontiersin.org/articles/10.3389/fcosc.2020.630967/full#supplementary-material
References
Anthony, R. E., Ringler, A. T., Wilson, D. C., and Wolin, E. (2019). Do low-cost seismographs perform well enough for your network? An overview of laboratory tests and field observations of the osop raspberry shake 4d. Seismol. Res. Lett. 90, 219–228. doi: 10.1785/0220180251
Beyreuther, M., Barsch, R., Krischer, L., Megies, T., Behr, Y., and Wassermann, J. (2010). Obspy: A python toolbox for seismology. Seismol. Res. Lett. 81, 530–533. doi: 10.1785/gssrl.81.3.530
Blumstein, D. T., Mennill, D. J., Clemins, P., Girod, L., Yao, K., Patricelli, G., et al. (2011). Acoustic monitoring in terrestrial environments using microphone arrays: applications, technological considerations and prospectus: acoustic monitoring. J. Appl. Ecol. 48, 758–767. doi: 10.1111/j.1365-2664.2011.01993.x
Browning, E., Gibb, R., Glover-Kapfer, P., and Jones, K. E. (2017). Passive acoustic monitoring in ecology and conservation. WWF Conserv. Technol. Ser. 1, 1–75. doi: 10.25607/OBP-876
Douglas-Hamilton, I. (2009). The current elephant poaching trend. Pachyderm 45, 154–157. Available online at: https://pachydermjournal.org/index.php/pachyderm/article/view/188
Garstang, M. (2004). Long-distance, low-frequency elephant communication. J. Compar. Physiol. A 190, 791–805. doi: 10.1007/s00359-004-0553-0
Keen, S. C., Shiu, Y., Wrege, P. H., and Rowland, E. D. (2017). Automated detection of low-frequency rumbles of forest elephants: a critical tool for their conservation. J. Acoust. Soc. Am. 141, 2715–2726. doi: 10.1121/1.4979476
Langbauer, W. R., Payne, K. B., Charif, R. A., Rapaport, L., and Osborn, F. (1991). African elephants respond to distant playbacks of low-frequency conspecific calls. J. Exp. Biol. 157, 35–46. doi: 10.1002/1098-2361(2000)19:5<425::AID-ZOO11>3.0.CO;2-A
Larom, D., Garstang, M., Payne, K., Raspet, R., and Lindeque, M. (1997). The influence of surface atmospheric conditions on the range and area reached by animal vocalizations. J. Exp. Biol. 200, 421–431.
Manconi, A., Coviello, V., Galletti, M., and Seifert, R. (2018). Short communication: monitoring rockfalls with the raspberry shake. Earth Surface Dyn. 6, 1219–1227. doi: 10.5194/esurf-6-1219-2018
Marcillo, O., Johnson, J. B., and Hart, D. (2012). Implementation, characterization, and evaluation of an inexpensive low-power low-noise infrasound sensor based on a micromachined differential pressure transducer and a mechanical filter. J. Atmos. Ocean. Technol. 29, 1275–1284. doi: 10.1175/JTECH-D-11-00101.1
Marty, J. (2019). The IMS Infrasound Network: Current Status and Technological Developments. Cham: Springer International Publishing.
McComb, K., Moss, C., Sayialel, S., and Baker, L. (2000). Unusually extensive networks of vocal recognition in african elephants. Anim. Behav. 59, 1103–1109. doi: 10.1006/anbe.2000.1406
McComb, K., Reby, D., Baker, L., Moss, C., and Sayialel, S. (2003). Long-distance communication of acoustic cues to social identity in African elephants. Anim. Behav. 65, 317–329. doi: 10.1006/anbe.2003.2047
Mortimer, B., Rees, W. L., Koelemeijer, P., and Nissen-Meyer, T. (2018). Classifying elephant behaviour through seismic vibrations. Curr. Biol. 28, R547–R548. doi: 10.1016/j.cub.2018.03.062
Narins, P. M., Stoeger, A. S., and O'Connell-Rodwell, C. (2016). Infrasonic and Seismic Communication in the Vertebrates With Special Emphasis on the Afrotheria: An Update and Future Directions, Vol. 53. Cham: Springer International Publishing.
O'Connell-Rodwell, C. E. (2007). Keeping an “ear” to the ground: seismic communication in elephants. Physiology 22, 287–294. doi: 10.1152/physiol.00008.2007
O'Connell-Rodwell, C. E., Wood, J. D., Kinzley, C., Rodwell, T. C., Poole, J. H., and Puria, S. (2007). Wild African elephants (Loxodonta africana) discriminate between familiar and unfamiliar conspecific seismic alarm calls. J. Acoust. Soc. Am. 122, 823–830. doi: 10.1121/1.2747161
O'Connell-Rodwell, C. E., Wood, J. D., Rodwell, T. C., Puria, S., Partan, S. R., Keefe, R., et al. (2006). Wild elephant (Loxodonta africana) breeding herds respond to artificially transmitted seismic stimuli. Behav. Ecol. Sociobiol. 59, 842–850. doi: 10.1007/s00265-005-0136-2
Payne, K. B., Thompson, M., and Kramer, L. (2003). Elephant calling patterns as indicators of group size and composition: the basis for an acoustic monitoring system. Afr. J. Ecol. 41, 99–107. doi: 10.1046/j.1365-2028.2003.00421.x
Poole, J. H., Payne, K., Langbauer, W. Jr, and Moss, C. (1988). The social contexts of some very low frequency calls of african elephants. Behav. Ecol. Sociobiol. 22, 385–392.
Soltis, J. (2009). Vocal communication in african elephants (Loxodonta africana). Zoo Biol. 29, 192–209. doi: 10.1002/zoo.20251
Stoeger, A. S., and Baotic, A. (2016). Information content and acoustic structure of male african elephant social rumbles. Sci. Rep. 6:27585. doi: 10.1038/srep27585
Stoeger, A. S., Zeppelzauer, M., and Baotic, A. (2014). Age-group estimation in free-ranging african elephants based on acoustic cues of low-frequency rumbles. Bioacoustics 23, 231–246. doi: 10.1080/09524622.2014.888375
Tetzner, D., Thomas, E., and Allen, C. (2019). A validation of ERA5 reanalysis data in the Southern Antarctic Peninsula-Ellsworth Land Region, and its implications for ice core studies. Geosciences 9:289. doi: 10.3390/geosciences9070289
Thompson, M. E., Schwager, S. J., and Payne, K. B. (2010a). Heard but not seen: an acoustic survey of the African forest elephant population at Kakum Conservation Area, Ghana. Afr. J. Ecol. 48, 224–231. doi: 10.1111/j.1365-2028.2009.01106.x
Thompson, M. E., Schwager, S. J., Payne, K. B., and Turkalo, A. K. (2010b). Acoustic estimation of wildlife abundance: methodology for vocal mammals in forested habitats. Afr. J. Ecol. 48, 654–661. doi: 10.1111/j.1365-2028.2009.01161.x
Virtanen, P., Gommers, R., Oliphant, T. E., Haberland, M., Reddy, T., Cournapeau, D., et al. (2020). SciPy 1.0: fundamental algorithms for scientific computing in Python. Nat. Methods 17, 261–272. doi: 10.1038/s41592-019-0686-2
Wrege, P. H., Rowland, E. D., Thompson, B. G., and Batruch, N. (2010). Use of acoustic tools to reveal otherwise cryptic responses of forest elephants to oil exploration: acoustic tools reveal cryptic effects. Conserv. Biol. 24, 1578–1585. doi: 10.1111/j.1523-1739.2010.01559.x
Keywords: seismic, Loxodonta africana, Raspberry Pi, acoustic, wildlife monitoring
Citation: Lamb OD, Shore MJ, Lees JM, Lee SJ and Hensman SM (2021) Assessing Raspberry Shake and Boom Sensors for Recording African Elephant Acoustic Vocalizations. Front. Conserv. Sci. 1:630967. doi: 10.3389/fcosc.2020.630967
Received: 18 November 2020; Accepted: 30 December 2020;
Published: 26 January 2021.
Edited by:
William J. McShea, Smithsonian Conservation Biology Institute (SI), United StatesReviewed by:
Peter Wrege, Cornell University, United StatesDavid Andrew Luther, George Mason University, United States
Copyright © 2021 Lamb, Shore, Lees, Lee and Hensman. This is an open-access article distributed under the terms of the Creative Commons Attribution License (CC BY). The use, distribution or reproduction in other forums is permitted, provided the original author(s) and the copyright owner(s) are credited and that the original publication in this journal is cited, in accordance with accepted academic practice. No use, distribution or reproduction is permitted which does not comply with these terms.
*Correspondence: Oliver D. Lamb, b2xhbWJAZW1haWwudW5jLmVkdQ==